


in Bearbeitung
Camille Bauer Metrawatt AG
http://www.camillebauer.com
Device handbook
CENTRAX CU3000 / CU5000
Operating Instructions CENTRAX CU3000 / CU5000 (2018-11)
Aargauerstrasse 7
CH-5610 Wohlen / Switzerland
Phone: +41 56 6 18 21 11
Telefax: +4 1 56 618 35 35
E-Mail: info@cbmag.com

Legal information
Warning notices
In this document warning notices are used, which you have to observe to ensure personal safety and to prevent
damage to property. Depending on the degree of danger the following symbols are used:
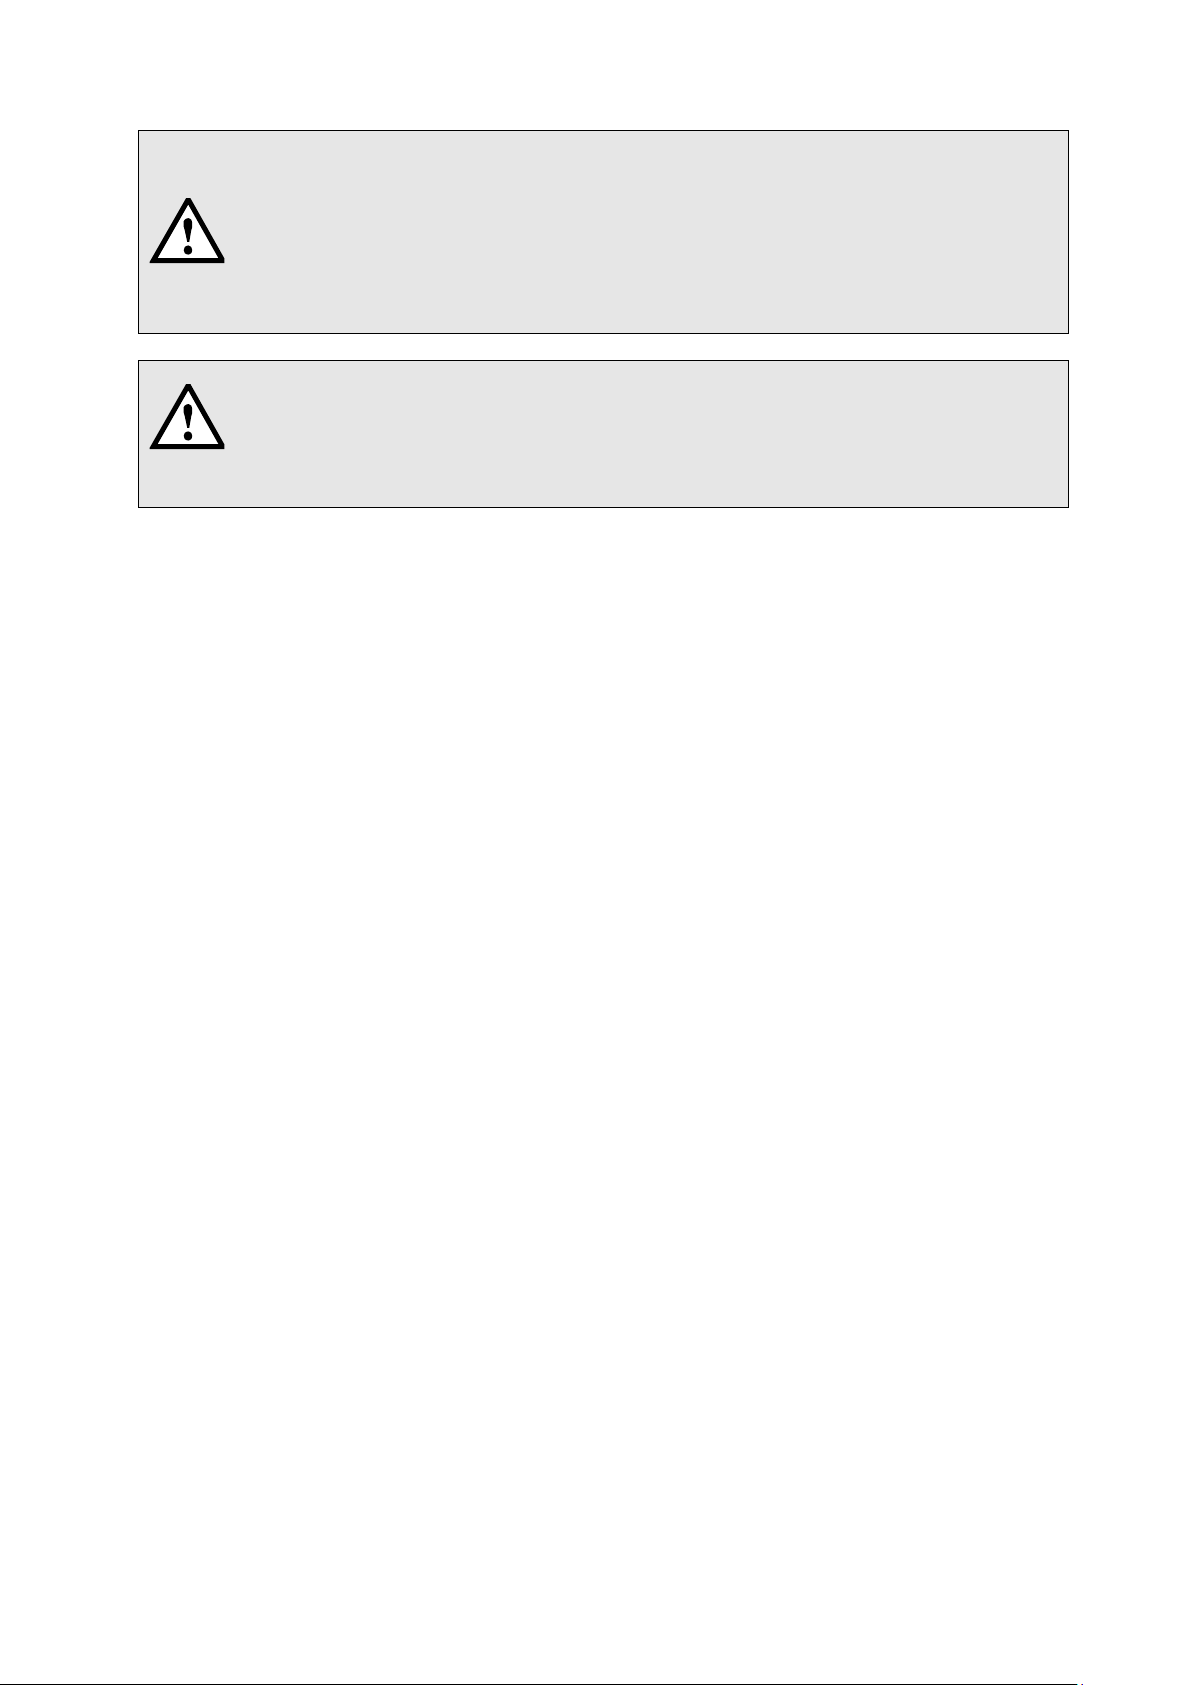
If the warning notice is not followed death or severe personal injury
will result.
If the warning notice is not followed damage to property or severe
personal injury may result.
If the warning notice is not followed the device may be damaged or
may not fulfill the expected functionality.
Qualified personnel
The product described in this document may be handled by personnel only, which is qualified for the respective
task. Qualified personnel have the training and experience to identify risks and potential hazards when working
with the product. Qualified pers onn el are als o able to understand and follow the given safety and warning
notices.
Intended use
The product described in this document may be used only for the application specified. The maximum electrical
supply data and ambient conditions specified in the technical data section must be adhered. For the perfect and
safe operation of the device proper transport and storage as well as professional assembly, installation,
handling and maintenance are required.
Disclaimer of liability
The content of this document has been reviewed to ensure correctness. Nevertheless it may contain errors or
inconsistencies and we cannot guarantee completeness and correctness. This is especially true for different
language versions of this document. This document is regularly reviewed and updated. Necessary corrections
will be included in subsequent version and are available via our webpa ge http://www.camillebauer.com
Feedback
If you detect errors in this document or if there is necessary information missing, please inform us via e-mail to:
customer-support@camillebauer.com
.
PM 1001606 000 07 Device handbook CENTRAX CU3000-CU5000 2/106

Contents
1. Introduction .................................................................................................................................................... 5
1.1 Purpose of this document .......................................................................................................................... 5
1.2 Scope of supply ......................................................................................................................................... 5
1.3 Further documents ..................................................................................................................................... 5
2. Safety notes .................................................................................................................................................... 6
3. Device overview ............................................................................................................................................. 6
3.1 Brief description ......................................................................................................................................... 6
3.2 Available measurement data ..................................................................................................................... 6
4. Mechanical mounting .................................................................................................................................... 7
4.1 CENTRAX CU3000 ................................................................................................................................... 7
4.2 CENTRAX CU5000 ................................................................................................................................... 8
5. Electrical connections ................................................................................................................................... 9
5.1 General safety notes.................................................................................................................................. 9
5.2 Terminal assignments of the I/O extensions ...........................................................................................10
5.2.1 CENTRAX CU3000 .........................................................................................................................10
5.2.2 CENTRAX CU5000 .........................................................................................................................11
5.3 Possible cross sections and tightening torques ......................................................................................11
5.4 Inputs .......................................................................................................................................................12
5.5 Power supply ...........................................................................................................................................24
5.6 Relays ......................................................................................................................................................24
5.7 Digital inputs ............................................................................................................................................24
5.8 Digital outputs ..........................................................................................................................................25
5.9 Analog outputs .........................................................................................................................................26
5.10 Fault current detection .............................................................................................................................27
5.11 Modbus interface RS485 ..........................................................................................................................29
5.12 Uninterruptible power supply (UPS) ........................................................................................................29
5.13 GPS time synchronization ........................................................................................................................30
6. Commissioning ............................................................................................................................................32
6.1 Parametrization of the device functionality ..............................................................................................33
6.2 Operating LED (CU5000 only) .................................................................................................................33
6.3 Installation check .....................................................................................................................................33
6.4 Ethernet installation .................................................................................................................................35
6.4.1 Settings ...........................................................................................................................................35
6.4.2 Connection of the standard interface ..............................................................................................37
6.4.3 Connection of the IEC61850 interface ............................................................................................38
6.4.4 MAC addresses ..............................................................................................................................38
6.4.5 Communication tests ......................................................................................................................38
6.4.6 Resetting the communication settings of the CU5000 ....................................................................39
6.5 Protection against device dat a chang ing .................................................................................................39
7. Operating the device ....................................................................................................................................40
7.1 Operating elements .................................................................................................................................40
7.2 Selecting the information to display .........................................................................................................40
7.3 Measurement displays and used symbols ..............................................................................................41
7.4 Resetting measurement data ..................................................................................................................43
7.5 Configuration ...........................................................................................................................................43
7.5.1 Configuration at the device ................................................................................................................43
7.5.2 Configuration via web browser ..........................................................................................................44
7.6 Monitoring fault-currents ..........................................................................................................................46
7.7 Data recording .........................................................................................................................................48
7.7.1 Periodical data ................................................................................................................................48
7.7.2 Events .............................................................................................................................................51
7.7.3 Disturbance recorder ......................................................................................................................52
7.7.4 Micro SD card (CU3000 only) .........................................................................................................54
7.8 Timeouts ..................................................................................................................................................55
8. CODESYS Quick Start .................................................................................................................................56
PM 1001606 000 07 Device handbook CENTRAX CU3000-CU5000 3/106

8.1 CODESYS development environment .................................................................................................... 56
8.2 CENTRAX device description ................................................................................................................. 56
8.3 Create a project ...................................................................................................................................... 57
8.4 CU3000/CU5000 Device tree ................................................................................................................. 58
8.5 Selection of the I/O extension modules .................................................................................................. 58
8.6 Using the Modbus master functionality ................................................................................................... 59
8.7 Creating the CODESYS application ....................................................................................................... 63
8.7.1 Using remanent variables .................................................................................................................. 63
8.7.2 Using the data logger ......................................................................................................................... 63
8.8 Creating own visualizations .................................................................................................................... 65
8.8.1 Adding a visualization to the project ................................................................................................ 65
8.8.2 Target visualization (TargetVisu) .................................................................................................... 65
8.8.3 WEB visualizations (WebVisu) ........................................................................................................ 66
8.9 Establishing a connection to the device ................................................................................................. 67
8.10 Loading the application to the device ...................................................................................................... 68
8.11 Loading the application on-site................................................................................................................ 71
8.11.1 Creating a boot application ............................................................................................................. 71
8.11.2 Deleting the active application ........................................................................................................ 71
8.11.3 Loading the application ................................................................................................................... 71
8.11.4 Starting the app lic a tio n .................................................................................................................... 72
8.11.5 Resetting the active application ...................................................................................................... 72
8.12 Reset ...................................................................................................................................................... 73
8.13 Project management ............................................................................................................................... 74
8.14 Services .................................................................................................................................................. 74
8.13 Example projects .................................................................................................................................... 74
9. Service, maintenance and disposal .......................................................................................................... 75
9.1 Calibration and new adjustment ............................................................................................................. 75
9.2 Cleaning .................................................................................................................................................. 75
9.3 Battery ..................................................................................................................................................... 75
9.4 Disposal .................................................................................................................................................. 75
10. Technical data ............................................................................................................................................. 76
11. Dimensional drawings ................................................................................................................................ 82
Annex .................................................................................................................................................................. 83
A Description of measured quantities .......................................................................................................... 83
A1 Basic measurements .............................................................................................................................. 83
A2 Harmonic analysis .................................................................................................................................. 87
A3 System imbalance .................................................................................................................................. 88
A4 Mean values and trend ........................................................................................................................... 89
A5 Meters ..................................................................................................................................................... 90
B Display matrices .......................................................................................................................................... 91
B0 Used abbreviations for the measurements ............................................................................................. 91
B1 Display matrices for single phase system .............................................................................................. 95
B2 Display matrices for split-phase (two-phase) systems ........................................................................... 96
B3 Display matrices for 3-wire system, balanced load ................................................................................ 97
B4 Display matrices for 3-wire system, balanced load, phase shift ............................................................. 98
B5 Display matrices for 3-wire systems, unbalanced loa d .......................................................................... 99
B6 Display matrices for 3-wire systems, unbalanced load, Aron ............................................................... 100
B7 Display matrices for 4-wire system, balanced load .............................................................................. 101
B8 Display matrices for 4-wire systems, unbalanced loa d ........................................................................ 102
B8 Display matrices for 4-wire system, unbalanced lo ad, O pen-Y ............................................................ 103
C Logic functions .......................................................................................................................................... 104
D FCC statement ........................................................................................................................................... 105
INDEX ................................................................................................................................................................ 106
PM 1001606 000 07 Device handbook CENTRAX CU3000-CU5000 4/106

1. Introduction
1.1 Purpose of this document
This document describes the universal measurement device for heavy-current quantities CENTRAX
CU3000 / CU5000. It is intended to be used by:
• Installation personnel and commissioning engineers
• Service and maintenance personnel
• Planners
Scope
This handbook is valid for all hardware versions of the CU3000 / CU5000. Some of the functions
described in this document are available only, if the necessary optional components are included in the
device.
Required knowledge
A general knowledge in the field of electrical engineering is required. For assembly and installation of the
device knowledge of applicable national safety regulations and installation standard is required.
1.2 Scope of supply
• Measurement device
• Safety instructions (multiple languages)
• Mounting set: 2 mounting clamps (CU3000 only)
• Battery pack (optional, for devices with UPS only)
1.3 Further documents
The following documents are provided el ec tronic a lly via http://www.camillebauer.com/cu3000-en or
http://www.camillebauer.com/cu5000-en :
• Safety instructions
• Data sheet
• Modbus basics: General description of the communication protocol
• Modbus interface CENTRAX CUx000: Register description of Modbus RTU/TCP communication
• IEC61850 interface SINEAX AMx000/DM5000, LINAX PQx000, CENTRAX CUx000
PM 1001606 000 07 Device handbook CENTRAX CU3000-CU5000 5/106

2. Safety notes
Device may only be disposed in a professiona l manner!
The installation and commissioning should only be carried out by trained personnel.
Check the following points before commissioning:
– that the maximum values for all the connections are not exceeded, see "Technical data"
section,
– that the connection wires are not damaged, and that they are not live during wiring,
– that the power flow direction and the phase rotation are correct.
The instrument must be taken out of service if safe operation is no longer possible (e.g. visible
damage). In this case, all the connections must be switched off. The instrument must be
returned to the factory or to an authorized service dealer.
It is forbidden to open the housing and to make modifications to the instrument. The instrument
is not equipped with an integrated circuit breaker. During installation check that a labeled switch
is installed and that it can easily be reached by the operators.
Unauthorized repair or alteration of the unit invalidates the warranty.
3. Device overview
3.1 Brief description
The CENTRAX CU3000/CU5000 is a com pr ehens ive ins trument for the universal measurement and
monitoring in power systems , supplemented by a freely programmable control application based on
CODESYS. A full parameterization of all functions of the device is possible directly at the device (for
versions with display) or via web browser. The control application is created using the CODESYS
development environment, can access all measurement data of the device, process these values logically
and mathematically and pass the results via bus or analog or digital outputs.
Using additional, optional components the opportunities of the device may be extended. You may choose
from I/O extensions, communication interfaces and data logging. The PLC functionality is available in
three performance classes. The nameplates on the device give further details about the present version.
3.2 Available measurement data
The device provides measurements in the following subcategories:
a) Instantaneous values: Present TRMS values and associated min/max values
b) Energy: Power mean-values with trend and history as well as energy meters. With the data logger
option “periodical data” mean-value progressions (load profiles) and periodical meter readings are
available as well.
c) Harmonics: Total harmonic distortion THD/TDD, individual harmonics and their maximum values
d) Phasor diagram: Overview of all current and voltage phasors and phase sequence check
e) Waveform of current and voltage inputs
f) Events: Disturbance recordings if the corresponding option is implemented.
PM 1001606 000 07 Device handbook CENTRAX CU3000-CU5000 6/106
4. Mechanical mounti ng
Please ensure that the operating temperature limits are not exceeded when
determining the place of mounting (place of measurement).
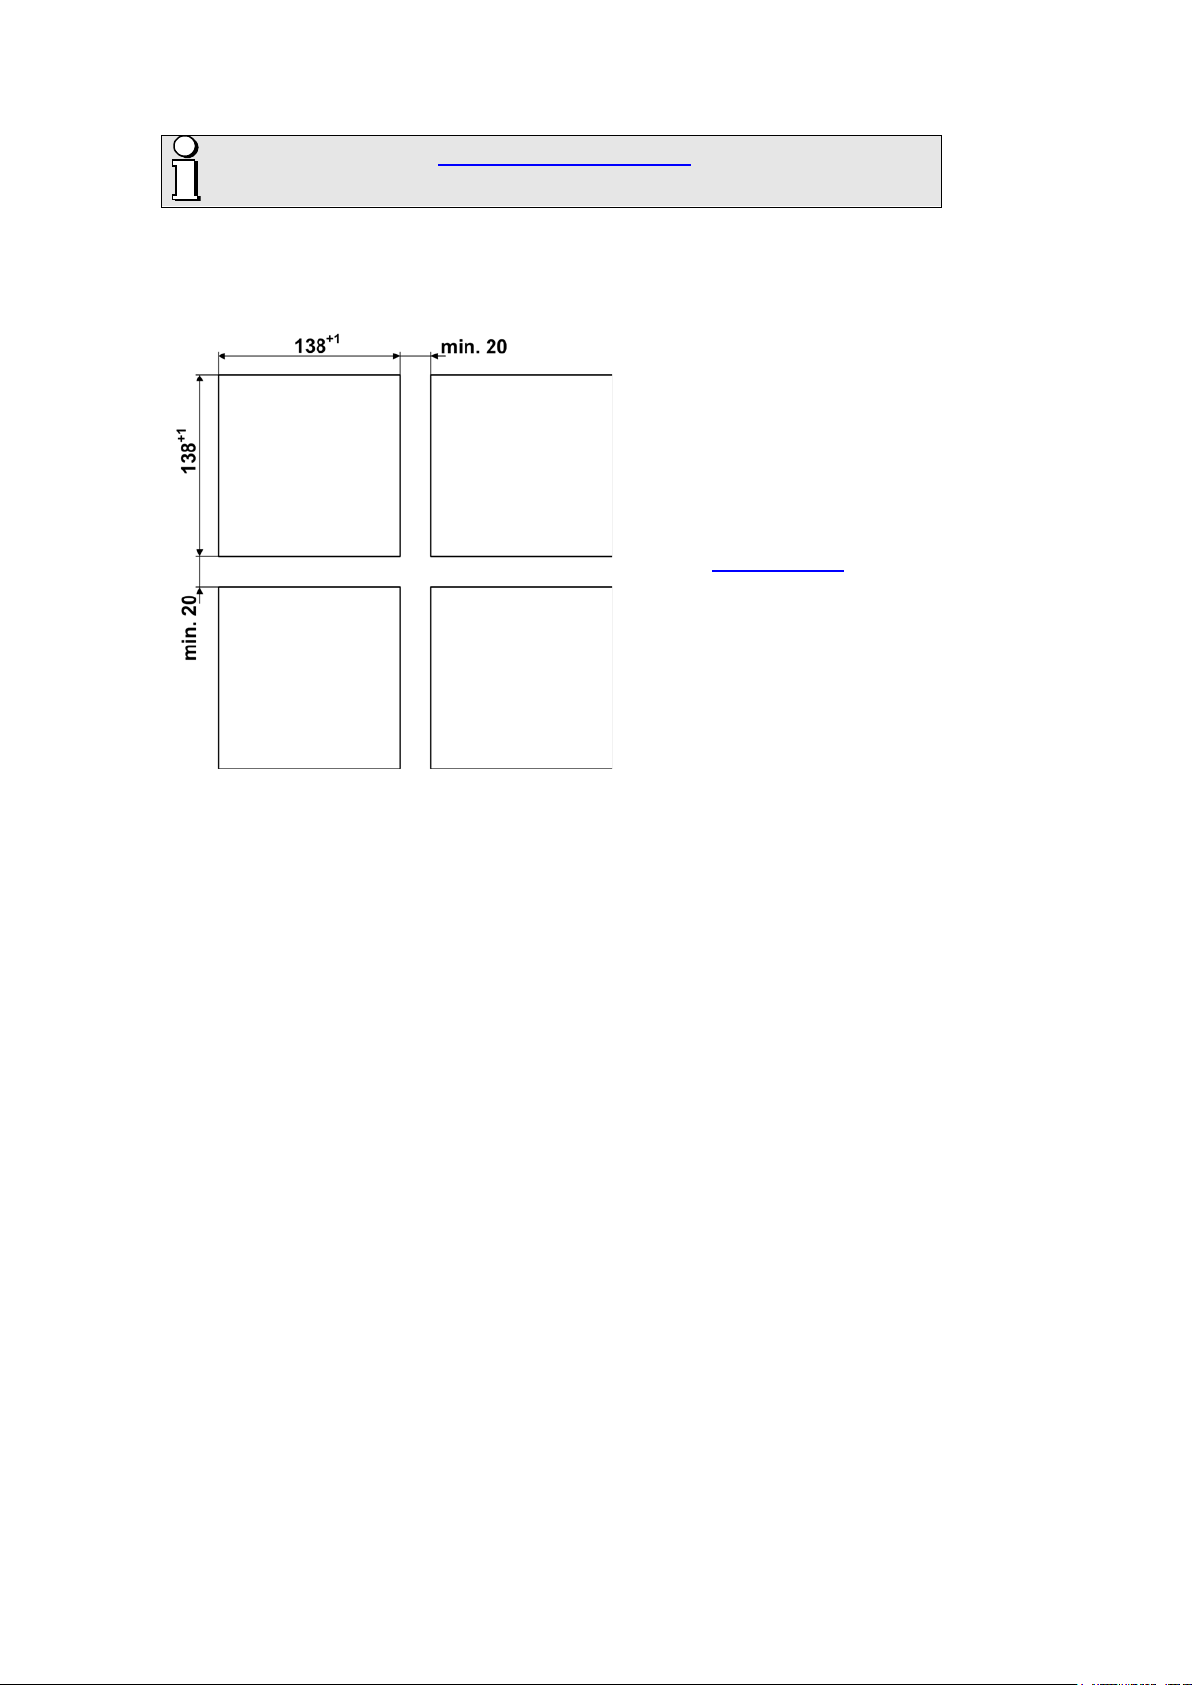
4.1 CENTRAX CU3000
► The CU3000 is designed for panel mounting
Dimensional drawing CU3000:
See section 11
Panel cutout CU3000
Mounting of the device
The device is suitable for panel widths up to 8mm.
a) Slide the device into the cutout from
the outside
b) From the side slide in the mounting
clamps into the intended openings and
pull them back about 2 mm
c) Tighten the fixation screws until the
device is tightly fixed with the panel
Demounting of the device
The demounting of the device may be performed only if all connected wires are out of service. Remove all
plug-in terminals and all connections of the current and voltage inputs. Pay attention to the fact, that
current transformers must be shortened before removing the current connections to the device. Then
demount the device in the opposite order of mounting.
PM 1001606 000 07 Device handbook CENTRAX CU3000-CU5000 7/106

4.2 CE NT RAX CU5000
The device can be clipped onto a top-hat rail according to EN 60715.
Dimensional drawing CU5000: See section 11
PM 1001606 000 07 Device handbook CENTRAX CU3000-CU5000 8/106
5. Electrical connections
Ensure under all circumstances that the leads are free of potential
when connecting them!
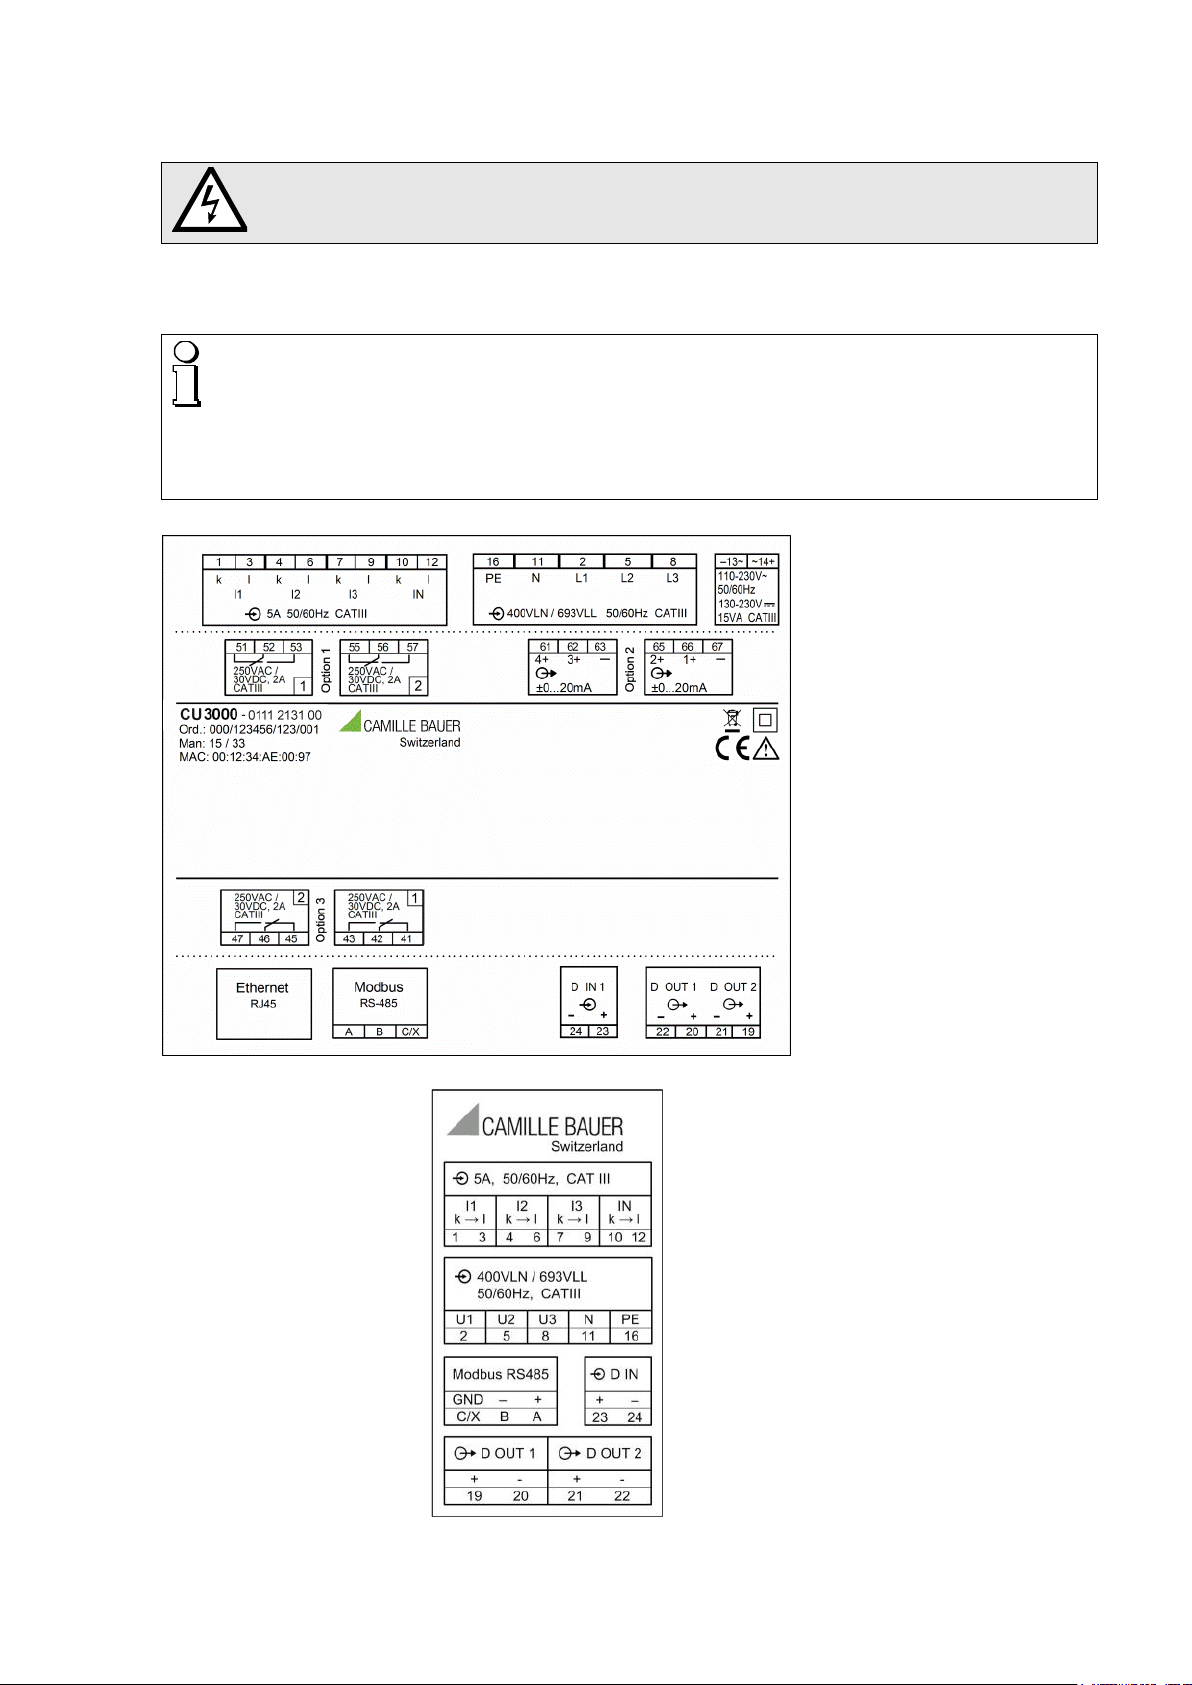
5.1 General safety notes
Please observe that the data on the type plate must be adhered to!
The national provisions have to be observed in the installation and material selection of electric lines,
e.g. in Germany VDE 0100 “Conditions concerning the erection of heavy current facilities with rated
voltages below 1000 V”!
Nameplate of a CU3000 with
• Ethernet interface
• Modbus/RTU interface
• 4 relay outputs
• 4 analog outputs
Nameplate of a CU5000 with
• TFT display
• Ethernet interface
• Modbus/RTU interface
• 2 relay outputs
• 4 analog outputs
• UPS
PM 1001606 000 07 Device handbook CENTRAX CU3000-CU5000 9/106
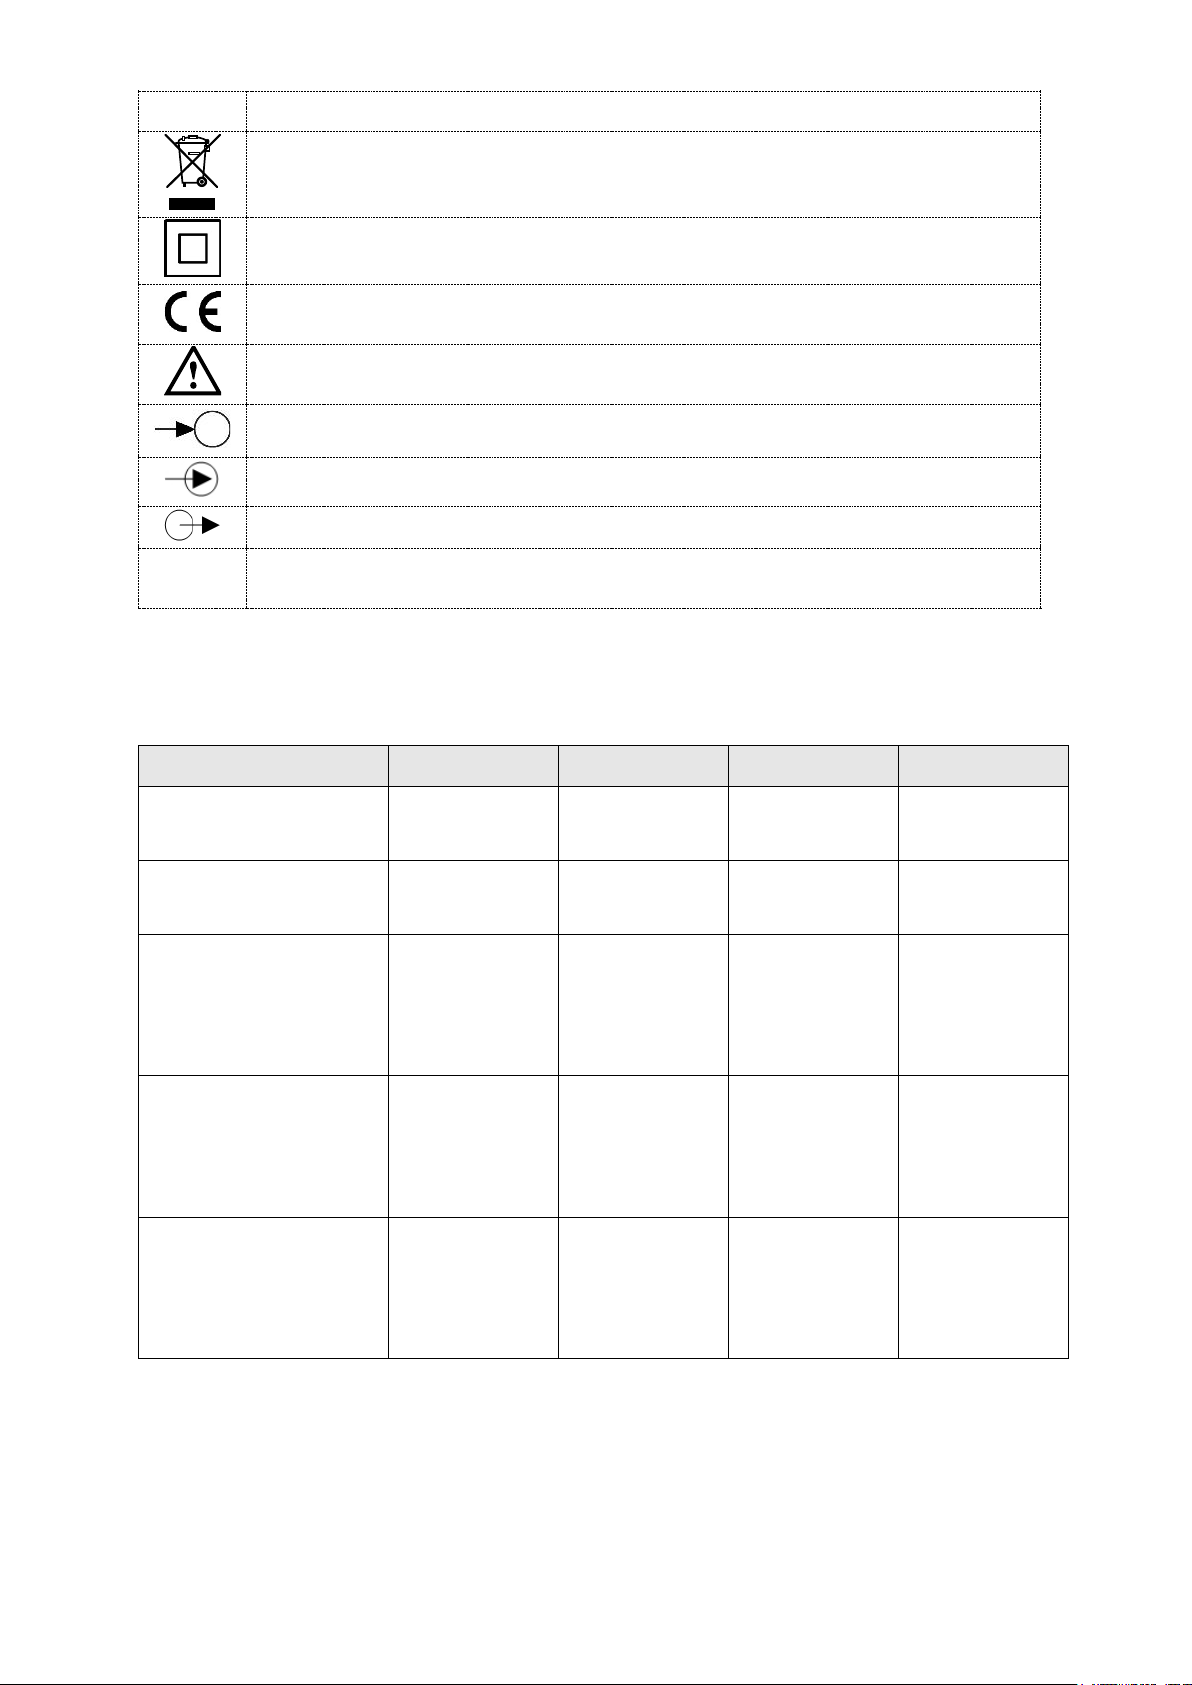
Symbol Meaning
CE conformity mark. The device fulfills the requirements of the applicable EU
Measurement category CAT III for current / voltage inputs, power supply and relay
Device may only be disposed of in a professional manner!
Double insulation, device of protection class 2
directives.
Caution! General hazard point. Read the operating instructions.
General symbol: Power supply
General symbol: Input
General symbol: Output
CAT III
outputs
5.2 Terminal assignments of the I/O extensions
5.2.1 CENTRAX CU3000 Function Option 1 Option 2 Option 3 Option 4
2 relay outputs
1.1: 51,52,53
1.2: 55,56,57
1.1: 56(+), 57(-)
2 analog outputs
1.2: 55(+), 57(-)
1.1: 56(+), 57(-)
1.2: 55(+), 57(-)
4 analog outputs
1.3: 52(+), 53(-)
1.4: 51(+), 53(-)
1.1: 51(-), 53(+)
1.2: 52(-), 53(+)
4 digital inputs (active)
1.3: 55(-), 57(+)
1.4: 56(-), 57(+)
2.1: 61,62,63
2.2: 65,66,67
2.1: 66(+), 67(-)
2.2: 65(+), 67(-)
2.1: 66(+), 67(-)
2.2: 65(+), 67(-)
2.3: 62(+), 63(-)
2.4: 61(+), 63(-)
2.1: 61(-), 63(+)
2.2: 62(-), 63(+)
2.3: 65(-), 67(+)
2.4: 66(-), 67(+)
3.1: 41,42,43
3.2: 45,46,47
3.1: 46(+), 47(-)
3.2: 45(+), 47(-)
3.1: 46(+), 47(-)
3.2: 45(+), 47(-)
3.3: 42(+), 43(-)
3.4: 41(+), 43(-)
3.1: 41(-), 43(+)
3.2: 42(-), 43(+)
3.3: 45(-), 47(+)
3.4: 46(-), 47(+)
4.1: 31,32,33
4.2: 35,36,37
4.1: 36(+), 37(-)
4.2: 35(+), 37(-)
4.1: 36(+), 37(-)
4.2: 35(+), 37(-)
4.3: 32(+), 33(-)
4.4: 31(+), 33(-)
4.1: 31(-), 33(+)
4.2: 32(-), 33(+)
4.3: 35(-), 37(+)
4.4: 36(-), 37(+)
1.1: 51(+), 53(-)
1.2: 52(+), 53(-)
4 digital inputs (passive)
1.3: 55(+), 57(-)
1.4: 56(+), 57(-)
2.1: 61(+), 63(-)
2.2: 62(+), 63(-)
2.3: 65(+), 67(-)
2.4: 66(+), 67(-)
PM 1001606 000 07 Device handbook CENTRAX CU3000-CU5000 10/106
3.1: 41(+), 43(-)
3.2: 42(+), 43(-)
3.3: 45(+), 47(-)
3.4: 46(+), 47(-)
4.1: 31(+), 33(-)
4.2: 32(+), 33(-)
4.3: 35(+), 37(-)
4.4: 36(+), 37(-)

5.2.2 CENTRAX CU5000
Inputs L1(2), L2(5), L3(8), N(11), PE(16), I1(1-3), I2(4-6), I3(7-9) , IN(10-12), power supply (13-14)
I/O's, relays, RS485 connector (A, B, C/X)
Function Option 1 Option 2
2 relay outputs
2 analog outputs
4 analog outputs
4 digital inputs (active)
4 digital inputs (passive)
1.1: X1.1 / X1.2 / X1.3
1.2: X2.1 / X2.2 / X2.3
1.1: X2.2(+) / X2. 3(-)
1.2: X2.1(+) / X2. 3(-)
1.1: X2.2(+) / X2.3(-)
1.2: X2.1(+) / X2.3(-)
1.3: X1.2(+) / X1.3(-)
1.4: X1.1(+) / X1.3(-)
1.1: X1.1(-) / X1.3(+)
1.2: X1.2(-) / X1.3(+)
1.3: X2.1(-) / X2.3(+)
1.4: X2.2(-) / X2.3(+)
1.1: X1.1(+) / X1.3(-)
1.2: X1.2(+) / X1.3(-)
1.3: X2.1(+) / X2.3(-)
1.4: X2.2(+) / X2.3(-)
2.1: X3.1 / X3.2 / X3.3
2.2: X4.1 / X4.2 / X4.3
2.1: X4.2(+) / X4.3 (-)
2.2: X4.1(+) / X4.3 (-)
2.1: X4.2(+) / X4.3(-)
2.2: X4.1(+) / X4.3(-)
2.3: X3.2(+) / X3.3(-)
2.4: X3.1(+) / X3.3(-)
2.1: X3.1(-) / X3.3(+)
2.2: X3.2(-) / X3.3(+)
2.3: X4.1(-) / X4.3(+)
2.4: X4.2(-) / X4.3(+)
2.1: X3.1(+) / X3.3(-)
2.2: X3.2(+) / X3.3(-)
2.3: X4.1(+) / X4.3(-)
2.4: X4.2(+) / X4.3(-)
5.3 Possible cro ss secti ons and tightening torques
Single wire
1 x 0,5 ... 6.0mm2 or 2 x 0,5 ... 2.5mm
2
Multiwire with end splices
1 x 0,5 ... 4.0mm2 or 2 x 0,5 ... 2.5mm
2
Tightening torque
0.5…0.6Nm resp. 4.42…5.31 lbf in
Single wire
1 x 0.5 ... 2.5mm2 or 2 x 0.5 ... 1.0mm
2
Multiwire with end splices
1 x 0.5 ... 2.5mm2 or 2 x 0.5 ... 1.5mm
2
Tightening torque
0.5…0.6Nm resp. 4.42…5.31 lbf in
You may have to remove first the plug-in terminals to get access to the screw terminals of the current
inputs.
PM 1001606 000 07 Device handbook CENTRAX CU3000-CU5000 11/106
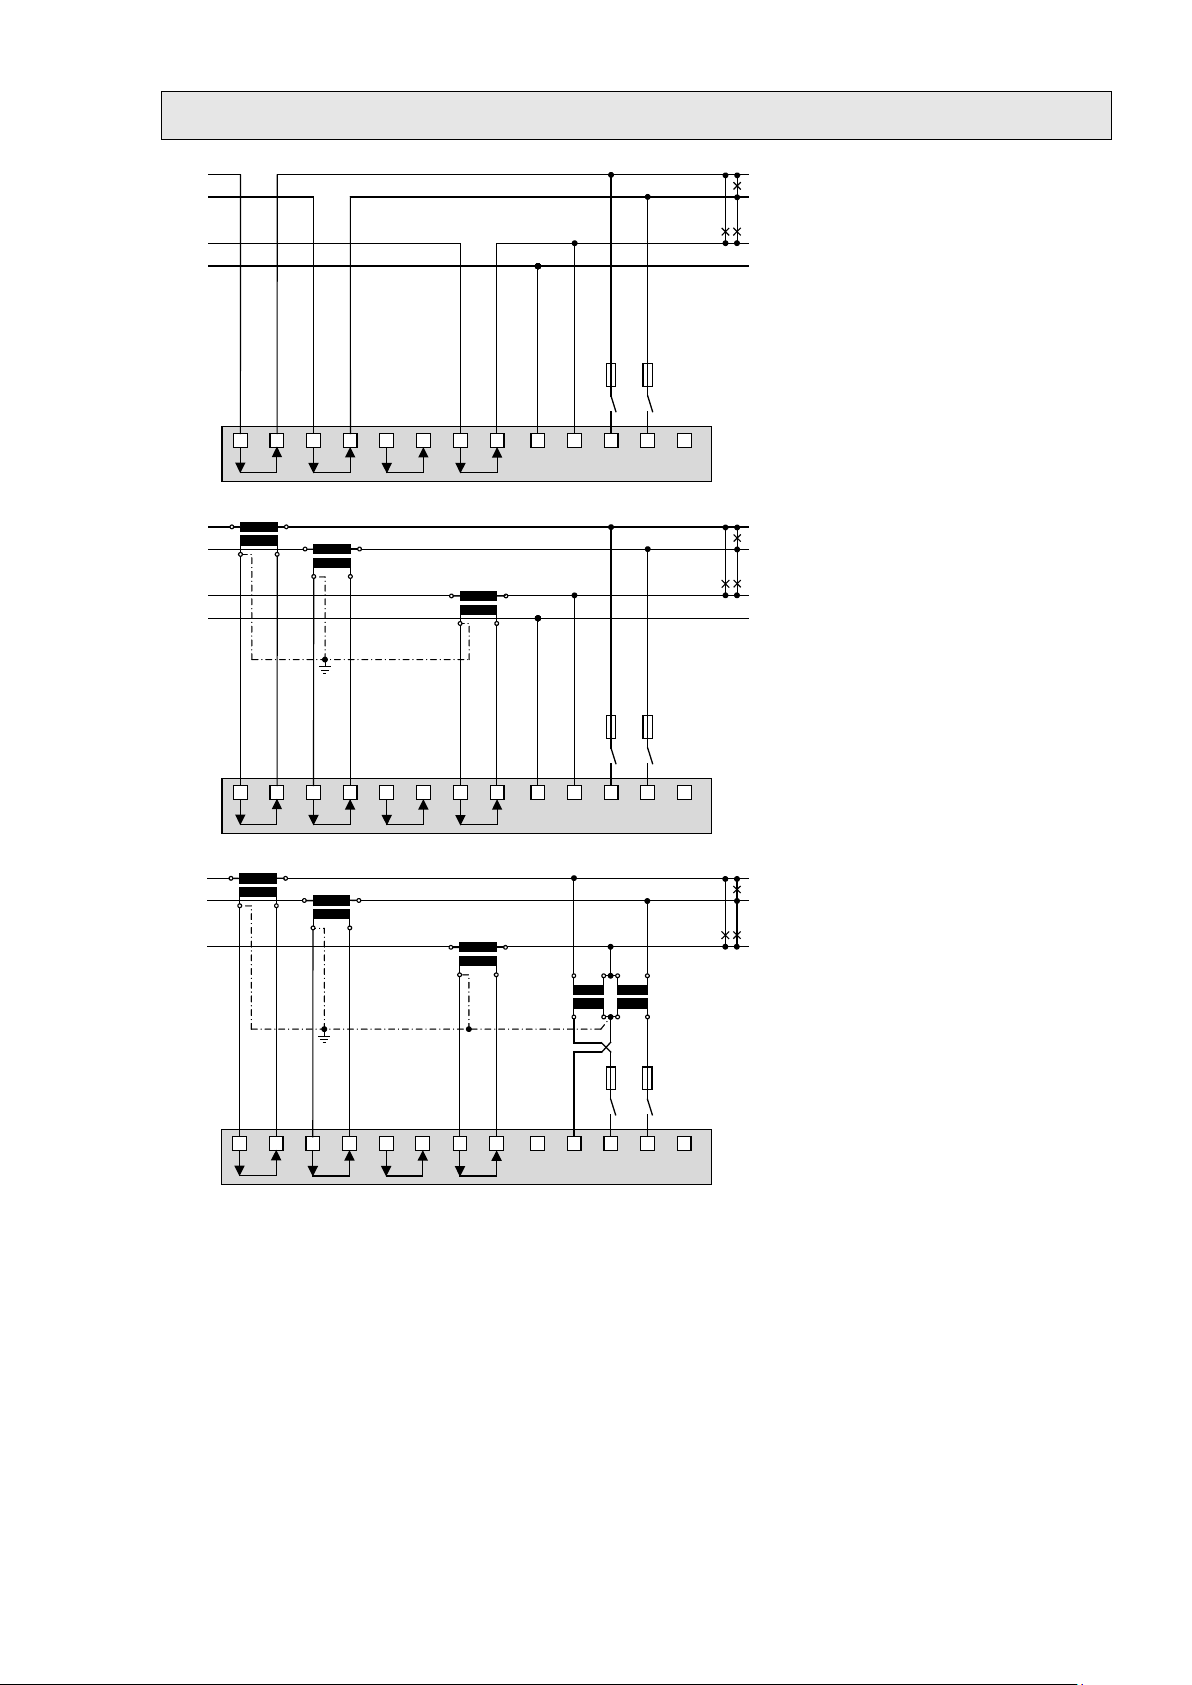
5.4 Inputs
All voltage measurement inputs must originate at circuit breakers or fuses rated 5 Amps or
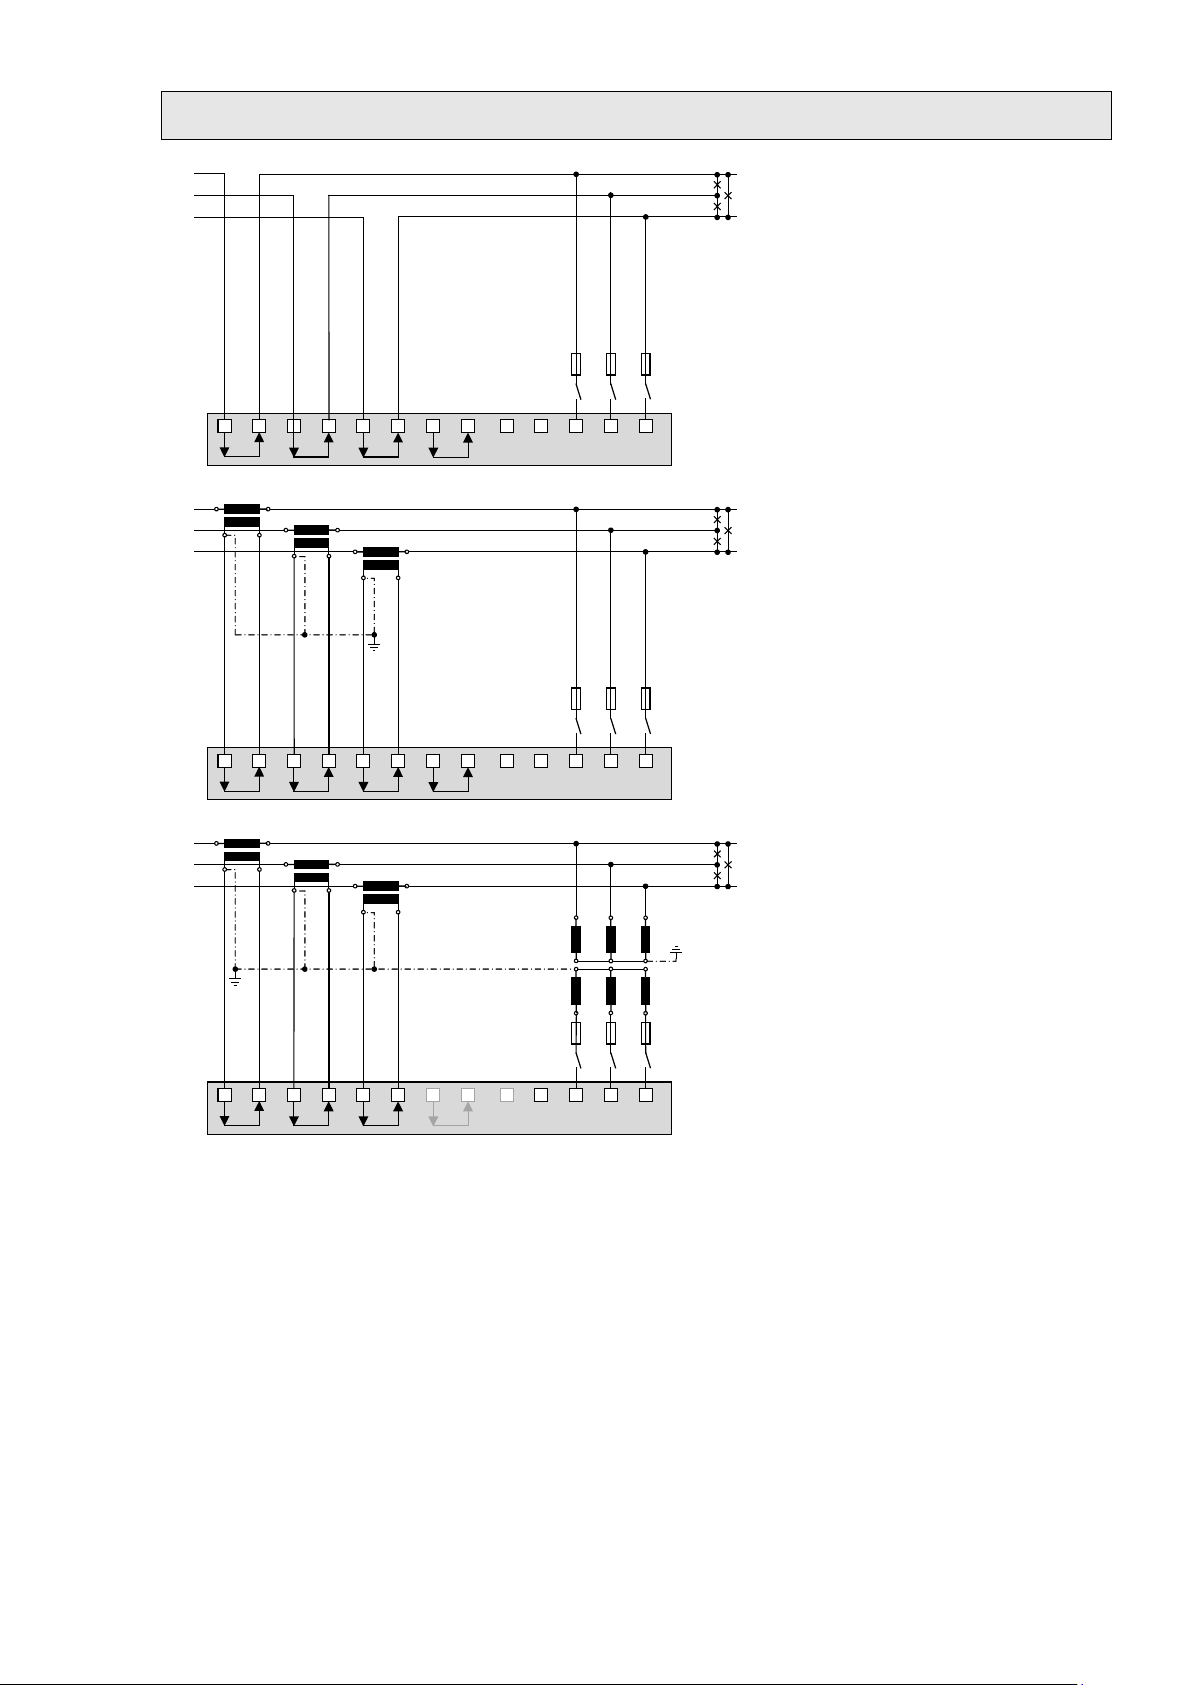
The connection of the inputs depends on the configured system (connection type).
less. This does not apply to the neutral connector. You have to provide a method for
manually removing power from the device, such as a clearly labeled circuit breaker or a
fused disconnect switch.
When using voltage transformers you have to ensure that their secondary connections
never will be short-circuited.
No fuse may be connected upstream of the current measurement inputs!
When using current transformers their secondary connectors must be short-circuited
during installation and before removing the device. Never open the secondary circuit under
load.
PM 1001606 000 07 Device handbook CENTRAX CU3000-CU5000 12/106

Single-phase AC mains
L1 L2 L3
N
I1
31
I2
4
I3
97
IN
PE
6
10 12 16
11 2 5 8
L1
N
5 A
(UL listed)
PE
L1 L2
L3
N
I1
31
I2
4
I3
97
IN
PE
6
10 12 16
11 2 5 8
L1
N
5 A
(
UL listed)
K
k
L
l
K
k
L
l
PE
L1
N
K
k
L
l
L1 L2 L3
N
I1
31
I2
4
I3
97
IN
PE
6
10 12 16
11 2 5 8
5 A
(UL listed)
PE
K
k
L
l
u
U
v
V
u
U
v
V
Direct connection
If current I
or voltage UNE does not need to be
N
measured, connection of IN resp. PE can be
omitted.
With current transformer
If current IN does not need to be measured, the
corresponding transformer can be omitted.
If voltage U
connection of PE can be omitted.
does not need to be measured,
NE
With current and voltage transformer
If current IN or voltage UNE does not need to be
measured, the corresponding transformers can be
omitted.
PM 1001606 000 07 Device handbook CENTRAX CU3000-CU5000 13/106

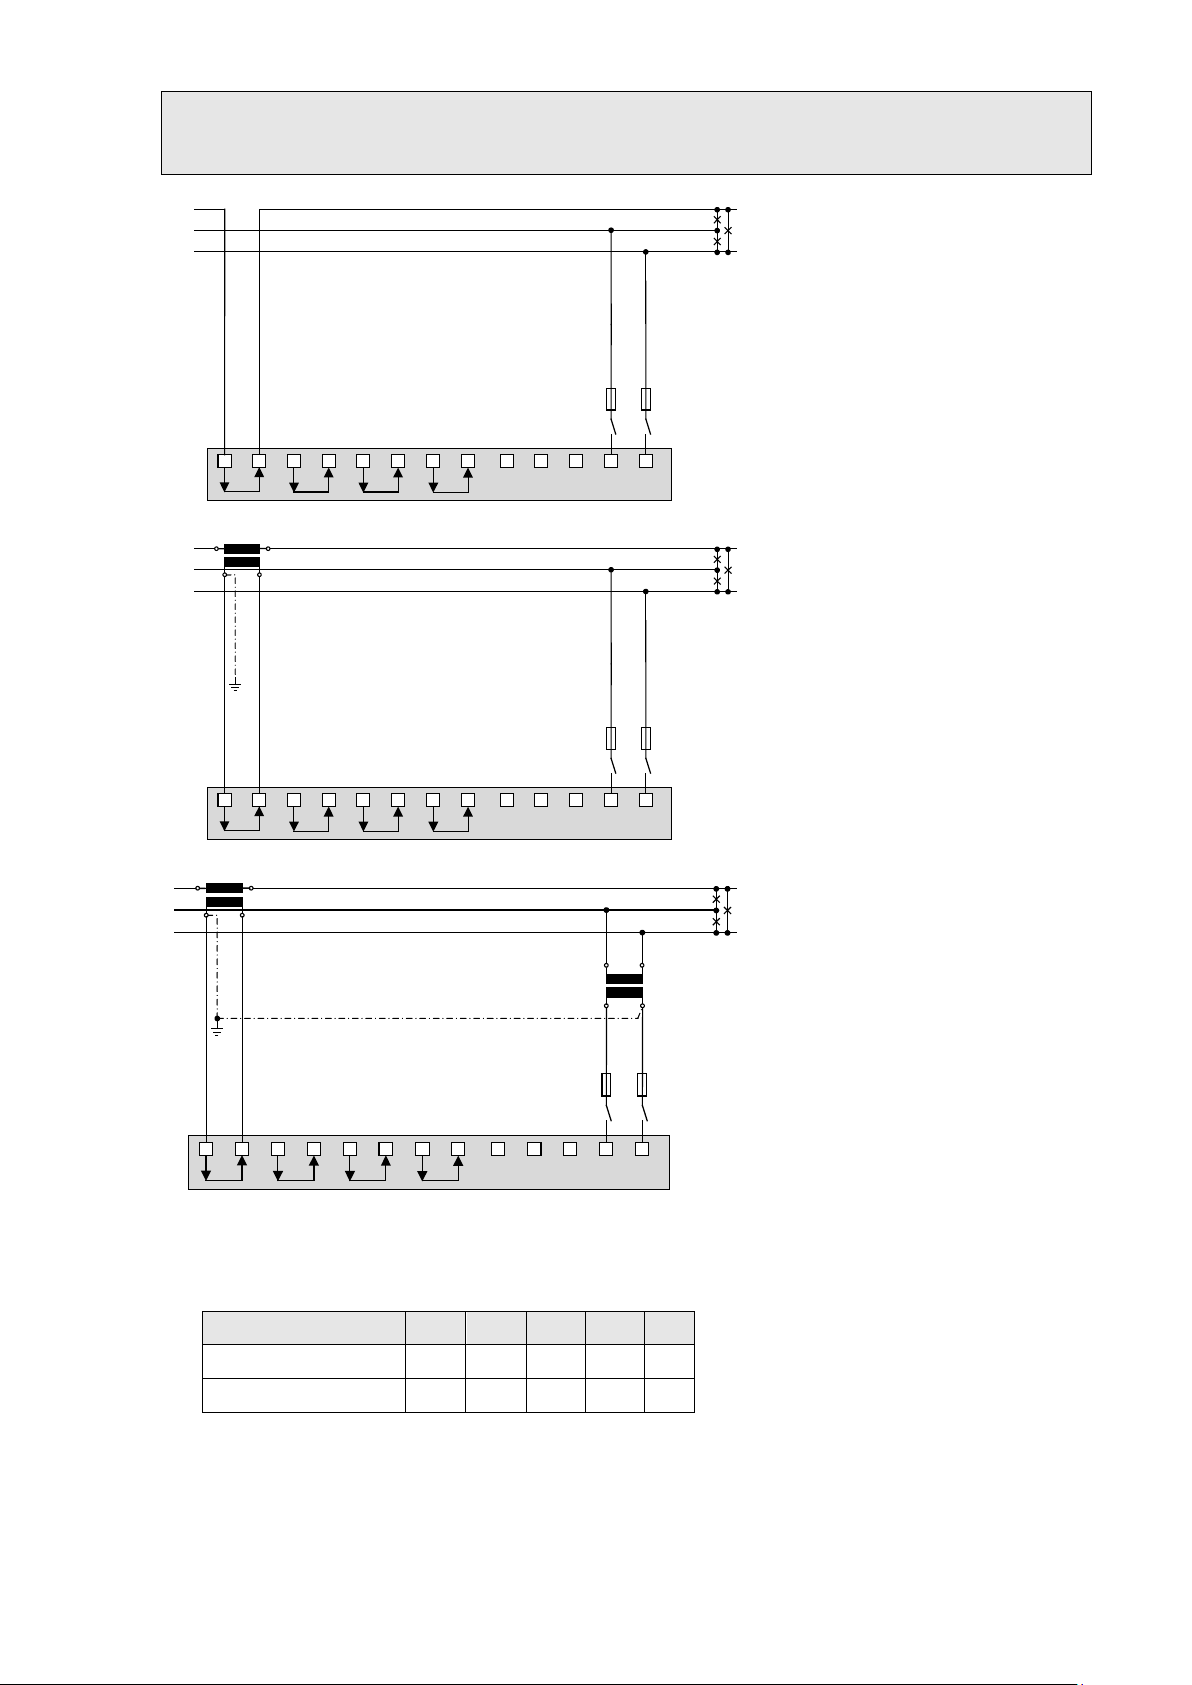
Three wire system, balanced load, phase shift
L1 L2 L3
N
I1
31
I2
4
I3
97
IN
PE
6
10 12 16
11 2 5 8
L1
L2
L3
5 A
(
UL listed)
L1 L2 L3
N
I1
31
I2
4
I3
97
IN
PE
6
10 12 16
11 2 5 8
L1
L2
L3
K
k
L
l
5 A
(UL listed)
L1 L2 L3
N
I1
31
I2
4
I3
97
IN
PE
6
10 12 16
11 2 5 8
L1
L2
L3
K
k
L
l
5 A
(UL listed)
u
U
v
V
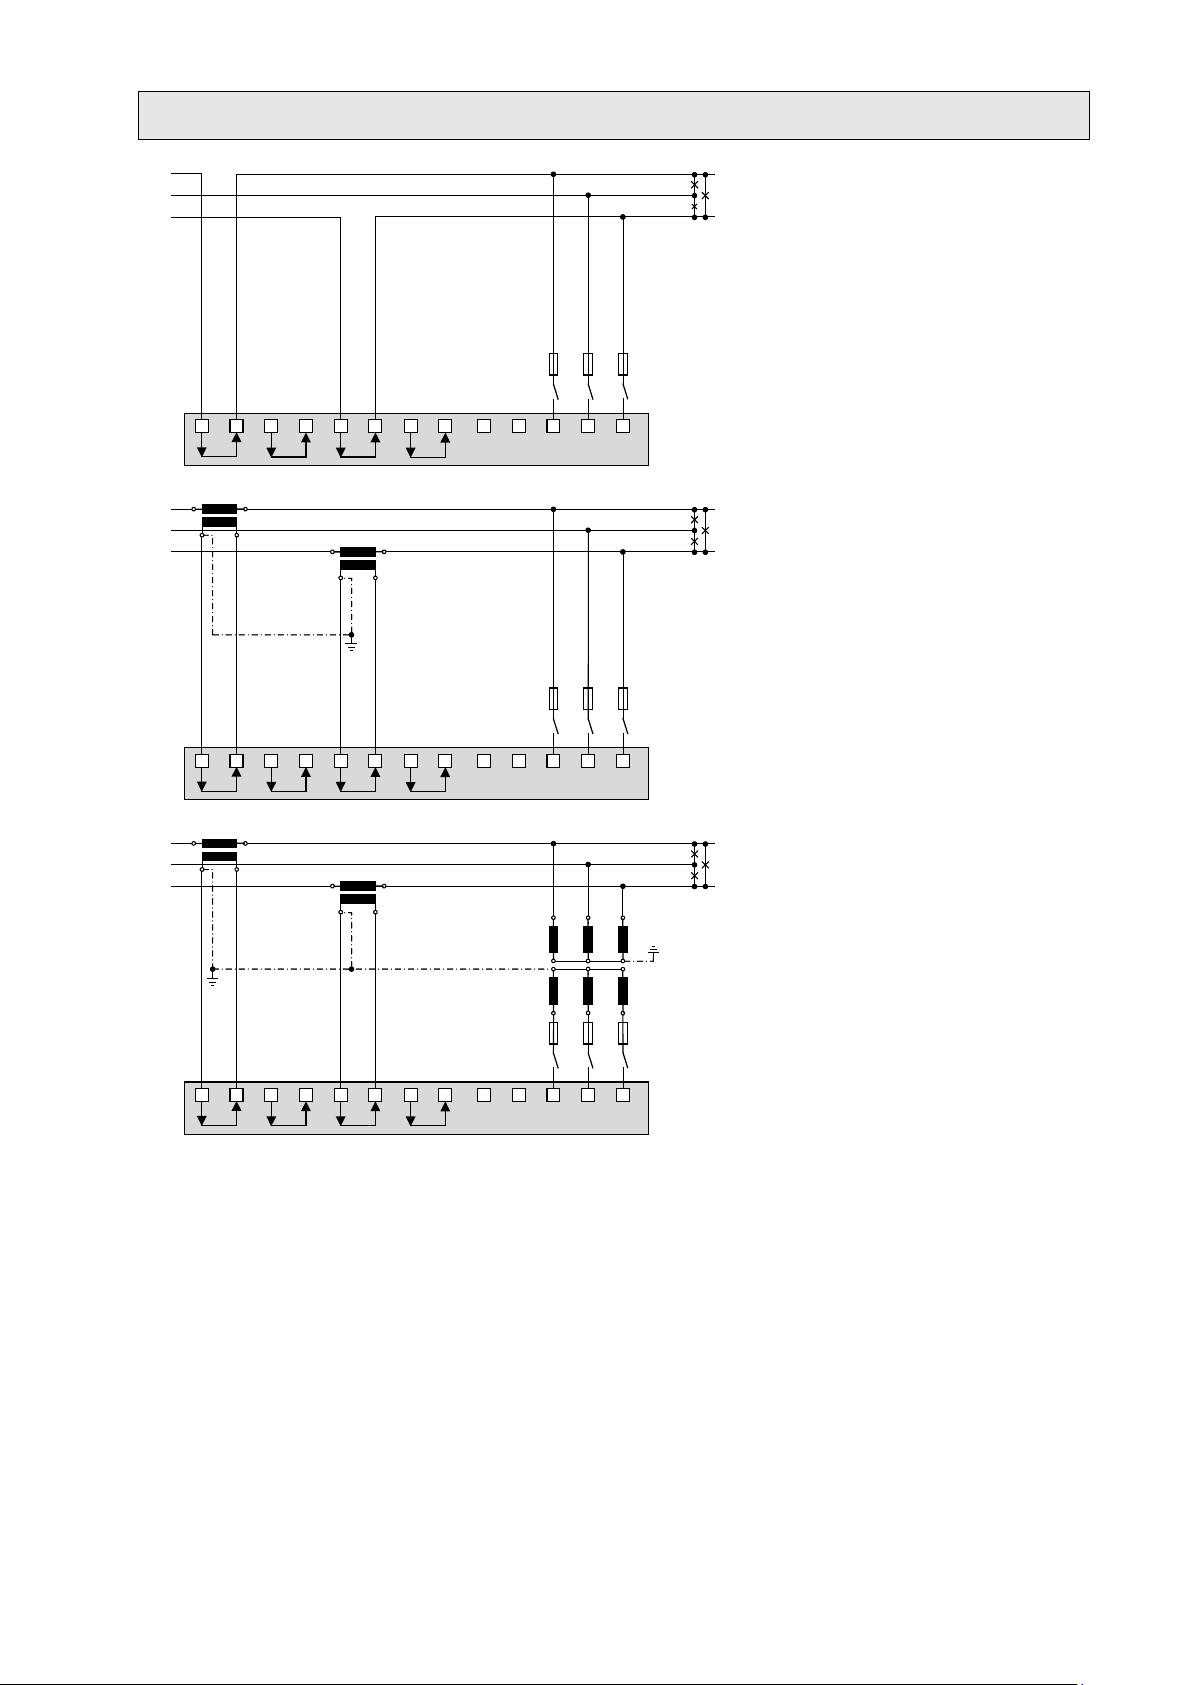
current measurement: L1, voltage measurement: L1-L2
Direct connection
With current transformer
With current and voltage transformers
In case of current measurement via L2 or L3 connect the device
according to the following table:
Terminals 1 3 2 5 8
Current meas. via L2 I2(k) I2(l) L2 L3 Current meas. via L3 I3(k) I3(l) L3 L1 -
PM 1001606 000 07 Device handbook CENTRAX CU3000-CU5000 14/106
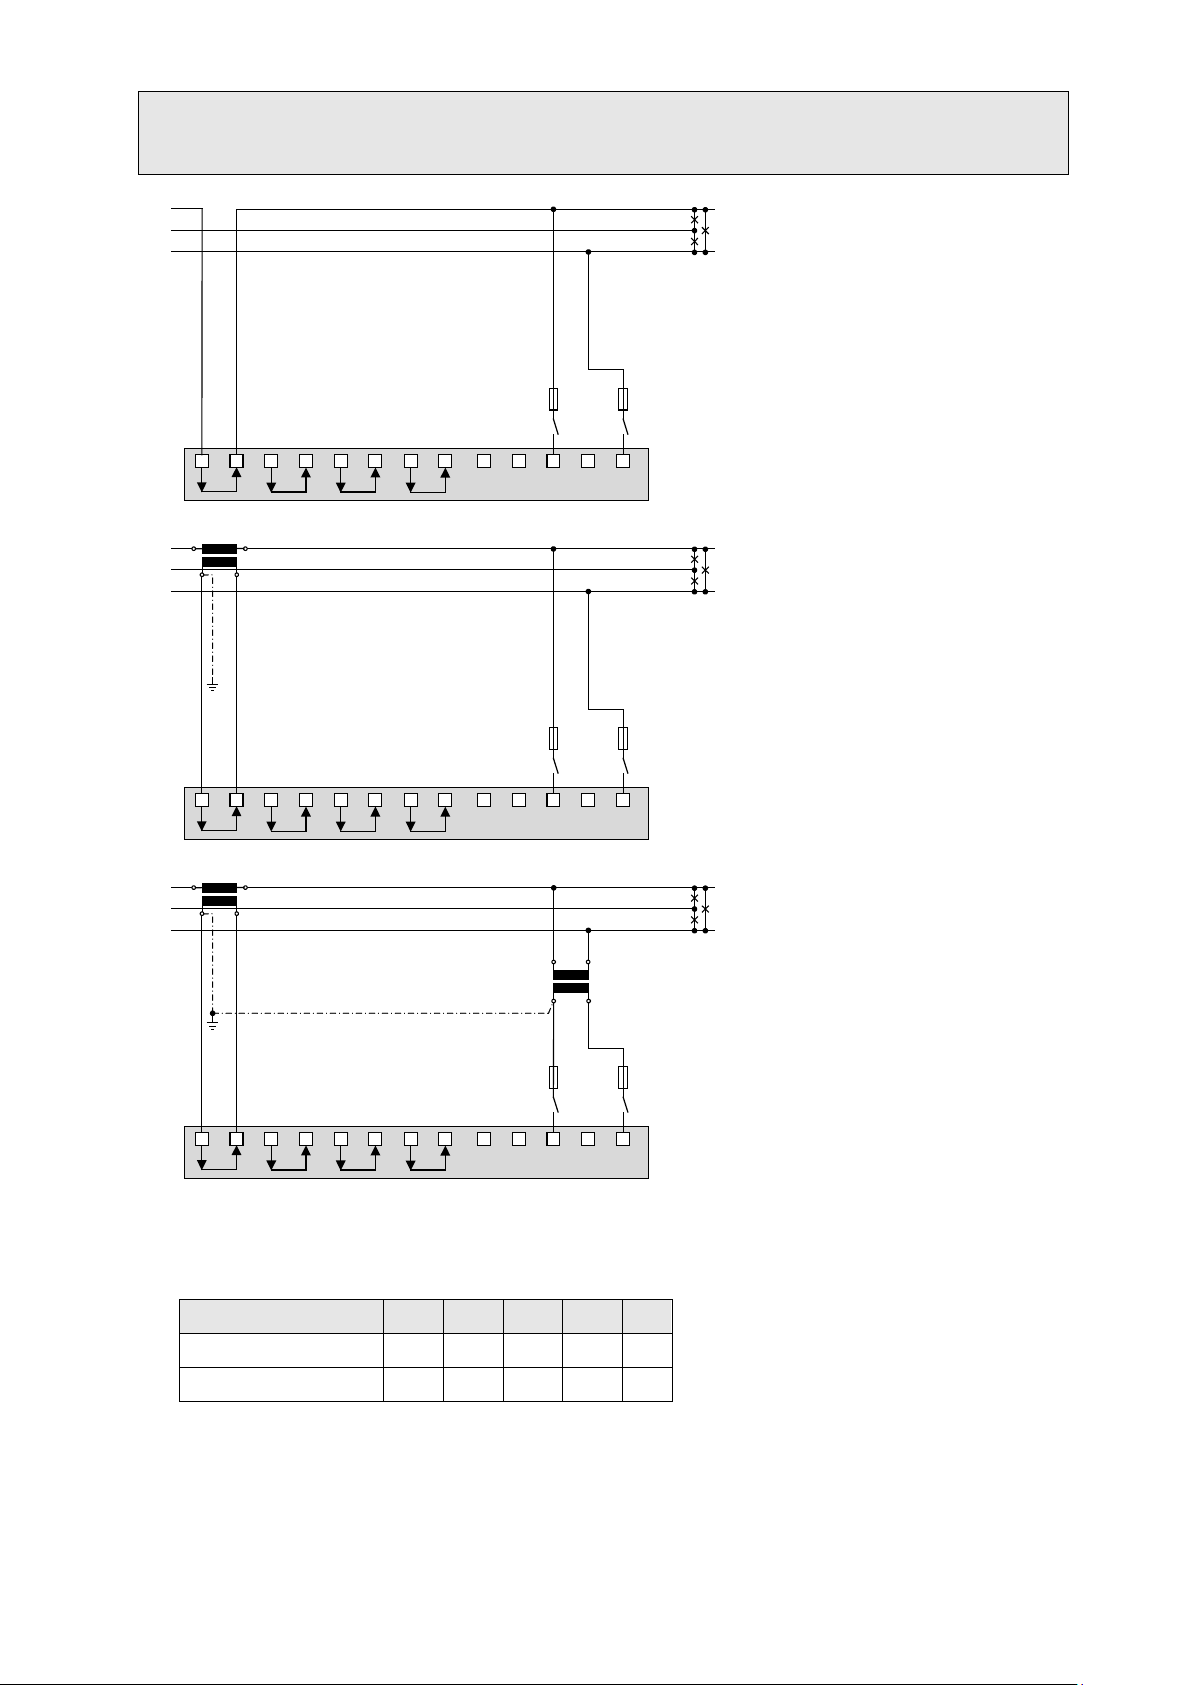
Three wire system, balanced load, phase shift
L1 L2 L3
N
I1
31
I2
4
I3
9
7
IN
PE
6
10 12 16
11 2 5 8
L1
L2
L3
5 A
(UL listed)
L1 L2 L3
N
I1
31
I2
4
I3
97
IN
PE
6
10 12 16
11 2 5 8
L1
L2
L3
K
k
L
l
5 A
(UL listed)
L
1 L2 L
3
N
I1
31
I2
4
I3
9
7
IN
PE
6
10
12 16
11 2
5 8
K
k
L
l
5 A
(
UL listed)
u
U
v
V
current measurement: L1, voltage measurement: L2-L3
Direct connection
With current transformer
With current and voltage transformers
In case of current measurement via L2 or L3 connect the device
according to the following table:
Terminals 1 3 2 5 8
Current meas. via L2 I2(k) I2(l) - L3 L1
Current meas. via L3 I3(k) I3(l) - L1 L2
PM 1001606 000 07 Device handbook CENTRAX CU3000-CU5000 15/106
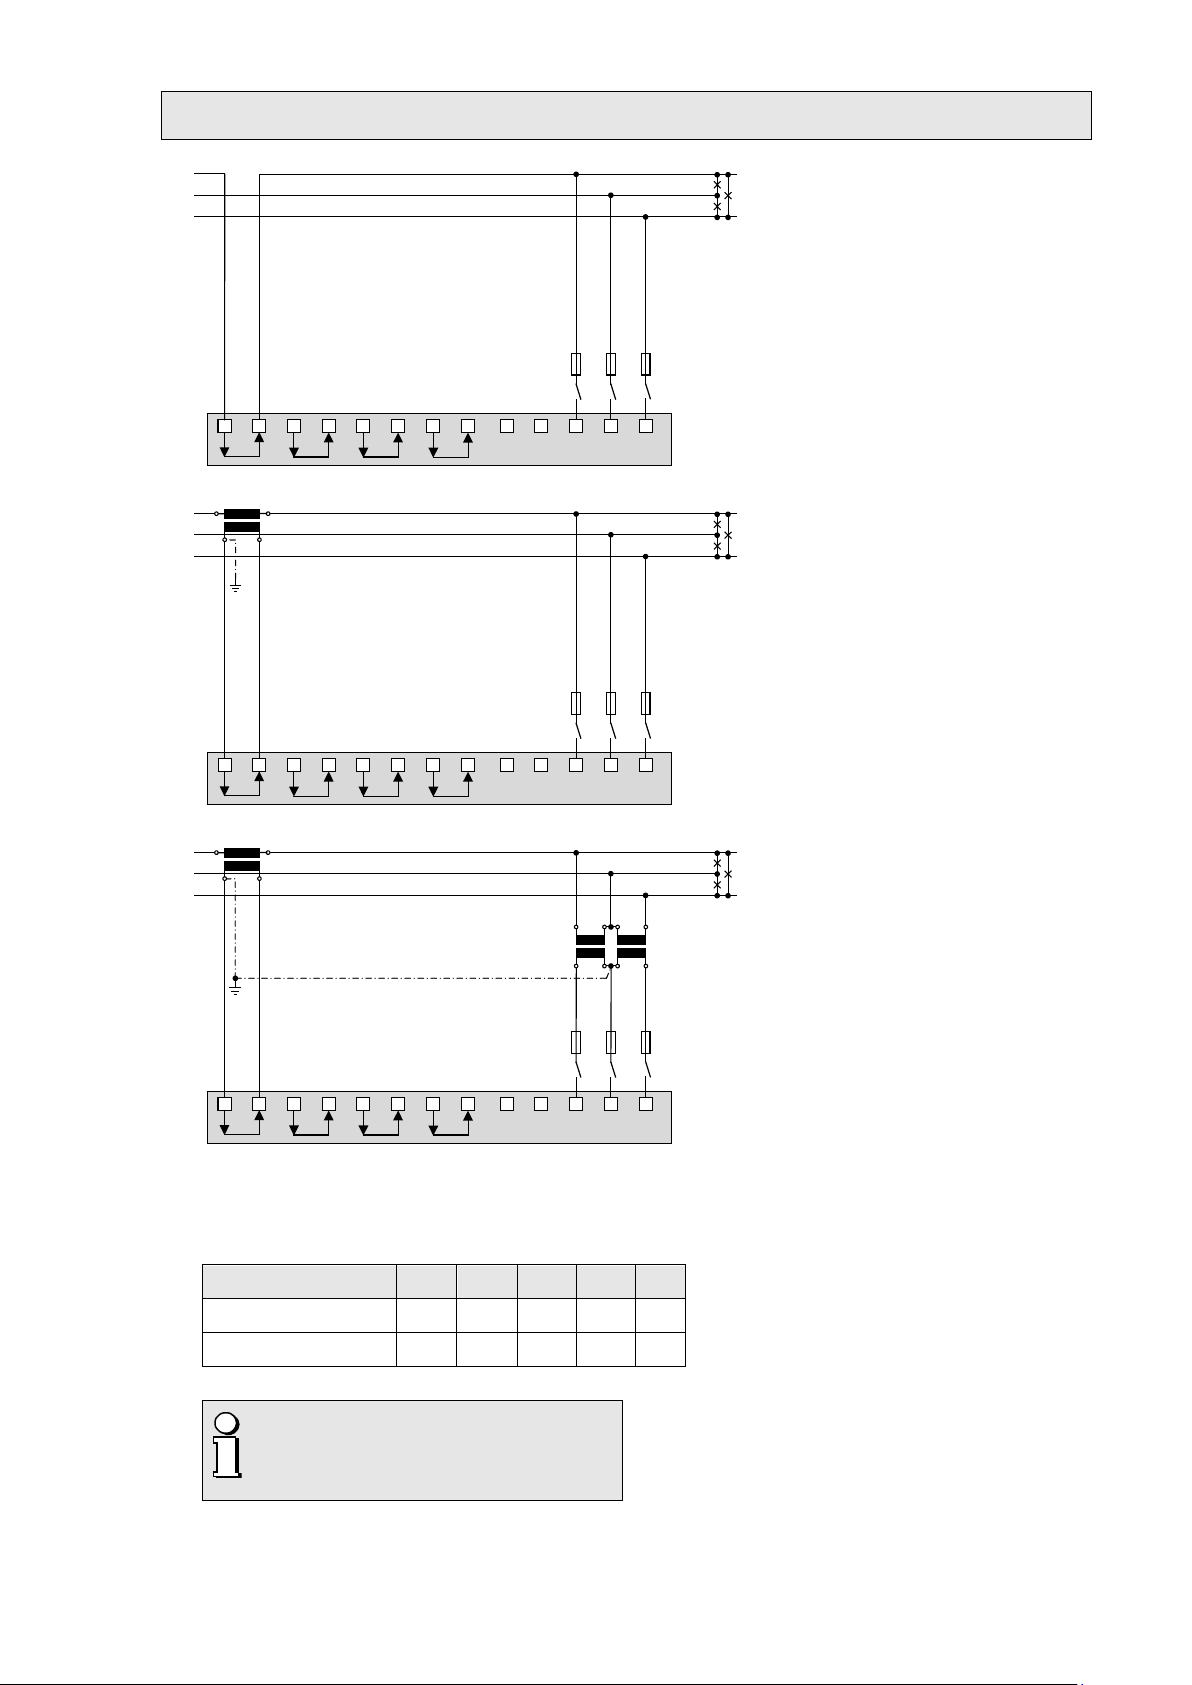
Three wire system, balanced load, phase shift
L1 L2 L3
N
I1
31
I2
4
I3
97
IN
PE
6
10 12 16
11 2 5 8
L1
L2
L3
5 A
(UL listed
)
L1 L2 L3
N
I1
31
I2
4
I3
97
IN
PE
6
10 12 16
11 2 5 8
L1
L2
L3
K
k
L
l
5 A
(UL listed)
L1 L2 L3
N
I1
31
I2
4
I3
97
IN
PE
6
10 12 16
11 2 5 8
L1
L2
L3
K
k
L
l
5 A
(UL listed)
v
V
u
U
current measurement: L1, voltage measurement: L3-L1
Direct connection
With current transformer
With current and voltage transformers
In case of current measurement via L2 or L3 connect the device
according to the following table:
Terminals 1 3 2 5 8
Current meas. via L2
Current meas. via L3
I2(k)
I2(l)
I3(k) I3(l) L3 - L2
L2 - L1
PM 1001606 000 07 Device handbook CENTRAX CU3000-CU5000 16/106
Three wire system, balanced load, current measurement via L1
L1 L
2
L3
N
I1
31
I2
4
I3
97
IN
PE
6
10 12 16
11 2 5 8
L1
L2
L3
5 A
(
UL listed)
L1
L2
L3
N
I1
31
I2
4
I3
97
IN
PE
6
10 12 16
11 2
5 8
L1
L2
L3
K
k
L
l
5 A
(UL listed
)
L1 L2 L3
N
I1
31
I2
4
I3
97
IN
PE
6
10 12 16
11 2 5 8
L1
L2
L3
K
k
L
l
5 A
(UL listed)
uUvVu
U
v
V
Direct connection
With current transformer
With current and voltage transformers
In case of current measurement via L2 or L3 connect the device
according to the following table:
Terminals 1 3 2 5 8
Current meas. via L2
Current meas. via L3
By rotating the voltage connections the
measurements U12, U23 and U31 will be
assigned interchanged!
I2(k)
I2(l)
I3(k) I3(l) L3 L1 L2
L2 L3 L1
PM 1001606 000 07 Device handbook CENTRAX CU3000-CU5000 17/106
Four wire system, balanced load, current measurement via L1
L1 L2 L3
N
I1
31
I2
4
I3
97
IN
PE
6
10 12 16
11 2 5 8
L1
L2
L
3
N
5 A
(UL listed)
PE
L
1
L2
L3
N
I1
31
I
2
4
I
3
9
7
IN
PE
6
10
12
16
11
2
5
8
L
1
L
2
L
3
N
K
k
L
l
5 A
(
UL listed
)
PE
L1 L2 L3
N
I1
31
I2
4
I3
97
IN
PE
6
10 12 16
11 2 5 8
L1
L2
L3
N
K
k
L
l
5 A
(UL listed)
uUv
V
uUv
V
PE
Direct connection
If voltage U
connection of PE can be omitted.
does not need to be measured,
NE
With current transformer
If voltage UNE does not need to be measured,
connection of PE can be omitted.
With current and voltage transformer
If voltage UNE does not need to be measured, the
corresponding transformer can be omitted.
In case of current measurement via L2 or L3 connect the device
according to the following table:
Terminals 1 3 2 11
Current meas. via L2
Current meas. via L3
I2(k)
I2(l)
I3(k) I3(l) L3 N
L2 N
PM 1001606 000 07 Device handbook CENTRAX CU3000-CU5000 18/106
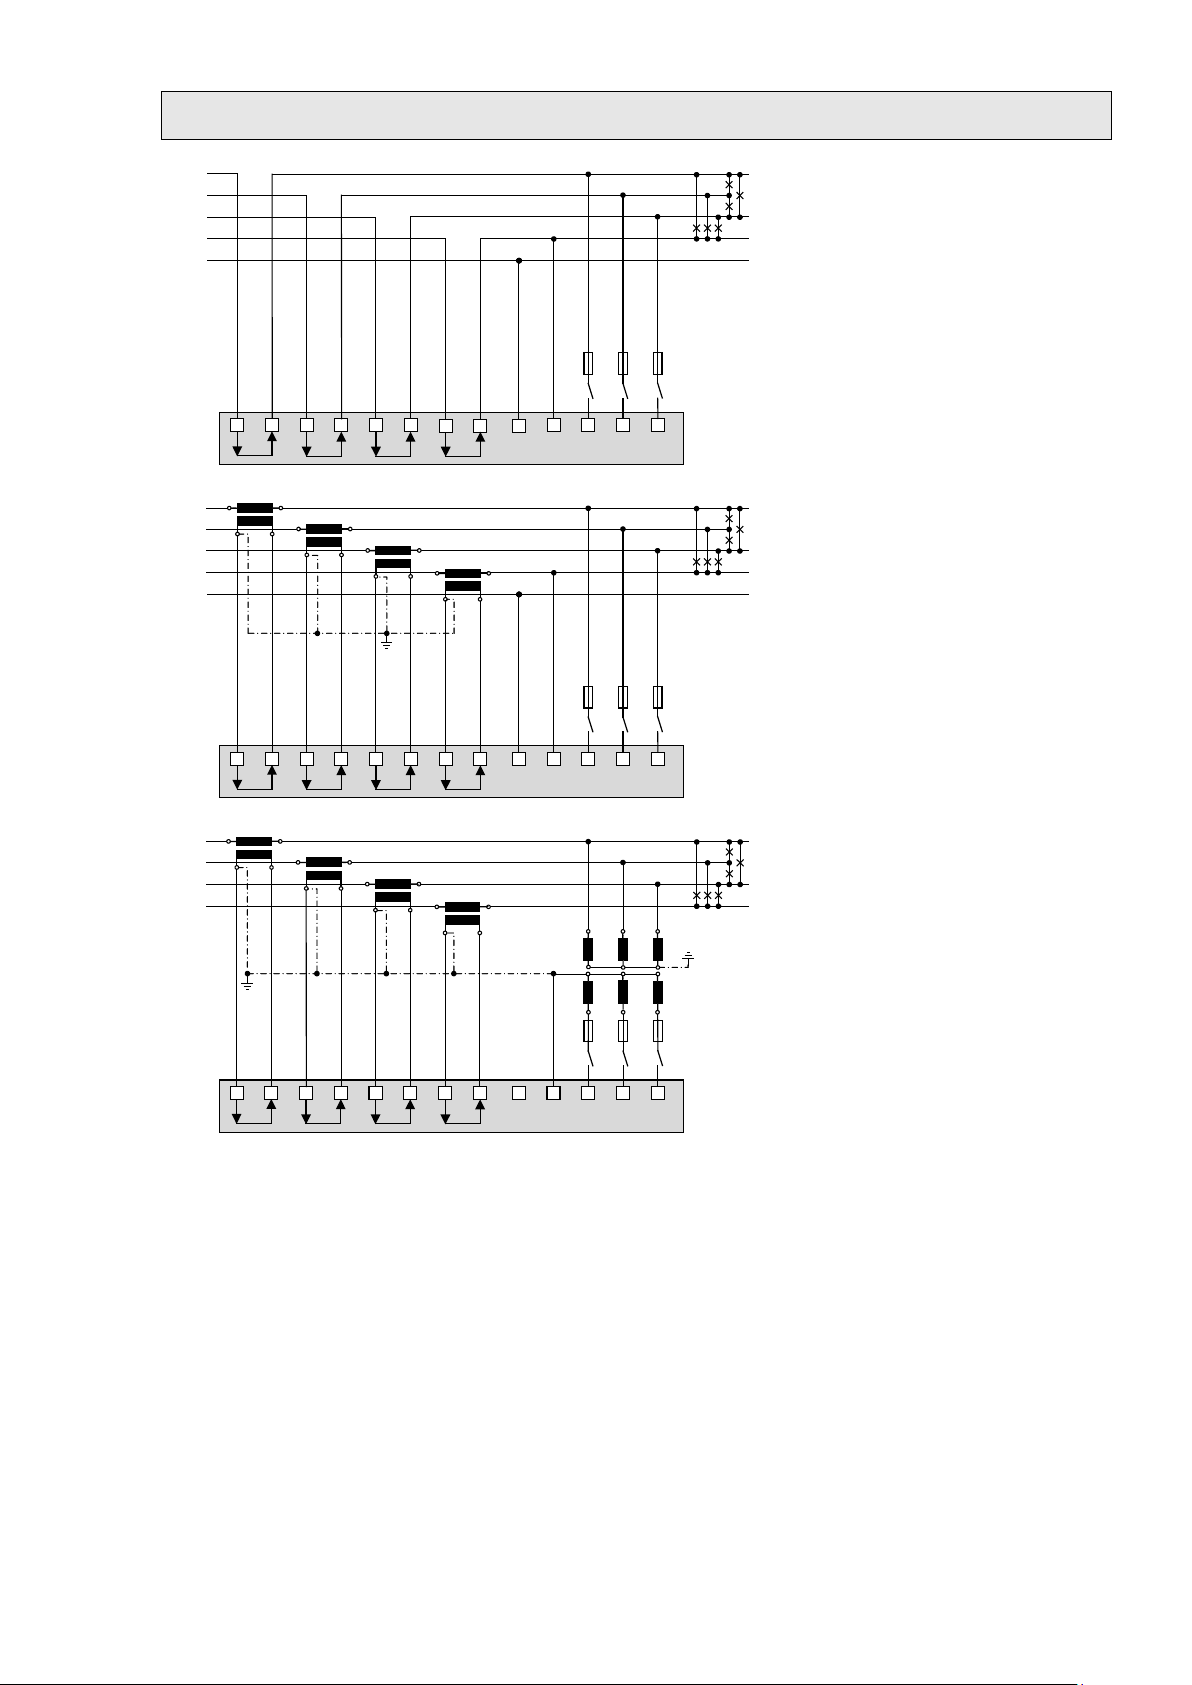
Three wire system, unbalanced load
L1 L
2
L3
N
I1
31
I2
4
I3
97
IN
PE
6
10 12 16
11 2 5 8
L1
L2
L3
5 A
(UL listed
)
L1 L2 L3
N
I1
31
I2
4
I3
97
IN
PE
6
10 12 16
11 2 5 8
L1
L2
L3
K
k
L
l
K
k
L
l
K
k
L
l
5 A
(UL listed)
L1 L2 L3
N
I1
31
I2
4
I3
97
IN
PE
6
10 12 16
11 2 5 8
L1
L2
L3
K
k
L
l
K
k
L
l
K
k
L
l
L1 L2 L3
N
I1
31
I2
4
I3
97
IN
6
10 12 16
11 2 5 8
x
u
X
U
X
U
X
U
x
u
x
u
5 A
(UL listed)
Direct connection
With current transformers
With current and 3 single-pole isolated
voltage transformers
PM 1001606 000 07 Device handbook CENTRAX CU3000-CU5000 19/106
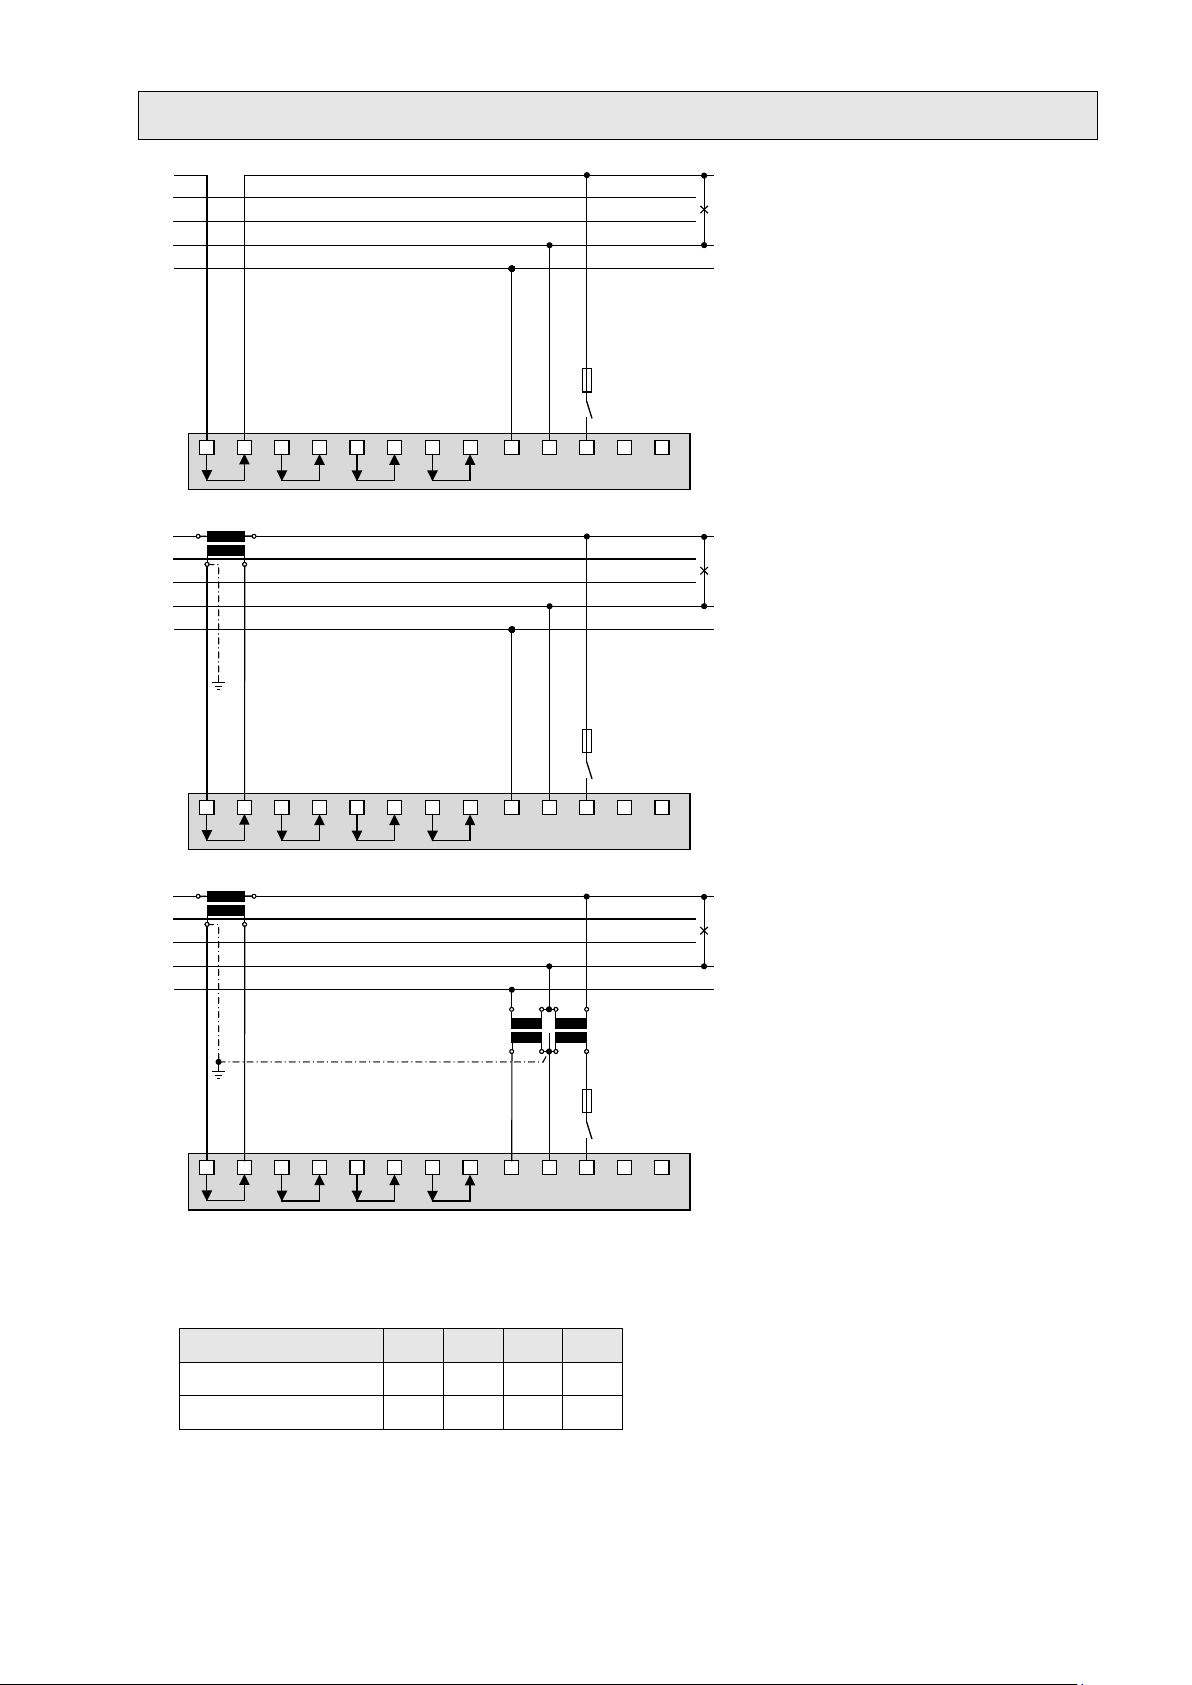
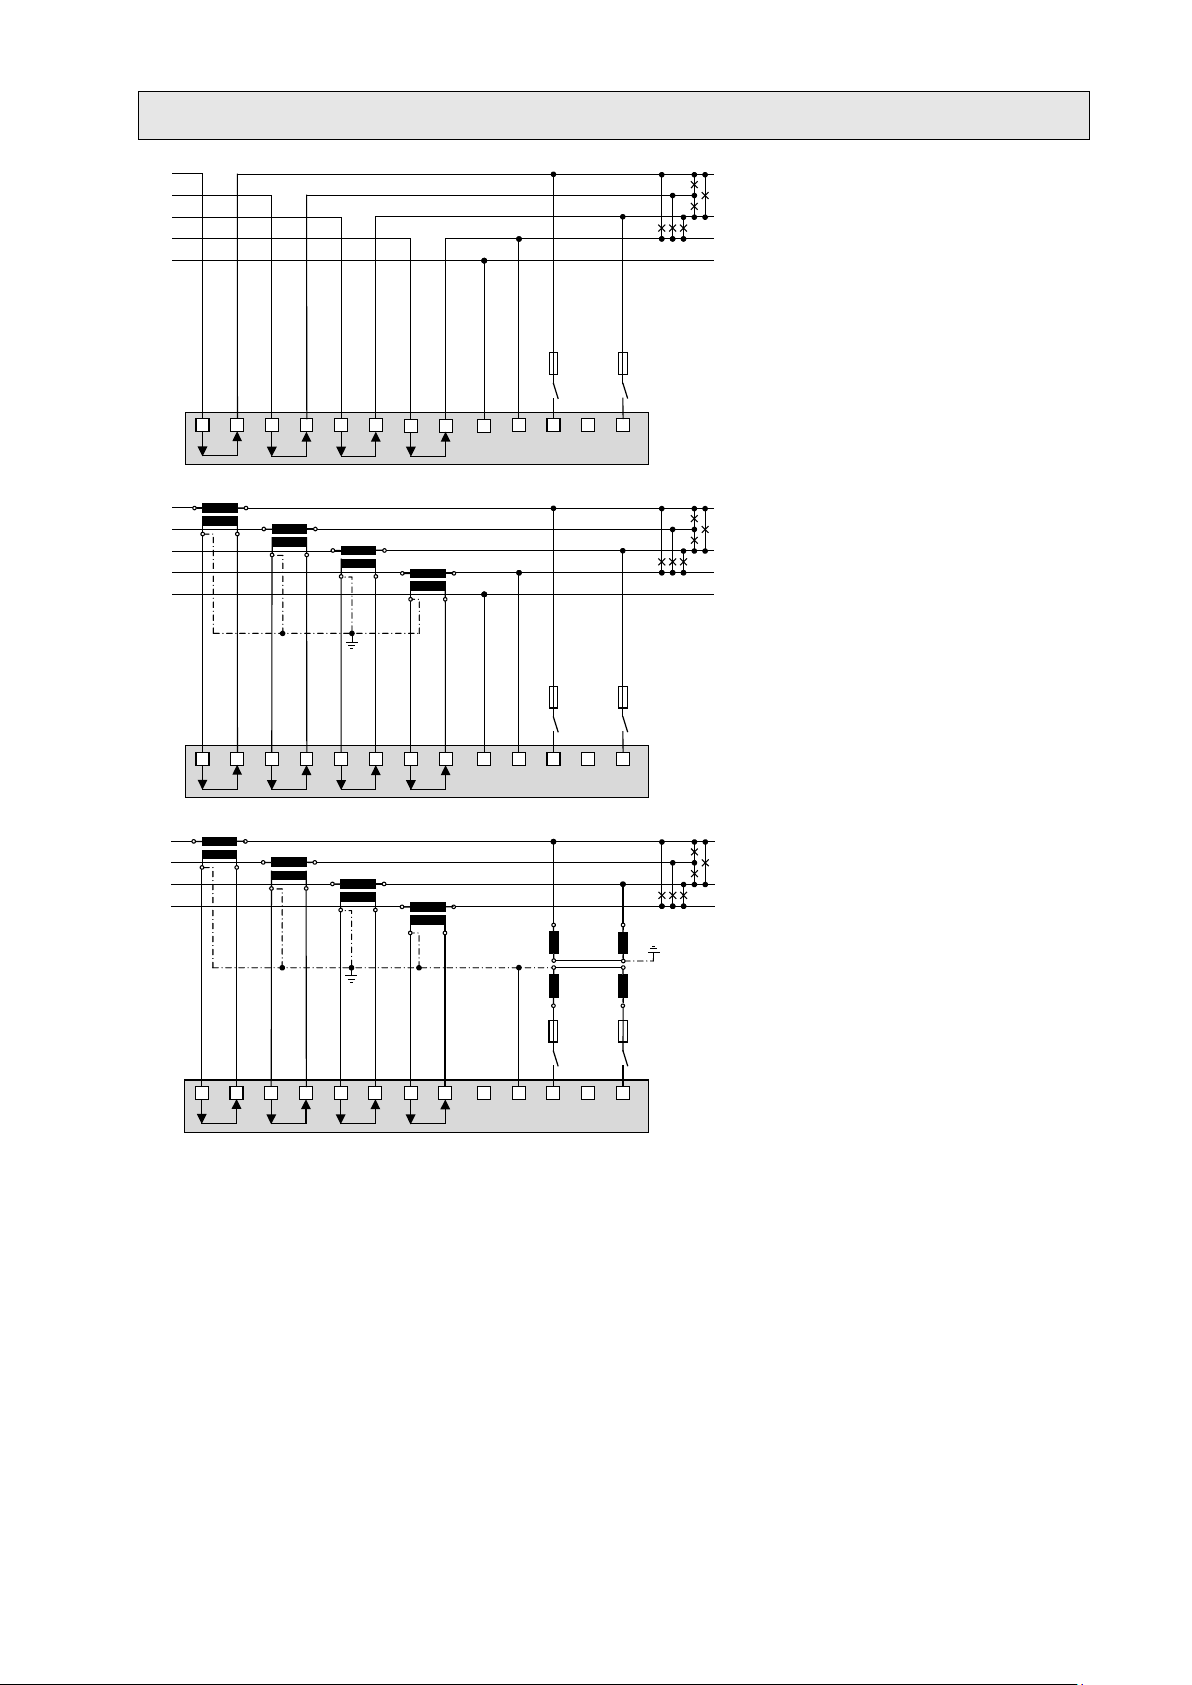
Three wire system, unbalanced load, Aron connection
L1 L2 L3
N
I1
31
I2
4
I3
97
IN
PE
6
10
12 16
11 2 5 8
L1
L2
L3
5 A
(
UL listed
)
L1 L2 L3
N
I1
31
I2
4
I3
97
IN
PE
6
10 12 16
11 2 5 8
L1
L2
L3
K
k
L
l
K
k
L
l
5 A
(UL listed)
L1 L2 L3
N
I1
31
I2
4
I3
97
IN
PE
6
10 12 16
11 2 5 8
L1
L2
L3
K
k
L
l
K
k
L
l
x
u
X
U
X
U
X
U
x
u
x
u
5 A
(UL listed)
Direct connection
With current transformers
With current and 3 single-pole isolated
voltage transformers
PM 1001606 000 07 Device handbook CENTRAX CU3000-CU5000 20/106
Four wire system, unbalanced load
L1 L2 L3
N
I
1
31
I2
4
I3
97
IN
PE
6
10 12 16
11 2 5 8
L1
L2
L3
N
5 A
(UL listed)
PE
L
1
L2 L3
N
I1
31
I
2
4
I
3
97
IN
PE
6
10
12 16
11
2 5 8
L
1
L2
L3
N
K
k
L
l
K
k
L
l
K
k
L
l
5 A
(
UL listed)
PE
K
k
L
l
L1 L2 L3
N
I1
31
I2
4
I3
97
IN
PE
6
10 12 16
11 2 5 8
L1
L2
L3
N
K
k
L
l
K
k
L
l
K
k
L
l
x
u
X
U
X
U
X
U
x
u
x
u
5 A
(UL listed)
K
k
L
l
Direct connection
If current I
or voltage UNE does not need to be
N
measured, connection of IN resp. PE can be
omitted.
With current transformer
If voltage UNE does not need to be measured,
connection of PE can be omitted.
If current I
corresponding transformer can be omitted.
does not need to be measured, the
N
With current and voltage transformer
If current IN does not need to be measured, the
corresponding transformer can be omitted.
PM 1001606 000 07 Device handbook CENTRAX CU3000-CU5000 21/106
Four wire system, unbalanced load, Open-Y
L
1 L2 L3
N
I
1
3
1
I2
4
I3
97
IN
PE
6
10
12 16
11 2 5 8
L1
L
2
L3
N
5 A
(UL listed)
PE
N
L
1
L2
L3
N
I1
31
I
2
4
I
3
97
IN
PE
6
10
12 16
11 2
5 8
L1
L
2
L
3
N
5 A
(UL listed
)
PE
N
K
k
L
l
K
k
L
l
K
k
L
l
K
k
L
l
L1 L2 L3
N
I1
31
I2
4
I3
97
IN
PE
6
10 12 16
11 2 5 8
L1
L
2
L3
N
5 A
(UL listed)
N
K
k
L
l
K
k
L
l
K
k
L
l
K
k
L
l
x
u
X
U
X
U
x
u
Direct connection
If current I
or voltage UNE does not need to be
N
measured, connection of IN resp. PE can be
omitted.
With current transformer
If voltage UNE does not need to be measured,
connection of PE can be omitted.
If current I
corresponding transformer can be omitted.
does not need to be measured, the
N
With current and voltage transformer
If current IN does not need to be measured, the
corresponding transformer can be omitted.
PM 1001606 000 07 Device handbook CENTRAX CU3000-CU5000 22/106
Split-phase ("two phase system"), unbalanced load
L1 L2 L3
N
I1
31
I2
4
I3
97
IN
PE
6
10 12 16
11 2 5 8
L1
L2
N
5 A
(UL listed)
PE
L1 L2 L3
N
I1
31
I2
4
I3
97
IN
PE
6
10 12 16
11 2 5 8
L1
L2
N
K
k
L
l
K
k
L
l
5 A
(UL listed)
K
k
L
l
PE
L1 L2
L3
N
I1
31
I2
4
I3
97
IN
PE
6
10
12 16
11 2 5
8
L1
L2
N
K
k
L
l
K
k
L
l
5 A
(UL listed)
K
k
L
l
u
U
v
V
u
U
v
V
Direct connection
With current transformers
With current and voltage transformer
In systems without a primary neutral conductor a
voltage transformer with a secondary center tap
can also be used.
PM 1001606 000 07 Device handbook CENTRAX CU3000-CU5000 23/106

5.5 Power supply
A marked and easily accessible curr en t limiting switch has to be arranged in the vicinity of
the device for turning off the power supply. Fusing should be 10 Amps or less and must be
rated for the available voltage and fault current.
5.6 Relays
When the device is switched off the relay contacts are de-energized, but dangerous
voltages may be present.
Relays are available for device versions with corresponding I/O extensions only.
CU3000 CU5000
I/O extension y x
1 5
2 6
3 4
4 3
5.7 Digital inputs
The device provides a standard passive digital input. In addition, depending on the device version, there
may be 4-channel passive or active digital input modules available.
Usage of the standard digital input
► Status input
► Meter tariff switching
Usage of the inputs of the optional input modules
► Counting input for pulses of meters for any kind of energy (pulse width 70…250ms)
► Operating feedback of loads for operating time counters
► Trigger and release signal for monitoring functions
Passive inputs (external power sup ply with 12 / 24 VDC required)
The power supply shall not exceed 30V DC!
CU3000 CU5000
Technical data
Input current < 7,0 mA
Logical ZERO - 3 up to + 5 V
Logical ONE 8 up to 30 V
PM 1001606 000 07 Device handbook CENTRAX CU3000-CU5000 24/106
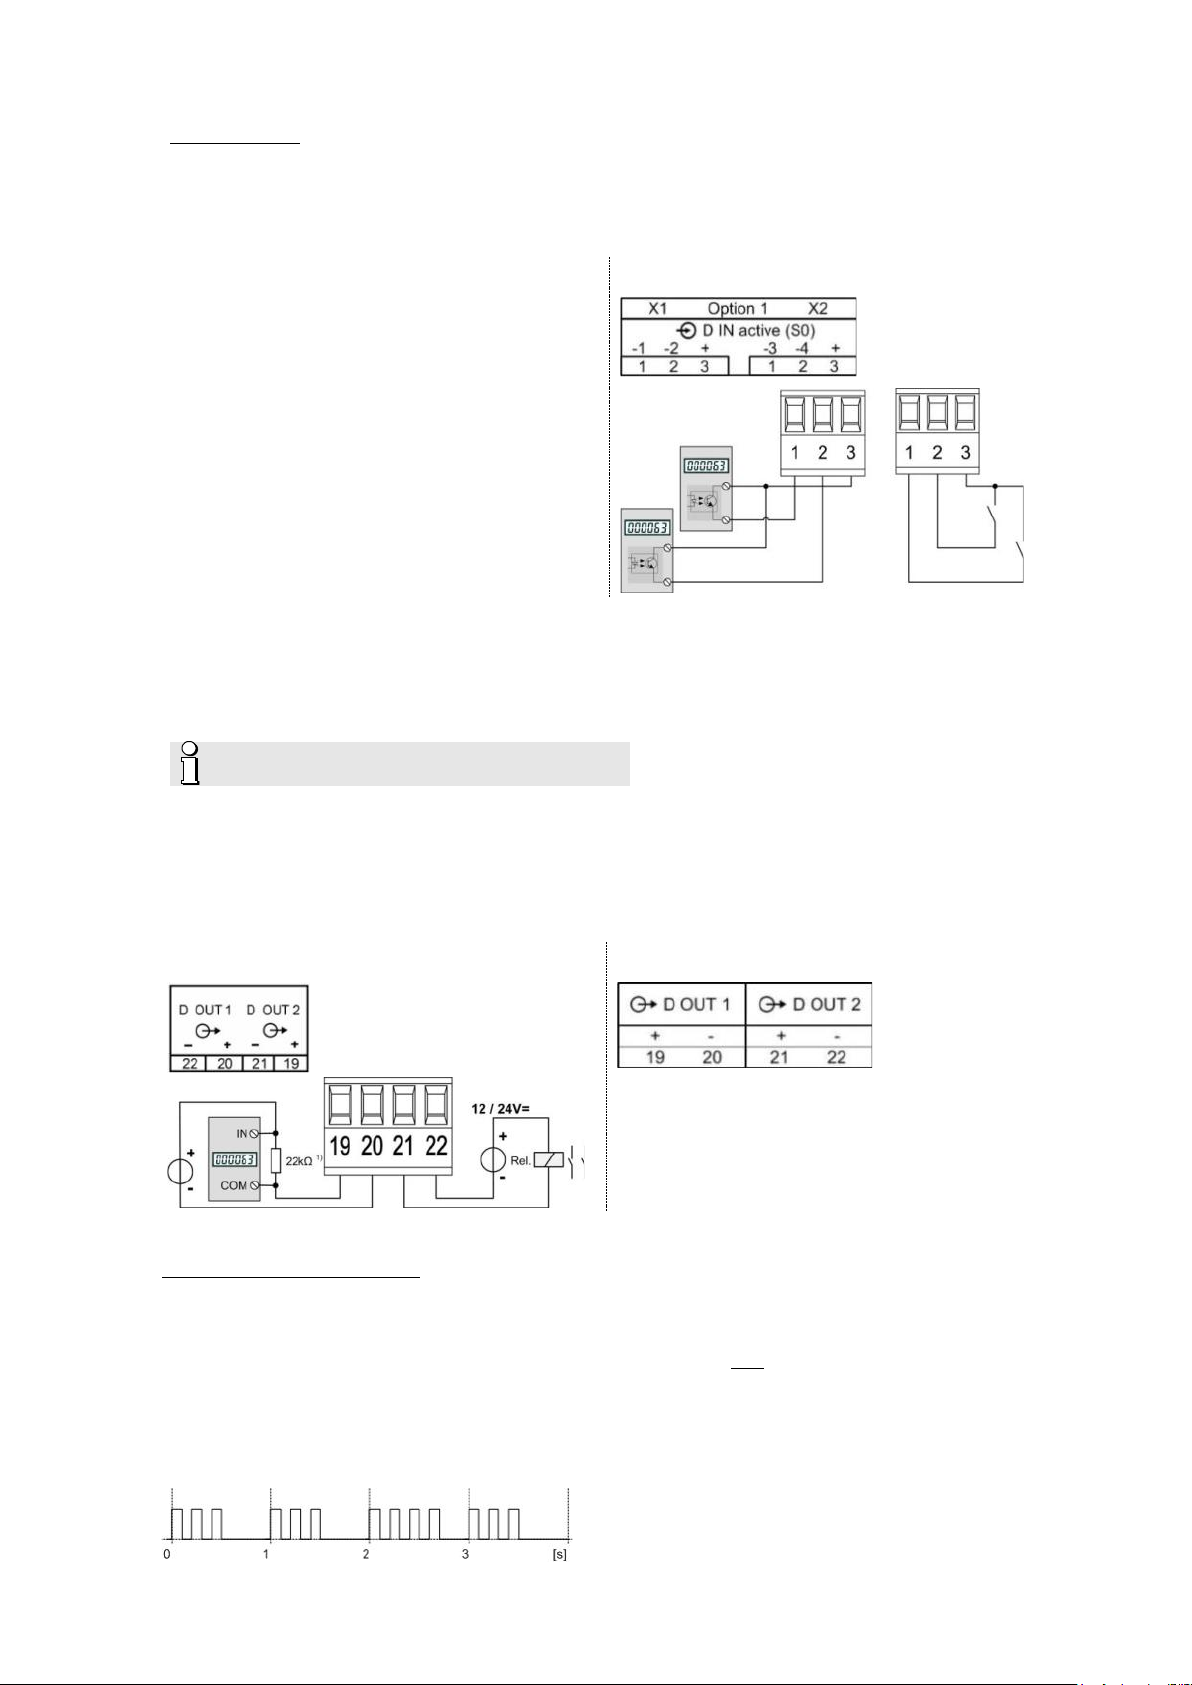
Active inputs (no external power supply required)
Technical data (acc. EN62053-31, class B)
Open circuit voltage ≤ 15 V
Short circuit current < 15 mA
Current at R
=800Ω ≥ 2 mA
ON
CU3000 CU5000
Example with meter pulse and status inputs
5.8 Digital outputs
The device has two standard digital outputs for which an external 12 / 24 VDC power supply is required.
The power supply shall not exceed 30V DC!
Usage as digital output
► Alarm output
► State reporting
► Pulse output to an external counter (acc. EN62053-31)
► Remote controlled output
CU3000 CU5000
1)
Recommended if input impedance of counter > 100 kΩ
Driving a counter mechanism
The width of the energy pulses can be selected within a range of 30 up to 250ms, but have to be adapted
to the external counter mechanism.
Electro mechanical meters typically need a pulse width of 50...100ms.
Electronic meters are partly capable to detect pulses in the kHz range. There are two types: NPN (active
negative edge) and PNP (active positive edge). For this device a PNP is required. The pulse width has to
be ≥ 30ms (acc. EN62053-31). The delay between two pulses has to be at least the puls e widt h. T he
smaller the pulse width, the higher the sensitivity to disturbances.
PM 1001606 000 07 Device handbook CENTRAX CU3000-CU5000 25/106
Driving a relay
Rated current 50 mA (60 mA max.)
Switching frequency (S0) ≤ 20 Hz
Leakage current 0,01 mA
Voltage drop < 3 V
Load capacity 400 Ω … 1 MΩ
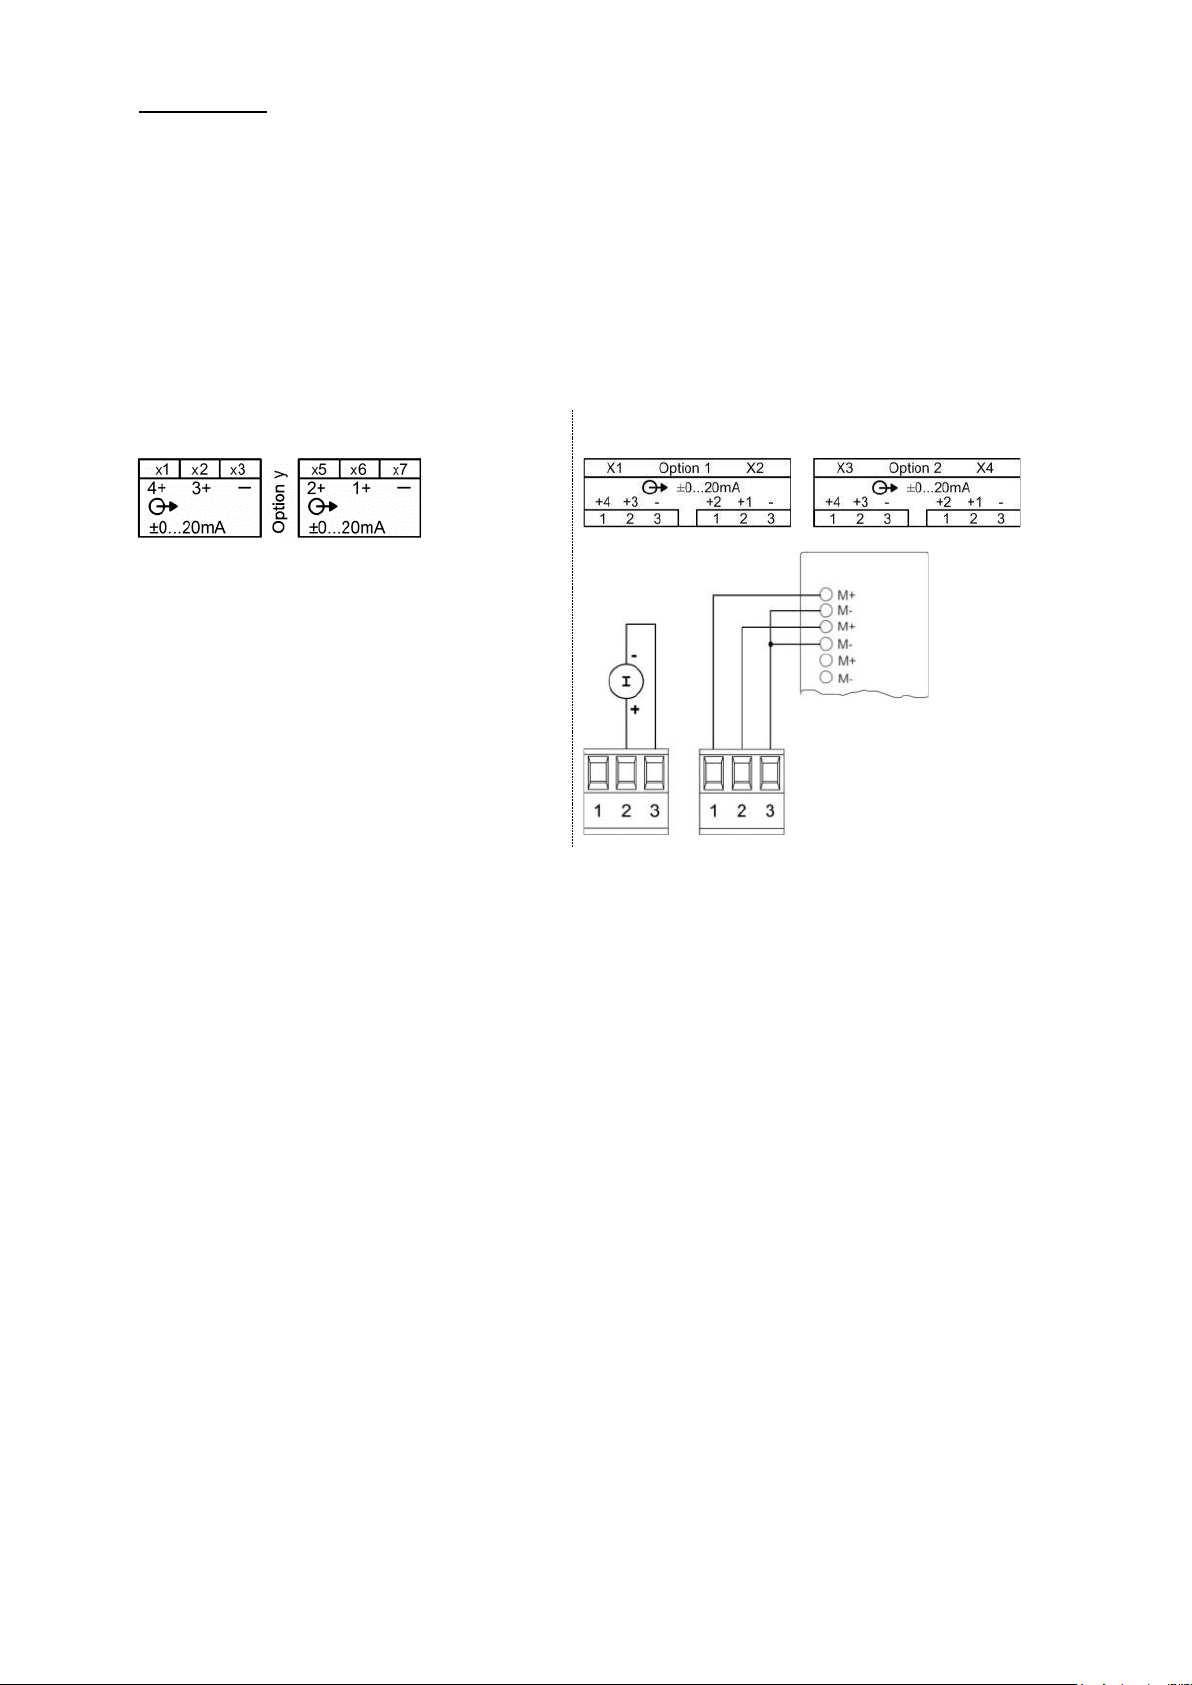
5.9 Analog outputs
Analog outputs are available for devices with corresponding I/O extensions only. See nameplate. Analog
outputs may be remote controlled.
CU3000 CU5000
Connection to an analog input card of a PLC or a control system
The device is an isolated measurement device. The individual outputs are galvanically connected, but the
modules are isolated from each other. To reduce the influence of disturbances shielded a twisted-pair
cables should be used. The shield should be connected to earth on both opposite ends. If there are
potential differences between the ends of the cable the shield should be earthed on one side only to
prevent from equalizing currents.
Under all circumstances consider as well appropriate remarks in the instruction manual of the system to
connect.
PM 1001606 000 07 Device handbook CENTRAX CU3000-CU5000 26/106

5.10 Fault current detection
Use only transformers intended for this application
catalog
divergent specifications may damage the measurement in
CU3000
CU5000
The current transformers including the conductor isolation must guarantee in total a
reinforced or double insulation between the mains circuit connected on the primary
and the measuring inputs of the device
Only one measurement range may be connected per measuring channel!
The COM connectors of both measurement channels are internally connected.
For 2mA inputs a connection monitoring (breakage) is
signaled for the respective measurement channels if either the current transfomer is
disconnected or the connection to the transformer is interrupted.
Each fault current module provides two channels for monitoring differential or fault currents in earthed
AC current systems. In any case measurement has to be performed via suitable current transformers, a
direct measurement is not possible. The module is not suited for monitoring operating currents of normally
live conductors (L1, L2, L3, N).
Measurement ranges
Each channel provides two measurement ranges:
a) Measurement range 1A
• Application: Direct measurement of a fault or earth wire current
• Meas. transformer: Current transformer 1/1 bis 1000/1A; 0.2 up to 1.5VA;
Instrument security factor FS5
b) Measurement range 2mA
• Application: Residual current monitoring (RCM)
• Meas. transformer: Residual current transformer 500/1 up to 1000/1A
Rated burden 100 Ω / 0.025 VA up to 200 Ω / 0.06 VA
, according to our current transformer
, or transformers that fulfill the above specification. Using transformers with
puts.
Connection
Erweiterung y x
1 5
2 6
3 4
4 3
side
.
implemented. An alarm state is
PM 1001606 000 07 Device handbook CENTRAX CU3000-CU5000 27/106

Example: Fault current monitoring in a TNS system
Hints
(1) If the current transfomers for the fault current detection needs to be grounded on the secondary side
this has to be done via the COM connector.
(2) Note that all conductors have to cross the residual current transformer
in the same direction.
(3) A possible fault current flows through the protective
earth conductor (PE). It can only be detected if the PE
conductor is not routed through the residual current
transformer. If this cannot be avoided, e.g. due to using
a multi-wire cable with all conductors, the PE conductor
must be returned through the transformer.
(4) The cable or individual conductors should be routed through the
transformer as centered as possible in order to minimize
measurement errors.
(5) Neither the current transformers nor the measurement leads should be mounted or installed close to
strong magnetic fields. Measurement lines should also not be laid in parallel to power lines.
(6) For measurement range 1A only: The rated output of the transformer must be chosen that it is
reached when the rated secondary current (1A) flows. Consider that the burden of the transformer is
not only made up by the burden of the measurement input, but also by the resistance of the
measurement lines and the self-consumption of the transformer (copper losses).
A rated output selected too low leads to saturation losses in the transformer. The secondary
rated current can no longer be reached as the transformer reaches its limits before.
A rated output selected too high or an exceeding instrument security factor (>FS5) may cause
damage to the measuring inputs in case of overload.
(7) For the connection of the transformer to the fault detection module use …
2
Conductor cross sections of 1.0 up to 2.5mm
Pairwise twisted connections in case of short cable lengths
Shielded cables (shield grounded on one side only) in disturbed environment or in case of long
cable lengths
PM 1001606 000 07 Device handbook CENTRAX CU3000-CU5000 28/106
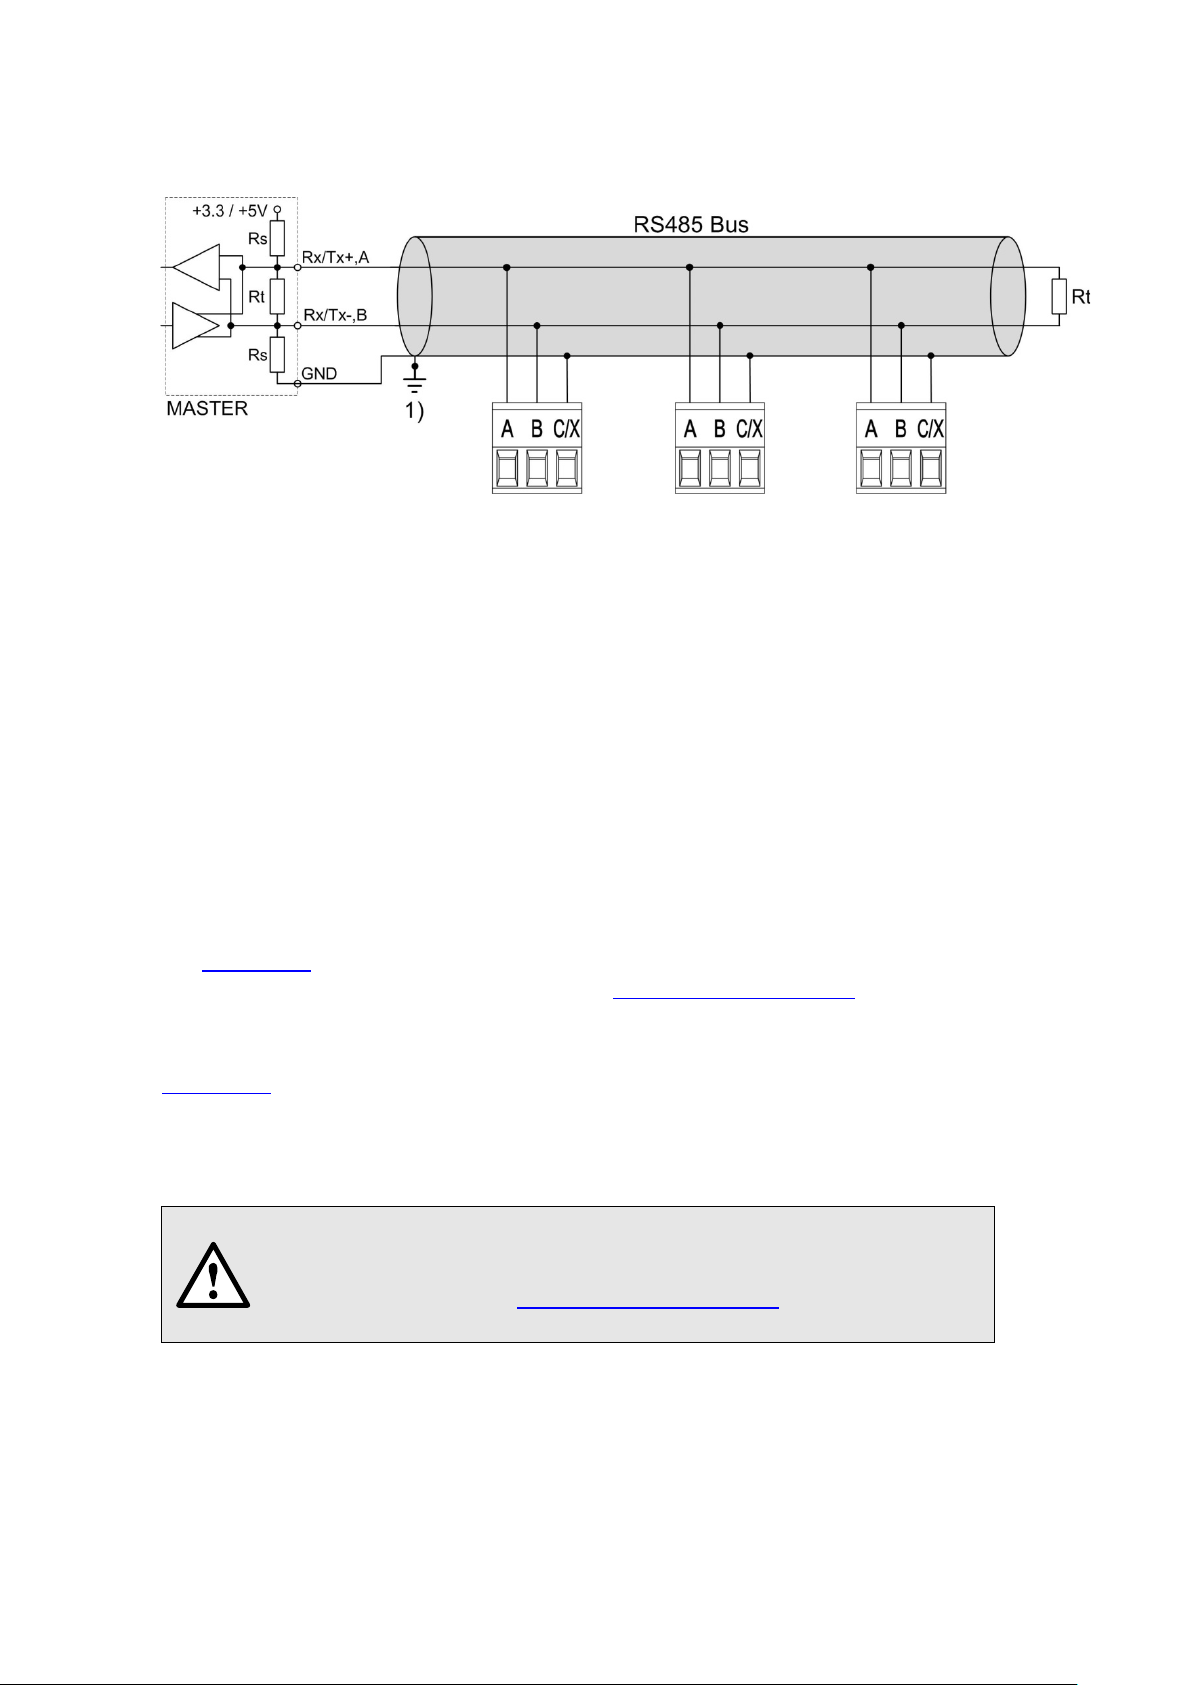
5.11 Modbus interface RS485
Via the optional Modbus interface measurement data may be provided for a superior system. However,
the Modbus interface cannot be used for device parameterization.
1) One ground connection only.
This is possibly made within the
master (PC).
Rt: Termination resistors: 120 Ω each
for long cables (> approx. 10 m)
Rs: Bus supply resistors,
390 Ω each
The signal wires (A, B) have to be t wist ed. G ND ( C/X) can be connected via a wire or via th e c abl e sc r een.
In disturbed environments shielded cables must be used. Supply resistors (Rs) have to be present in bus
master (PC) interface. Stubs should be avoided when connecting the devices. A pure line network is ideal.
You may connect up to 32 Modbus devices to the bus. A proper operation requires that all devices
connected to the bus have equal communication settings (baud rate, transmission format) and unique
Modbus addresses.
The bus system is operated half duplex and may be extended to a maximum length of 1200 m without
repeater.
5.12 Uninterruptible power supply (UPS)
The battery pack for the uninterruptible power supply is supplied separately. Please note that compared to
the storage temperature range of the base unit the storage temperature range of the battery pack is
restricted.
Ensure that devices with uninterruptible power supply are used in an environment in accordance with the
specification
recharged.
. Outside this operating temperature range, it is not ensured that the battery pack is
Due to aging the capacity of the battery decreases. To ensure a successful operation of the device during
power interuptions the batt ery needs to be replaced every 3 up to 5 years.
Potential for Fire or Burning. Do do not disassemble, crush, heat or burn the
removed battery pack.
Replace battery pack with a battery pack of the same type only. Use of another
battery may present a risk of fire or explosion.
PM 1001606 000 07 Device handbook CENTRAX CU3000-CU5000 29/106
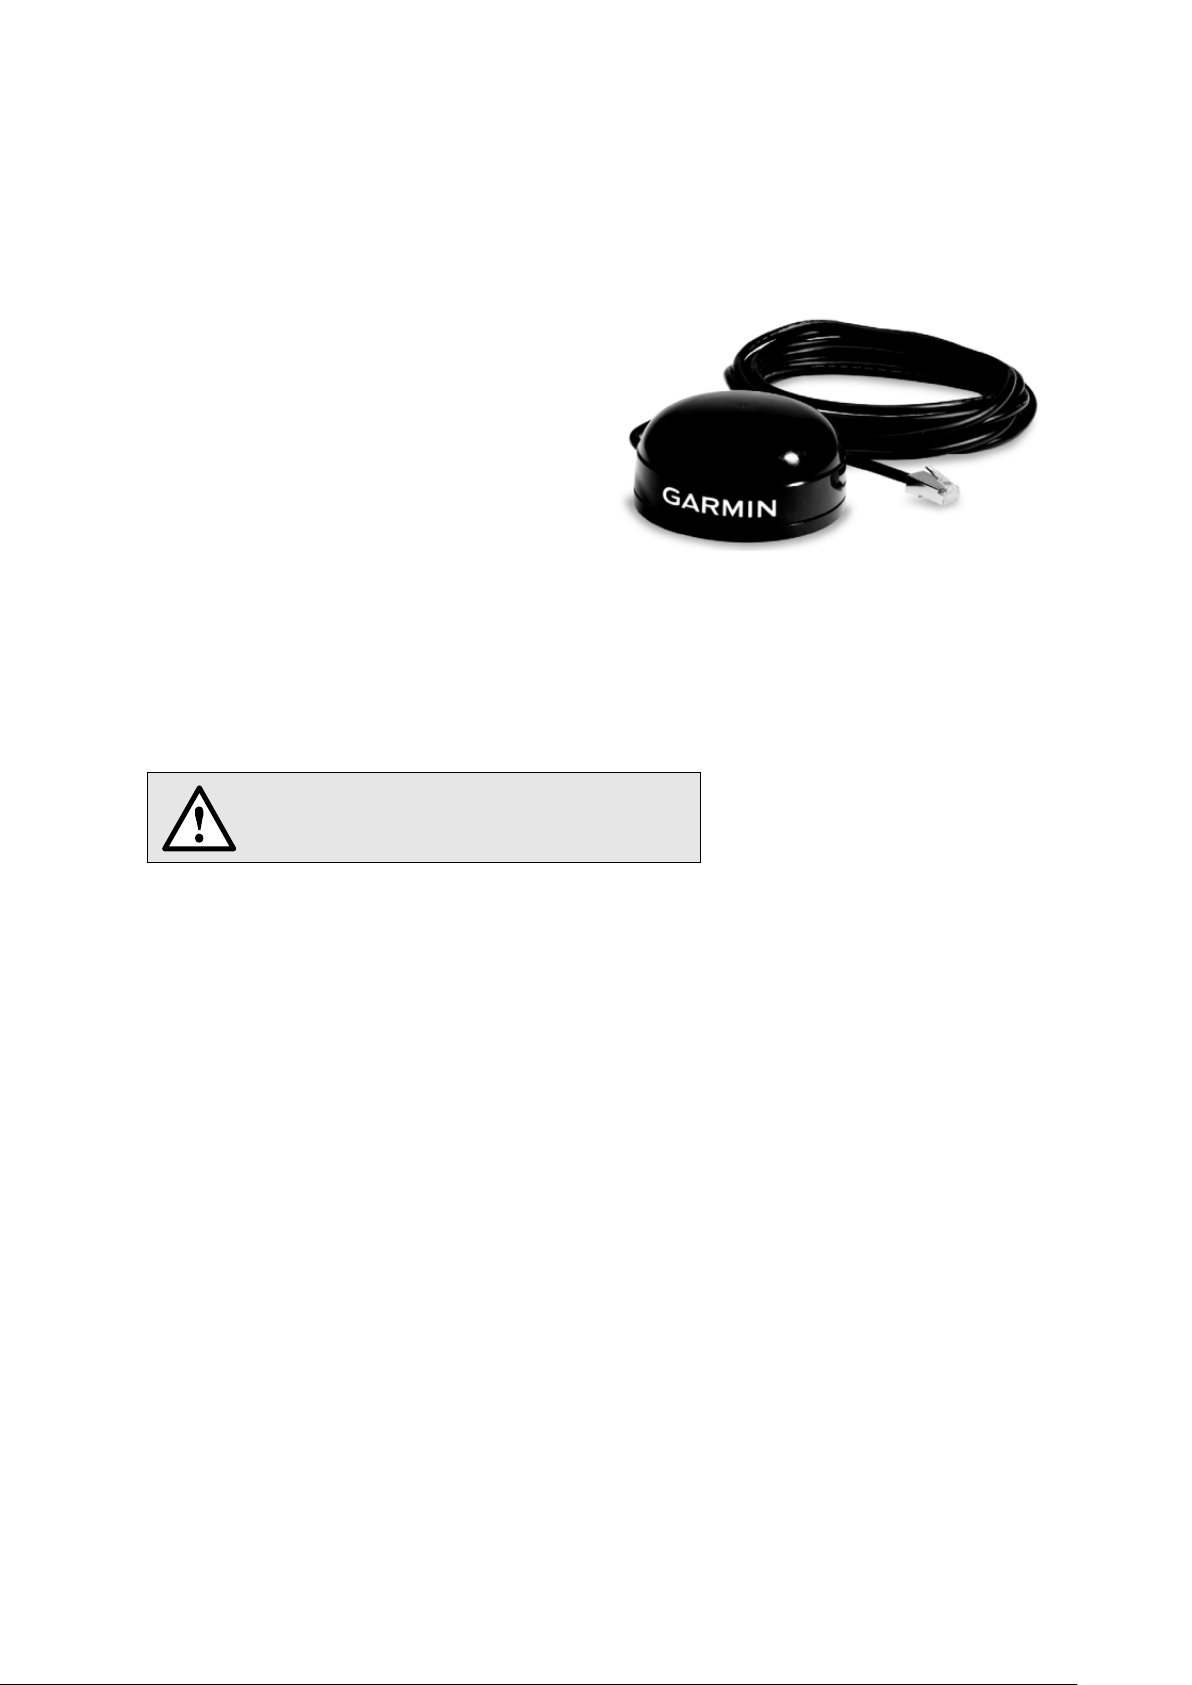
5.13 GPS time synchronization
Only use the receiver Garmin GPS 16x-LVS (article
The optional GPS connection module serves for connecting a GPS receiver as a very accurate time
synchronization source for the measurement device. The GPS receiver, available as an accessory, is
used as outdoor antenna to process data from multiple GPS satellites simultaneously.
GPS receiver
no. 181‘131), offered as an accessory. This device
is preconfigured by us and provides the required
time information (sentences) without further
configuration effort .
• Protection: IPx7 (waterproof)
• Operating temperature: -30…80°C
• Storage temperature: -40…80°C
• 1Hz pulse accuracy: 1μs
• Connector: RJ45
Choosing a mounting location
For a correct operation the GPS receiver requires data from at least 3 satellites at the same time.
Therefore position the receiver so that the clearest possible view of the sky and horizon in all direction is
obtained. This can be on the roof of a building, at best without reception being restricted by other
buildings or obstacles. Avoid mounting the receiver next to large areas of conductible material, as this
may cause poor signal reception. It should be also not closer than 1 meter away from any other antenna.
If lightning protection is required, this must be
provided by the user himself.
Mounting the GPS receiver
• The GPS receiver Garmi n G PS 16x -LVS
can be flush mounted by means of 3 M4
screws.
• 120° distribution over a circle of ø71.6mm
• Thread length max. 8mm. Using longer
screws may damage the GPS receiver.
PM 1001606 000 07 Device handbook CENTRAX CU3000-CU5000 30/106

Connecting the GPS receiver
When connecting a GPS receiver for the first time or when it has been out of
operation for a long time, it may take up to 1 hour for finding enough satellites f
GPS receiver operation and thus for a reliable time synchronization.
Never connect the RJ45 connector of the connecting cable
directly to a network device such as a router or switch. These
devices could be damaged.
The GPS receiver is plugged directly into the GPS connection module. The connection cable has a length
of 5 m. It may be extended using an RJ45 coupling and an Ethernet cable. The connection cable should
not be laid in parallel to live conductors. Twisting or sharp kinking of the cable should be avoided.
Commissioning
• In the settings menu change time synchronization to „NTP server / GPS“
• Check the time synchronization status
• The time synchronization can be restarted by switching the time synchronization off and on again.
• Time synchronization via GPS and NTP server may work in parallel. If both synchronization sources
are available, the system uses the more accurate time source, which is normally GPS.
or
PM 1001606 000 07 Device handbook CENTRAX CU3000-CU5000 31/106

6. Commissioning
Measurement input
Before commissioning you have to check if the connection data of the device match the data
of the plant (see nameplates).
If so, you can start to put the device into operation by switching on the power supply and the
measurement inputs.
Measurement input
Input voltage
Input current
System frequency
1 Works no.
2 Test and conformity marks
3 Assignment voltage inputs
4 Assignment current inputs
5 Assignment power supply
6 Load capacity relay
outputs
…………………………………………………………………………………………………………………………
Input voltage
Input current
System frequency
1 Works no.
2 Test and conformity marks
3 Assignment voltage inputs
4 Assignment current inputs
5 Assignment power supply
6 Load capacity relay
outputs
PM 1001606 000 07 Device handbook CENTRAX CU3000-CU5000 32/106

6.1 Parametrization of the device functionality
Missing phase or magnitude too
A full parameterization of all functions of the device is possible directly at the device (for devices with
display only) or via web browser.
See: Configuration (7.5)
6.2 Operating LED (CU5000 only)
The operating LED shows the present device state.
Procedure LED display
Booting of device
Firmware update
Factory reset or reset of communication
settings
• Flashes green (1 Hz)
• If successful: Change to static green display
• Change to update mode: Static red
• During update: Flashes red (1 Hz)
• If successful or cancelled: Booting of device
• During reset: Flashes red (1 Hz)
• Then: Booting of device
6.3 Installation ch ec k
The correct connection of the current and voltage inputs can be checked in two ways.
a) Sense of rotation check: Using the sequence of the current and voltage phasors the sense of
rotation is determined and compared to the configured one. The phase rotation indicator is arranged
in the menu “Phasor diagram”.
Test requirement: Magnitude of all connected voltages at least 5% of nominal, magnitude of all
connected currents at least 0.2% of nominal.
Possible results
Correct sense of rotation
Wrong sense of rotation
small
PM 1001606 000 07 Device handbook CENTRAX CU3000-CU5000 33/106

b) Phasor verification: The phasor diagram shows a technical visualization of the current and voltage
The diagram is always built basing on the voltage of
the reference channel (direction 3 o’clock)
phasors, using a counter-clockwise rotation, independent of the real sense of rotation.
Correct installation (expectation)
• Voltage sequence in clock-wise order
L1 L2 L3 (0° -120° 120°)
• Current sequence in clock-wise order
L1 L2 L3
• Similar angle between voltage and current phasors in
all phases (approx. -20°)
What’s wrong?
• Voltage sequence: L1 L2 L3
• Current sequence: L1 L3 L2; Current L2 is out of
the expected sequence
• Angle U-I: Angle between UL2 and IL2 is approx. 180°
wrong
Required correction
Exchanging the connections of current I2
What’s wrong?
• Voltage sequence: L1 L3 L2; L3 and L2 seem to
be interchanged
• Current sequence: L1 L2 L3
• Angle U-I: Angle between U
wrong
Required correction
Exchanging the connections of the voltages L2 and L3
and IL2 is approx. 180°
L2
What’s wrong?
• Voltage sequence: L1 L3 L2; L3 and L2 seems to
be exchanged
• Current sequence: L1 L3 L2; Current L2 is out of
the expected sequence
• Angle U-I: Angles between UL2 / IL2 and UL3 / IL3 do not
correspond to the expectations
Required correction
Exchanging the connections of the voltages L2 and L3
and reversing the polarity of the current input I
What’s wrong?
• Voltage sequence: L1 L2 L3
• Current sequence: L2 L3 L1
• Angle U-I: The U-I angles do not correspond to the
expectation, but are similar
Required correction
Cyclical exchange of the voltage connections: L1L3,
L2L1, L3L2. As an alternative the sequence of all
current may be changed as well (more effort required).
2
PM 1001606 000 07 Device handbook CENTRAX CU3000-CU5000 34/106

6.4 Ethernet installation
6.4.1 Settings
Before devices can be connected to an existing Ethernet network, you have to ensure that they
will not disturb the normal network service. The rule is:
The device can be equipped with multiple Ethernet interfaces whose network settings can be configured
independently.
Interface Application Default IP Settings via menu
Standard Configuration / Modbus TCP 192.168.1.101 Settings | Communication | Ethernet
IEC 61850 IEC61850 communication 192.168.1.102 Settings | IEC61850 | Ethernet
The following settings have to be arranged with the network administrator:
- IP address: This one must be unique, i.e. may be assigned in the network only once.
- Subnet mask: Defines how many devices are directly addressable in the network. This setting is equal
for all the devices. Examples
None of the devices to connect is allowed to have the same IP address
than another device already installed
.
- Gateway address: Is used to resolve addresses during communication between different networks. It
should contain a valid address within the directly addressable network.
- DNS-S erv e r x: Is used to resolve a domain name into an address, if e.g. a name (pool.ntp.org) is used
for the NTP server. Further informations
.
- Hostname: Individual designation for each device. Via the hostname the device can be uniquely
identified in the network. Therefore for each device a unique name should be assigned.
- NTP-Server x: NTP servers are used as base for time synchronization
- Modbus/TCP Port: Selection of the TCP port to be used for Modbus/TCP communication. Standard
setting is 502. See also TCP ports
.
Network settings of Standard interface
Network settings of IEC61850 interface
For a direct communication between device and PC both devices need to be in the same network when
the subnet mask is applied:
PM 1001606 000 07 Device handbook CENTRAX CU3000-CU5000 35/106

Example 1
11000000 10101000 00000001 01100101
255.255.255.224
11111111 11111111 11111111 11100000
xxxxx
192.168. 1. 96
11000000 10101000 00000001 01100000
11000000 10101000 00000001 01111111
Example 2
192.168. 57. 64
11000000 10101000 00111001 01000000
255.255.252. 0
11111111 11111111 11111100 00000000
xx xxxxxxxx
192.168. 56. 0
11000000 10101000 00111000 00000000
192.168. 59.255
11000000 10101000 00111011 11111111
decimal binary
IP address
Subnet mask
variable range
First address
Last address
► The device 192.168.1.101 can access directly the devices 192.168.1.96 … 192.168.1.127
IP address
Subnet mask
variable range
First address
Last address
► The device 192.168.57.64 can access directly the devices 192.168.56.0 ... 192.168.59.255
DHCP
If a DHCP server is available, alternatively the mode „DHCP“ or „DHCP, addresses only“ can be
selected for the Standard inter f ace. The device then gets all necessary information from the DHCP server.
The difference between the two modes is that for “DHCP” also the DNS server address is obtained.
192.168. 1.101
192.168. 1.127
decimal binary
The settings obtained from the DHCP server can be retrieved locally via the service menu.
Depending on the settings of the DHCP server the provided IP address can change on each
reboot of the device. Thus it’s recommended to use the DHCP mode during commissioning
only.
PM 1001606 000 07 Device handbook CENTRAX CU3000-CU5000 36/106

Time synchronization via NTP protocol
CU3000
CU5000
For the time synchronization of devices via Ethernet NTP (Network Time Protocol) is the standard.
Corresponding time servers are used in computer networks, but are also available for free via Internet.
Using NTP it's possible to hold all devices on a common time base.
Two different NTP servers may be defined. If the first server is not available the second server is used for
trying to synchronize the time.
If a public NTP server is used, e.g. “pool.ntp.org”, a name resolution is required. This normally happens
via a DNS server. So, the IP address of the DNS server must be set in the communication settings of the
Ethernet interface to make a communication with the NTP server, and thus time synchronization, possible.
Your network administrator can provide you the necessary information.
The time synchronization of the Standard interface can be performed via a GPS receiver
as well.
TCP ports
The TCP communication is done via so-called ports. The number of the used port allows determining the
type of communication. As a standard Modbus/TCP communication is performed via TCP port 502, NTP
uses port 123. However, the port for the Modbus/TCP telegrams may be modified. You may provide a
unique port to each of the devices, e.g. 503, 504, 505 etc., for an easier analysis of the telegram traffic.
Independent of these setting a communication via port 502 is always supported. The device allows at
least 5 connections to different clients at the same time.
Firewall
Due to security reasons nowadays each network is protected by means of a firewall. When configuring the
firewall you have to decide which communication is desired and which have to be blocked. The TCP port
502 for the Modbus/TCP communication normally is considered to be unsafe and is often disabled. This
may lead to a situation where no communication between networks (e.g. via Internet) is possible.
6.4.2 Connection of the standard interface
The RJ45 connector serves for direct connecting an Ethernet cable.
Interface: RJ45 socket, Ethernet 100BaseTX
Mode: 10/100 MBit/s, full / half duplex, Auto-negotiation
Protocols: http, Modbus/TCP, NTP
Functionality of the LED's
• LED left: Switched on as soon as a network connection exists (link)
• LED right: Switched-on during communication with the device (activity)
PM 1001606 000 07 Device handbook CENTRAX CU3000-CU5000 37/106

6.4.3 Connection of the IEC61850 interface
CU3000
CU5000
• LED green: On if a network connection (link) exists, flashes during communication
CU3000
CU5000
The RJ45 sockets X1 and X2 serve for direct connecting Ethernet cables. Both ports are equivalent and
internally connected via a switch.
Interface: RJ45 sockets, Ethernet 100BaseTX
Mode: 10/100 MBit/s, full / half duplex, Auto-negotiation
Protocols: IEC61850, NTP
Functionality of the LED's
6.4.4 MAC addresses
For uniquely identifying Ethernet connections in a network, to each connection a unique MAC address is
assigned. Compared to the IP address, which may be modified by the user at any time, the MAC address
is statically.
Standard Ethernet interface
IEC61850 Ethernet-Schnittstelle
6.4.5 Communication tes ts
Via the service menu on the device website you may check if the selected network structure is valid. The
device must be able to reach the DNS server via gateway. The DNS server then allows resolving the URL
of the NTP server to an IP address. The Standard Ethernet interface serves as interface for the
communication tests.
• Ping: Connection test to any network device, (initial: g at e wa y address )
• DNS: Test, if the name resolution via DNS works (initial: URL of NTP server)
• NTP: Test, if the selected NTP-Server is in fact a time server (stratum x)
NTP server test
PM 1001606 000 07 Device handbook CENTRAX CU3000-CU5000 38/106

6.4.6 Resetting the communication settings of the CU5000
If the communication settings of the Standard
interface are no longer known, they can be
reset to the default settings by pressing the
sunk-in reset button (located below the
operating LED) for at least 3s. During the reset
the operating LED flashes red. After the reset
the device is rebooted.
6.5 Protection against device data changing
Configuration or measurement data stored in the device may be modified via either service or settings
menu. To protect these data a security system may be activated (default: not activated). If the security
system is active the user hat to enter a password before executing protected functions. Subsequent to a
successful password input the access remains open until the user leaves the settings / service menu or
an input timeout occurs.
For activating the security system a password input is required. The factory default is: “1234”.
The password can be modified by the user. Permitted characters are ‘a‘…‘z‘,
‘A‘…‘Z‘ and ‘0‘…‘9‘, length 4…12 characters.
ATTENTION: A reset to factory default will reset also the password. But for a factory
reset the present password needs to be entered. If this password is no longer known
the device must be sent back to the factory!
Representation
Security system
active
Security system
deactivated / inactive
Device display
Webpage
PM 1001606 000 07 Device handbook CENTRAX CU3000-CU5000 39/106

7. Operating the devic e
7.1 Operating elements
CU3000 CU5000
The operation of devices with display is performed by means of 6 keys:
4 keys for navigation ( , , , ) and for the selection of values
OK for selection or confirmation
ESC for menu display, terminate or cancel
The function of the operating keys changes in some measurement displays, during parameterization and
in service functions. For the CU3000 the valid functionality of the keys is then shown in a help bar.
7.2 Selecting the information to display
CU3000 CU5000
For devices with display, information selection is performed via menu. Menu items may contain further
sub-menus.
Displaying the menu
Press ESC. Each time the key is pressed a change to a higher menu level is performed, if present.
Displaying information
The menu item chosen using , can be selected using OK. Repeat the procedure in possible submenus
until the required information is displayed.
Return to measurement display
After 2 min. without interaction the menu is automatically closed and the last active measurement display
is shown.
PM 1001606 000 07 Device handbook CENTRAX CU3000-CU5000 40/106

7.3 Measurement displays and used symbols
For displaying measurement information the device uses both numerical and numerical-graphical
measurement displays.
Examples Measurement information
2 measured quantities
4 measured quantities
2x4 measured quantities
2x4 measured quantities with Min/Max
Graphical measurement display
Further examples
PM 1001606 000 07 Device handbook CENTRAX CU3000-CU5000 41/106

Incoming / outgoing / inductive / capacitive
The device provides information for all four quadrants.
Σ HT
Σ LT
ø
Examples
Quadrants are normally identified using the roman numbers
I, II, III and IV, as shown in the adjacent graphic. Depending
on whether the system is viewed from the producer or
consumer side, the interpretation of the quadrants is
changing: The energy built from the active power in the
quadrants I+IV can either been seen as delivered or
consumed active energy.
By avoiding terms like incoming / outgoing energy and
inductive or capacitive load when displaying data, an
independent interpretation of the 4-quadrant information
becomes possible. Instead the quadrant numbers I, II, III or
IV, a combination of them or an appropriate graphical
representation is used. You can select your own point of
view by selecting the reference arrow system (load or
generator) in the settings of the measurement.
Used symbols
For defining a measurement uniquely, a short description (e.g. U
sufficient. Some measurements need further information, which is given by one of the following symbols
or a combination of these symbols:
I,II,III,IV
Mean-value
Mean-value trend
Bimetal function (current)
Energy quadrants I+IV
Energy quadrants II+III
Energy quadrants I+II
Energy quadrants III+IV
Quadrants
) and a unit (e.g. V) are often not
1N
TRMS True root-mean-square val ue
RMS
(H1) Fundamental component only
Meter (high tariff)
Meter (low tariff)
Maximum value
Minimum value
Root-mean square value (e.g.
fundamental or harmonic content only)
Average (of RMS values)
CU3000: Meters with tariff and
quadrant information
PM 1001606 000 07 Device handbook CENTRAX CU3000-CU5000 42/106
CU5000: User mean values, last
value
CU5000: User mean values, trend

7.4 Resetting measurement data
• Minimum and maximum values may be reset during operation. The reset may be performed in
groups using the service menu.
Group Values to be reset
1 Min/max values of voltages, currents and frequency
2 Min/max values of Power quantities (P,Q,Q(H1),D,S); min. load factors
3 Min/max values of power mean-values, bimetal slave pointers and free selectable mean-values
4 Maximum values of harmonic analysis: THD U/I, TDD I, individual harmonics U/I
5 All imbalance maximum values of voltage and current
• Meter contents may be individually set or reset during operation using the service menu
• Recorded logger data can be individually reset via the service menu. This makes sense whenever the
configuration of the quantities to record has been changed.
7.5 Configuration
7.5.1 Configuration at the device
A full parameterization of the device can be performed via the menu “Settings”. With the exception of the
“Country and clock” menu, all modifications will not take effect before the user accepts the query “Store
configuration changes” when leaving the settings menu.
• Country and clock: display language, date format, time zone, clock synchronization, time/date
• Display: Refresh rate, brightness, screen saver
• Communication: Settings of the communication interfaces Ethernet and Modbus/RTU
• Measurement: System type, sense of rotation, nominal valu es of U / I / f, sampling, reference arrow
system etc.
Hints
U / I transformer: The primary to secondary ratio is used only for converting the measured secondary to
primary values, so e.g. 100 / 5 is equivalent to 20 / 1. The values do not have any influence on the display
format of the measurements.
Nominal voltage: Is used as the 100% reference for monitoring the voltage events of the disturbance logger. It
corresponds to the declared input voltage U
Nominal current: Used for scaling the harmonic content TDD
Maximum primary values U/I: These values are used for fixing the display format of the measurements. This
way you can optimize the resolution of the displayed values, because there is no dependency to installed
transformers.
Synchronous sampling: yes=sampling is adjusted to the measured system frequency to have a constant
number of samplings per cycle; no=constant sampling based on the selected system frequency
Reference channel: The measurement of the system frequency is done via the selected voltage or current
input
in accordance with IEC 61000-4-30
din
of the currents
• Disturbance logger: Definition of parameters for monitoring the PQ events voltage dip, voltage
interruption and voltage swell
• Mean-values | standard quantities: Interval time and synchronization source for the predefined
power mean values
• Mean-values | user defined quantities: Selection of up to 12 quantities for determining their mean-
values and selection of their common interval and synchronization source
• Bimet al cu rren t : Selection of the response time for determining bimetal currents
• Meters | Standard meters: Tariff switching ON/OFF, meter resolution
• Meters | User defined meters: Base quantities (Px,Qx,Q(H1)x,Sx,Ix), Tariff switching ON/OFF,
meter resolution
• Meters | Meter logger: Selection of the reading interval
PM 1001606 000 07 Device handbook CENTRAX CU3000-CU5000 43/106

• Digital inputs: Debounce time (minimum pulse width) and polarity of the digital input
• Fault current: Configuration of the fault current channels, especially alarm and prewarning limits,
transformer ratios as well as response and dropout delay
• Security system: Definition of password and password protection active/inactive
• Demo mode: Activation of a presentation mode; measurement data will be simulated. Demo mode
is automatically stopped when rebooting the device.
• Device tag: Input of a free text for describing the device
7.5.2 Configuration via web browser
It’s recommended to use either Google-Chrome or Firefox as browser.
Internet Explorer works with limitations only (partly missing texts, firmware update not possible)
For configuration via web browser use the device homepage via http://<ip_addr>. The default IP address
of the device is 192.168.1.101.
This request works only if device and PC are in the same network when applying the subnet mask
(examples
).
PM 1001606 000 07 Device handbook CENTRAX CU3000-CU5000 44/106

Via WEB-GUI all device settings can be performed as via the local GUI. Possibly modifications needs to
be saved in the device, before all parameters have been set. In such a case the following message
appears:
If this request is not confirmed unsaved modifications of the present device configuration ma y get lost.
Loading / saving configuration files
The user can save the present device configuration on a storage media and reload it from there. The
storage or load procedure varies depending on the used browser.
Loading a configuration file from a storage media
The configuration data of the selected file will be directly loaded into the device. The
values in the WEB-GUI will be updated accordingly . Normally devices differ in the
settings of network resp. Modbus parameters and device name. Thus when loa ding the
file you can choose, whether the appropriate settings of the device should be retained or
overwritten by the values in the file to be uploaded.
Storing the current parameter settings of the WEB-GUI into the device
Saving the device configuration to a storage media
Attention: Modifications in the WEB-GUI, which haven’t been stored in the device, will
not be written to the storage media.
PM 1001606 000 07 Device handbook CENTRAX CU3000-CU5000 45/106

7.6 Monitoring fault-currents
Each (optional) fault current module provides two channels for monitoring residual or fault current. For
each of the channels an alarm and a prewarning limit can be defined, which can be used as follows:
… Activating a summary alarm
… Entry into the alarm list, if the state of the alarm limits monitoring changes or when a breakage
occurs (2mA input only)
… Entry into the event list, if the state of the prewarning limits monitoring changes
And via PLC application:
… as source for digital outputs
… the value of the individual fault currents can also be output via the analog outputs
The present values of the monitored fault currents are visible via the menu of the instantaneous values:
when the alarm limit is violated or a breakage occurs (2mA input only)
Meaning of the used symbols
Current value normal
Prewarning limit violated
Alarm limit violated
Alarm: Configured limit for ON
Alarm: Configured limit for OFF
Prewarning: Configured limit for ON
Prewarning: Configured limit for OFF
Breakage of measurement line detected
PM 1001606 000 07 Device handbook CENTRAX CU3000-CU5000 46/106

Summary alarm
The summary alarm combines the states of all channels of the optional failure-current monitoring. If either
an alarm state or a breakage of the measurement line (2mA inputs only) is detected the summ ary alarm is
directly activated.
Alarm via local GUI Alarm via WEB-GUI
Alarm display
The symbol arranged in the status bar signalizes active alarms.
Acknowledgment: By acknowledging the summary alarm, the user confirms that he has recognized that
an alarm state occurred. The acknowledgment is done automatically as soon as the user selects the
alarm list to be displayed either locally or via web browser or if the alarm state no longer exists. By
acknowledging only the flashing of the alarm symbol stops, the symbol itself remains statically displayed
until none of the fault current channels is in the alarm state.
PM 1001606 000 07 Device handbook CENTRAX CU3000-CU5000 47/106

7.7 Data recording
The optional data logger provides long-term recordings of measurement progressions and events. The
recording is performed in endless mode (oldest data will be deleted, as soon as the associated memory is
full). Depending on the version ordered, the following data groups are available:
Group Data type Request
• Mean value logger
• Meter logger
• Event and alarm list
• Operator list
• Disturbance
recorder
Periodical data
Events
Disturbance
recorder
• Mean-values versus time
• Periodical meter readings
In Form of a logbook with time information:
• Event list: Every state transition of monitoring
functions or limit values, classified as event
• Alarm list: Every state transition of monitori ng
functions or limit values, classified as alarm
• Operator list: The occurrence of system events, such
as configuration changes, power failures or reset
operations and much more
Events will be registered in the disturbance recorder list.
By selecting the entries:
• the course of the RMS values of all U/I
• the curve shape of all U/I
during the disturbance will be recorded
Energy
Events
Events
7.7.1 Periodical data
Configuration of the periodical data recording
The recording of all configured mean-values and meters is started automatically. The recording of the
mean-values is done every when the appr opri ate av era gin g interval expires. For meters the reading
interval can be configured, individually for standard and user-defined meters.
Displaying the chronology of the mean values
The chronology of the mean values is available via the menu Energy and is divided in two groups:
• Pre-defined power mean values
• User-defined mean values
Selection of the mean values group
PM 1001606 000 07 Device handbook CENTRAX CU3000-CU5000 48/106

The selection of the mean-value quantity to
display can be performed via choosing the
corresponding register. Three different kind of
displays are supported:
• Daily profile: Hourly mean-values will be
shown, independently of the real averaging
time
• Weekly profile
• Table: Listing of all acquired mean-v alu es in
the sequence of the real averaging interval
The graphical representation allows to compare
directly the values of the previous day resp.
week.
By selecting the bars you may read the
associated values:
• Mean-value
• Min. RMS value within the interval
Weekly display
• Max. RMS value within the interval
Weekly display: Reading
Mean values in table format
PM 1001606 000 07 Device handbook CENTRAX CU3000-CU5000 49/106

Displaying the chronology of meter contents
The chronology of meters is available via the menu Energy and is divided in two groups:
• Pre-defined meters
• User-defined meters
From the difference of two successive meter readings the energy consumption for the dedicated time
range can be determined.
Selection of the meter logger group
Meter content readings in table form
Displaying data locally
The selection works in principle in the same way as with the WEB-GUI. There are the following
differences:
• The individual measured quantities are arranged in a display matrix and can be selected via navigation.
• The number of displayable meter readings is limited to 25
• The time range of the mean values is limited to the present day resp. the present week. There is no
possibility for navigation.
PM 1001606 000 07 Device handbook CENTRAX CU3000-CU5000 50/106

Data export as CSV file
Via the time range of the data to export can be selected. A
CSV (Comma separated value) file will be generated. This can be
imported als a text file to Excel, with comma as a separator.
The same file contains data for all quantities of the respective
group.
7.7.2 Events Displaying of event entries
Event lists are a kind of loogbook. The occurrence of monitored events is recorded in the appropriate list
with the time of its occurrence.
Example of an operator list
Displaying data locally
The selection works in principle in the same way as with the WEB-GUI. There is the following difference:
• The number of displayable events is limited to 25
PM 1001606 000 07 Device handbook CENTRAX CU3000-CU5000 51/106

7.7.3 Disturbance recorder
Configuration of the events to record
The device monitors the events voltage dip, swell and interruption. The user can define the threshold
levels for these events in the menu Settings | Disturbance Logger.
Display of disturbance recordings (locally)
Recorded disturbances are available in the form of a logbook. Each detected disturbance is entered into
the disturbance recorder list with the time of its occurrence. By selecting a list entry the graphical display
of the measured values during this event is entered. The following presentations are available:
• Half cycle RMS curves of all voltages, all currents, all voltages and currents
• Curve shapes of all voltages, all currents, all voltages and currents
Display matrix on the local display
PM 1001606 000 07 Device handbook CENTRAX CU3000-CU5000 52/106

Restriction of the quantities to display on the local display
Voltage display
Current display
Mixed display
The user can adapt the displayed information to its needs. Once the graphic is displayed, the setting
window for the selection of the quantities to display is entered by pressing <OK>.
Display of disturbance recordings (WEB-GUI)
As with the local GUI, recorded disturbances are available in the form of a logbook. By selecting a list
entry the graphical display of the measured values during this event is entered.
List of disturbance recordings
Graphical display of a disturbance recording
PM 1001606 000 07 Device handbook CENTRAX CU3000-CU5000 53/106

7.7.4 Micro SD card (CU3000 only)
Data stored on the SD card can be accessed only as long as the card is
Devices with data logger are supplied with a micro SD-Card, which provides long recording times.
Activity
The red LED located next to the SD card signalizes the logger activity. When data is written to the SD
card the LED becomes shortly dark.
Exchanging the card
For exchanging the SD card the removal key needs to be pressed. Once the LED becomes green the
card is logged off and can be removed. To remove the card, press it slightly into the device to release the
locking mechanism: The card is pushed out of the device.
If the SD card is not removed within 20s the exchanging procedure is cancelled and the card will be
mounted to the system again.
Data cannot be temporarily stored in the device. If there is no SD card in the device no recordings can be
done.
in the device. Stored data may be read and analyzed via the webpage
of the device or in reduced manner via display only. The content of the
SD card cannot be read using a Windows PC.
Thus before removing the SD card from the device, all data need to be
read via Ethernet interface.
PM 1001606 000 07 Device handbook CENTRAX CU3000-CU5000 54/106

7.8 Timeouts
Devices with display are designed for displaying measurements. So, any other procedure will be
terminated after a certain time without user interaction and the last active measurement image will be
shown again.
Menu timeout
A menu timeout takes effect after 2 min. without changing the present menu selection. It doesn’t matter if
the currently displayed menu is the main menu or a sub-menu: The menu is closed and the last active
measurement image is displayed again.
Configuration timeout
After 5 min. without interaction in a parameter selection or during entering a value in the settings menu,
the active configuration step is closed and the associated parameter remains unchanged. The next step
depends on what you have done before:
• If the user did not change configuration parameters before the aborted step, the main menu will be
displayed and the device starts to monitor a possible menu timeout.
• If the user changed configuration parameters before the aborted step, the query “Store configuration
changes?” is shown. If the user does not answer this query within 2 min. this dialogue is closed: The
changed configuration will be stored and activated and then the last active measurement image is
displayed again.
PM 1001606 000 07 Device handbook CENTRAX CU3000-CU5000 55/106

8. CODESYS Quick Start
CODESYS is a hardware independent developing environment which can be used to create control
applications on a target system (here CENTRAX CUx000). For creating the application any of the
programming languages according IEC 61131-3 can be used.
A detailed description of CODESYS is available via the help menu inside the developing environment.
The following information is a brief introduction to the operation of CODESYS.
8.1 CODESYS development environment
In order to be able to use the control functionality of the devices of the CENTRAX series the CO DE S YS
development environment is required. This can be downloaded free of charge from our homepage
http://www.camillebauer.com/cu3000-en or http://www.camillebauer.com/cu5000-en
in a version tested with the devices. All necessary licenses are stored in the hardware and are therefore
included in the scope of supply.
Install the CODESYS development environment on your PC
8.2 CENTRAX device description
For CENTRAX devices to be used in the development environment as a hardware resource resp. target
platform, it is necessary to install a corresponding device description file. This file describes the
possibilities of the device. Once it is installed, CENTRAX devices are available in the device list and their
functionality can be used.
The device decription can directly be downloaded from the device using its webpage. To do so, enter the
IP address of the device in your browser, e.g. 192.168.62.214 as shown below. The device description
can be downloaded via the service menu using CODESYS
package/. Alternatively the file can also be downloaded from our website
Download. The file is stored in the folder
http://www.camillebauer.com/cu3000-en or http://www.camillebauer.com/cu5000-en.
PM 1001606 000 07 Device handbook CENTRAX CU3000-CU5000 56/106

The device descriptio n can then be insta ll ed in two wa ys .
a) File | New Proj ec t
Standard project
Double click on the device description file CENTRAX_CUx000_<version>.package
The prerequisite is the installed CODESYS development environment and sufficient user rights.
Via Tools | Package Manager in the CODESYS development environment
You may need to run the CODESYS development environment with administrative privileges.
8.3 Create a project
b) Next to Device se lect the perform ance class ( Basic, Advanced, Prof essional) of the target device, e.g.
CU3000/CU5000 Basic, at PLC_PRG select the programming language to be used for creating the
application.
PM 1001606 000 07 Device handbook CENTRAX CU3000-CU5000 57/106

8.4 CU3000/CU5000 Device tree
1
2 3 4
The new created project is now visible on the left side of the main window. The device tree contains the
application , the measurement image , the input and outputs and an additional Modbus image .
8.5 Selection of the I/O extension modules
The I/O options can vary depending on the device version ordered. So, before the corresponding I/O
channels can be used by the control application they have to be selected.
The options need to be configured in the device tree of the project via I/O option x. For a CU3000 all
I/O options may be assigned, for a CU5000 option 1 and 2 only. Right click on the field <Empty> and
select Plug Device to open the appropriate configuration window.
PM 1001606 000 07 Device handbook CENTRAX CU3000-CU5000 58/106

Select the correct module and confirm via „Plug Device“.
Repeat this procedure until all used options ha ve bee n plugge d in. Leave all unused modules or not
control relevant modules such as UPS empty.
8.6 Using the Modbus master functionality
For the performance classes ADVANCED and PROFESSIO NAL Modbus interfaces can also be used to
read measurement data from other devices. For the Ethernet interface this master functionality can be
used in parallel to the existing Modbus/TCP server functionality.
For the Modbus/RTU interface via RS485 the slave mode is deactivated as soon as
the master functionality is used.
Building-up a master/server or master/slave structure is done in four steps:
a) Add a field-bus (Ethernet or Modbus RS-485)
b) Add the corresponding Master functionality
c) Parametrization of the Master
d) Add devices to the Master. You may choose from different measurement devices of Camille Bauer
and Gossen Metrawatt with a predefined Modbus image respectively direct selectable
measurements. For third party products a generic device is available, for which measurements can
be added manually.
The principle is shown on the following pages.
PM 1001606 000 07 Device handbook CENTRAX CU3000-CU5000 59/106

Add device to CUx000
Select interface: Modb us RS-485 or Ethernet
Add Modbus RTU Master to RS-485 Add Modbus TCP to Ethernet
PM 1001606 000 07 Device handbook CENTRAX CU3000-CU5000 60/106

Parametrization of the Modbus RTU interface
The Ethernet interface does not require separate
As the RS-485 Modbus / RTU slave interface is deactivated when the master is activated, the device settings
of this communication interface are no longer active. The transmission parameters of the RS-485 must
therefore be set here.
settings. The network parameters of the device settings
are applied. To prevent warnings in the CODESYS
environment the interface can be set to eth0, wh ic h
corresponds to the Ethernet settings of the device.
Connect a device to the master (here to Modbus RTU)
Example: Connecting a SINEAX DM5F
As long as the above window is displayed further devices can be selected and connected to the master using
"Add device".
PM 1001606 000 07 Device handbook CENTRAX CU3000-CU5000 61/106

Device address Modbus/RTU
IP address and TCP port for Modbus TCP Slave
Add the measurements to be read from the device
The Modbus interface allows reading single words or a multiple of
them. The data type is determined by the assignment to a variable or
a variable group.
Measurements can be queried individually or several at the same
time. Individual readings typically have a length of 2 words, shown
above for the queries 0 ... 2 (U1N, U2N, U3N). Each value can be
selected directly from the list of available measurements using the
opposite mask. The trigger can be used to define whether the value
is to be polled cyclically or dependent on the state of a logical
variable. The available measured quantities result from the selected
access type.
With only one query also several measurements can be read
simultaneously, shown above for the query 3, which provides the
values U1N, U2N and U3N. In contrast to the queries 0 ... 2, where a
direct assignment to one REAL variable is possible, the result of
query 3 is assigned to a structure consisting of 3 REAL variables.
Assignment of the acquired measurement to variables
PM 1001606 000 07 Device handbook CENTRAX CU3000-CU5000 62/106

8.7 Creating the CODESYS application
At this stage in the project the control application needs to be created. For that a POU (Programmable
Organisation Unit) with name PLC_PRG was generated during project creation. Double click on this item
to open the editor view.
In the declaration part variables and other POUs may be declared, which will be needed in this
PLC_PRG. In the bottom part the program code will be written. On the right side a ToolBox is
located, from where objects may be included into the program via Drag & Drop. The tool box depends on
the programming language selected.
The further process for creating an application is not part of these brief instructions.
8.7.1 Using remanent variables
The device stores remanent variables in such a way that their contents remains unchanged even if the
device is restarted or after a power-down.
The declaration of remanent variables is done by means of VAR RETAIN. The memory area for RETAIN
variables is limited to 1000 bytes.
The content of remanent variables is reset under two conditions:
• Reset cold: All VAR and VAR RETAIN variables are reset
• Reset origin: When the PLC is reset to its original state, the application is deleted and thus all
assiociated variables
The various reset options are described in a separate chapter
8.7.2 Using the data logger
Exclusively for devices with performance class PROFESSIONAL a facility is provided to record data or
messages via CODESYS over a longer period of time.
To be able to use recording functions, the CENTRAX library must be added, which is part of the device
description. This is done using the library manager.
.
PM 1001606 000 07 Device handbook CENTRAX CU3000-CU5000 63/106

Recording capability Associated function
20 channels REAL (32-bit floa t ing point) stat := LogAdd_REAL(channel, value, timestamp)
20 channels LREAL (64-bit floating point) stat := LogAdd_LREAL(channel, value, timestamp)
20 channels BOOL, e.g. for events stat := LogAdd_BOOL(channel, value, timestamp)
with: stat: return value, TRUE if executed successfully
channel: recording channel 1…20
value: value to store
timestamp: [ms] since 1.1.1970 00:00:00; set it to 0 to use the present system time
Amount of time per time unit
With more than approx. 17 function calls per second, functional failures (return value FALSE) can occur.
Channel description / unit
REAL / LREAL: Per recoding channel a description and a unit can be defined
BOOL: Per recoding channel an event text can be associated
Displaying CODESYS recordings
• Data is either available as a value table or event list
• Data can be exported exported in CSV format
PM 1001606 000 07 Device handbook CENTRAX CU3000-CU5000 64/106

8.8 Creating own visualizations
Exclusively for devices with performance class PROFESSIONAL, it is possible to create own
visualizations by menas of CODESYS, both for the local display as well as for WEB access.
8.8.1 Adding a visualization to the project
In the CODESYS project right-click on Application, Add object and then select Visualisization. In the
Window Add visualisization assign a name to the visualization.
Via [VISU_TASK] the features of the visualization
application can be defined
Using the [Visualization Manager] the features of the
target resp. WEB visualiz atio n can be modi fied
[Image_1] is the area for creating the visualization
8.8.2 Target visualization (TargetVisu)
If the device is equipped with a local display, user-defi ned images can be used to display process data.
Usable resolution
• CU3000: 800 x 480 px
• CU5000: 320 x 240 px
The device keys (ESC, Up, Down, Left, Right) can be freely used for switching the displayed image, for
selections or control purposes.
PM 1001606 000 07 Device handbook CENTRAX CU3000-CU5000 65/106

Via device settings you can define if the standard images or the user-defined images of the device have
to be displayed. A direct switching during operation is not possible.
8.8.3 WEB visualizations (WebVisu)
The user can define multiple web pages with any mechanism for changing the displayed image. The
visualization begins with a definable start visualization. The starting page can be viewed in two ways:
a) http://<IP_ADDR>:8080/<NAME>.htm
<IP_ADDR>: IP address of the device, e.g. 192.168.1.101
<NAME>: Name of the .htm file used as start page, z.B. webvisu (see below)
b) Direct call via device website
Hint
This call works only if the name of the start
visualization is left at the default webvisu.htm.
PM 1001606 000 07 Device handbook CENTRAX CU3000-CU5000 66/106

8.9 Establishing a connection to the device
Double click on Device (CU3000/CU5000 Basic)
in the device tree. The below shown view will be
opened.
In the communication settings click on Scan Network. A list will be shown with all the devices visible from
your PC.
The device is best identified by its hostname, defined in the Ethernet communication settings. In the
above example the hostname CU3000TEST was assigned, the other device still has the initial setting
CU3000xxxxx.
To be sure that you are communicating with the right device, select the device and click on Wink: The
display of the associated device will start blinking for a few seconds.
Use OK to confirm your device selection. If OK is greyed out, even if “Wink” works fine, there may be a
mismatch in the performance class used in the project (e.g. BASIC) and the type of the device (e.g.
ADVANCED).
PM 1001606 000 07 Device handbook CENTRAX CU3000-CU5000 67/106

Identification is possib le as w ell via the de vice ad dres s , in the above example 0301.A000.06D6. This
address may be verified via the device webpag e.
In the service menu go to CODESYS | Device information:
8.10 Loading the application to the device
• Load the application to the device by going online with a click to
• If the device description in the device does not correspond to the version used in the CODESYS-IDE
for example the following warning message is displayed:
In this case the device description of the project can be updated. For that it needs to be installed in the
CODESYS-IDE (see chapter 8.2
). Then the project can be updated:
PM 1001606 000 07 Device handbook CENTRAX CU3000-CU5000 68/106

If the initial situation is reversed, i.e. the version of the device description used in the project is higher
than the one of the device, either the firmware of the device must be updated or an older version of the
device description must be used in the project. New firmware versions can be downloaded free of
charge from our website
http://www.camillebauer.com/cu3000-en or http://www.camillebauer.com/cu5000-en
.
• If there is no application on the device, you will be asked to proceed with the download. Confirm with
Yes.
• The program will be loaded to the device.
• The PLC is now connected and the application is in the STOP state. Change to RUN by clicking on .
PM 1001606 000 07 Device handbook CENTRAX CU3000-CU5000 69/106

The present state of the application can also be seen vi a webpa ge: Service | CODESYS | PLC
Using the switch in the column „Change operating state“ the application may be stopped and started
again at any time.
For devices with display the state of the application may be checked and changed also locally at the
device: Service | COD ES Y S | PLC
PM 1001606 000 07 Device handbook CENTRAX CU3000-CU5000 70/106

8.11 Loading the application on-site
8.11.1 Creating a boot application
For on-site loading of the control application into the device, first you have to create a boot application in
the CODESYS development environment.
Two files will be created: <appl_name>.app und <appl_name>.crc. The user has to pack them in a ZIP file.
8.11.2 Deleting the active application
An application already running must to be deleted.
8.11.3 Loading the application
When loading the application the previously created ZIP file must be uploaded.
PM 1001606 000 07 Device handbook CENTRAX CU3000-CU5000 71/106

8.11.4 Starting the application
The uploaded application is not automatically started. Use the switch in the column „Change operating
state“ to start the applicati o n.
Only applications which have been uplo aded to the device via ZIP file can be downloaded to a PC
again. The originally uploaded ZIP file will be exported.
8.11.5 Resetting the active application
The active application may be reset (R es et warm
).
PM 1001606 000 07 Device handbook CENTRAX CU3000-CU5000 72/106

8.12 Reset
The PLC supports the reset operations described below.
Version Execution System behavior
• Application is stopped
• Standard variables (VAR) are initialized
• Remanent variables (VAR RETAIN) keep their
values
• Application is stopped
• All variables (VAR, VAR RETAIN) are initialized
Reset warm
Reset cold
• Res et via webpage
• Reset warm via
CODESYS
• Download application to
the device via IDE
• Loading the application via
webpage
• Reset cold via CODESYS
• Deleting the application via
Reset origin
Reset via CODESYS-IDE
webpage
• Reset origin via
CODESYS
Reset PLC to ist origin
• Application is stopped and deleted from the device
• All variables (VAR, VAR RETAIN) are initialized
PM 1001606 000 07 Device handbook CENTRAX CU3000-CU5000 73/106

8.13 Project management
Source download to the device
Source upload from the device
Source download to the device
The project created via CODESYS-IDE can be saved in the device. This
simplifies the modification of the application on-site.
Hint: Initially the source code is not protected, but CODESYS supports a
user management system and data encryption via certificates.
If the source code has been saved in the device, it may be uploaded again
using the CODESYS development environment. This simplifies the
modification of the application on-site.
Hint: Initially the source code is not protected, but CODESYS supports a
user management system and data encryption via certificates.
8.14 Services
Unless otherwise agreed, the creation of the control application is the responsibility of the user. Thus, the
user is solely responsible for the application he has created. Camille Bauer Metrawatt AG cannot
guarantee that these applications will work properly and will not provide free support for error analysis.
In addition to the product CENTRAX CUx000 itself, Camille Bauer Metrawatt AG (and selected
distributors) offers the following services:
• Creating the control application according to a customer specification
• Support Package when the control application is created by the customer
For more details on the services offered, please contact your local sales organization.
8.13 Example projects
For an easy beginning you may find example projects for a few control applications on our website:
http://www.camillebauer.com/cu3000-en or http://www.camillebauer.com/cu5000-en
.
PM 1001606 000 07 Device handbook CENTRAX CU3000-CU5000 74/106

9. Service, maintenance and dispos a l
9.1 Calibration and new adjustment
Each device is adjusted and checked before delivery. The condition as supplied to the customer is
measured and stored in electronic form.
The uncertainty of measurement devices may be altered during normal operation if, for example, the
specified ambient conditions are not met. If desired, in our factory a calibration can be performed,
including a new adjustment if necessary, to assure the accuracy of the device.
9.2 Cleaning
The display and the operating keys should be cleaned in regular intervals. Use a dry or slightly moist cloth
for this.
Damage due to detergents
Detergents may not only affect the clearness of the display but also can damage the device.
Therefore, do not use detergents.
9.3 Battery
The device contains a battery for buffering the internal clock. It cannot be changed by the user. The
replacement can be done at the factory only.
If the UPS option is implemented, the associated battery pack needs to be exchanged regularly. For more
information see chapter 5.11
9.4 Disposal
.
The product must be disposed in compliance with local regulations. This particularly applies to the built-in
battery for the RTC and the battery pack of the UPS option.
PM 1001606 000 07 Device handbook CENTRAX CU3000-CU5000 75/106

10. Technical data
Inputs
Nominal current: adjustable 1...5 A; max. 7.5 A (sinusoidal)
Measurement category: CAT III (300V)
Consumption: ≤ I
Overload capacity: 10 A continuous
100 A, 5 x 1 s, interval 300 s
Nominal voltage: 57.7…400 V
Measurement max.: CU3000: 480 V
Measurement category: CAT III (600V)
Consumption: ≤ U
Impedance: 1.54 MΩ per phase
Overload capacity: continuous: 480 V
10 x 1 s, Intervall 10s: 800 V
Systems: Single phase
Split phase (2-phase system)
3-wire, balanced load
3-wire, balanced load, phase shift (2xU,1xI)
3-wire, unbalanc ed lo ad
3-wire, unbalanc ed lo ad, Ar on con nec ti on
4-wire, balanced load
4-wire, unbalanc ed lo ad
4-wire, unbalanc ed lo ad, Open-Y
Nominal frequency: 42...50...58Hz or 50.5...60...69.5Hz, configurable
Sampling rate: 18 kHz
2
x 0.01 Ω per phase
, 100...693 VLL;
LN
, 832 VLL (sinusoidal); CU5000: 520 VLN, 900 VLL (sinusoidal)
LN
2
/ 1.54 MΩ per phase
, 832 VLL (CU3000); 520 VLN, 900 V
LN
,1386 VLL
LN
(CU5000)
LL
Measurement uncertainty
Reference conditions: Acc. IEC/EN 60688, ambient 15…30°C,
sinusoidal input signals (form factor 1.1107), no fixed frequency for sampling,
measurement time 200ms (10 cycles at 50Hz, 12 cycles at 60Hz)
Voltage, current: ± 0.1%
Neutral current: ± 0.2%
Power: ± 0.2%
1) 2)
1)
(if calculated)
1) 2)
Power factor: ± 0.2°
Frequency: ± 0.01 Hz
Imbalance U, I: ± 0.5%
Harmonics: ± 0.5%
THD U, I: ± 0.5%
Active energy: Class 0.5S, EN 62053-22
Reactive energy: Class 0.5S, EN 62053-24
Measurement with fixed system frequency:
General ± Basic uncertainty x (F
config–Factual
) [Hz] x 10
Imbalance U ± 2% up to ± 0.5 Hz
Harmonics ± 2% up to ± 0.5 Hz
THD, TDD ± 3.0% up to ± 0.5 Hz
1)
Related to the nominal value of the basic quantity
2)
Additional uncertainty if neutral wire not connected (3-wire connect ion s)
• Voltage, power: 0.1% of measured value; load factor: 0.1°
• Energy: Voltage influence x 2, angle influence x 2
PM 1001606 000 07 Device handbook CENTRAX CU3000-CU5000 76/106

Zero suppression, range limitations
The measurement of specific quantities is related to a pre-condition which must be fulfilled, that the
corresponding value can be determined and sent via interface or displayed. If this condition is not fulfilled,
a default value is used for the measurement.
Quantity Condition Default
Voltage Ux < 1% Ux
Current Ix < 0,1% Ix
PF Sx < 1% Sx
QF, LF, tanφ S x < 1% Sx
Frequency voltage and/or current input too low 1) Nominal frequency
Voltage unbalance Ux < 5% Ux
Current unbalance mean value of phase currents < 5% Ix
Phase angle U at least one voltage Ux < 5% Ux
Harmonics U, THD-U fundamental < 5% Ux
1)
Specific levels depend on the device configuration
0.00
nom
0.00
nom
1.00
nom
0.00
nom
0.00
nom
0.00
nom
120°
nom
0.00
nom
Power supply via terminals 13-14
Measurement category: CAT III (300V)
Nominal voltage: (see nameplate)
• CU3000 V1: 110…230V AC 50/60Hz / 130…230V DC ±15% or
V2: 24...48V DC ±15% or
V3: 110…200V AC 50/60Hz / 110…200V DC ±15%
• CU5000 V1: 100…230V AC / DC ±15% or
V2: 24...48V DC ±15%
Consumption: depends on the device hardware used
≤ 20 VA, ≤ 8.5W (CU3000), ≤ 12W (CU5000)
Available inputs / outputs and functional extensions
Basic unit
• 1 digital input
• 2 digital outputs
Extensions
Optional modules
• 2 relay outputs with changeover contacts
• 2 bipolar analog outputs
• 4 bipolar analog outputs
• 4 passive digital inputs
• 4 active digital inputs
• GPS connection module
• 2 failure current channels (residual or earth current)
• CU3000: Up to 4 I/O extensions may be present in the device. Only one module can be equipped with analog out puts.
• CU5000: Up to 2 I/O extensions may be present in the device.
PM 1001606 000 07 Device handbook CENTRAX CU3000-CU5000 77/106

I/O interface
Analog outputs via plug-in terminals
Linearization: Linear, kinked
Range: ± 20 mA (24 mA max.), bipolar
Uncertainty: ± 0.2% of 20 mA
Burden: ≤ 500 Ω (max. 10 V / 20 mA)
Burden influence: ≤ 0.2%
Residual ripple: ≤ 0.4%
Response time: 220…420 ms
Relays
Contact: changeover contact
Load capacity: 250 V AC, 2 A, 500 VA
30 V DC, 2 A, 60 W
Passive digital inputs
Nominal voltage 12 / 24 V DC (30 V max.)
Input current < 7mA
Logical ZERO - 3 up to + 5 V
Logical ONE 8 up to 30 V
Minimum pulse width 70…250ms
Active digital inputs
Open circuit voltage ≤ 15V
Short circuit current < 15mA
Current at R
Minimum pulse width 70…250ms
Digital outputs
Nominal voltage 12 / 24 V DC (30 V max.)
Nominal current 50 mA (60 mA max.)
Load capability 400 Ω … 1 MΩ
Fault current detection
Number of channels 2; each channel provides two measurement ranges (2mA, 1A)
Zero suppression Measurement < 0.2% of measurement range
Measurement range 1A
Application: Direct measurement of a fault or earth wire current
Measurement transformer: Current transformer 1/1 up to 1000/1A
Instrument security factor FS5
Rated output 0.2 up to 1.5 VA
Measurement range: I
Overload: 2A continuous; 20A, 5 x 1s, interval 300s
Self-consumption: ≤ I2 x 0.1 Ω
Monitoring: Alarm limit 0.03 … 1000 A (2 up to 100% of primary measurement range)
Measurement range 2mA
Application: Residual current monitoring (RCM)
Measurement transformer: Residual current transformer 500/1 up to 1000/1A
Rated burden 100 Ω / 0.025 VA up to 200 Ω / 0.06 VA
Measurement range: I
Overload: 40mA continuous; 200mA, 5 x 1s, interval 300s
Self-consumption: ≤ I2 x 64 Ω
Monitoring: Alarm limit 0.03 … 1 A
via plug-in terminals
via plug-in terminals
via plug-in terminals
=800Ω ≥ 2 mA
ON
via plug-in terminals
via plug-in terminals
= 1.0A (max. 1.2A; crest factor 3)
Rated
= 2mA (max. 2.4mA; crest factor 3)
Rated
PM 1001606 000 07 Device handbook CENTRAX CU3000-CU5000 78/106

Further settings
Alarm limit for OFF AUS: I
Prewarning limit: I
Prewarning AUS: I
= 90…75% *)
OFF
= 50%...(I
WARN
- (10…25%) *)
WARN
OFF
-1%) *)
Response delay: 1…10s, separately for alarm and prewarning
Dropout delay: 1…300s, separately for alarm and prewarning
*)
All percent values are related to the alarm limit (100%)
Interfaces
Ethernet via RJ45 socket
Protocol: Modbus/TCP, NTP, http
Physics: Ethernet 100BaseTX
Mode: 10/100 Mbit/s, full/half duplex, auto-negotiation
IEC61850 via RJ45 sockets, 2 equivalent ports
Protocol: IEC61850, NTP
Physics: Ethernet 100BaseTX
Mode: 10/100 Mbit/s, full/half duplex, auto-negotiation
Modbus/RTU via plug-in terminal (A, B, C/X)
Protocol: Modbus/RTU
Physics: RS-485, max. 1200m (4000 ft)
Baud rate: 9'600, 19'200, 38'400, 57'600, 115'200 Baud
Number of participants: ≤ 32
Internal clock (RTC)
Uncertainty: ± 2 minutes / month (15 u p to 30°C)
Synchronization: none, via Ethernet (NTP protocol) or GPS
Running reserve: > 10 years
Uninterruptible power supply (UPS)
Type: VARTA Easy Pack EZPAckL, UL listed MH16707
Nominal voltage: 3.7V
Capacity: 1150 mAh min., 4.5 Wh
Operating duration: 5 times 3 minutes
Life time: 3 up to 5 years, depending on operating and ambient conditions
Ambient conditions, general information
Operating temperature: • Device without UPS: –10 up to 15 up to 30 up to + 55°C
• Device with UPS: 0 up to 15 up to 30 up to + 35°C
Storage temperature: Base device: –25 up to + 70°C;
Battery pack UPS: -20…60°C (<1 month); -20°…45°C (< 3 months);
-20…30°C (< 1 year)
Temperature influence: 0.5 x measurement uncertainty per 10 K
Long term drift: 0.5 x measurement uncertainty per year
Others: Usage group II (EN 60 688)
Relative humidity: < 95% no condensation
Altitude: ≤ 2000 m max.
Device to be used indoor only!
PM 1001606 000 07 Device handbook CENTRAX CU3000-CU5000 79/106

Mechanical attributes
Housing material: Polycarbonate (Makrolon)
Flammability class: V-0 acc. UL94, non-dripping, free of halogen
Weight: 800 g (CU3000), 600g (CU5000)
Dimensions: Dimensional drawings
Vibration withstand (test according to DIN EN 60 068-2-6)
Acceleration: • De vic e wit h display: ± 0.25 g (operating); 1.20 g (storage)
• Device without disp lay: ± 2 g
Frequency range: 10 … 150 … 10 Hz, rate of frequency sweep: 1 octave/minute
Number of cycles: 10 in each of the 3 axes
Safety
The current inputs are galvanically isolated from each other
Protection class: II (protective ins ulat ion, vo lt age inp uts via protective impedance)
Pollution degree: 2
Protection: IP40 (front), IP30 (housing), IP20 (terminals)
Measurement category: CAT III
Rated voltage Power supply V1: 100…230V AC / DC (CU3000) or
(versus earth): 100…230V AC / DC (CU5000)
Power supply V2: 24...48V DC ±15%
Power supply V3: 110…200V AC / 110…200V DC ±15% (CU3000)
Relay: 250 V AC (CAT III)
I/O’s: 24 V DC
Test voltages: Test time 60s, acc. IEC/EN 61010-1 (2011)
1)
• power supply versus inputs U
• power supply versus inputs I: 3000V AC
• power supply V1 versus bus, I/O’s: 3000V AC
• power supply V2 versus bus, I/O’s: 880V DC
• inputs U versus inputs I: 1800V AC
• inputs U versus bus, I/O’s
• inputs I versus bus, I/O’s: 3000V AC
• inputs I versus inputs I: 1500V AC
1)
During type test only, with all pr o tective impedances removed
: 3600 V AC
1)
: 3600V AC
The device uses the principle of protective impedance for the voltage inputs
to ensure protection against electric shock. All circuits of the device are
tested during final inspection.
Prior to performing high voltage or isolation tests involving the voltage
inputs, all output connections of the device, especially analog outputs, digital
and relay outputs as well as Modbus and Ethernet interface, must be
removed. A possible high-voltage test between i n p u t and output circuits must
be limited to 500V DC, otherwise electronic components can be damaged.
PM 1001606 000 07 Device handbook CENTRAX CU3000-CU5000 80/106

Applied regulations, standards and directives
IEC/EN 61010-1 Safety regulations for electrical measuring, control and laboratory equipment
IEC/EN 61000-4-30 Ed.3 Power quality measurement methods
IEC/EN 61000-4-7 General guide on harmonics and interharmonics measurements
EN 50160 Voltage characteristics of electricity supplied by public distribution systems
IEC/EN 60688 Electrical measuring transducers for converting AC electrical variables into analog or
digital signals
DIN 40110 AC quantities
IEC/EN 60068-2-1/ Ambient tests
-2/-3/-6/-27: -1 Cold, -2 Dry heat, -3 Damp heat, -6 Vibration, -27 Shock
IEC/EN 61000-6-2 Electromagnetic compatibility (EM C)
61000-6-4 Generic standards for industrial environment
IEC/EN 61131-2 Programmable controllers - equipment, requirements and tests
(digital inputs/outputs 12/24V D C )
IEC/EN 61326 Electrical equipment for measurement, control and laboratory use - EMC requirements
IEC/EN 62053-31 Pulse output devices for electromechanical and electronic meters (S0 output)
IEC/EN 60529 Protection type by case
UL94 Tests for flammability of plastic materials for parts in devices and appliances
2011/65/EU (RoHS) EU directive on the restr ict ion of the use of cert ain haz ardo us substances
Warning
This is a class A product. In a domestic environment this product may cause radio interference in which
case the user may be required to take adequate measures.
This device complies with part 15 of the FCC:
Operation is subject to the following two conditions: (1) This device may not cause harmful interference,
and (2) this device must accept any interference received, including interference that may cause
undesired operation.
This Class A digital apparatus complies with Canadian ICES-0003.
PM 1001606 000 07 Device handbook CENTRAX CU3000-CU5000 81/106

11. Dimensional drawings
CENTRAX CU3000
CENTRAX CU5000
Dimensions Orientation
0…90° 0…90°
1)
______1)_______
Not allowed for device versions with UPS
All dimensions in [mm]
PM 1001606 000 07 Device handbook CENTRAX CU3000-CU5000 82/106

Annex
Voltage U
● ● ● √ √ √ √
● ● ● √ √ √
Voltage U2N
● ● ● √ √ √
Voltage U3N
● ● ● √ √
Voltage U12
● ● ● √ √ √ √ √
Voltage U23
● ● ● √ √ √ √ √
Voltage U31
● ● ● √ √ √ √ √
Zero displacement voltage UNE
● ● √ √ √ √ √
● ● √ √ √ √
Current I1
● ● √ √ √ √ √
Current I2
● ● √ √ √ √ √
● ● √ √ √ √
Neutral current IN
● ● √ √ √ √ √
Earth current IPE (calculated)
● ● √ √
Active power P
● ● √ √ √ √ √ √ √ √ √
Active power P1
● ● √ √ √
Active power P2
● ● √ √ √
Active power P3
● ● √ √
Fundamental active power P(H1)
● ● √ √ √ √ √ √ √ √ √
Fundamental active power P1(H1)
● ● √ √ √
Fundamental active power P2(H1)
● ● √ √ √
● ● √ √
Total reactive power Q
● ● √ √ √ √ √ √ √ √ √
Total reactive power Q1
● ● √ √ √
Total reactive power Q2
● ● √ √ √
Total reactive power Q3
● ● √ √
Distortion reactive power D
● ●
√ √ √ √ √ √ √ √ √ Distortion reactive power D1
● ●
√ √ √ Distortion reactive power D2
● ●
√ √ √ Distortion reactive power D3
● ●
√ √ Fundamental reactive power Q(H1)
● ●
√ √ √ √ √ √ √ √ √
Fundamental reactive power Q1(H1)
● ●
Fundamental reactive power Q2(H1)
● ●
√ √ √
Fundamental reactive power Q3(H1)
● ●
√ √
A Description of measured quantiti e s
Used abbreviations
1L Single phase sy ste m
2L Split pha se; system with 2 p ha ses and center tap
3Lb 3-wire system with balanced load
3Lb.P 3-wire system with balanced load, phase shift (only 2 voltages connected)
3Lu 3-wire system with unbalanced load
3Lu.A 3-wire system with unbalanced load, Aron connection (only 2 currents connected)
4Lb 4-wire system with balanced load
4Lu 4-wire system with unbalanced load
4Lu.O 4-wire system with unbalanced load, Open-Y (reduced voltage connection)
A1 Basic measurements
The basic measured quantities are calculated each 200ms by determining an average over 10 cycles at 50Hz resp.
12 cycles at 60Hz. If a measurement is available depends on the selected system.
Depending on the measured quantity also minimum and maximum values are determined and non-volatile stored with
timestamp. These values may be reset by the user via display, see resetting of measurements
.
Measurement
Voltage U1N
Current I
Current I3
Fundamental active power P3(H1)
present
max
min
1L
2L
3Lb
3Lb.P
3Lu
3Lu.A
4Lb
4Lu.O
4Lu
PM 1001606 000 07 Device handbook CENTRAX CU3000-CU5000 83/106
√ √ √

Measurement
Apparent power S
● ● √ √ √ √ √ √ √ √ √
Apparent power S1
● ● √ √ √
Apparent power S2
● ● √ √ √
● ● √ √
Fundamental apparent power S(H1)
● ● √ √ √ √ √ √ √ √ √
Fundamental apparent power S1(H1)
● ● √ √ √
● ● √ √ √
Fundamental apparent power S3(H1)
● ● √ √
Frequency F
● ● ● √ √ √ √ √ √ √ √ √ Power factor PF
● √ √ √ √ √ √ √ √ √
Power factor PF1
● √ √ √
Power factor PF2
● √ √ √
Power factor PF3
● √ √
PF quadrant I
● √ √ √ √ √ √ √ √ √
PF quadrant II
● √ √ √ √ √ √ √ √ √
PF quadrant III
● √ √ √ √ √ √ √ √ √
● √ √ √ √ √ √ √ √ √
Reactive power factor QF
● √ √ √ √ √ √ √ √ √
Reactive power factor QF1
● √ √ √
Reactive power factor QF2
● √ √ √
Reactive power factor QF3
● √ √
Load factor LF
● √ √ √ √ √ √ √ √ √
Load factor LF1
● √ √ √
Load factor LF2
● √ √ √
Load factor LF3
● √ √
cosφ (H1)
● √ √
√ √ √ √ √ √ √
● √
√ √
cosφ L2 (H1)
● √
√ √
cosφ L3 (H1)
●
√ √
cosφ (H1) quadrant I
● √ √ √ √ √ √ √ √
√
cosφ (H1) quadrant II
● √ √ √ √ √ √ √ √
√
cosφ (H1) quadrant III
● √ √ √ √ √ √ √ √
√
cosφ (H1) quadrant IV
● √ √ √ √ √ √ √ √
√
tanφ (H1)
● √ √
√ √ √ √ √ √ √
tanφ L1 (H1)
● √
√ √
tanφ L2 (H1)
● √
√ √
●
√ √
U
mean
=(U1N+U2N)/2
● √
U
mean
=(U1N+U2N+U3N)/3
● √
U
=(U12+U23+U31)/3
● √ √ √
I
mean
=(I1+I2)/2
● √
I
mean
=(I1+I2+I3)/3
● √ √ √
IMS, Average current with sign of P
● √ √ √ √ √ √ √ √ √
Phase angle between U1 and U2
● √ √ √ √ √
Phase angle between U2 and U3
● √ √ √ √ √
Phase angle between U3 and U1
● √ √ √ √ √
● √ √ √ √ √ √
Angle between U1 and I1
● √ √ √
Angle between U2 and I2
● √ √ √
Angle between U3 and I3
● √ √
Maximum ΔU <> Um 1)
● ● √ √ √ √ √
Maximum ΔI <> Im 2)
● ● √ √ √
√
2)
maximum deviation from the mean value of all currents (see A3)
●
Available via communication interface only
Apparent power S3
Fundamental apparent power S2(H1)
PF quadrant IV
present
max
min
1L
2L
3Lb
3Lb.P
3Lu
3Lu.A
4Lb
4Lu.O
4Lu
cosφ L1 (H1)
tanφ L3 (H1)
mean
Angle between U and I
1)
maximum deviation from the mean value of all voltages (see A3)
PM 1001606 000 07 Device handbook CENTRAX CU3000-CU5000 84/106

Reactive power
The power fact or PF gives the relation
Most of the loads consume a combination of ohmic and inductive current from the power system. Reactive
power arises by means of the inductive load. But the number of non-linear loads, such as RPM regulated
drives, rectifiers, thyristor controlled systems or fluorescent lamps, is increasing. They cause nonsinusoidal AC currents, which may be represented as a sum of harmonics. Thus the reactive power to
transmit increases and leads to higher transmission losses und higher energy costs. This part of the
reactive power is called distortion reactive power.
Normally reactive power is unwanted, because there is no usable active component in it. Because the
transmission of reactive power over long distances is uneconomic, it makes sense to install compensation
systems close to the consumers. So transmission capacities may be used better and losses and voltage
drops by means of harmonic currents can be avoided.
P: Active power
S: Apparent power including harmonic
components
S1: Fundamen tal appa rent power
Q: Total reactive power
Q(H1): Fundamental reactive power
D: Distortion reactive power
The reactive power may be divided in a fundamental and a distortion component. Only the fundamental
reactive power may be compensated directly by means of the classical capacitive method. The distortion
components have to be combated using inductors or active harmonic conditioners.
The load factor PF is the relation between active power P and apparent power S, including all possibly
existing harmonic parts. This factor is often called cosφ, which is only partly correct. The PF corresponds
to the cosφ only, if there is no harmonic content present in the system. So the cosφ represents the
relation between the active power P and the fundamental apparent power S(H1).
The tanφ is often used as a target quantity for the capacitive reactive power compensation. It
corresponds to the relation of the fundamental reactive power Q(H1) and the active power P.
Power factors
between active and apparent power. If
there are no harmonics present in the
system, it corresponds to the cosφ. The
PF has a range of -1...0...+1, where the
sign gives the direction of energy flow.
The load factor LF is a quantity derived
from the PF, which allows making a
statement about the load type. Only this
way it's possible to measure a range like
0.5 capacitive ... 1 ... 0.5 inductive in a
non-ambiguou s way.
The reactive power factor QF gives the
relation between reactive and apparent
power.
Example from the perspective of an energy consumer
PM 1001606 000 07 Device handbook CENTRAX CU3000-CU5000 85/106

Zero displacement voltage UNE
Starting from the generating system with star point E
(which is normally earthed), the star point (N) on load
side is shifted in case of unbalanced load. The zero
displacement voltage between E und N may be
determined by a vectorial addition of the voltage vectors
of the three phases:
UNE = - (U1N + U2N + U3N ) / 3
A displacement voltage may also occur due to
harmonics of order 3, 9, 15, 21 etc., because the
dedicated currents add in the neutral wire.
Earth fault monitoring in IT systems
Via the determination of the zero displacement voltage it's possible to detect a first earth fault in an
unearthed IT system. To do so, the device is configured for measurement in a 4-wire system with
unbalanced load and the neutral connector is connected to earth. In case of a single phase earth fault
there is a resulting zero displacement voltage of ULL/ √3. The alarming may be done e.g. by means of a
relay output.
Transformer, secondary side Load
Because in case of a fault the voltage triangle formed by the three phases does not change, the vo lta ge
and current measurements as well as the system power values will still be measured and displayed
correctly. Also the meters carry on to work as expected.
The method is suited to detect a fault condition during normal operation. A declination of the isolation
resistance may not be detected this way. This should be measured during a periodical control of the
system using a mobile system.
Another possibility to analyze fault conditions in a grid offers the method of the symmetrical components
as described in A3.
PM 1001606 000 07 Device handbook CENTRAX CU3000-CU5000 86/106

A2 Harmonic analysis
present
max
1L
2L
3Lb
3Lb.P
3Lu
3Lu.A
4Lb
4Lu.O
4Lu
THD Voltage U1N/U
● ● √ √ √ √ √ √
THD Voltage U2N
● ● √ √ √
THD Voltage U3N
● ● √ √
THD Voltage U12
● ● √ √ √
THD Voltage U23
● ● √ √ √
THD Voltage U31
● ● √ √ √
● ● √ √ √ √ √ √ √ √ √
THD Current I2
● ● √ √ √ √ √
THD Current I3
● ● √ √ √ √
TDD Current I1/I
● ● √ √ √ √ √ √ √ √ √
TDD Current I2
● ● √ √ √ √ √
TDD Current I3
● ● √ √ √ √
Harmonic contents 2nd...50th U1N/U
● ● √ √ √ √ √ √
Harmonic contents 2nd...50th U2N
● ● √ √ √
Harmonic contents 2nd...50th U3N
● ● √ √
Harmonic contents 2nd...50th U12
● ● √ √ √
● ● √ √ √
Harmonic contents 2nd...50th U31
● ● √ √ √
Harmonic contents 2nd...50th I1/I
● ● √ √ √ √ √ √ √ √ √
Harmonic contents 2nd...50th I2
● ● √ √ √ √ √
Harmonic contents 2nd...50th I3
● ● √ √ √ √
●
Available via communication interface only
The harmonic analysis is performed according IEC 61000-4-7 over 10 cycles at 50Hz resp. 12 cycles at
60Hz. If a measured quantity is available depends on the selected system.
Measurement
THD Current I1/I
Harmonic contents 2nd...50th U23
Harmonic contents are available
up to the 89
(60Hz) on the Modbus interface
th
(50Hz) or 75th
Harmonics
Harmonics are multiples of the fundamental resp. system frequency. They arise if non-linear loads, such
as RPM regulated drives, rectifiers, thyristor controlled systems or fluorescent lamps are present in the
power system. Thus undesired side effects occur, such as additional thermal stress to operational
resources or electrical mains, which lead to an advanced aging or even damage. Also the reliability of
sensitive loads can be affected and unexplainable disturbances may occur. In industrial networks the
image of the harmonics gives good information about the kind of loads connected. See also:
► Increase of reactive power due to harmonic currents
TDD (Total Demand Distortion)
The complete harmonic content of the currents is calculated additionally as Total Demand Distortion,
briefly TDD. This value is scaled to the rated current resp. rated power. Only this way it's possible to
estimate the influence of the current harmonics on the connected equipment correctly.
Maximum values
The maximum values of the harmonic analysis arise from the monitoring of THD and TDD. The maximum
values of individual harmonics are not monitored separately, but are stored if a maximum value of THD or
TDD is detected. The image of the maximum harmonics therefore always corresponds to the dedicated
THD resp. TDD.
The accuracy of the harmonic analysis strongly depends on the quality of the current and voltage
transformers possibly used. In the harmonics range transformers normally change both, the
amplitude and the phase of the signals to measure. It's valid: The higher the frequency of the
harmonic, the higher its damping resp. phase shift.
PM 1001606 000 07 Device handbook CENTRAX CU3000-CU5000 87/106

A3 System imbalance
UR1: Positive sequence [V]
● √ √ √ √ UR2: Negative sequence [V]
● √ √ √
√
U0: Zero sequence [V]
● √ U: Imbalance UR2/UR1
● ● √ √ √
√
U: Imbalance U0/UR1
● ● √ IR1: Positive sequence [A]
● √ √
√
IR2: Negative sequence [A]
● √ √
√
● √
√
I: Imbalance IR2/IR1
● ● √ √ √ I: Imbalance I0/IR1
● ● √
√
●
Available via communication interface only
Measured quantity
present
max
min
1L
2L
3Lb
3Lb.P
3Lu
3Lu.A
4Lb
4Lu.O
4Lu
I0: Zero sequence [A]
Imbalance in three-phase systems may occur due to single-phase loads, but also due to failures, such as
e.g. the blowing of a fuse, an earth fault, a phase failure or an isolation defect. Also harmonics of the 3rd,
9th, 15th, 21st etc. order, which add in the neutral wire, may lead to imbalance. Operating resources
dimensioned to rated values, such as three-phase generators, transformers or motors on load side, may
be excessively stressed by imbalance. So a shorter life cycle, a damage or failure due to thermal stress
can result. Therefore monitoring imbalance helps to reduce the costs for maintenance and extends the
undisturbed operating time of the used resources.
Imbalance or unbalanced load relays use different measurement principles. One of them is the approach
of the symmetrical components, the other one calculates the maximum deviation from the mean-value of
the three phase values. The results of these methods are not equal and don't have the same intention.
Both of these principles are implemented in the device.
Symmetrical components (acc. Fortescue)
The imbalance calculation method by means of the symmetrical components is ambitious and intensive to
calculate. The results may be used for disturbance analysis and for protection purposes in three-phase
systems. The real existing system is divided in symmetrical system parts: A positive sequence, a negative
sequence and (for systems with neutral conductor) a zero sequence system. The approach is easiest to
understand for rotating machines. The positive sequence represents a positive rotating field, the negative
sequence a negative (braking) rotating field with opposite sense of direction. Therefore the negative
sequence prevents that the machine can generate the full turning moment. For e.g. generators the
maximum permissible current imbalance is typically limited to a value of 8...12%.
Maximum deviation from the mean value
The calculation of the maximum deviation from the mean value of the phase currents resp. phase
voltages gives the information if a grid or substation is imbalanced loaded. The results are independent of
rated values and the present load situation. So a more symmetrical system can be aspired, e.g. by
changing loads from one phase to another.
Also failure detection is possible. The capacitors used in compensation systems are wear parts, which fail
quite often and then have to be replaced. When using three phase power capacitors all phases will be
compensated equally which leads to almost identical currents flowing through the capacitors, if the system
load is comparable. By monitoring the current imbalance it's then possible to estimate if a capacitor failure
is present.
The maximum deviations are calculated in the same steps as the instantaneous values and therefore are
arranged there (see A1
).
PM 1001606 000 07 Device handbook CENTRAX CU3000-CU5000 88/106

A4 Mean values and trend
Active power I+IV 10s...60min. 1)
● ● ● ● 5
Active power II+III 10s...60min. 1)
● ● ● ● 5
Reactive power I+II 10s...60min. 1)
● ● ● ● 5
● ● ● ● 5
Apparent power 10s...60min. 1)
● ● ● ● 5
Mean value quantity 1 10s...60min. 2)
● ● ● ● 1
….
Mean value quantity 12 10s...60min. 2)
● ● ● ● 1
1)
Interval time t1 2) Interval time t2
Bimetal current IB, 1...60min. 3)
● ● √ √ √ √
Bimetal current IB1, 1...60min. 3)
● ● √ √ √ √ √
Bimetal current IB2, 1...60min. 3)
● ● √ √ √ √ √
Bimetal current IB3, 1...60min. 3)
● ● √ √ √ √
3)
Interval time t3
Measured quantity
Present
Trend
max
min
History
Reactive power III+IV 10s...60min. 1)
The device calculates automatically the mean values of all system power quantities. In addition up to 12
further mean value quantities can be freely selected.
Calculating the mean-values
The mean value calculation is performed via integration of the measured instantaneous values over a
configurable averaging interval. The interval time may be selected in the range from 10 seconds up to one
hour. Possible interim values are set the way that a multiple of it is equal to a minute or an hour. Mean
values of power quantities (interval time t1) and free quantities (interval time t2) may have different
averaging intervals.
Synchronization
For the synchronization of the averaging intervals the internal clock or an external signal via digital input
may be used. In case of an external synchronization the interval should be within the given range of one
second up to one hour. The synchronization is important for making e.g. the mean value of power
quantities on generating and demand side comparable.
Trend
The estimated final value (trend) of mean values is determined by weighted addition of measurements of
the past and the present interval. It serves for early detection of a possible exceeding of a given maximum
value. This can then be avoided, e.g. by switching off an active load.
History
For mean values of system powers the last 5 interval values may be displayed on the device or read via
interface. For configurable quantities the value of the last interval is provided via communication interface.
Bimetal current
This measured quantity serves for measuring the long-term effect of the current, e.g. for monitoring the
warming of a current-carrying line. To do so, an exponential function is used, similar to the charging curve
of a capacitor. The response time of the bimetal function can be freely selected, but normally it
corresponds to the interval for determining the power mean-values.
Measured quantity
PM 1001606 000 07 Device handbook CENTRAX CU3000-CU5000 89/106
Present
max
min
1L
2L
3Lb
3Lb.P
3Lu
3Lu.A
4Lb
4Lu.O
4Lu

A5 Meters
Measured quantity
Active energy I+IV, high tariff
Active energy II+III, high tariff
Reactive energy I+II, high tariff
Reactive energy III+IV, high tariff
Active energy I+IV, low tariff
Active energy II+III, low tariff
Reactive energy I+II, low tariff
Reactive energy III+IV, low tariff
User configured meter 1
User configured meter 2
User configured meter 3
User configured meter 4
User configured meter 5
User configured meter 6
User configured meter 7
User configured meter 8
User configured meter 9
User configured meter 10
User configured meter 11
User configured meter 12
1L
2L
3Lb
3Lb.P
3Lu
3Lu.A
4Lb
4Lu.O
● ● ● ● ● ● ● ● ●
● ● ● ● ● ● ● ● ●
● ● ● ● ● ● ● ● ●
● ● ● ● ● ● ● ● ●
● ● ● ● ● ● ● ● ●
● ● ● ● ● ● ● ● ●
● ● ● ● ● ● ● ● ●
● ● ● ● ● ● ● ● ●
Only basic quantities can be selected which
are supported in the present system.
4Lu
Standard meters
The meters for active and reactive energy of the system are always active.
User configured meters
To each of these meters the user can freely assign a basic quantity.
Programmable meter resolution
For all meters the resolution (displayed unit) can be selected almost freely. This way,
applications with short measurement times, e.g. energy consumption of a working day or
shift, can be realized. The smaller the basic unit is selected, the faster the meter overflow
is reached.
PM 1001606 000 07 Device handbook CENTRAX CU3000-CU5000 90/106

B Display matrices
ø
B0 Used abbreviations for the measurements
Instantaneous values
Name Measurement identification Unit Description
U U
U1N U
U2N U
U3N U
U12 U
U23 U
U31 U
UNE U
I I
I1 I
I2 I
I3 I
IN I
IPE I
P P
P1 P
P2 P
P3 P
Q Q
Q1 Q
Q2 Q
Q3 Q
S S
S1 S
S2 S
S3 S
F F
PF PF
PF1 PF
PF2 PF
PF3 PF
QF QF
QF1 QF
QF2 QF
QF3 QF
LF LF
LF1 LF
LF2 LF
LF3 LF
UR1 U
UR2 U
U0 U
IR1 I
IR2 I
I0 I
UR2R1 U
IR2R1 I
U0R1 U
I0R1 I
IMS I
TRMS
1N TRMS
2N TRMS
3N TRMS
12 TRMS
23 TRMS
31 TRMS
NE TRMS
TRMS
1 TRMS
2 TRMS
3 TRMS
N TRMS
PE TRMS
TRMS
1 TRMS
2 TRMS
3 TRMS
TRMS
1 TRMS
2 TRMS
3 TRMS
TRMS
1 TRMS
2 TRMS
3 TRMS
TRMS
TRMS
1 TRMS
2 TRMS
3 TRMS
TRMS
1 TRMS
2 TRMS
3 TRMS
TRMS
1 TRMS
2 TRMS
3 TRMS
pos SEQ
neg SEQ
zero SEQ
pos SEQ
neg SEQ
zero SEQ
neg/pos UNB
neg/pos UNB
zero/pos UNB
zero/pos UNB
TRMS
- +
V Voltage system
V Voltage between phase L1 and neutral
V Voltage between phase L2 and neutral
V Voltage between phase L3 and neutral
V Voltage between phases L1 and L2
V Voltage between phases L2 and L3
V Voltage between phases L3 and L1
V Zero displacement voltage 4-wire systems
A Current system
A Current phase L1
A Current phase L2
A Current phase L3
A Neutral current
W Active power system (P=P1+P2+P3)
W Active power phase L1
W Active power phase L2
W Active power phase L3
var Reactive power system (Q=Q1+Q2+Q3)
var Reactive power phase L1
var Reactive power phase L2
var Reactive power phase L3
VA Apparent power system
VA Apparent power phase L1
VA Apparent power phase L2
VA Apparent power phase L3
Hz System frequency
Active power factor P/S
Active power factor P1/S1
Active power factor P2/S2
Active power factor P3/S3
Reactive power factor Q / S
Reactive power factor Q1 / S1
Reactive power factor Q2 / S2
Reactive power factor Q3 / S3
Load factor system
Load factor phase L1
Load factor phase L2
Load factor phase L3
V Positive sequence voltage
V Negative sequence voltage
V Zero sequence voltage
A Positive sequence current
A Negative sequence current
A Zero sequence current
% Unbalance fact or voltage UR2/UR1
% Unbalance factor current IR2/IR1
% Unbalance fact or voltage U0/ UR1
% Unbalance factor current I0/IR1
A Average current with sign of P
Earth current
PM 1001606 000 07 Device handbook CENTRAX CU3000-CU5000 91/106

Minimum and maximum of instantaneous values
A
A
A
A
A
W
W
W
var
var
var
Hz
Name Measurement identification Unit Description
U_MM U
U1N_MM U
U2N_MM U
U3N_MM U
U12_MM U
U23_MM U
U31_MM U
UNE_MAX U
I_MAX I
I1_MAX I
I2_MAX I
I3_MAX I
IN_MAX I
IPE_MAX I
P_MAX P
P1_MAX P
P2_MAX P
P3_MAX P
Q_MAX Q
Q1_MAX Q
Q2_MAX Q
Q3_MAX Q
S_MAX S
S1_MAX S
S2_MAX S
S3_MAX S
F_MM F
UR21_MAX
IR21_MAX
THD_U_MAX
THD_U1N_MAX
THD_U2N_MAX
U
I
U
U
U
THD_U3N_MAX U
THD_U12_MAX U
THD_U23_MAX U
THD_U31_MAX U
TDD_I_MAX
TDD_I1_MAX
TDD_I2_MAX
TDD_I3_MAX
I
I
I
I
1N
2N
3N
12
23
31
NE
1
2
3
N
PE
1
2
3
1
2
3
1
2
3
neg/pos
neg/pos
1N
2N
3N
12
23
31
1
2
3
UNB
UNB
THD
THD
THD
THD
THD
THD
THD
TDD
TDD
TDD
TDD
TRMS
TRMS
TRMS
TRMS
TRMS
TRMS
TRMS
TRMS
TRMS
TRMS
TRMS
TRMS
TRMS
TRMS
TRMS
TRMS
TRMS
TRMS
TRMS
TRMS
TRMS
TRMS
TRMS
TRMS
TRMS
TRMS
TRMS
V
V
V
V
V
V
V
V Maximum value of UNE
Minimum and maximum value of U
Minimum and maximum value of U1N
Minimum and maximum value of U2N
Minimum and maximum value of U3N
Minimum and maximum value of U12
Minimum and maximum value of U23
Minimum and maximum value of U31
Maximum value of I
A
Maximum value of I1
Maximum value of I2
Maximum value of I3
Maximum value of IN
Maximum value of IPE
W
Maximum value of P
Maximum value of P1
Maximum value of P2
Maximum value of P3
var
Maximum value of Q
Maximum value of Q1
Maximum value of Q2
VA
VA
VA
VA
Maximum value of Q3
Maximum value of S
Maximum value of S1
Maximum value of S2
Maximum value of S3
Minimum and maximum value of F
%
%
%
%
%
Maximum value of UR2/UR1
Maximum value of IR2/IR1
Max. Total Harmonic Distortion of U
Max. Total Harmonic Distortion of U1N
Max. Total Harmonic Distortion of U2N
% Max. Total Harmonic Distortion of U3N
% Max. Total Harmonic Distortion of U12
% Max. Total Harmonic Distortion of U23
% Max. Total Harmonic Distortion of U31
%
%
%
%
Max. Total Demand Distortion of I
Max. Total Demand Distortion of I1
Max. Total Demand Distortion of I2
Max. Total Demand Distortion of I3
TS: Timestamp of occurrence, e.g. 2014/09/17 11:12:03
PM 1001606 000 07 Device handbook CENTRAX CU3000-CU5000 92/106

Mean-values, trend and bimetal current
(m): Short description of basic quantity, e.g. „P“
(qg): Graphical quadrant information, e.g.
(p): Phase reference of the selected quantity, e.g. „1 “
(q): Quadrant information, e.g. „I+IV“
Name Measurement identification Unit Description
M1
M2
….
M11
M12
TR_M1
TR_M2
….
TR_M11
TR_M12
IB
IB1
IB2
IB3
(m) (p) (q)
(m) (p) (q)
(m) (p) (q)
(m) (p) (q)
(m) (p) (q)
(m) (p) (q)
(m) (p) (q)
(m) (p) (q)
(m) (p) (q)
(m) (p) (q)
IB
IB 1
IB 2
IB 3
(t2)
(t2)
(t2)
(t2)
(t2)
(t2)
(t2)
(t2)
(t2)
(t2)
(t3)
(t3)
(t3)
(t3)
(mu)
(mu)
(mu)
(mu)
(mu)
(mu)
(mu)
(mu)
(mu)
(mu)
A
A
A
A
Minimum and maximum of mean-values and bimetal-current
Name Measurement identification Unit Description
M1_MM
M2_MM
….
M11_MM
M12_MM
IB_MAX
IB1_MAX
IB2_MAX
IB3_MAX
(m) (p) (q)
(m) (p) (q)
(m) (p) (q)
(m) (p) (q)
(m) (p) (q)
IB
IB 1
IB 2
IB 3
(t2)
(t2)
(t2)
(t2)
(t2)
(t3)
(t3)
(t3)
(t3)
..
..
..
..
..
A
A
A
A
Mean-value 1
Mean-value 2
….
Mean-value 11
Mean-value 12
Trend mean-value 1
Trend mean-value 2
….
Trend mean-value 11
Trend mean-value 12
Bimetal current, system
Bimetal current, phase L1
Bimetal current, phase L2
Bimetal current, phase L3
Min/Max mean-value 1
Min/Max mean-value 2
….
Min/Max mean-value 11
Min/Max mean-value 12
Maximum bimetal current, system
Maximum Bimetal current, phase L1
Maximum Bimetal current, phase L2
Maximum Bimetal current, phase L3
Meters
Name Measurement identification Unit Description
ΣP_I_IV_HT P
ΣP_II_III_HT P
ΣQ_I_II_HT Q
ΣQ_III_IV _HT Q
ΣP_I_IV_LT P
ΣP_II_III _LT P
ΣQ_I_II _LT Q
ΣQ_III_IV_LT Q
ΣMETER1 (m) (p) (qg) Σ(T)
ΣMETER2 (m) (p) (qg) Σ(T)
….. (m) (p) (qg) Σ(T)
ΣMETER11 (m) (p) (qg) Σ(T)
ΣMETER12 (m) (p) (qg) Σ(T)
ΣHT
ΣHT
ΣHT
ΣHT
ΣLT
ΣLT
ΣLT
ΣLT
Wh Meter P I+IV, high tariff
Wh Meter P II+III, high tariff
varh Meter Q I+II, high tariff
varh Meter Q III+IV, high tari ff
Wh Meter P I+IV, low tariff
Wh Meter P II+III, low tariff
varh Meter Q I+II, low tariff
varh Meter Q III+IV, low tariff
(mu) User meter 1, tariff HT or LT
(mu)
(mu)
(mu)
(mu)
(T): Associated tariff, e.g. „HT" or „LT“
(mu): Unit of basic quantity
User meter 2, tariff HT or LT
…..
User meter 11, tariff HT or LT
User meter 12, tariff HT or LT
PM 1001606 000 07 Device handbook CENTRAX CU3000-CU5000 93/106

Graphical measurement displays
Trend, last 5 interval values, minimum and maximum
Graphic mean-value Q (I+II)
Trend, last 5 interval values, minimum and maximum
Graphic mean-value Q (III+IV)
Trend, last 5 interval values, minimum and maximum
Graphic mean-value S:
Graphic: Odd harmonics 3rd up to 49th + Total Harmonic Distortion of all
voltages
currents
Graphic: Even harmonics 2nd up to 50th + Total Harmonic Distortion of all
Graphic: Maximum values odd harmonics 3rd up to 49th + Total Harmonic
Graphic: Maximum values odd harmonics 3rd up to 49th + Total Harmonic
Graphic: Maximum values even harmonics 2nd up to 50th + Total Harmonic
Distortion of all voltages
Graphic: Maximum values even harmonics 2nd up to 50th + Total Harmonic
Distortion of all currents
Name Presentation Description
Graphic of the power triangle consisting of:
• Active, reactive and apparent power Px, Qx, Sx
Px_TRIANGLE
• Distortion reactive power Dx
• Fundamental reactive power Qx(H1)
• cos(φ) of fundamental
• Active power factor PFx
PF_MIN
Cφ_MIN (as PF_MIN) Graphic: Minimum cos(φ) in all 4 quadrants
I> m.1 / m.2
MT_P_I_IV
MT_P_II_III (as MT_P_I_IV)
MT_Q_I_II (as MT_P_I_IV)
MT_Q_III_IV (as MT_P_I_IV )
MT_S (as MT_P_I_IV)
Graphic: Minimum active power factor PF in all 4 quadrants
Graphic: Present measurements and states of fault-current monitoring
Data available only, if the device is equipped with at least one optional fault-current
module.
Graphic mean-value P (I+IV)
Trend, last 5 interval values, minimum and maximum
Graphic mean-value P (II+III)
Trend, last 5 interval values, minimum and maximum
HO_IX
HO_UX (as HO_IX)
HE_IX (as HO_IX)
HE_UX (as HO_IX)
HO_UX_MAX (as HO_IX)
HO_IX_MAX (as HO_IX)
HE_UX_MAX (as HO_IX)
HE_IX_MAX (as HO_IX)
PHASOR
Graphic: Odd harmonics 3rd up to 49th + Total Harmonic Distortion of all
currents
Graphic: Even harmonics 2nd up to 50th + Total Harmonic Distortion of all
voltages
Distortion of all voltages
Distortion of all currents
Graphic: All current and voltage phasors with present load situation
PM 1001606 000 07 Device handbook CENTRAX CU3000-CU5000 94/106

B1 Display matrices for single phase system
U
U_MM
UNE
UNE_MAX
F
F_MM
I
I_MAX
IN
IN_MAX
IMS
P
P_MAX
Q
Q_MAX
S
S_MAX
PF
P_TRIANGLE
PF_MIN
Cφ_MIN
I> 1.1 / 1.2
I> 2.1 / 2.2
I> 3.1 / 3.2
I> 4.1 / 4.2
ΣP_I_IV_HT
ΣP_I_IV_NT
ΣP_II_III _NT
ΣP_II_III_HT
ΣQ_I_II_HT
ΣQ_I_II _NT
ΣQ_III_IV _HT
ΣQ_I_II _NT
ΣMETER1
ΣMETER2
ΣMETER3
ΣMETER4
ΣMETER5
ΣMETER6
ΣMETER7
ΣMETER8
ΣMETER10
ΣMETER11
ΣMETER12
MT_P_I_IV
MT_P_II_III
MT_Q_I_II
MT_Q_III_IV
MT_S
M1 / TR_M1
M1_MM
M2 / TR_M2
M2_MM
M3 / TR_M3
M3_MM
M4 / TR_M4
M4_MM
M5 / TR_M5
M5_MM
M6 / TR_M6
M6_MM
For CU5000
M7 / TR_M7
M7_MM
divided into
M8 / TR_M8
M8_MM
2 images each
M9 / TR_M9
M9_MM
M10 / TR_M10
M10_MM
M11 / TR_M11
M11_MM
M12 / TR_M12
M12_MM
IB1
IB2
IB1_MAX
IB2_MAX
Display menu Corresponding matrix
ΣMETER9
PM 1001606 000 07 Device handbook CENTRAX CU3000-CU5000 95/106

B2 Display matrices for split-phase (two-phase) systems
U1N
U1N_MM
U2N
U2N_MM
U
U_MM
UNE
UNE_MAX
I1
I1_MAX
I2
I2_MAX
IN
IN_MAX
IPE
IPE_MAX
P P1
P_MAX / P1_MAX
For CU5000
Q
P2
Q_MAX / P2_MAX
divided into
F
Q1
S_MAX / Q1_MAX
2 images
PF
Q2
F_MM / Q2_MAX
P_TRIANGLE
P1_TRIANGLE
P2_TRIANGLE
PF_MIN
Cφ_MIN
I> 1.1 / 1.2
I> 2.1 / 2.2
I> 3.1 / 3.2
I> 4.1 / 4.2
ΣP_I_IV_HT
ΣP_I_IV_NT
ΣP_II_III _NT
ΣP_II_III_HT
ΣQ_I_II_HT
ΣQ_I_II _NT
ΣQ_III_IV _HT
ΣQ_I_II _NT
ΣMETER1
ΣMETER2
ΣMETER3
ΣMETER4
ΣMETER5
ΣMETER6
ΣMETER7
ΣMETER8
ΣMETER10
ΣMETER11
ΣMETER12
MT_P_I_IV
MT_P_II_III
MT_Q_I_II
MT_Q_III_IV
MT_S
M1 / TR_M1
M1_MM
M2 / TR_M2
M2_MM
M3 / TR_M3
M3_MM
M4 / TR_M4
M4_MM
M5 / TR_M5
M5_MM
M6 / TR_M6
M6_MM
For CU5000
M7 / TR_M7
M7_MM
divided into
M8 / TR_M8
M8_MM
2 images each
M9 / TR_M9
M9_MM
M10 / TR_M10
M10_MM
M11 / TR_M11
M11_MM
M12 / TR_M12
M12_MM
IB1
IB2
IB1_MAX
IB2_MAX
Display menu Corresponding matrix
ΣMETER9
PM 1001606 000 07 Device handbook CENTRAX CU3000-CU5000 96/106

B3 Display matrices for 3-wire system, balanced load
U12
U12_MM
UR1 U23
U23_MM
UR2 U31
U31_MM
UR2R1
F F_MM
UR21_MAX
I I_MAX
IMS P
P_MAX
Q Q_MAX
S S_MAX
PF
P_TRIANGLE
PF_MIN
Cφ_MIN
I> 1.1 / 1.2
I> 2.1 / 2.2
I> 3.1 / 3.2
I> 4.1 / 4.2
ΣP_I_IV_HT
ΣP_I_IV_NT
ΣP_II_III _NT
ΣP_II_III_HT
ΣQ_I_II_HT
ΣQ_I_II _NT
ΣQ_III_IV _HT
ΣQ_I_II _NT
ΣMETER1
ΣMETER2
ΣMETER3
ΣMETER4
ΣMETER5
ΣMETER6
ΣMETER7
ΣMETER8
ΣMETER9
ΣMETER10
ΣMETER11
ΣMETER12
MT_P_I_IV
MT_P_II_III
MT_Q_I_II
MT_Q_III_IV
MT_S
M1 / TR_M1
M1_MM
M2 / TR_M2
M2_MM
M3 / TR_M3
M3_MM
M4 / TR_M4
M4_MM
M5 / TR_M5
M5_MM
M6 / TR_M6
M6_MM
For CU5000
M7 / TR_M7
M7_MM
divided into
M8 / TR_M8
M8_MM
2 images each
M9 / TR_M9
M9_MM
M10 / TR_M10
M10_MM
M11 / TR_M11
M11_MM
M12 / TR_M12
M12_MM
IB
IB_MAX
Display menu Corresponding matrix
PM 1001606 000 07 Device handbook CENTRAX CU3000-CU5000 97/106

B4 Display matrices for 3-wire system, balanced load, phase shift
U
U_MM
I I_MAX
P P_MAX
F F_MM
P P_MAX
Q Q_MAX
S S_MAX
PF
P_TRIANGLE
PF_MIN
Cφ_MIN
I> 1.1 / 1.2
I> 2.1 / 2.2
I> 3.1 / 3.2
I> 4.1 / 4.2
ΣP_I_IV_HT
ΣP_I_IV_NT
ΣP_II_III _NT
ΣP_II_III_HT
ΣQ_I_II_HT
ΣQ_I_II _NT
ΣQ_III_IV _HT
ΣQ_I_II _NT
ΣMETER1
ΣMETER2
ΣMETER3
ΣMETER4
ΣMETER6
ΣMETER7
ΣMETER8
ΣMETER9
ΣMETER10
ΣMETER11
ΣMETER12
MT_P_I_IV
MT_P_II_III
MT_Q_I_II
MT_Q_III_IV
MT_S
M1 / TR_M1
M1_MM
M2 / TR_M2
M2_MM
M3 / TR_M3
M3_MM
M4 / TR_M4
M4_MM
M5 / TR_M5
M5_MM
M6 / TR_M6
M6_MM
For CU5000
M7 / TR_M7
M7_MM
divided into
M8 / TR_M8
M8_MM
2 images each
M9 / TR_M9
M9_MM
M10 / TR_M10
M10_MM
M11 / TR_M11
M11_MM
M12 / TR_M12
M12_MM
IB
IB_MAX
Display menu Corresponding matrix
ΣMETER5
PM 1001606 000 07 Device handbook CENTRAX CU3000-CU5000 98/106

B5 Display matrices for 3-wire systems, unbalanced lo ad
U12
U12_MM
UR1 U23
U23_MM
UR2 U31
U31_MM
UR2R1
F F_MM
UR21_MAX
I1
I1_MAX
IR1
I2
I2_MAX
IR2
I3
I3_MAX
IR2R1
IPE
IPE_MAX
IR21_MAX
P
P_MAX
Q Q_MAX
S S_MAX
PF
P_TRIANGLE
PF_MIN
Cφ_MIN
I> 1.1 / 1.2
I> 2.1 / 2.2
I> 3.1 / 3.2
I> 4.1 / 4.2
ΣP_I_IV_HT
ΣP_I_IV_NT
ΣP_II_III _NT
ΣP_II_III_HT
ΣQ_I_II_HT
ΣQ_I_II _NT
ΣQ_III_IV _HT
ΣQ_I_II _NT
ΣMETER1
ΣMETER2
ΣMETER3
ΣMETER4
ΣMETER5
ΣMETER6
ΣMETER7
ΣMETER8
ΣMETER10
ΣMETER11
ΣMETER12
MT_P_I_IV
MT_P_II_III
MT_Q_I_II
MT_Q_III_IV
MT_S
M1 / TR_M1
M1_MM
M2 / TR_M2
M2_MM
M3 / TR_M3
M3_MM
M4 / TR_M4
M4_MM
M5 / TR_M5
M5_MM
M6 / TR_M6
M6_MM
For CU5000
M7 / TR_M7
M7_MM
divided into
M8 / TR_M8
M8_MM
2 images each
M9 / TR_M9
M9_MM
M10 / TR_M10
M10_MM
M11 / TR_M11
M11_MM
M12 / TR_M12
M12_MM
IB1
IB1_MAX
IB2
IB2_MAX
IB3
IB3_MAX
Display menu Corresponding matrix
ΣMETER9
PM 1001606 000 07 Device handbook CENTRAX CU3000-CU5000 99/106

B6 Display matrices for 3-wire systems, unbalanced lo ad , Aron
U12
U12_MM
UR1 U23
U23_MM
UR2 U31
U31_MM
UR2R1
F F_MM
UR21_MAX
I1
I1_MAX
I2
I2_MAX
I3
I3_MAX
IMS P
P_MAX
Q Q_MAX
S S_MAX
PF
P_TRIANGLE
PF_MIN
Cφ_MIN
I> 1.1 / 1.2
I> 2.1 / 2.2
I> 3.1 / 3.2
I> 4.1 / 4.2
ΣP_I_IV_HT
ΣP_I_IV_NT
ΣP_II_III _NT
ΣP_II_III_HT
ΣQ_I_II_HT
ΣQ_I_II _NT
ΣQ_III_IV _HT
ΣQ_I_II _NT
ΣMETER1
ΣMETER2
ΣMETER3
ΣMETER4
ΣMETER5
ΣMETER6
ΣMETER7
ΣMETER8
ΣMETER10
ΣMETER11
ΣMETER12
MT_P_I_IV
MT_P_II_III
MT_Q_I_II
MT_Q_III_IV
MT_S
M1 / TR_M1
M1_MM
M2 / TR_M2
M2_MM
M3 / TR_M3
M3_MM
M4 / TR_M4
M4_MM
M5 / TR_M5
M5_MM
M6 / TR_M6
M6_MM
For CU5000
M7 / TR_M7
M7_MM
divided into
M8 / TR_M8
M8_MM
2 images each
M9 / TR_M9
M9_MM
M10 / TR_M10
M10_MM
M11 / TR_M11
M11_MM
M12 / TR_M12
M12_MM
IB1
IB1_MAX
IB2
IB2_MAX
IB3
IB3_MAX
Display menu Corresponding matrix
ΣMETER9
PM 1001606 000 07 Device handbook CENTRAX CU3000-CU5000 100/106
 Loading...