

Page 1
NUFLO
TM
MC-III™ EXP
Flow Analyzer
User Manual
Manual No. 9A-50165003, Rev. 02
Page 2

NuFlo and MC-III are trademarks of Cameron.
Modbus is a registered trademark of the Modbus Organization, Inc.
Windows is a registered trademark of Microsoft Corporation.
Acrobat Reader is a registered trademark of Adobe Systems Incorporated.
© 2008 Cameron International Corporation (“Cameron”). All information contained in this publication is
condential and proprietary property of Cameron. Any reproduction or use of these instructions, drawings,
or photographs without the express written permission of an ofcer of Cameron is forbidden.
All Rights Reserved.
Printed in the United States of America.
Manual No. 9A-50165003, Rev. 02
September 2008
Page 3

MC-III™ EXP Flow Analyzer Table of Contents
Contents
Section 1—Introduction ................................................................................................................................... 1
Operation ............................................................................................................................................................ 1
Key Product Features ........................................................................................................................................ 3
LCD Display ................................................................................................................................................. 4
Keypad ......................................................................................................................................................... 4
Interface Software ........................................................................................................................................ 6
Power Supply ............................................................................................................................................... 6
Multipoint Linearization ................................................................................................................................ 6
Gas Volume Correction ................................................................................................................................ 6
Input Options ................................................................................................................................................ 6
Output Options ............................................................................................................................................. 6
Flow Log Archival ........................................................................................................................................ 7
Event Log Archival ...................................................................................................................................... 7
Password-Protected Security ....................................................................................................................... 7
Optional Features ............................................................................................................................................... 7
Explosion-Proof Reset/Control Switch ......................................................................................................... 7
Explosion-Proof Communications Adapter .................................................................................................. 7
RS-485 IS Barrier ......................................................................................................................................... 8
Commonly Used Functions ................................................................................................................................ 8
Reading Totals ............................................................................................................................................. 8
Saving Totals to Memory .............................................................................................................................. 8
Resetting the Total ....................................................................................................................................... 8
Viewing Daily and Hourly Logs .................................................................................................................... 9
Saving and Uploading Conguration Files ................................................................................................... 9
Exporting Log Data ...................................................................................................................................... 9
Saving Log Data in a Report ........................................................................................................................ 9
Section 2—Installation ....................................................................................................................................11
Preparation ........................................................................................................................................................11
Connection to the Flowmeter.............................................................................................................................11
Instrument Dimensions ..................................................................................................................................... 12
Field Wiring Connections.................................................................................................................................. 13
Power Supply Wiring ........................................................................................................................................ 14
Internal Power Supply ................................................................................................................................ 14
External Power Supply .............................................................................................................................. 14
Input Wiring ...................................................................................................................................................... 15
Turbine Flowmeter (TFM) Input ................................................................................................................. 15
Pulse Input ................................................................................................................................................. 15
Remote Reset Input ................................................................................................................................... 16
Output Wiring.................................................................................................................................................... 17
Pulse Output ............................................................................................................................................. 17
Analog (4-20 mA) Rate Output ................................................................................................................. 17
Flowmeter Frequency Output .................................................................................................................... 18
RS-485 Output ........................................................................................................................................... 19
Section 3—Conguration and Operation via Keypad ................................................................................. 23
Entering a Calibration Factor ........................................................................................................................... 24
Entering a Calculated Divisor ........................................................................................................................... 25
Setting Input Type and Sensitivity .................................................................................................................... 26
Conguring the Total Display ............................................................................................................................ 27
i
Page 4

Table of Contents MC-III™ EXP Flow Analyzer
Conguring the Rate Display ............................................................................................................................ 28
Conguring the 4-20 mA Rate Output .............................................................................................................. 29
Conguring the Pulse Output ........................................................................................................................... 32
Entering the Slave Address .............................................................................................................................. 33
Entering the Baud Rate .................................................................................................................................... 33
Section 4—Conguration and Operation via Software ............................................................................... 35
Installing the Software ...................................................................................................................................... 35
Accessing Help ................................................................................................................................................. 35
Connecting to the Software .............................................................................................................................. 36
Automating Functions on Software Startup ............................................................................................... 37
Changing Autorun Settings ........................................................................................................................ 38
Express Connect Option ............................................................................................................................ 38
Changing the Communications Port .......................................................................................................... 39
Software Connection in Multi-Device Network ........................................................................................... 39
Setting Log Download Preferences .................................................................................................................. 41
Conguring the MC-III EXP .............................................................................................................................. 42
Conguration Wizard ................................................................................................................................. 44
MC-III Main Screen .................................................................................................................................... 46
Buttons and Tools....................................................................................................................................... 47
Conguration Submenus (See Scroll Bar on MC-III Main Screen) ........................................................... 48
Conguration Submenus (cont’d) .............................................................................................................. 49
System Setup ................................................................................................................................................... 50
Time/Date Synchronization ....................................................................................................................... 50
Contract Hour ............................................................................................................................................. 50
LCD Contrast Adjustment .......................................................................................................................... 50
Security Setup ............................................................................................................................................ 51
Firmware Version Number ......................................................................................................................... 51
Serial Number ............................................................................................................................................ 51
Communications Port ....................................................................................................................................... 51
Slave Address ............................................................................................................................................ 51
Baud Rate ................................................................................................................................................. 52
Bus Delay ................................................................................................................................................... 53
Bus Timeout ............................................................................................................................................... 53
Software Communication Options ............................................................................................................. 53
Wellsite Information .......................................................................................................................................... 53
Turbine Input .................................................................................................................................................... 54
Volume Display .......................................................................................................................................... 54
Rate Display ............................................................................................................................................... 54
Input Type and Sensitivity Conguration .................................................................................................... 55
Cut-Off Thresholds ..................................................................................................................................... 55
Calculation Period ...................................................................................................................................... 55
K-Factor Entry .................................................................................................................................................. 56
K-Factor Units ............................................................................................................................................ 56
K-Factor Type............................................................................................................................................. 56
K-Factor Backup ........................................................................................................................................ 57
Gas Volume Correction (Supercompressibility Calculation) ...................................................................... 58
4-20 mA Output ................................................................................................................................................ 60
Enabling 4-20 mA Output .......................................................................................................................... 62
4-20 mA Output Testing.............................................................................................................................. 62
Pulse Output ..................................................................................................................................................... 63
Conguring Pulse Output ........................................................................................................................... 64
Pulse Output Testing .................................................................................................................................. 65
ii
Page 5

MC-III™ EXP Flow Analyzer Table of Contents
Saving and Uploading Conguration Files ....................................................................................................... 66
Saving a Conguration File ........................................................................................................................ 66
Uploading a Conguration File ................................................................................................................... 67
Advanced Access ............................................................................................................................................ 69
Section 5—Flow Logs and Event Logs ........................................................................................................ 71
Auto-Save Log Formats.................................................................................................................................... 71
Log Directory and Filenames............................................................................................................................ 72
Flow Archive ..................................................................................................................................................... 72
Downloading Flow Logs ............................................................................................................................. 73
Viewing Trend Charts ................................................................................................................................. 75
Printing/Saving a Report ............................................................................................................................ 75
Viewing a Saved Report............................................................................................................................. 77
Exporting Flow Logs ................................................................................................................................. 79
Event Archive.................................................................................................................................................... 80
Downloading Event Logs ........................................................................................................................... 81
Printing/Saving a Report ............................................................................................................................ 82
Exporting Event Logs ................................................................................................................................ 82
Section 6 - MC-III EXP Maintenance .............................................................................................................. 85
Lithium Battery Replacement ........................................................................................................................... 85
Alkaline Battery Replacement .......................................................................................................................... 87
Circuit Assembly Replacement ......................................................................................................................... 89
Keypad Replacement ....................................................................................................................................... 91
Firmware Update .............................................................................................................................................. 92
Spare Parts List ................................................................................................................................................ 93
Optional Parts List ............................................................................................................................................ 93
Appendix A—MC-III EXP Hardware Options ...............................................................................................A-1
Explosion-Proof Reset/Control Switch.............................................................................................................A-1
Explosion-Proof Communications Adapter ......................................................................................................A-3
Appendix B—Software Program Options ...................................................................................................B-1
General Options ..............................................................................................................................................B-1
Autorun Options...............................................................................................................................................B-2
Communications Options ................................................................................................................................B-3
Express Connect Option ...........................................................................................................................B-4
Auto-Negotiate Option ..............................................................................................................................B-4
Enable Auto-Negotiated Baud Rate Option ..............................................................................................B-4
Request-to-Send (RTS) Line Option ......................................................................................................... B-4
Enable Modbus Address Support for Firmware Versions 1.06 through 1.08 ............................................B-4
Timing Parameters ....................................................................................................................................B-4
Downloading Options ......................................................................................................................................B-5
Advanced Options ........................................................................................................................................... B-6
Clear EEPROM ......................................................................................................................................... B-6
Automatic Data Logging ............................................................................................................................B-6
Appendix C—Lithium Battery Information ..................................................................................................C-1
Lithium Battery Disposal .................................................................................................................................C-1
Transportation Information ..............................................................................................................................C-1
Material Safety Data Sheet..............................................................................................................................C-1
iii
Page 6

Table of Contents MC-III™ EXP Flow Analyzer
Appendix D—Communications Protocol ....................................................................................................D-1
Introduction ......................................................................................................................................................D-1
Supported Commands.....................................................................................................................................D-1
Data Types ......................................................................................................................................................D-1
Registers ........................................................................................................................................................D-2
System Conguration ................................................................................................................................D-3
Product Code (register 1000) ....................................................................................................................D-4
Firmware/Register Table Version Numbers (registers 1001, 1002) ..........................................................D-4
Manufacture Date/Sales Date (registers 1003, 1004) ...............................................................................D-4
Slave Address (register 1009) ...................................................................................................................D-4
Baud Rate (register 1010) .........................................................................................................................D-4
Real Time ..................................................................................................................................................D-5
Input Conguration ....................................................................................................................................D-5
Output Conguration .................................................................................................................................D-8
Holding Registers (16-bit Mode) ...............................................................................................................D-9
Base Units/Congured Units ................................................................................................................... D-11
Conversion Factors ................................................................................................................................. D-11
Polling Registers ..................................................................................................................................... D-11
Pointer/Daily/Event Pointer (registers 17001 through 17006) .................................................................D-11
Real Date (registers 17007, 17008) ........................................................................................................ D-11
Real Time (registers 17009, 17010) ........................................................................................................D-12
Totals ......................................................................................................................................................D-12
Pulse Output Pulses (register 17077) .....................................................................................................D-12
Analog Output Current (register 17079) ..................................................................................................D-12
Calculated K-Factor (register 17081) ......................................................................................................D-12
Holding Registers (32-bit Mode) .............................................................................................................D-12
Control Register ......................................................................................................................................D-14
Wellsite Parameters ................................................................................................................................D-15
Log Data .................................................................................................................................................D-15
Enron Registers ......................................................................................................................................D-16
Enron Hourly/Daily Record Format .........................................................................................................D-16
Enron Event Record Format ...................................................................................................................D-16
Reset Status ...........................................................................................................................................D-17
Log Capacity ...........................................................................................................................................D-17
iv
Page 7

MC-III™ EXP Flow Analyzer Section 1
Section 1—Introduction
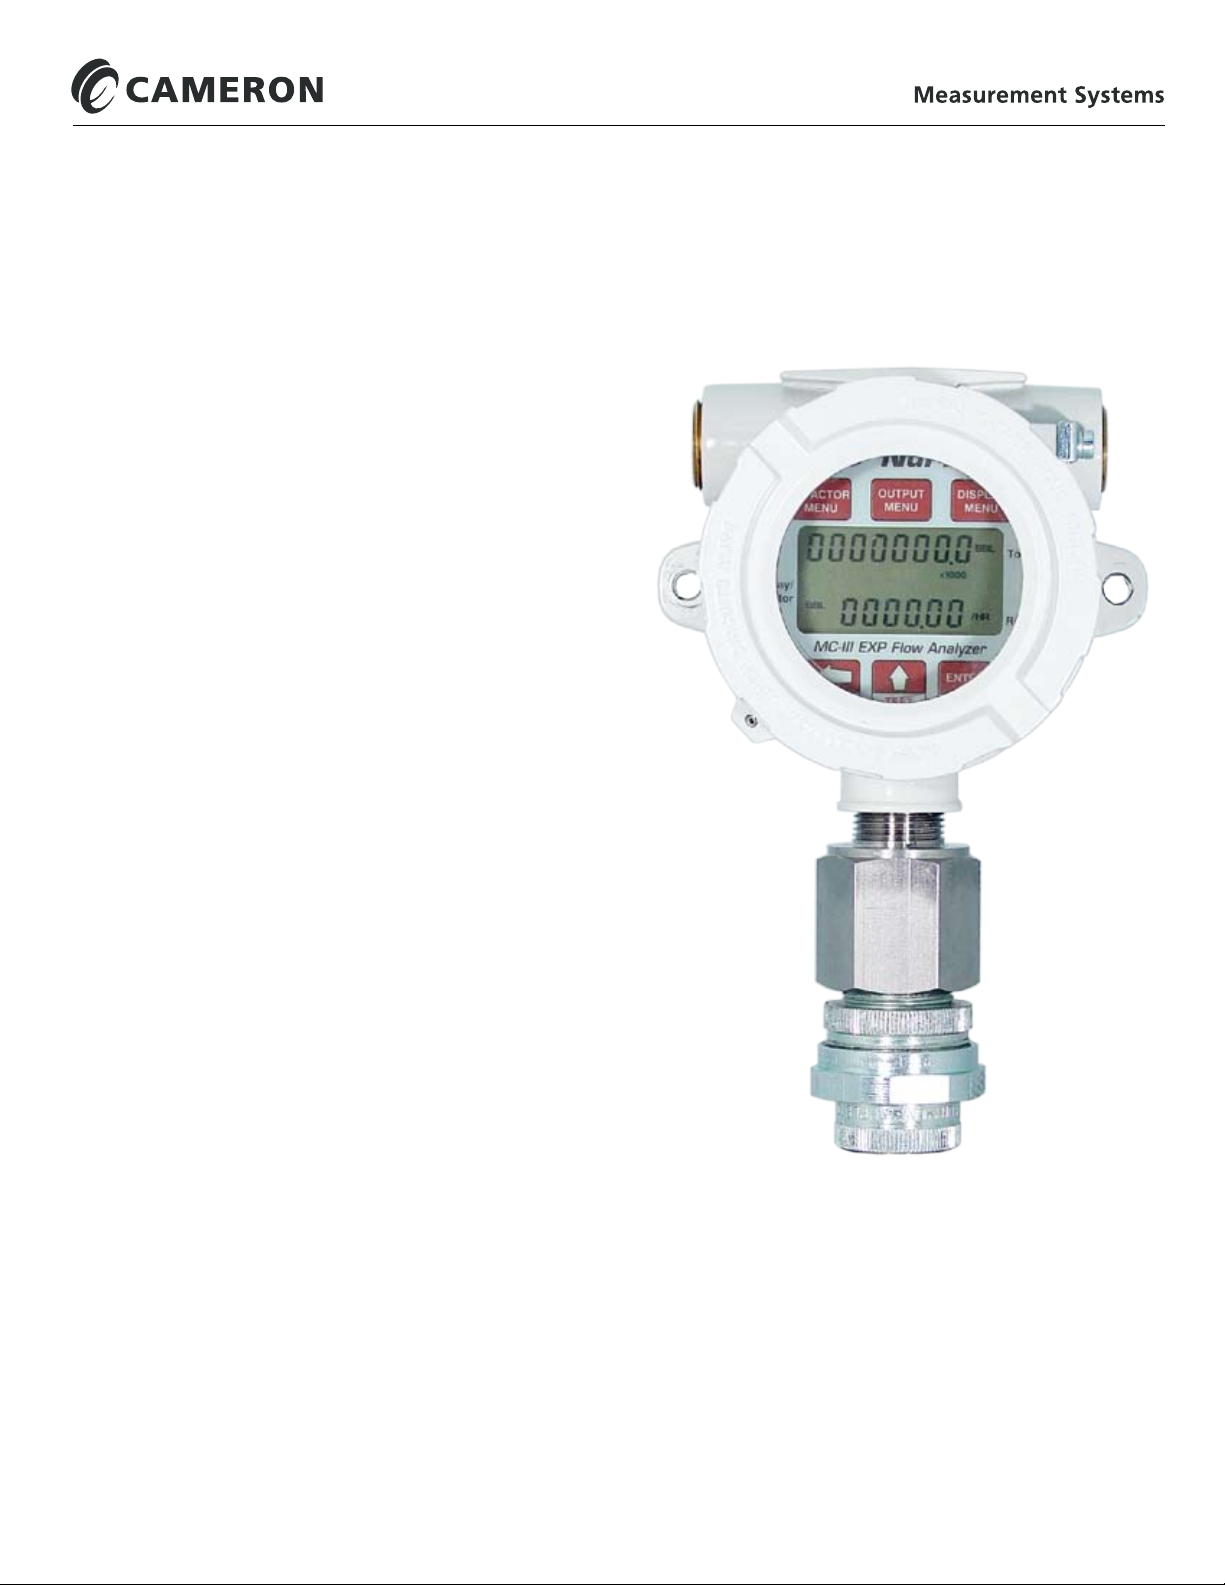
The NuFlo™ MC-III™ EXP Flow Analyzer (Figure 1.1) packs a full spectrum of gas and liquid measurement
functionality, high-speed performance, and log archive and retrieval capabilities in an easy-to-use, explosionproof totalizer. Commonly used operations can be accessed from the six-button keypad on the front of the
instrument or from the dynamic interface software, allowing you to calibrate and congure the unit quickly
and easily.
Operation
The MC-III EXP calculates and displays
instantaneous ow rates and accumulated totals
based on a turbine owmeter input signal. The
MC-III’s microprocessor circuitry counts the
pulses generated by a companion owmeter,
converts that data into volume and rate values
in accordance with calibration settings, and
displays the totalized data on a two-line liquid
crystal display (LCD). The eight-digit top readout
indicates total ow volume; the six-digit bottom
readout indicates ow rate.
With the press of a single key, totals are saved to
nonvolatile memory, minimizing the risk of data
loss even if a power outage occurs.
Up to 384 daily logs, 768 hourly logs, and 345
event logs can be archived and accessed quickly
on demand.
Offering a variety of user-congurable display
options, input and output options, RS-485
Modbus® compatibility, ow logging, and turbine
owmeter linearization, the MC-III EXP is one
of the most versatile totalizers on the market. For
specications, see Table 1.1, page 2.
An optional explosion-proof reset switch further
expands the unit’s versatility, making it possible
to reset the total and view daily ow logs without
opening the enclosure.
Figure 1.1—MC-III EXP ow analyzer
1
Page 8

Section 1 MC-III™ EXP Flow Analyzer
Table 1.1—MC-III EXP Specications
Enclosure CSA-approved for US and Canada
Class I, Div. 1, Groups B, C, D (explosion-proof)
Type 4 enclosure
T6 temperature class
System Power Internal power supply
3.6 VDC, D-size lithium battery (2-year typical life)
•
alkaline battery pack containing 3 C-size industrial-grade batteries
•
External power supply (6 to 30 VDC) with internal battery backup (reverse
polarity protected)
Loop-powered (4-20 mA) with internal battery backup
(reverse polarity protected)
Loop power: 8 to 30 VDC
Load resistance: 1100 ohms @ 30 VDC; 200 ohms @ 12 VDC
Operating Temperature Lithium-Powered: -40°C to 70°C (-40°F to 158°F)
Alkaline-Powered: -18°C to 55°C (0°F to 130°F)
LCD contrast is reduced below -20°C (-4°F)
LCD Display 8-digit Total (volume) display (7-segment characters)
6-digit Rate display (11-segment characters for easy-to-read prompts)
0.3” character height
Adjustable contrast and update period
User-selectable units of measurement (Total):
Preprogrammed units: BBL, GAL, LIT, M3, CF, SCF, any unit x 1000
•
User-dened units
•
User-selectable units of measurement (Rate):
Preprogrammed units: BBL, GAL, LIT, M3, CF, SCF (per DAY, HR,
•
MIN, SEC), any unit x 1000 (per DAY, HR, MIN, SEC)
User-dened units
•
Keypad 6-key membrane switch
Communications/
Archive Retrieval
Logging 384 daily logs
Inputs Turbine Meter Input
RS-485 Modbus® communications with transfer speeds up to 115.2K (allows
full download in less than 1 minute)
768 hourly logs
345 event logs
Congurable sensitivity adjustment via front panel
Sensitivity adjustment range: 20 mV P-P to 40 mV P-P
Frequency range: 0 to 3500 Hz
Remote Reset Input
Optically-isolated input
3.0 to 30 VDC
Pulse duration > 3 seconds to reset
Explosion-Proof Reset Switch (option)
Press and hold > 3 seconds, then release to reset total
Press and hold < 1 second, then release to view daily log data
2
Page 9

MC-III™ EXP Flow Analyzer Section 1
Table 1.1—MC-III EXP Specications
Inputs (cont’d) Pulse Input
Optically-isolated input
3.0 to 30 VDC
Outputs Analog Output
4-20 mA, loop-powered (two-wire)
16-bit resolution
Accuracy: 0.1% of full scale @ 25°C, 50 PPM/°C temperature drift
Loop power: 8.0 to 30 VDC
Zero and full-scale engineering values congurable from front panel
RS-485 Communications
Baud rates: 300, 600, 1200, 2400, 4800, 9600, 19200, 38400, 57600 and up
to 115.2K
Volumetric Pulse Output
Solid-state relay
Output rating: 60 mA max. @ 50 VDC, on-state drop = 1.4 VDC @ 50 mA,
0.25 VDC @ 10 mA
Congurable pulse width (duration): 10 to 60,000 ms
Amp & Square (Flowmeter Frequency) Output
Open-drain transistor output of turbine meter input signal
Output rating: 50 mA @ 30 VDC, on-state drop = 0.3 VDC @ 50 mA,
0.1 VDC @ 10 mA
(Analog output and amp & square outputs cannot be used simultaneously.)
Modbus
Enron Modbus
System Requirements Operating System - Windows 2000 or later (Windows XP recommended)
®
®
RTU mode Modbus® supports 16-bit and 32-bit holding registers. For more
information, see Appendix D.
Flow log parameters (time stamp, period total, period run time, and supply
voltage) and download method are Enron-compatible.
Computer/Processor - 1 GHz or faster Pentium-compatible CPU
Memory - 128 MB of RAM
Hard Disk Space - 21 MB for program les, 30 MB for Adobe Reader,
adequate space for data les
Drive - CD-ROM for install
Display - 800 x 600 (SVGA), 16-bit (thousands of colors) color display or
greater
Browser - Internet Explorer 4 or later
Internet Connection - for web links, tech support
Communications Port - physical or virtual RS-232 compatible serial port
Key Product Features
This section presents an overview of key features of the MC-III EXP. Many of these features are discussed in
more detail in Sections 3 and 4 (conguration procedures) and Section 5 (ow log archival).
Key features discussed here include:
LCD display
•
keypad
•
interface software
•
3
Page 10

Section 1 MC-III™ EXP Flow Analyzer
power supply
•
calibration options
•
input options
•
output options
•
ow log archival
•
password-protected security
•
explosion-proof reset switch (option)
•
RS-485 IS barrier (option)
•
LCD Display
The liquid crystal display (Figure 1.2, page 5) provides a simultaneous indication of accumulated total (top
readout) and ow rate (bottom readout). The eight-digit total display uses 7-segment characters to form
numbers and letters, which results in a combination of uppercase and lowercase letters. The six-digit ow rate
display uses 11-segment characters to form numbers and letters for improved readability. When the keypad
is used to calibrate the MC-III EXP, the name of the menu option selected appears in the lower (rate) display,
and settings are entered in the top (total) display.
Flow volume can be measured in barrels, gallons, liters, cubic meters, cubic feet, standard cubic feet or other
user-dened units. A multiplication factor is also available for indicating ow volume in terms of 1,000 units.
The unit of measure for the Total readout and the decimal point position are selected by the operator during
calibration. If a user-dened unit is used, none of the preprogrammed volume units will be visible on the
display during operation.
Flow rate can be measured in a wide variety of preprogrammed units, or other user-dened units. The ow
rate unit of measure is selected in two steps: (1) a volume unit is chosen and (2) a time-base unit (per day, per
hour, per minute, or per second) is chosen. Users can choose any combination of preprogrammed volume and
time units in establishing the ow rate engineering unit (for example, gallons per hour, gallons per day, or
gallons per minute). Also, the volume unit used for the ow rate can be different from the volume unit used to
read Total volume. The unit of measure for the Rate readout and the decimal point position are selected by the
operator during calibration.
The daily index (Day) display is a two-digit number for selecting a daily archive log for viewing. The number
shown here represents the number of days that have passed since the log was saved. For example, an entry of
01 would yield yesterday’s log. An entry of 05 would yield the log generated 5 days ago. Up to 99 consecutive
daily logs can be viewed using the keypad. In addition, up to 384 daily logs, 768 hourly logs, and 345 event
logs can be viewed through the interface software.
The LCD contrast can be adjusted with the interface software (see Section 4).
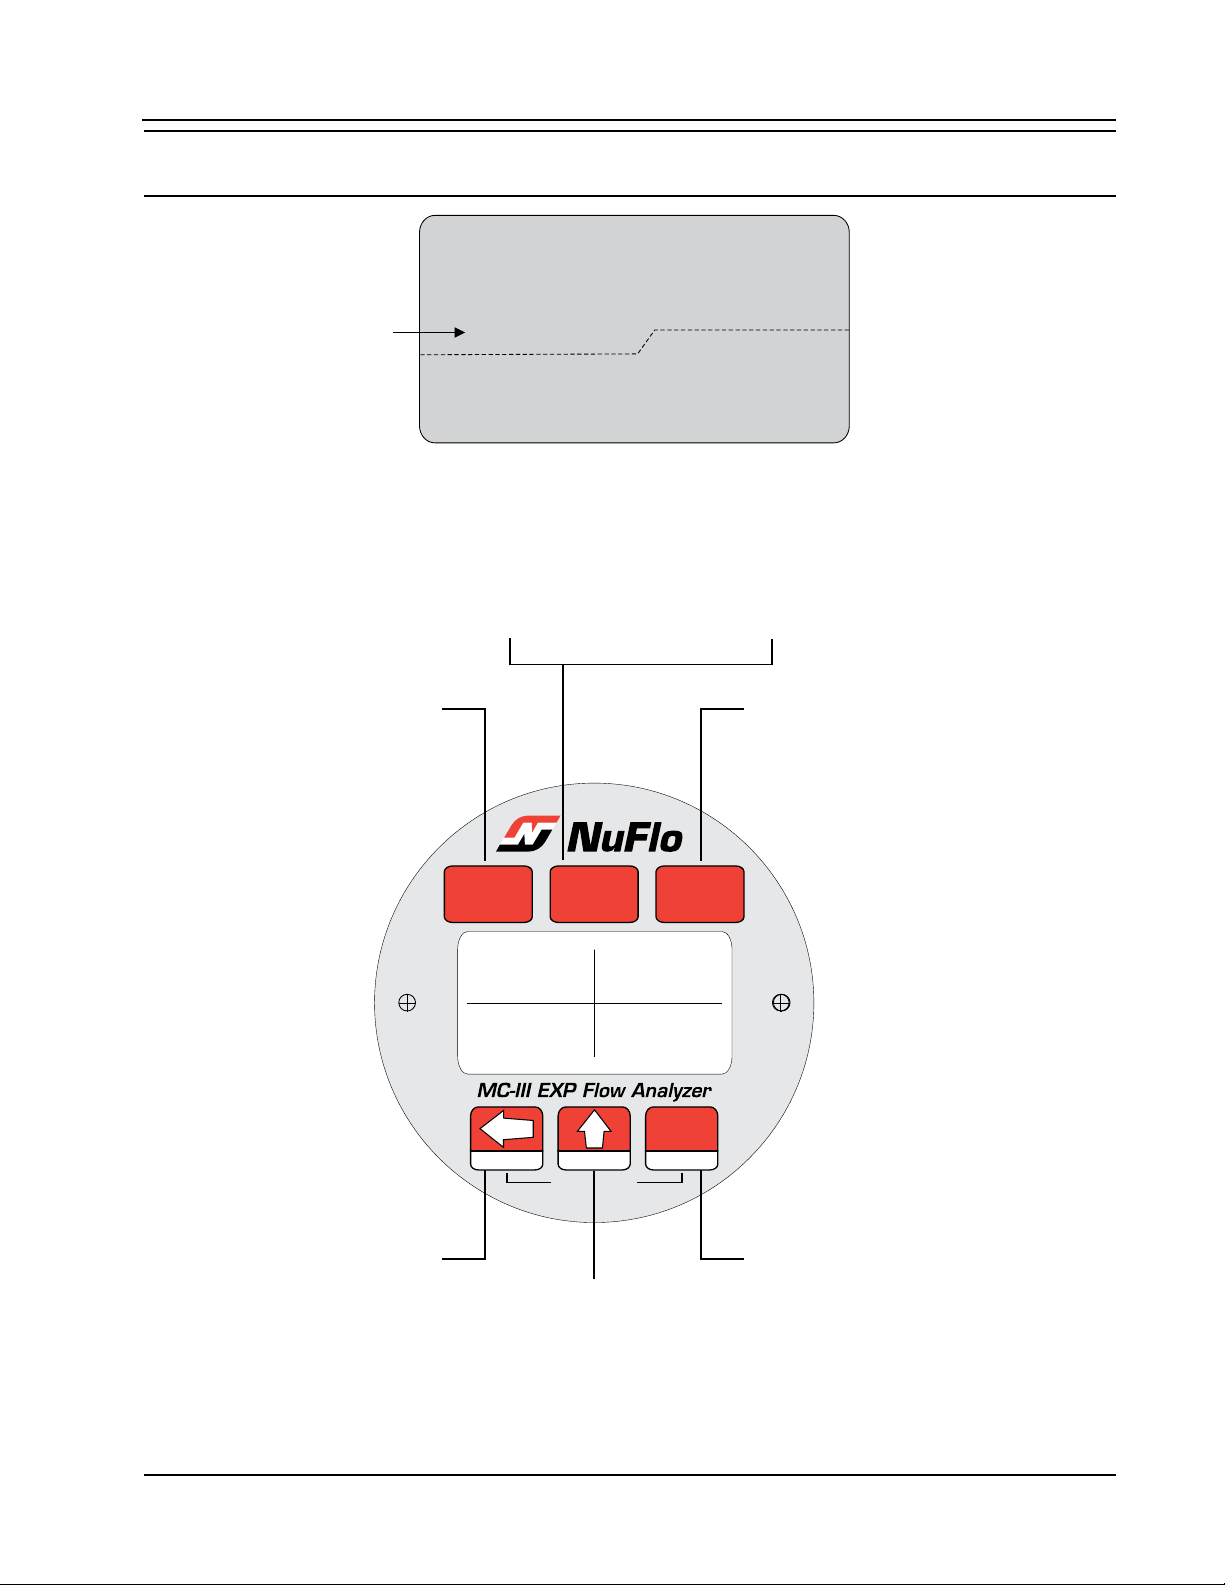
Keypad
The six-button keypad allows users to perform a basic conguration of the instrument. Figure 1.3, page
5, summarizes the functions that can be accessed with each button. Most parameters can be congured in
seconds by selecting one of the three menu keys (K-Factor, Output, or Display), navigating settings with the
arrow buttons, and saving the selections with the Enter key.
Section 3 contains procedures for conguring the MC-III EXP using the keypad. Icons of the six buttons
provide a pictorial reference to help guide users through each step of conguration.
4
Page 11
MC-III™ EXP Flow Analyzer Section 1
00000000
000000
M
3
BBL
GAL
LIT
M
3
BBL
GAL
LIT
/SEC
/MIN
/HR
/DAY
CF
CF
X1000
X1000
STANDARD
00
Day
Total
Rate
$)30,!9
-%.5
+&!#4/2
-%.5
/54054
-%.5
2%3%44/4!,
,/' 4%34 3!6%
%.4%2
$AY
4OTAL
2ATE
Calibrate instrument
Set flowmeter input sensitivity
Select pulse input
Enable/disable/set up 4-20 mA output
pulse output
Enter slave address
Enter baud rate
Enable/disable/set up
Set engineering units for Total readout
Set engineering units for Rate readout
Set decimal placement for both readouts
During calibration, navigates
between submenus and scrolls
through menu selections
During operation, accesses
daily volume archive
During calibration, incrementally
changes digits and decimal point
position, on/off settings
During operation, tests temperature
and system voltage
During calibration, saves
calibration settings
During operation, saves
Total to nonvolatile memory
Note: To zero the Total
readout, press the LOG (left
arrow) and SAVE (ENTER)
keys simultaneously.
Important: Some conguration parameters are accessible only through the interface software. See
Section 4 for instructions on conguring the instrument using the software.
Figure 1.2—LCD display showing location of the Total, Rate, and daily index (Day) displays. Only the units of
measurement selected for displaying total and rate will be visible during normal operation.
Figure 1.3—MC-III EXP keypad functions
5
Page 12

Section 1 MC-III™ EXP Flow Analyzer
Interface Software
Developed within the familiar Windows environment, the MC-III interface software is an intuitive and
easy-to-use application that provides access to all controls for setting up and operating the instrument. The
interface tailors the controls to the user’s needs, providing three options for conguring the instrument:
a “Conguration Wizard,” which steps through the most common conguration tasks
•
individual conguration menus for accessing specic settings
•
an advanced menu that gives host programmers access to Modbus® registers
•
For instructions on installing the interface software and entering conguration parameters via the interface
software, see Section 4.
Power Supply
The MC-III EXP is shipped with either a lithium battery or an alkaline battery pack. Alternately, the MC-III
EXP may be powered by an external power source; in this case, the lithium battery or alkaline battery pack
provides a backup power supply, signicantly extending battery service life. Low-power microprocessor
technology enables the MC-III EXP to operate approximately 2 years on a single lithium battery.
Wiring diagrams for connecting an external power supply are provided in Section 2.
Multipoint Linearization
The MC-III interface software supports up to 12 calibration points in addition to single-point calibration based
on the K-factor provided with the turbine owmeter. See K-Factor Type, page 56, for more information.
Gas Volume Correction
Gas turbine meters are calibrated in actual cubic feet (ACF), and measure gas in actual cubic feet. In some
applications, a user may benet from referencing gas measurements back to standard conditions by measuring
in terms of standard cubic feet (SCF). The MC-III EXP makes this process quick and easy, by using xed
average values for the owing gas temperature and owing gas pressure. See Gas Volume Correction, page
58, for more information.
Input Options
The owmeter signal can be obtained from a magnetic pickup or a pre-amplier device. The sensitivity of
the owmeter input may be adjusted with the instrument keypad or the interface software. See Section 2 for
wiring diagrams. See Sections 3 and 4 for conguration procedures.
Output Options
The MC-III EXP standard circuitry provides:
a scaled pulse output representing an increment in volume for each pulse
•
a loop-powered 4-20 mA output representing the ow rate
•
a owmeter frequency output for use with remote equipment to derive ow rate and volume
•
an RS-485 output for communication with interface software or other telemetry equipment
•
When the 4-20 mA rate output feature is used, the MC-III EXP is powered by the current loop, and the lithium
battery or alkaline battery pack is used as a backup supply.
The pulse output and 4-20 mA output features should be turned off when not required for reduced current
consumption. See Section 2 for wiring diagrams. See Sections 3 and 4 for conguration procedures.
6
Page 13

MC-III™ EXP Flow Analyzer Section 1
Flow Log Archival
The MC-III EXP saves up to 384 daily logs and 768 hourly logs in nonvolatile memory. By connecting with
the interface software, users can download the logs for viewing and/or printing in tabular format or in a trend
chart.
Users can also export daily and hourly logs to a spreadsheet. For more information, see Section 5.
Event Log Archival
The MC-III EXP saves up to 345 user event logs. Event logs are generated to track user changes such as K-
Factor changes, input setting changes, power-on reset and “watch-dog” reset, ow cut-off and frequency cut-
off.
By connecting with the interface software, users can download the logs for viewing and/or printing in tabular
format. In addition to showing old and new values, each event log is time-stamped, and includes the register
associated with the change. For more information, see Section 5.
Password-Protected Security
A keypad security access code prevents unauthorized personnel from altering the calibration or accumulated
volume data in the instrument. The security feature may be disabled if this protection is not required.
Password-protected security access is enabled using the interface software. When this feature is enabled,
the user will be prompted for a password when attempting to enter any menu from the keypad. For more
information, see Security Setup, page 51.
Optional Features
Explosion-Proof Reset/Control Switch
An optional external reset/control switch can be mounted in either of the conduit openings near the top of
the MC-III EXP enclosure, allowing the user to zero the total and view daily logs instantaneously without
opening the enclosure or accessing the interface software. When the switch assembly is ordered with an MCIII EXP, it is factory installed. When ordered separately, the switch assembly is easily installed using the
instructions provided in this manual. For installation and wiring instructions, see Appendix A.
Zeroing the Total. To reset the total with an explosion-proof switch, press and hold the switch for 3 seconds,
then release it.
Important: When resetting the total with the explosion-proof reset switch, do not release the switch
prematurely. Releasing the switch too quickly (before 3 seconds have passed) will
activate the daily log view function and WILL NOT reset the volume to zero.
Viewing Daily Logs. To view daily logs with the explosion-proof switch, press the switch for 1 second
and release it. Subsequent press-and-release actions increment the daily index, allowing the user to select
a specic daily total. Additionally, when the log viewing function times out, the accumulated total is
automatically saved to memory.
Saving the Total. When the daily log display times out, the MC-III EXP will automatically save the
accumulated total.
Explosion-Proof Communications Adapter
An explosion-proof communications adapter provides an RS-485 connection for connecting a laptop or PC
to the instrument without removing the instrument cover. When the adapter is ordered with an MC-III EXP,
7
Page 14

Section 1 MC-III™ EXP Flow Analyzer
it is factory installed. It may be relocated to either conduit opening in the instrument housing. When ordered
separately, the adapter is easily installed using the instructions provided in this manual. For installation and
wiring instructions, see Appendix A.
RS-485 IS Barrier
The MC-III EXP’s RS-485 output is approved for intrinsically safe installations. An intrinsically safe barrier
assembly with a conduit seal enables the RS-485 output to be used as an intrinsically safe output. In such
installations, only the turbine owmeter input may be used. See Figure 2.15 (page 21) for an IS barrier
assembly wiring diagram.
Commonly Used Functions
While the functions of the MC-III EXP are too numerous to mention, some of the most commonly used
functions are detailed in this section. They include:
reading the rate and accumulated total
•
saving totals to memory
•
resetting the total
•
viewing daily and hourly logs
•
saving and uploading conguration les
•
exporting log data to spreadsheet
•
saving log data in a report
•
Reading Totals
Current totals can be viewed from the LCD on the front of the MC-III EXP or from the interface software
(MC-III Main screen). The software calculates the ow total and updates the LCD display every 4 seconds, by
default. The user can adjust the calculation period with the interface software. See Calculation Period, page
55, for more information.
Saving Totals to Memory
Hourly and daily totals are automatically saved to nonvolatile memory. A user may also save an accumulated
total at any time by opening the enclosure and pressing ENTER (SAVE) on the keypad. In the event of a
power failure, the last saved total will be displayed on the LCD when power is restored. See also Explosion-
Proof Reset/Control Switch, page 7.
Note: Always save the accumulated total before replacing batteries.
Resetting the Total
Totals can be reset to zero using the keypad, the interface software, an explosion-proof switch mounted in the
top of the enclosure (if equipped), or a pulse from an external device.
To reset the total with the keypad, press LEFT ARROW (LOG) and ENTER (SAVE) keys simultaneously.
•
To reset the total with the interface software, double-click the NuFlo MC-III icon on the computer desk-
•
top and wait for the software to connect to the instrument; then select MC-III Main from the Device
Autorun Options screen, and click on the “Reset Flow Total” button in the lower right corner of the Main
screen.
8
Page 15

MC-III™ EXP Flow Analyzer Section 1
To reset the total with an explosion-proof switch, press and hold the switch for 3 seconds, then release it.
•
See also Explosion-Proof Reset/Control Switch, page 7.
To reset the total with an external pulse generator located in safe area, congure the pulse to be active for
•
3 seconds. See also Remote Reset Input, page 16.
Viewing Daily and Hourly Logs
Each day, as the user-dened contract hour passes, a daily ow total is saved to nonvolatile memory. Hourly
logs are also automatically saved. A total of 384 daily logs and 768 hourly logs are accessible for viewing and
exporting using the interface software. See Section 5 for details.
Up to 99 daily ow log totals can be viewed from the LCD. Hourly ow log totals are accessible only through
the interface software.
To view daily ow totals from the LCD, perform the following steps:
Press the LEFT ARROW (LOG) key on the keypad. The words “Daily Volume Archive” will scroll across
1.
the bottom of the LCD and the day index will display “01.” The daily ow total recorded at the last contract hour will appear at the top of the LCD.
The index number represents the number of days previous to the current date. For example, yesterday’s
totals are read by entering an index of “01”; totals from two days previous are read by entering “02.”
2.
Press UP ARROW (TEST) to increment the index (01, 02, 03...); press LEFT ARROW (LOG) to decre
ment the index (01, 99, 98...).
3.
Press Enter (Save) to exit the Daily Volume Archive menu. (After 2 minutes of inactivity, the Daily Vol
ume Archive menu will timeout and the total readout will be restored automatically.)
The optional explosion-proof reset switch also allows users to view daily log totals. For more information, see
Explosion-Proof Reset/Control Switch, page 7.
-
-
Saving and Uploading Conguration Files
The MC-III interface software allows users to save an unlimited number of conguration les to their
computer. In the event that a conguration setting gets changed unintentionally or a user simply wants to
restore the settings he used previously, the user can upload the conguration le and resume operation within
minutes. The upload function also allows a conguration le to be loaded quickly into multiple devices. The
default directory for saving conguration les is C:\NuFlo log data\MC-III. However, the user can specify a
different location, if desired.
For complete information, see Saving and Uploading Conguration Files, page 66.
Exporting Log Data
Flow logs and event logs can be directly exported to an .xls or .csv le. For complete information, see
Exporting Flow Logs, page 79, and Exporting Event Logs, page 82. The default directory for exported logs is
C:\NuFlo log data\MC-III. However, the user can specify a different location, if desired.
Saving Log Data in a Report
Flow logs can be saved in a report format that can be loaded back into the software for viewing or printing at
a later time. For complete information, see Printing/Saving a Report, page 75. The default directory for log
reports is C:\NuFlo log data\MC-III\<WELL NAME>. However, the user can specify a different location.
9
Page 16

Section 1 MC-III™ EXP Flow Analyzer
10
Page 17
MC-III™ EXP Flow Analyzer Section 2
Pipe plugs
Explosion-proof
enclosure
3/4-in. to 1-in.
pipe adapter
1-in. pipe union
Cable
assembly
Magnetic pickup
Turbine flowmeter
Section 2—Installation
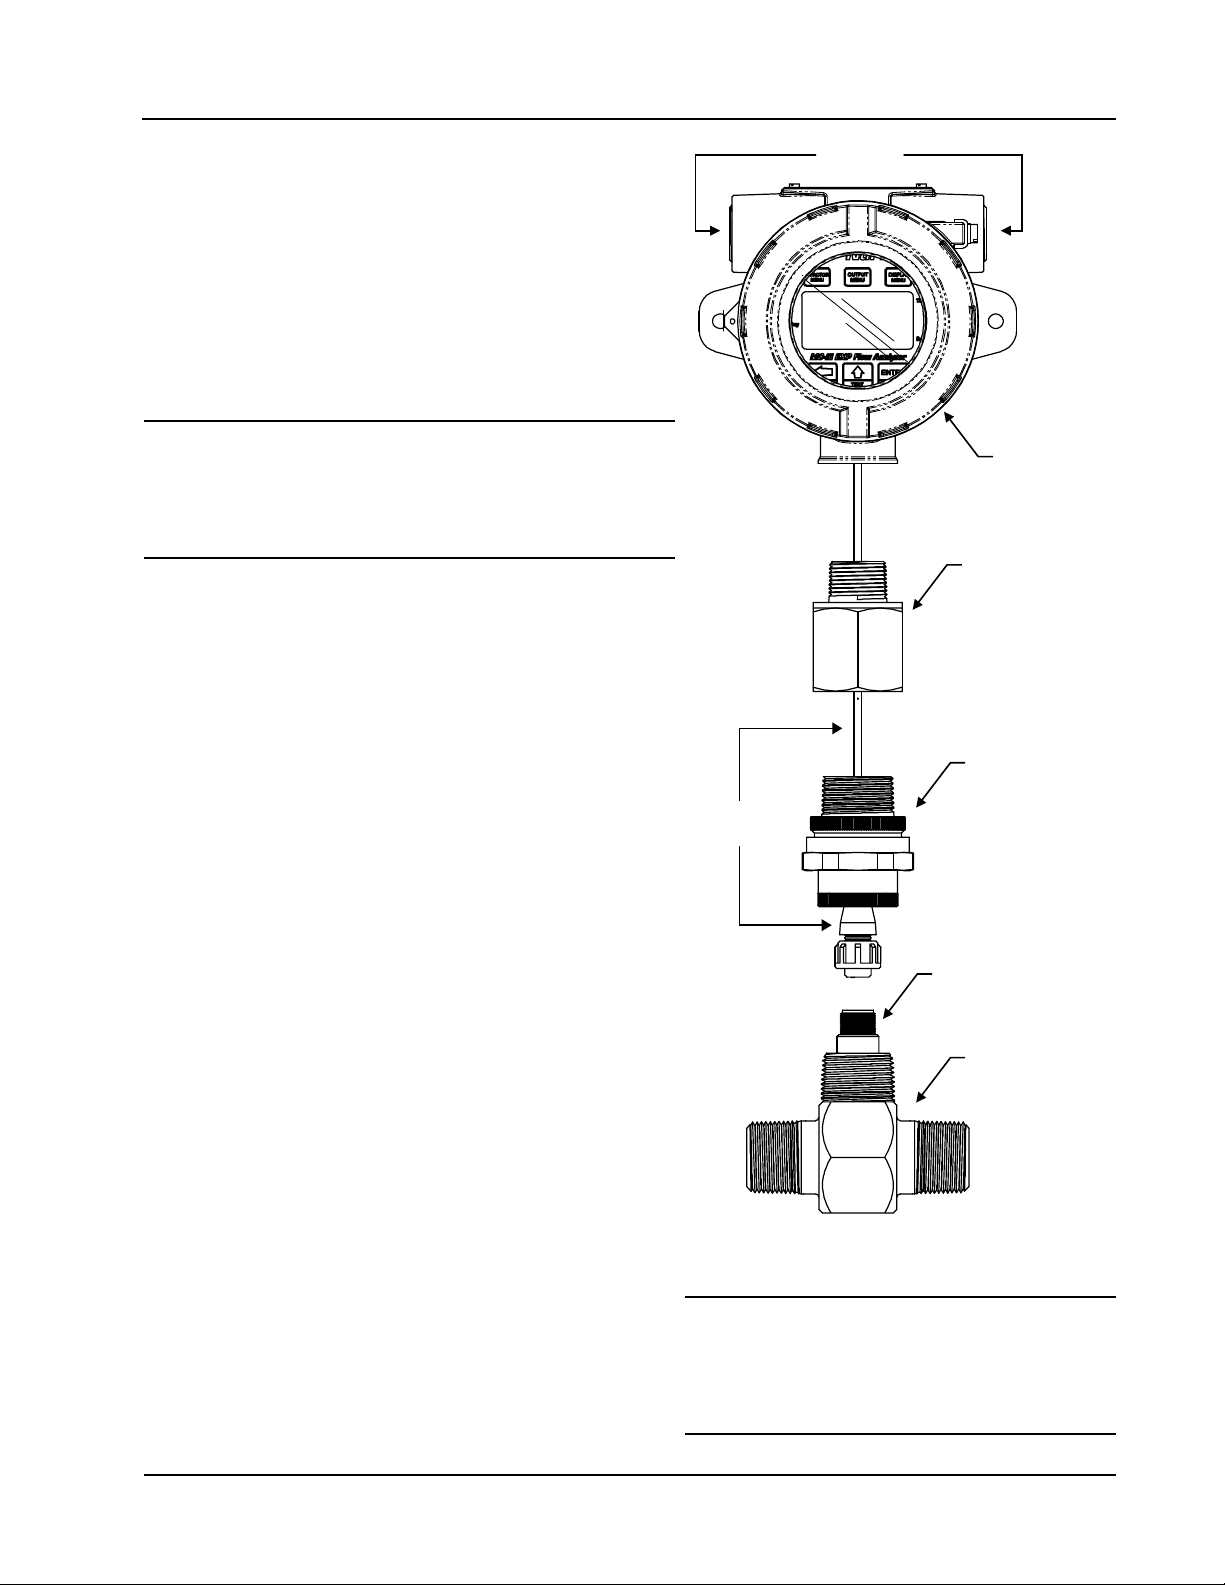
The MC-III™ EXP is fully assembled at the time of
shipment and ready for mounting to a owmeter. The
MC-III EXP is shipped with ¾” recessed pipe plugs
installed facing right and left, and the pipe union facing
downward (Figure 2.1). If the device is equipped with an
explosion-proof reset switch, only one plug is required. The
switch may be installed in the right or left conduit opening.
Warning: To prevent ignition of hazardous
atmospheres, do not remove the cover
while circuits are alive. Under normal
Preparation
Before attempting to install the MC-III EXP, make sure the
owmeter and magnetic pickup are installed as follows:
conditions, the MC-III EXP poses no
hazard when opened in a safe area.
Install the turbine owmeter in the ow line.
1.
Lightly grease the threads on both ends of the magnetic
2.
pickup, taking care to keep grease off of the connector
contacts. If the connector is plastic, apply grease only to
the end that threads into the meter.
3.
Install the magnetic pickup in the owmeter.
4.
After the owmeter and magnetic pickup are installed
in the ow line, mount the MC-III EXP ow analyzer
as described below.
Connection to the Flowmeter
To install the MC-III EXP on a turbine owmeter, perform
the following steps:
Position the MC-III EXP above the owmeter.
1.
Plug the MC-III EXP cable connector into the magnetic
2.
pickup and hand-tighten the knurled nut on the connector.
3.
Screw the MC-III EXP onto the owmeter threads sur
rounding the magnetic pickup with the display facing
the desired direction.
4.
Tighten all sections of the pipe union.
Figure 2.1—Connection of MC-III EXP to a
-
owmeter
Caution: Do not use Teon® tape on
threads of the union, adapter, or
pipe plugs. Use of Teon® tape
will void the explosion-proof
rating of the instrument.
11
Page 18
Section 2 MC-III™ EXP Flow Analyzer
5.71 (145)
6.73
(171.1)
1.75
(44.5)
5.00 (127)
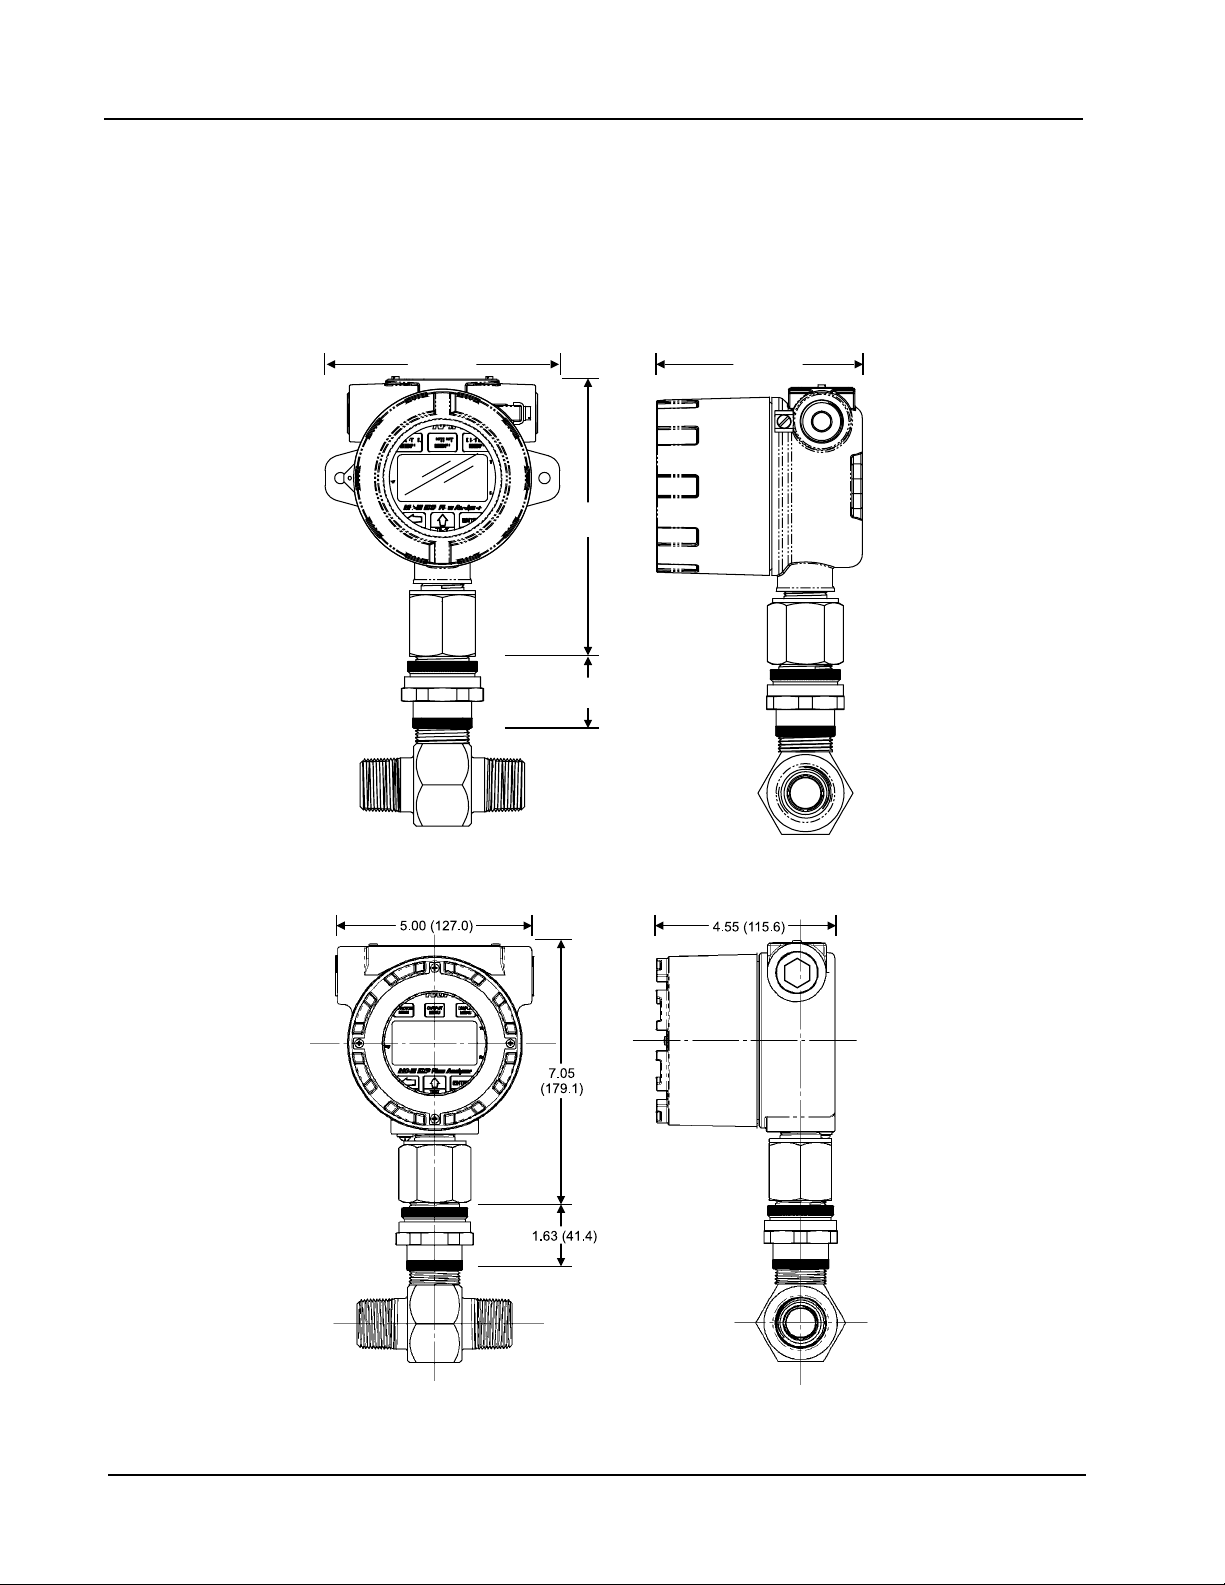
Instrument Dimensions
The MC-III EXP may include either of two enclosure styles. The standard enclosure shown on the cover of
this manual and in Figure 2.2 features mounting holes on either side of the display window, allowing it to be
mounted to a at bulkhead.
The alternate enclosure (Figure 2.3) does not have the bulkhead mounting holes on the sides, and a bright red
ring frames the display window. The alternate enclosure is slightly taller than the standard enclosure.
Figure 2.2—Mount dimensions in inches (millimeters) with standard enclosure
Figure 2.3—Mount dimensions in inches (millimeters) with alternate enclosure
12
Page 19

MC-III™ EXP Flow Analyzer Section 2
Field Wiring Connections
Warning: To prevent ignition of hazardous atmospheres, do not remove the cover while circuits are
alive. Under normal conditions, the MC-III EXP poses no hazard when opened in a safe
area.
To wire the MC-III EXP for operation, complete the following eld connections:
Unscrew the cover of the enclosure counter-clockwise until it separates from the main body of the enclo
1.
sure.
2.
Using a small standard blade screwdriver, remove the two #4-40 × 7/8” screws located to the right and
left side of the display.
3.
Lift the display/keypad assembly from the enclosure, making sure the circuit assembly does not contact
the enclosure.
4.
Connect the lithium battery or alkaline battery pack to the J1 connector on the circuit assembly.
5.
Connect wiring for external power, if appropriate. See
6.
Connect the owmeter or pulse input wiring to terminal block TB1. See
7.
Connect wiring for the remote reset input to terminal block TB1, if appropriate.
page 16.
8.
Connect wiring for output signals, if appropriate.
9.
Place the circuit assembly over the standoffs and fasten with the two #4-40 × 7/8” screws, ensuring that
all connector wiring is inside the enclosure and in no position where it may be damaged when the enclosure cover is replaced.
10.
Recalibrate the MC-III EXP (if necessary).
11.
If external and internal power supplies were removed, reset the clock to ensure that the time stamps in the
log data are accurate. The clock is reset using the MC-III interface software. See Time/Date Synchroniza-
tion, page 50.
Figure 2.4, page 14.
Figures 2.5 and 2.6, page 15.
See Figures 2.7 and 2.8,
See Figures 2.9 through 2.14, pages 17 through 20.
-
12.
Replace the enclosure cover by threading it onto the enclosure in a clockwise direction.
13
Page 20
Section 2 MC-III™ EXP Flow Analyzer
T
B
3
TB1
PULSE
INPUT
RESET
INPUT
TFM
A&S
GND
EXT POWER
TB2
RS485
SLAVE
4-20
OUT
PULSE
OUT
6
-
3
0
V
D
C
PO WE R
SU PP LY
6 to 3 0
VD C
J1
J2
RESET
SWITCH
BATTERY
Power Supply Wiring
Internal Power Supply
The MC-III EXP is shipped with either of two internal power supplies:
a 3.6-V lithium battery or
•
a shrink-wrapped alkaline battery pack containing three C-size industrial-grade batteries
•
Low-power microprocessor technology enables the MC-III EXP analyzer to operate approximately 2 years on
a single lithium battery. The lithium battery is strongly recommended for use in extreme temperatures (below
-20°C).
Users can power the instrument from an external power supply or a 4-20 mA current loop, and use the lithium
or alkaline battery as a backup power supply. The use of an alternate power source extends battery life and
helps ensure that timekeeping and volume accumulation will not be interrupted during a power failure.
Caution: If the MC-III EXP is installed in a hazardous location, all eld wiring must conform to wir-
ing methods for explosion-proof installations as dened in the National Electric Code for
installations within the United States or as specied in the Canadian Electric Code for
installations within Canada. State and local wiring ordinances may also apply.
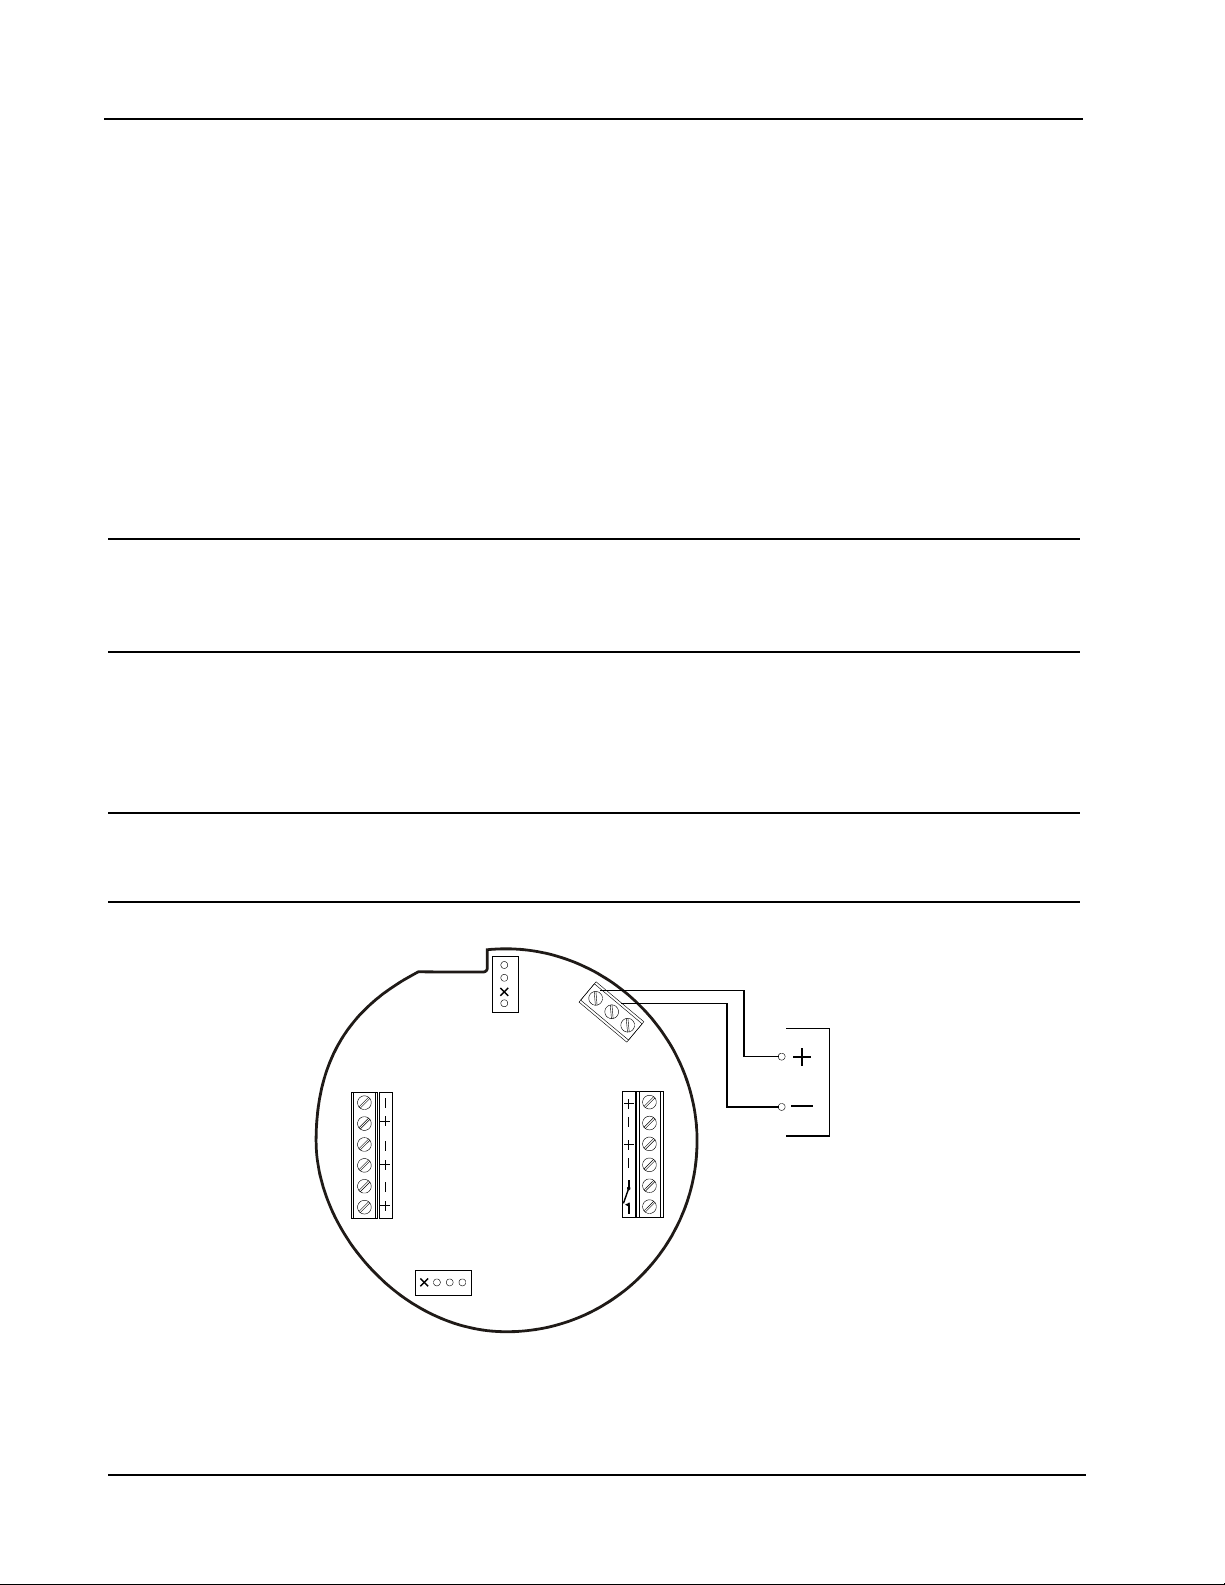
External Power Supply
The MC-III EXP can be connected to a remote power supply by a two-conductor cable (Figure 2.4). The
power supply and cable must be capable of supplying 6 to 30 VDC @ 10 mA. This capability is available
only if the 4-20 mA rate output is not used.
Caution: When using the amp & square output with the external power supply, make sure the
power supplies for both features share a common negative (-) terminal or that they are
totally isolated from each other, since both share a common negative (-) connection.
Figure 2.4—External power supply wiring
14
Page 21
MC-III™ EXP Flow Analyzer Section 2
6
-
3
0
V
D
C
TB1
PULSE
INPUT
RESET
INPUT
TFM
A&S
GND
T
B
3
EXT POWER
TU RB INE
M AG NE TI C PIC KU P
V
M AX
= 3.9 V
J1
J2
RESET
SWITCH
BATTERY
A
B
T
B
3
TB1
PULSE
INPUT
RESET
INPUT
TFM
A&S
GND
EXT POWER
6
-
3
0
V
D
C
J1
J2
RESET
SWITCH
BATTERY
PU LS E IN PU T
3 T O 3 0 VD C
Input Wiring
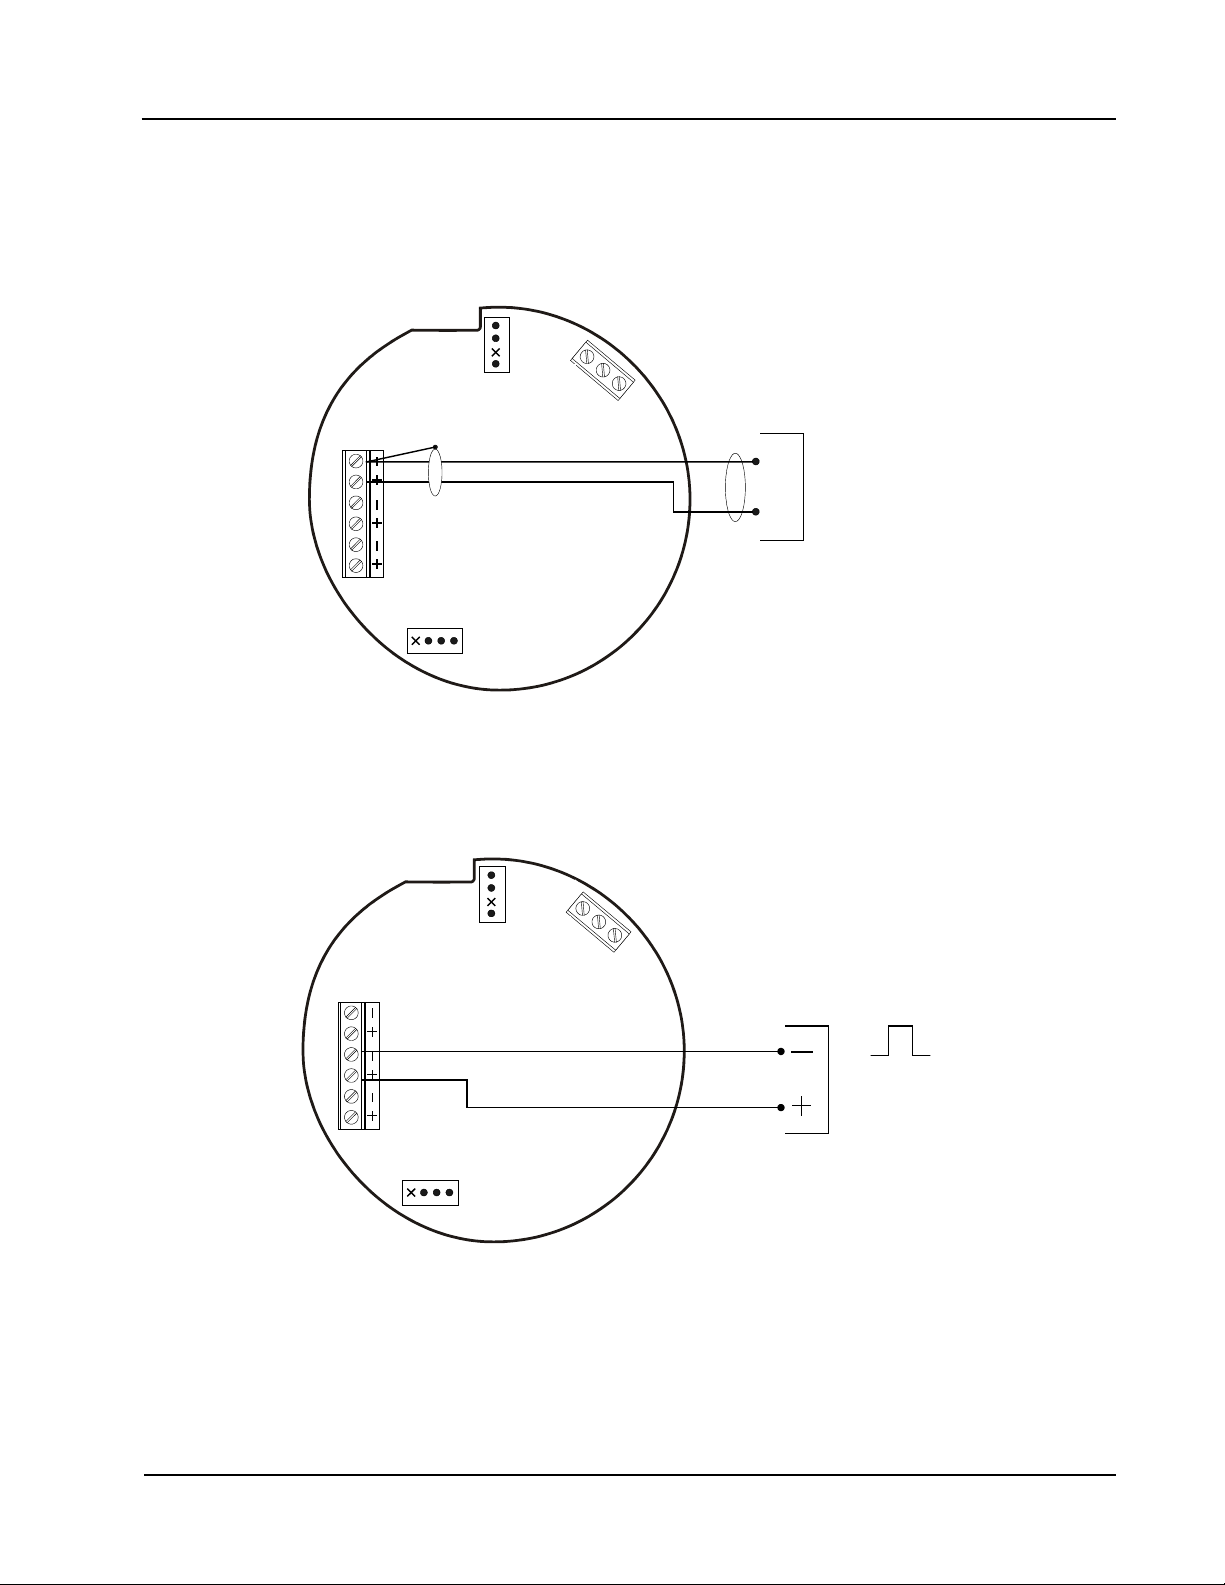
Turbine Flowmeter (TFM) Input
The TFM input provides the turbine owmeter input signal generated by a magnetic pickup, enabling the MCIII to calculate and display instantaneous ow rates and accumulated totals.
Figure 2.5—Flowmeter input wiring
Pulse Input
The pulse input provides an optically isolated input in systems where a preamplier is inserted between the
sensor and the MC-III EXP.
Figure 2.6—Pulse input wiring
15
Page 22
Section 2 MC-III™ EXP Flow Analyzer
TB1
PULSE
INPUT
RESET
INPUT
TFM
A&S
GND
T
B
3
EXT POWER
6
-
3
0
V
D
C
J1
J2
RESET
SWITCH
BATTERY
PO WE R SU PP LY
3 to 3 0 V DC
TB1
PULSE
INPUT
RESET
INPUT
TFM
A&S
GND
T
B
3
EXT POWER
6
-
3
0
V
D
C
J1
J2
RESET
SWITCH
BATTERY
R E SE T PU LS E
3 T O 3 0 VD C
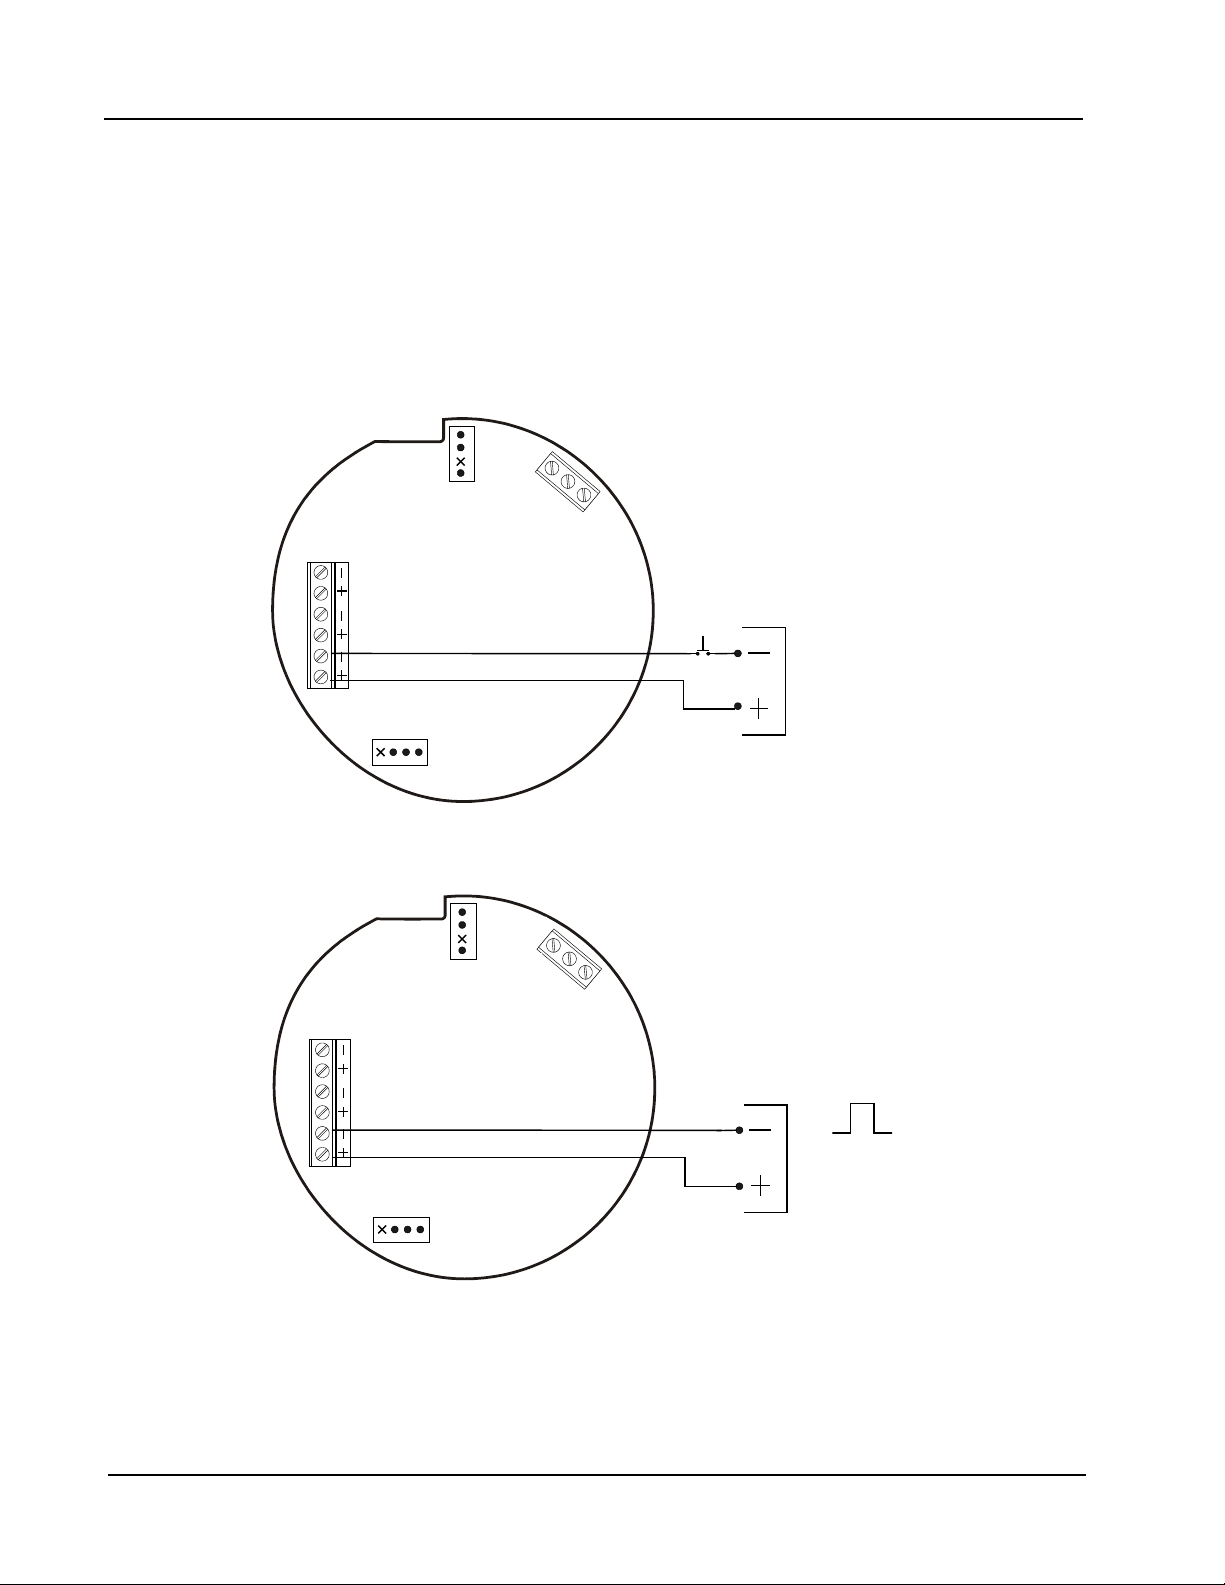
Remote Reset Input
The remote reset input allows the operator to reset the accumulated volume on the MC-III EXP to zero
without opening the enclosure. This input is optically isolated. The input is shown connected in two ways,
with a power supply and switch in a remote location (Figure 2.7), and with a pulse generator in a remote
location (Figure 2.8). The remote reset input can also be controlled with an optional explosion-proof switch
mounted in the top of the enclosure. See Appendix A for installation and wiring instructions.
The reset input, reset pulse, or local reset switch must be active for 3 seconds to clear the total. (The
explosion-proof switch can also be used to view daily logs and to save the accumulated volume to memory
without opening the enclosure. See Explosion-Proof Reset/Control Switch, page 7, for more information.)
Figure 2.7—Reset input wiring (when power supply and reset switch are in a safe area)
Figure 2.8—Reset pulse input wiring (when pulse generator is in a safe area)
16
Page 23
MC-III™ EXP Flow Analyzer Section 2
TB1
PULSE
INPUT
RESET
INPUT
TFM
A&S
GND
T
B
3
EXT POWER
TB2
RS485
SLAVE
4-20
OUT
PULSE
OUT
6
-
3
0
V
D
C
J1
J2
RESET
SWITCH
BATTERY
Le av e th is
en d o f s hie ld
di sco nn ect ed .
PO W ER S UP PL Y
5 to 50 VD C
*
R e s is tor may b e i n c lu de d in puls e re a d o u t
devic e . S iz e t h e re sis tor to lim it th e cu rre nt
to 60 m A .
*
PU LS E RE AD OU T
D EV ICE
Output Wiring
The MC-III EXP supports four outputs: pulse output, 4 to 20 mA output, owmeter frequency (amp & square)
output, and RS-485 output. Wiring diagrams for each feature are provided below.
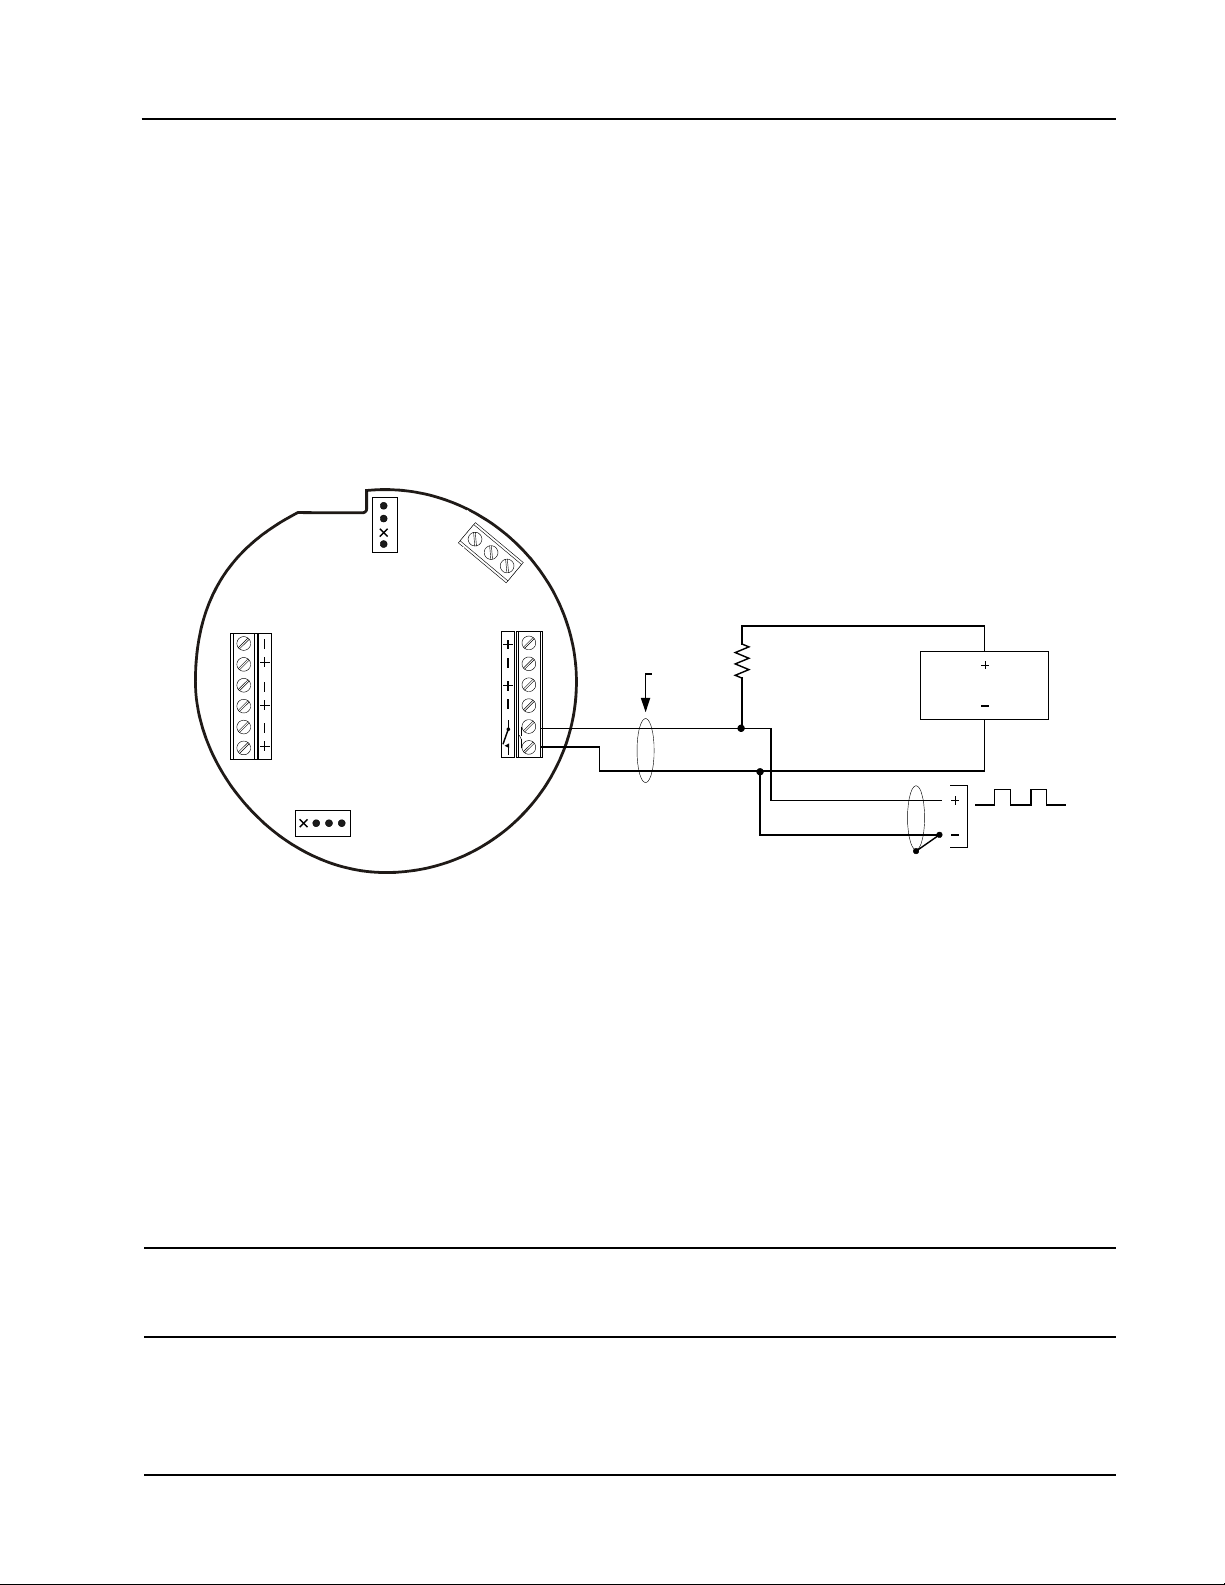
Pulse Output
The pulse output is a solid-state relay. Each pulse represents a user-dened volume. Because the circuit is
isolated, it can be used in conjunction with any other feature on the MC-III EXP. A two-conductor cable from
the MC-III EXP to the remote location is required (Figure 2.9). The maximum current rating of the pulse
output circuit is 60 mA at 50 VDC.
For information on conguring the pulse output with the keypad, see page 32. For information on conguring
the pulse output with the interface software, see page 64.
Figure 2.9—Pulse output wiring
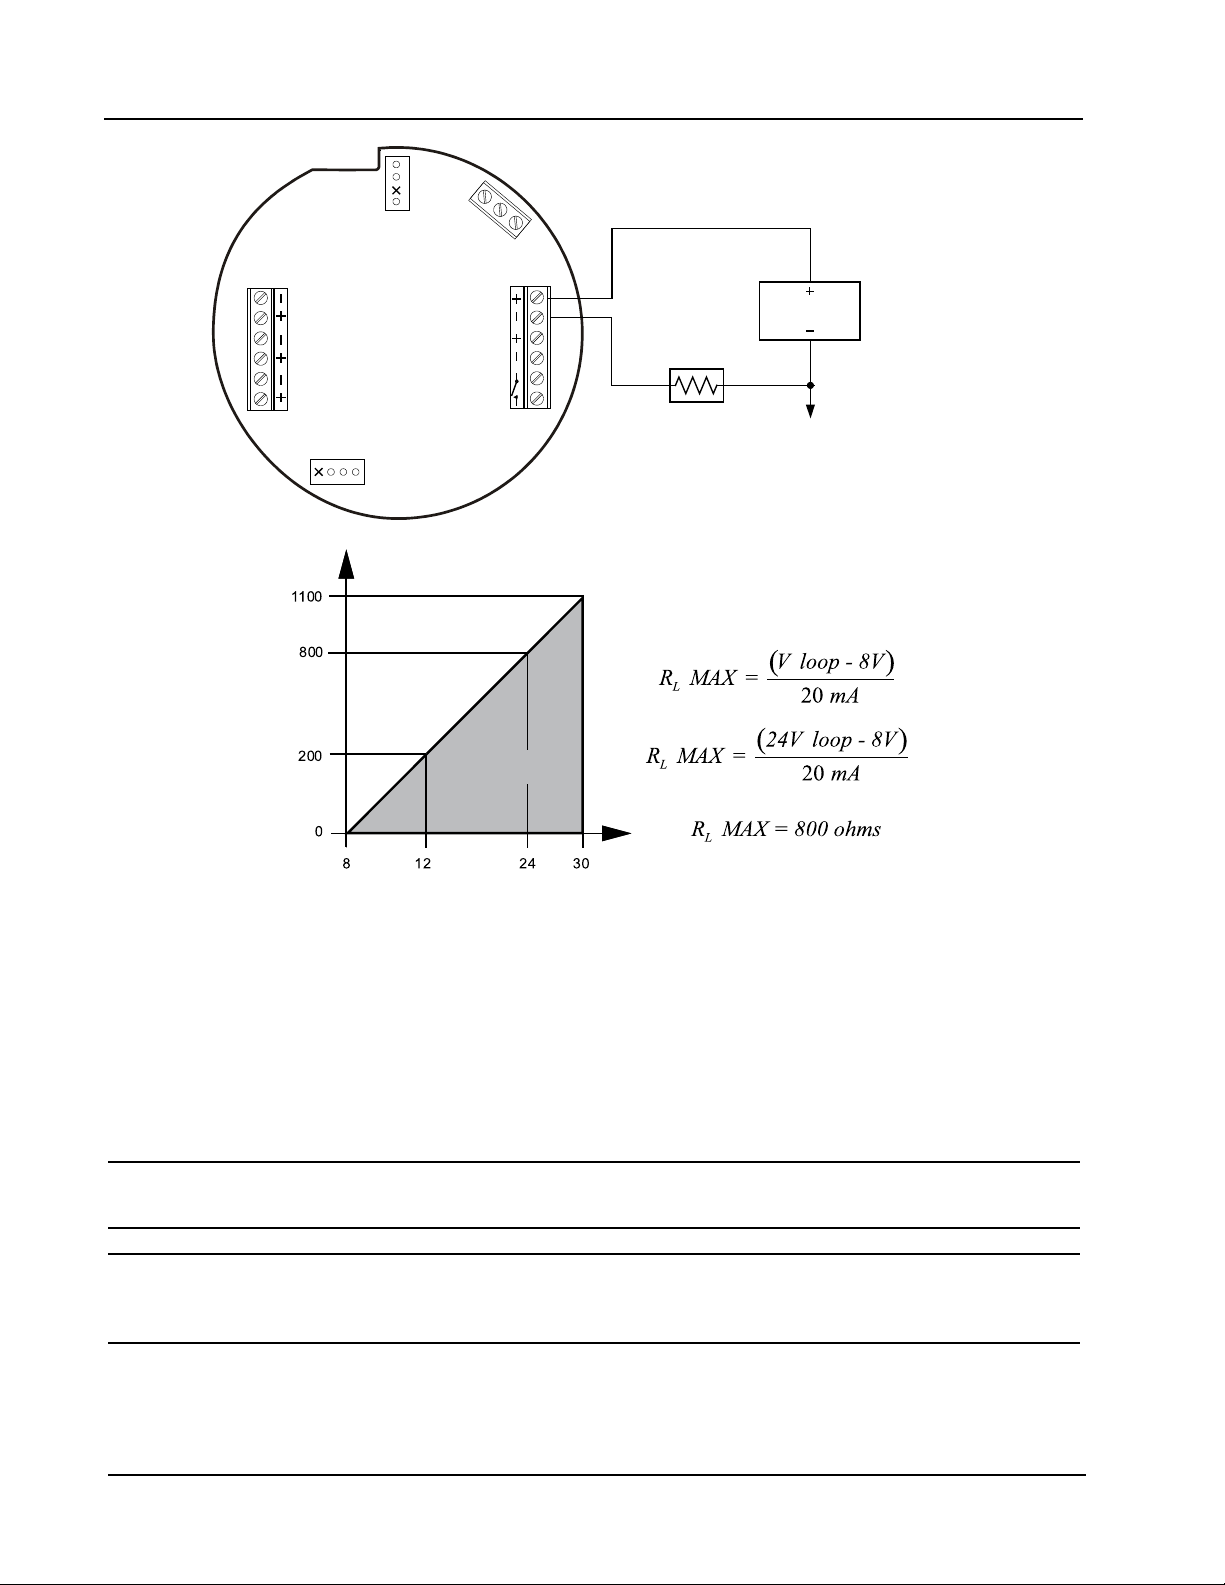
Analog (4-20 mA) Rate Output
The 4-20 mA rate output provides a linear current output that represents ow rate. This output requires a twoconductor cable connected to an 8 to 30 VDC power supply (voltage required is dependent on loop resistance)
and a current readout device located in the remote location. The 4-20 mA rate output current loop also powers
the MC-III EXP. The internal battery (lithium or alkaline) provides a power supply backup to maintain
timekeeping accuracy and to continue accumulating volume in the event that the 4-20 mA current loop fails.
Figure 2.10, page 18, shows the minimum required voltage to power the instrument for a given loop
resistance. In addition, the mathematical relationship between loop voltage and load resistance is given. For
example, if a power supply voltage of 24 volts is available to power the current loop, the maximum load
resistance would be 800 ohms.
Caution: The 4-20 mA rate output and the owmeter frequency output circuits are not isolated
For information on conguring the 4-20 mA rate output with the keypad, see page 29. For information on
conguring the 4-20 mA rate output with the interface software, see page 60.
from each other and cannot be used simultaneously. When the 4-20 mA output option is
used, do not connect external power to TB3.
17
Page 24
Section 2 MC-III™ EXP Flow Analyzer
TB1
PULSE
INPUT
RESET
INPUT
TFM
A&S
GND
T
B
3
EXT POWER
TB2
RS485
SLAVE
4-20
OUT
PULSE
OUT
6
-
3
0
V
D
C
J1
J2
RESET
SWITCH
BATTERY
PO W ER S UP PL Y
8 to 3 0 VD C
LO AD
R e s is tor m ay b e
in c lu de d i n r eadout
devi c e .
4-2 0 m A a nd
flow m eter fr equency
(a mp & s quare )
ca nn ot be u se d
si m ult aneously .
*
*
LOOP SUPPLY VOLTAGE (VDC)
LOAD RESISTANCE (OHMS)
OPERATING
REGION
Figure 2.10—4-20 mA rate output wiring
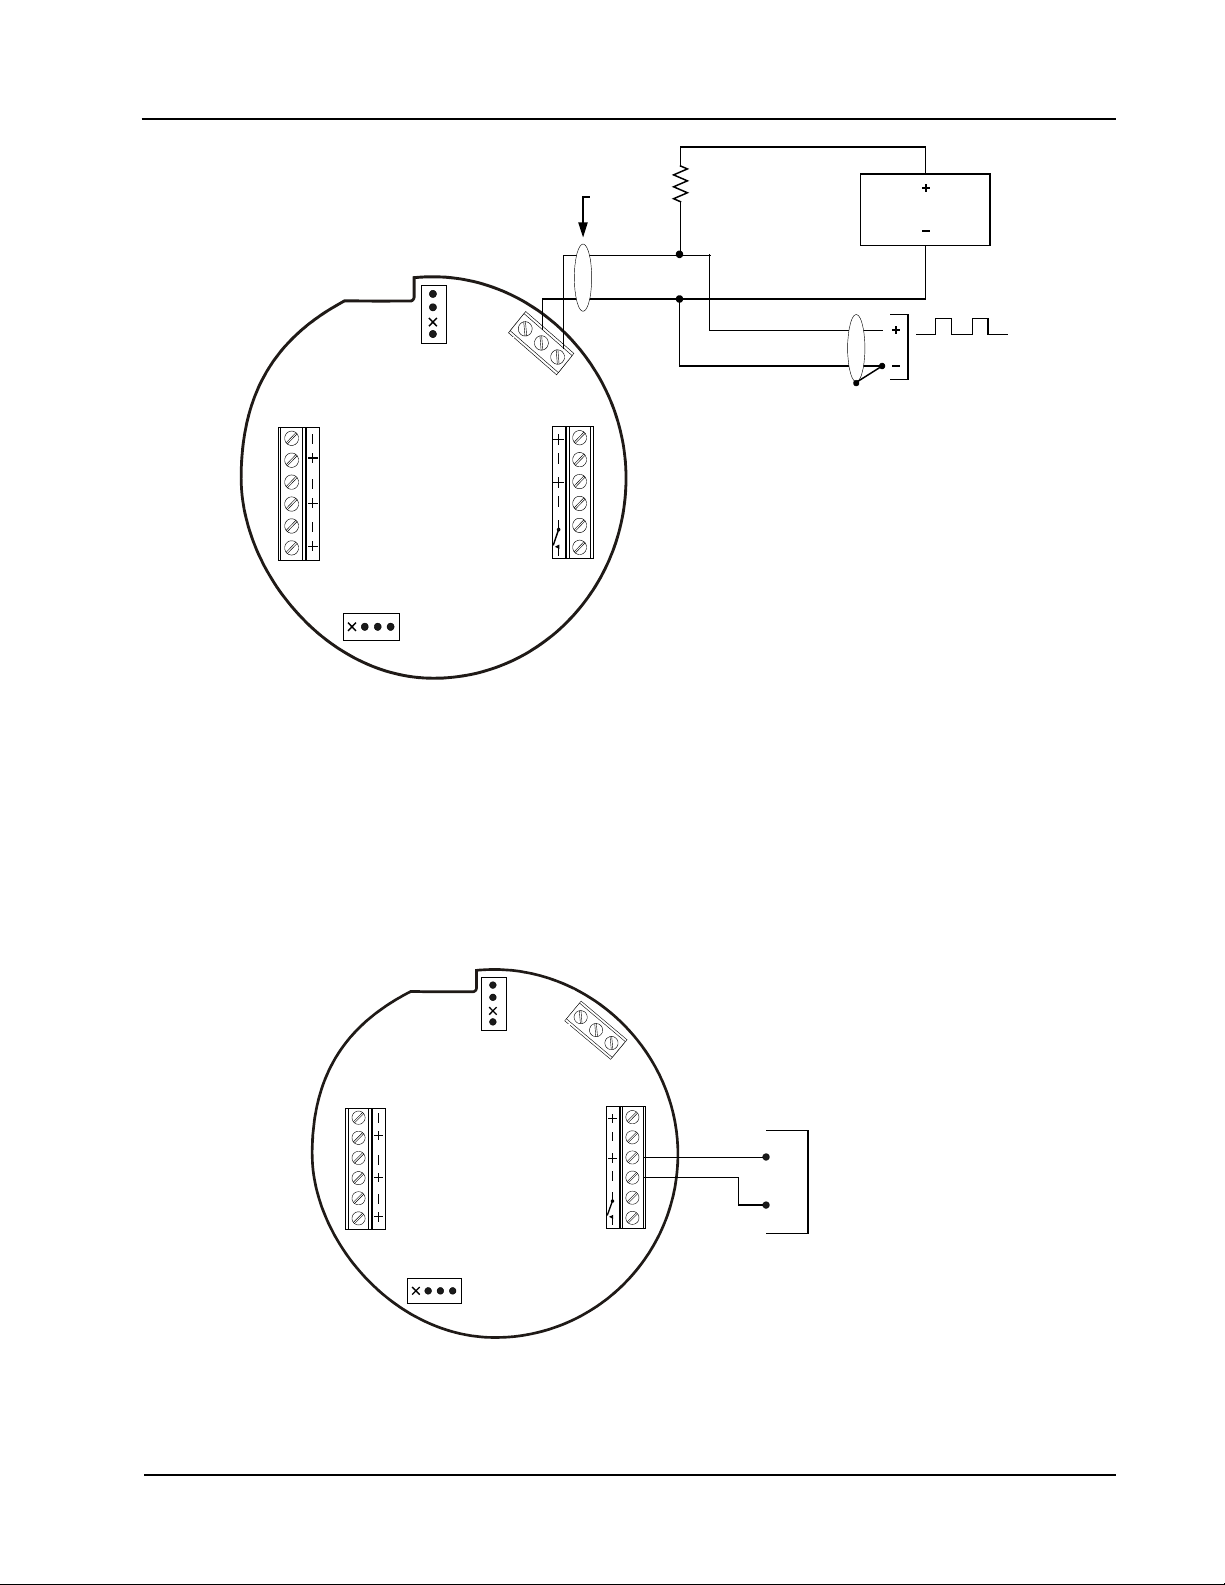
Flowmeter Frequency Output
The owmeter frequency (amp & square) output provides an open drain transistor output at the turbine meter
frequency, which may be used to provide ow rate and/or total information to peripheral equipment. The
output requires a two-conductor cable from the MC-III EXP to the remote frequency readout device requiring
50 mA or less and a 5 to 30 VDC power supply (Figure 2.11, page 19).
Caution: The owmeter frequency output and 4-20 mA rate output are not isolated from each other
and cannot be used simultaneously.
Caution: When using the owmeter frequency output and powering the device from an
The owmeter frequency output terminals on the MC-III EXP circuit assembly are labeled A & S to represent
“amp & square” output.
18
external power supply, make sure both power supplies share a common negative (-)
terminal or are totally isolated from each other.
Page 25
MC-III™ EXP Flow Analyzer Section 2
TB1
PULSE
INPUT
RESET
INPUT
TFM
A&S
GND
T
B
3
EXT POWER
TB2
RS485
SLAVE
4-20
OUT
PULSE
OUT
6
-
3
0
V
D
C
J1
J2
RESET
SWITCH
BATTERY
Le av e th is
en d o f s hie ld
di sco nn ect ed .
PO WE R SU PP LY
5 to 30 VD C
FR E QU EN CY
R EA DO UT D EV ICE
*
R e s isto r m ay b e i n c lu de d in freque n c y
re ad o u t d evic e. S ize th e re sis tor to lim it
th e c urr e nt to 5 0 m A.
4-2 0 m A and f lo wm ete r fre qu e n c y
(a mp & s qu a re ) c anno t b e u sed
sim ulta ne o u s ly.
*
B
A
TB1
PULSE
INPUT
RESET
INPUT
TFM
A&S
GND
T
B
3
EXT POWER
TB2
RS485
SLAVE
4-20
OUT
PULSE
OUT
6
-
3
0
V
D
C
R S -48 5
C o mm un ica tio ns
J1
J2
RESET
SWITCH
BATTERY
Figure 2.11—Flowmeter frequency (amp & square) output wiring
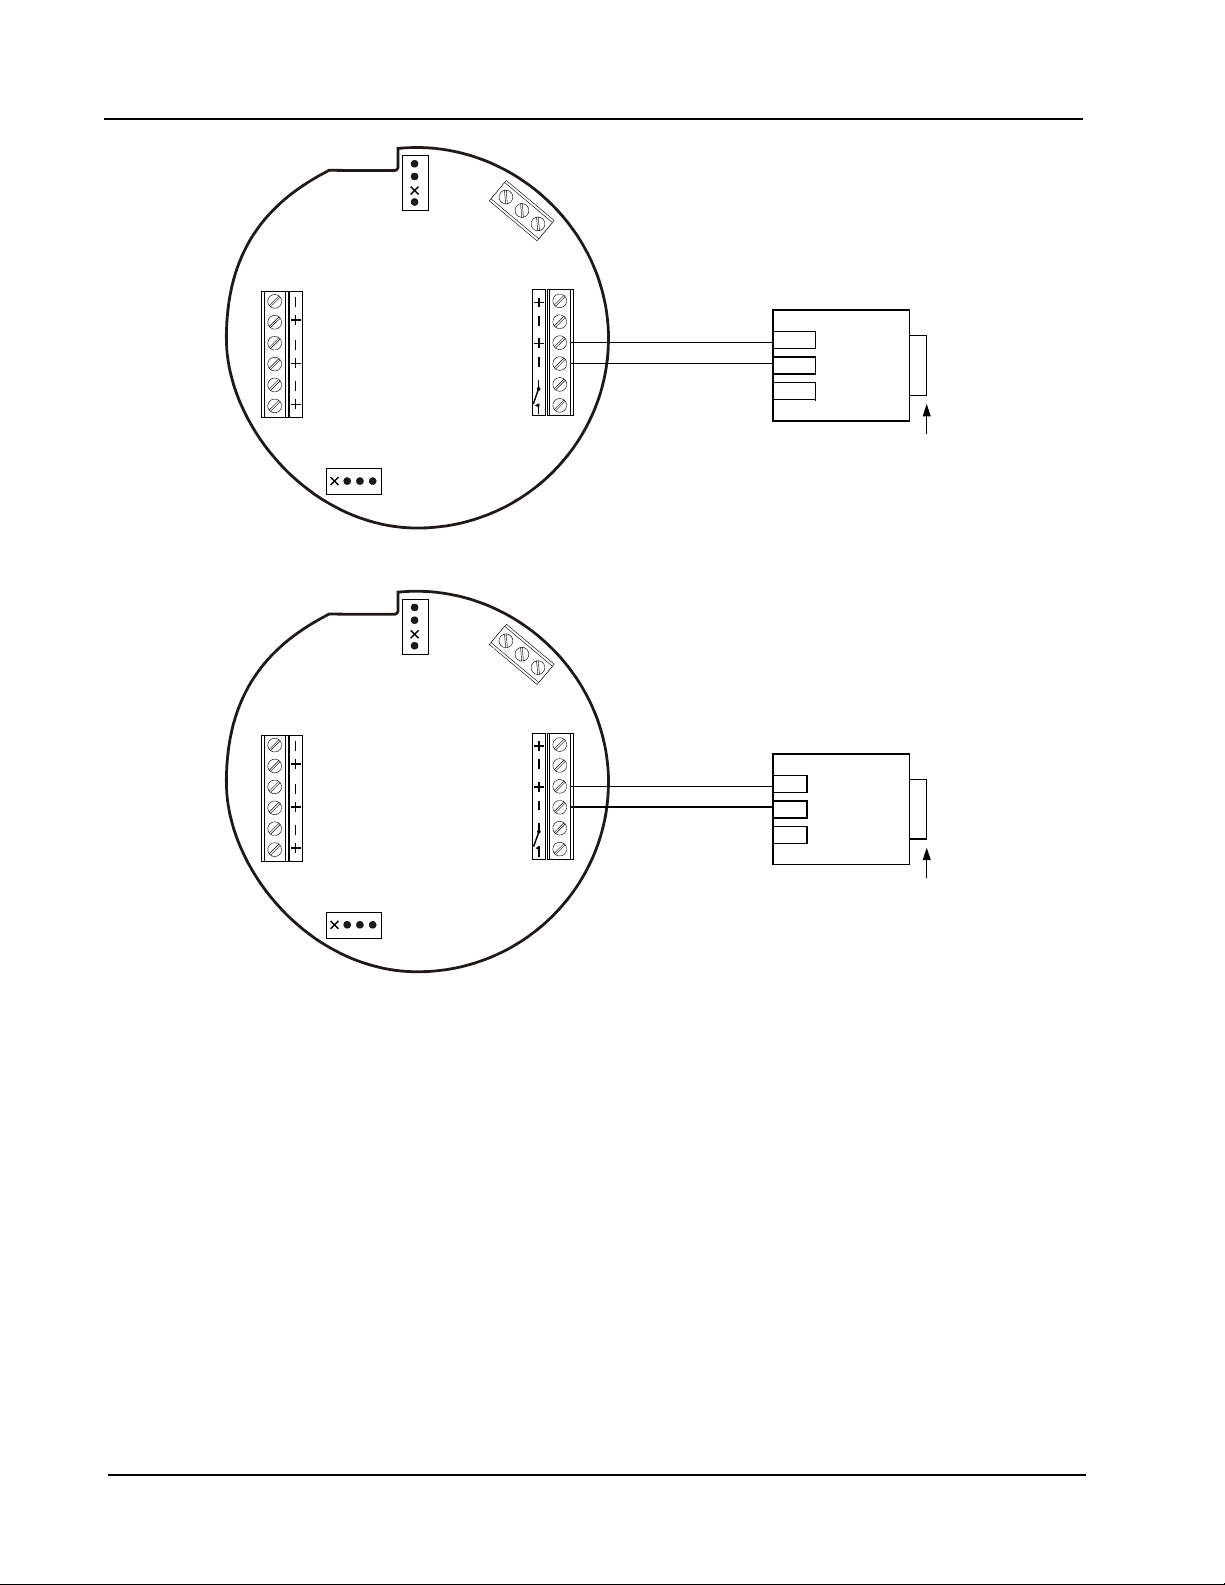
RS-485 Output
The RS-485 output is required for communication with the interface software. Wiring diagrams are provided
for a permanent connection (Figure 2.12), as well as for temporary laptop connections using an RS-485 to RS232 converter (Figures 2.13 and 2.14, page 20).
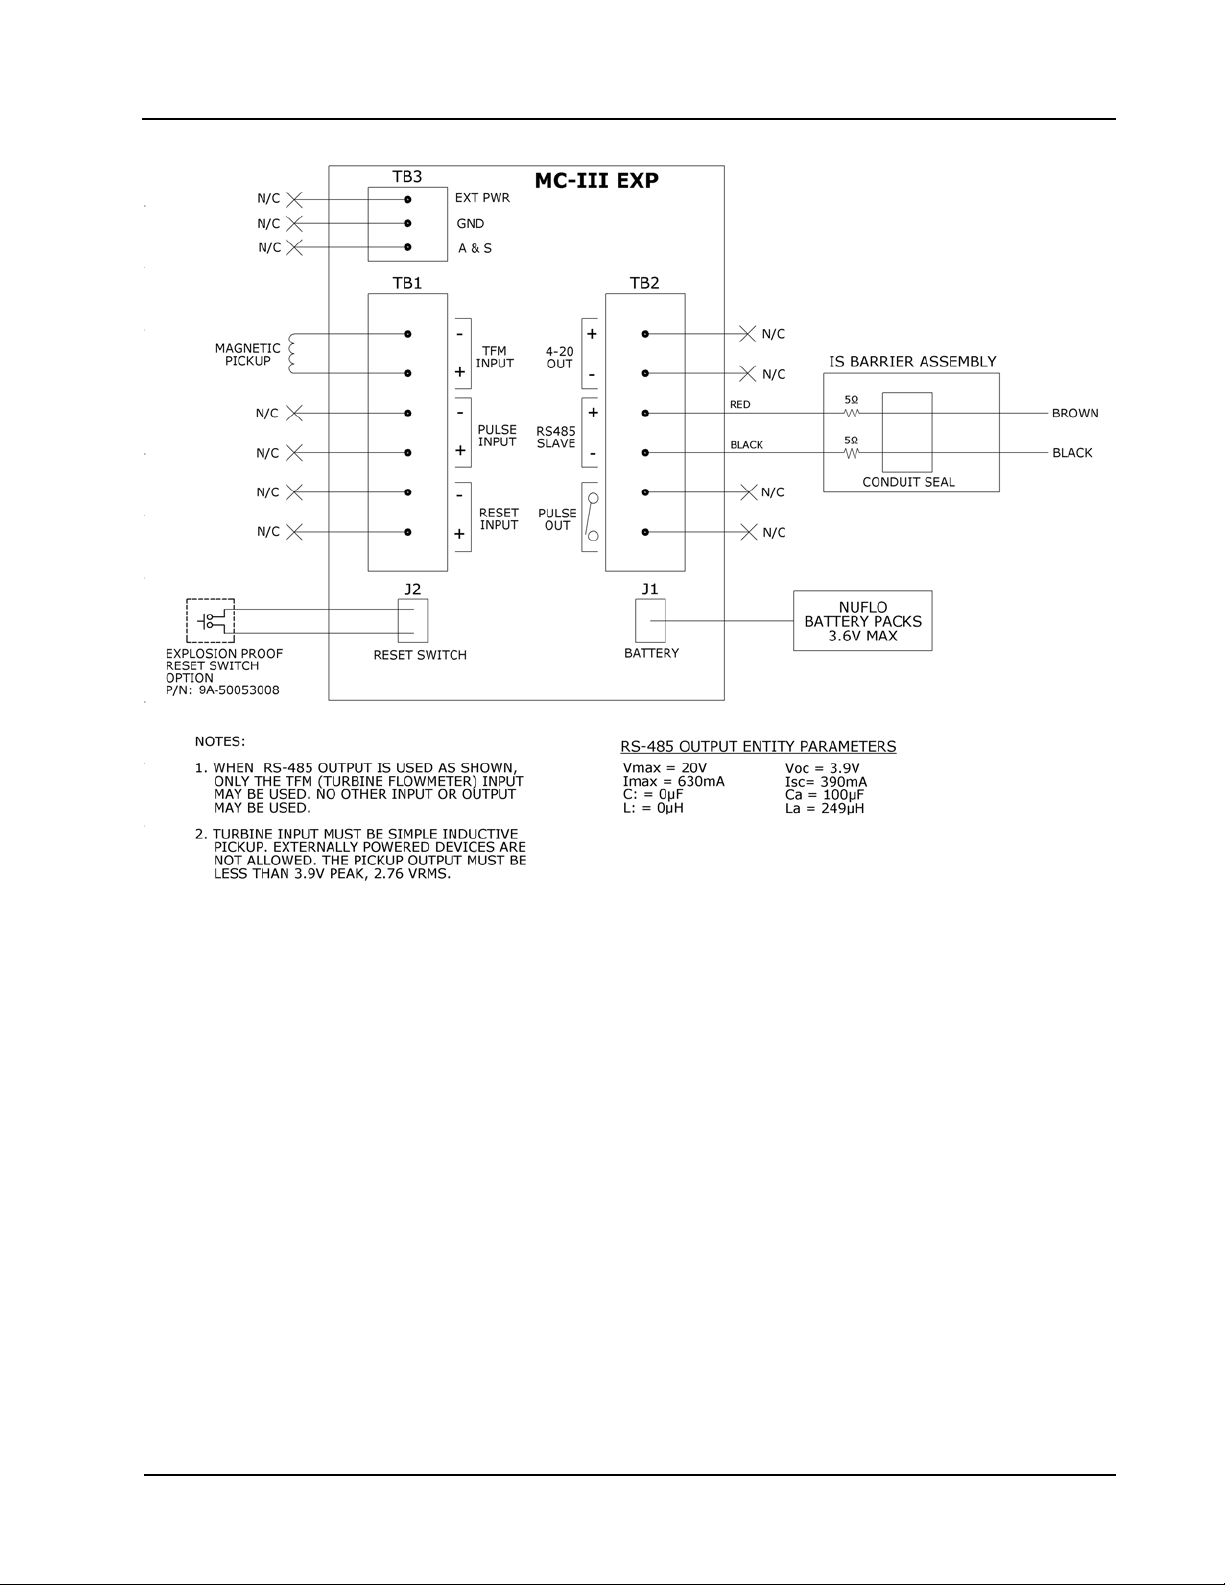
Additionally, the RS-485 output is approved for intrinsically safe installations. An intrinsically safe
installation requires an intrinsically safe barrier assembly with a conduit seal (Figure 2.15, page 21). In such
installations, only the turbine owmeter input may be used.
Figure 2.12—RS-485 output (permanent connection)
19
Page 26
Section 2 MC-III™ EXP Flow Analyzer
TB1
PULSE
INPUT
RESET
INPUT
TFM
A&S
GND
T
B
3
EXT POWER
TB2
RS485
SLAVE
4-20
OUT
PULSE
OUT
6
-
3
0
V
D
C
J1
J2
RESET
SWITCH
BATTERY
TD (B )
TD (A )
G ND
R S -23 2
9 - P IN
C O NN EC T O R
Pa rt No .
9A -1 012 83 11 6
TX +
TX -
TB1
PULSE
INPUT
RESET
INPUT
TFM
A&S
GND
T
B
3
EXT POWER
TB2
RS485
SLAVE
4-20
OUT
PULSE
OUT
6
-
3
0
V
D
C
J1
J2
RESET
SWITCH
BATTERY
B
A
G ND
R S -23 2
25 - P IN
C O NN EC T O R
Pa rt No .
9A -1 000 25 19 5
TX +
TX -
Figure 2.13—RS-485 output (connection to laptop with 9-pin converter)
Figure 2.14—RS-485 output (connection to laptop with 25-pin converter)
20
Page 27
MC-III™ EXP Flow Analyzer Section 2
Figure 2.15—Intrinsically safe RS-485 connection, based on control drawing 9A-50053010
21
Page 28

Section 2 MC-III™ EXP Flow Analyzer
22
Page 29

MC-III™ EXP Flow Analyzer Section 3
Section 3—Conguration and Operation via Keypad
Calibration of the MC-III™ EXP is a simple matter of entering necessary parameters into the instrument.
The process for calibrating the MC-III EXP depends on how the instrument will be used. The keypad can
be used to calibrate the MC-III EXP for liquid or gas measurement using preprogrammed units, or for liquid
measurement using a calculated divisor. When preprogrammed units are used, the MC-III EXP automatically
calculates the divisor for volume calculation and the rate multiplier for ow rate calculation, making
calibration quick and easy.
Important: For compensated gas measurement, or gas or liquid measurement requiring multipoint
(2- to 12-point) linearization, calibration must be performed with the software user interface (see Section 4).
Because the keypad is protected beneath the lid of the instrument, the enclosure must be opened to access the
keypad. For this reason, it is important to calibrate the instrument before installing it in a hazardous area.
Warning: To prevent ignition of hazardous atmospheres, do not remove the cover while circuits are
alive. Under normal conditions, the MC-III EXP poses no hazard when opened in a safe
area.
The following parameters can be congured using the six-button keypad on the front of the instrument:
calibration factor and unit
•
units of measurement for Total and Rate displays
•
decimal position for Total and Rate displays
•
input type and sensitivity level
•
4-20 mA output
•
pulse output scale factor
•
slave address
•
baud rate
•
23
Page 30
Section 3 MC-III™ EXP Flow Analyzer
K-FACTOR
MENU
00000000
M
3
BBL
GAL
LIT
CF
CF
X1000
X1000
TEST
LOG
00000000
M
3
BBL
GAL
LIT
CF
CF
X1000
X1000
.
TEST
LOG
TEST
00000000
M
3
BBL
GAL
LIT
CF
CF
X1000
X1000
LOG
SAVE
ENTER
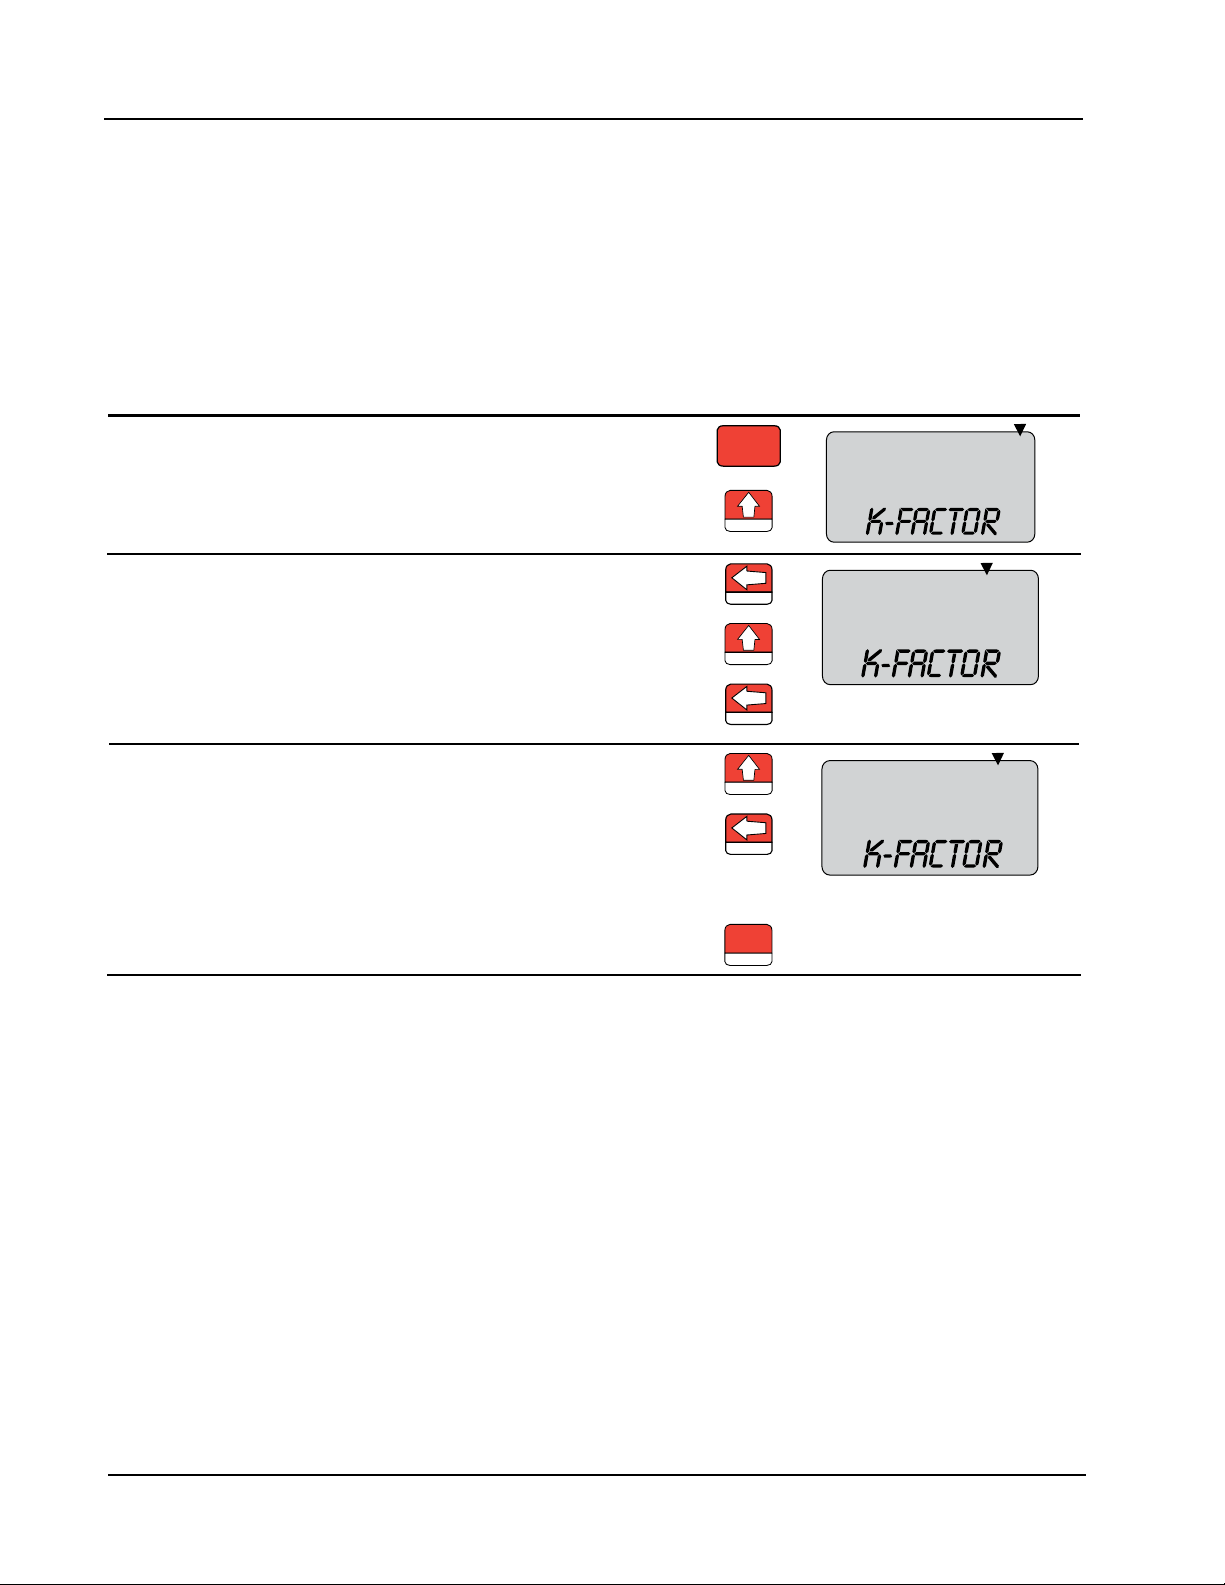
Entering a Calibration Factor
When the volume is to be expressed in barrels (BBL), gallons (GAL), liters (LIT), cubic meters (M3), or cubic
feet (CF), and the ow rate is to be expressed in barrels, gallons, liters, cubic meters or cubic feet per day, per
hour, per minute, or per second, the MC-III EXP calculates the divisor automatically; only the turbine meter
calibration factor is required.
When the volume is to be expressed in a unit other than the preprogrammed units listed above, a calculated
divisor must be entered at the K-Factor prompt. See Entering a Calculated Divisor, page 25.
To Enter a Calibration Factor:
Enter the K-Factor menu. Press K-FACTOR MENU.
Select the unit of measure associated
with the calibration factor (typically,
Press UP ARROW until the correct
unit is displayed.
pulses per gallon).
Enter the decimal point position for
the calibration factor.
Press LEFT ARROW to select the
decimal point.
Press UP ARROW to change the
position of the decimal point.
Press LEFT ARROW to save the
decimal point position and proceed
with entering a calibration factor.
Enter the calibration factor, starting
with the last digit and entering digits
Press UP ARROW until the last digit
of the calibration factor is displayed.
right to left.
Press LEFT ARROW to select the
next digit to the left.
Repeat using UP and LEFT arrows to
enter all remaining digits.
Press ENTER.
The Input Sensitivity menu will appear following the entry of the calibration factor. See Setting Input Type
and Sensitivity, page 26, for the input sensitivity conguration procedure.
24
Page 31

MC-III™ EXP Flow Analyzer Section 3
K-FACTOR
MENU
TEST
00000000
M
3
BBL
GAL
LIT
CF
CF
X1000
X1000
LOG
00000000
M
3
BBL
GAL
LIT
CF
CF
X1000
X1000
.
TEST
LOG
TEST
00000000
M
3
BBL
GAL
LIT
CF
CF
X1000
X1000
LOG
SAVE
ENTER
Entering a Calculated Divisor
When registering the volume in units other than cubic meters, cubic feet, barrels, gallons, or liters, a
calculated divisor must be entered in the K-Factor menu instead of the turbine meter calibration factor.
Important: When a calculated divisor is used, the units for both the volume display and the volume
portion of the ow rate display should be set to USER (no units visible on the display).
The divisor and divisor decimal point must be determined, then entered in the K-Factor menu.
The formula for calculating the divisor is:
Divisor = FC × CON
Where:
FC = meter factor in pulses per gallon (P/G)
CON = the conversion factor for number of gallons per unit volume of desired measure
To Enter a Calculated Divisor:
Enter the K-Factor menu.
Press K-FACTOR MENU.
Select no unit of measure. Press UP ARROW until no unit is
displayed (as shown).
Enter the decimal point position for the
calculated divisor.
Press LEFT ARROW to select the
decimal point.
Press UP ARROW to change the
position of the decimal point.
Press LEFT ARROW to save the
decimal point position and proceed
with entering a calculated divisor.
Enter the calculated divisor, starting
with the last digit and entering digits
Press UP ARROW until the last digit
of the calculated divisor is displayed.
right to left.
Press LEFT ARROW to select the
next digit to the left.
Repeat using UP and LEFT arrows to
enter all remaining digits.
Press ENTER.
The Input Sensitivity menu prompt will appear immediately following the entry of the calibration factor. See
Setting Input Type and Sensitivity, page 26, for the input sensitivity conguration procedure.
25
Page 32

Section 3 MC-III™ EXP Flow Analyzer
K-FACTOR
MENU
SAVE
ENTER
TEST
Select low, medium,
high, or Pulse In
SAVE
ENTER
Setting Input Type and Sensitivity
The owmeter signal can be obtained from a magnetic pickup or a pre-amplier device.
The input sensitivity of the MC-III EXP is measured in millivolts (mV) peak-to-peak. This is the threshold
value at which the circuitry responds to a signal. If the input signal is less than this value, the MC-III EXP will
not count the electrical pulses as a valid turbine meter signal. If the input signal is equal to or greater than this
value, the electrical pulses received at the input will be counted. Care must be taken to ensure that the input
sensitivity is high enough to reject any electrical noise on the signal line, but not so high that owmeter pulses
are missed. The input sensitivity of the MC-III EXP may be set to low, medium, or high when the input will
be provided by a turbine owmeter.
If the input will be provided in the form of a pulse from a pre-amplier or other device (rather than directly
from a turbine owmeter), the “Pulse In” (pulse input) setting in the Input Sensitivity menu should be
selected.
See Section 2 for input wiring diagrams.
To Set Input Type and Sensitivity:
Enter the K-Factor menu. Press K-FACTOR MENU.
Locate the input sensitivity setting. Press ENTER, repeatedly if
necessary, to bypass calibration
factor.
If the input is the turbine meter, select
a sensitivity setting: low, medium, or
high.
If the input is provided by a different
device, such as a pre-amplier, select
“Pulse in” (for pulse input).
Press UP ARROW to select a
sensitivity setting.
Press ENTER. “SAVING” will appear
in the bottom display.
26
Page 33

MC-III™ EXP Flow Analyzer Section 3
DISPLAY
MENU
TEST
00000000
000000
M
3
BBL
GAL
LIT
M
3
BBL
GAL
LIT
/SEC
/MIN
/HR
/DAY
CF
CF
X1000
X1000
STANDARD
TEST
00000000
000000
M
3
BBL
GAL
LIT
M
3
BBL
GAL
LIT
/SEC
/MIN
/HR
/DAY
CF
CF
X1000
X1000
STANDARD
LOG
00000000
000000
M
3
BBL
GAL
LIT
M
3
BBL
GAL
LIT
/SEC
/MIN
/HR
/DAY
CF
CF
X1000
X1000
STANDARD
.
TEST
SAVE
ENTER
Conguring the Total Display
The Total display can be congured for measuring volume in any of ve preprogrammed units, any
preprogrammed unit times 1,000, or a user-dened unit.
Users ca specify a decimal point position ranging from 0.1 to 0.0001 of a unit.
To Congure the Total Display:
Enter the Display menu. Press DISPLAY MENU.
Select the unit of measure in which
volume will be displayed.
Press UP ARROW until the correct
unit is displayed.
Note—If a calculated divisor was
entered, select user-dened (no units
visible).
To read the volume in terms of
thousands of units (ex. 1.0 = 1,000
bbl), continue pressing UP ARROW
until both the unit of choice and the
X1000 option are displayed.
Enter the decimal point position. Press LEFT ARROW three times,
or until the decimal point in the Total
display begins blinking.
Press UP ARROW to change the
position of the decimal point.
Press ENTER. “SAVING” will appear
in the bottom display.
Important: Before enabling or disabling the “× 1000” unit option for displaying ow totals, clear the
total display to zero. If the total is not cleared, the accumulated total displayed will represent a combination of two different units and will not provide an accurate ow reading.
27
Page 34

Section 3 MC-III™ EXP Flow Analyzer
DISPLAY
MENU
LOG
00000000
000000
M
3
BBL
GAL
LIT
M
3
BBL
GAL
LIT
/SEC
/MIN
/HR
/DAY
CF
CF
X1000
X1000
STANDARD
TEST
LOG
00000000
000000
M
3
BBL
GAL
LIT
M
3
BBL
GAL
LIT
/SEC
/MIN
/HR
/DAY
CF
CF
X1000
X1000
STANDARD
TEST
LOG
00000000
000000
M
3
BBL
GAL
LIT
M
3
BBL
GAL
LIT
/SEC
/MIN
/HR
/DAY
CF
CF
X1000
X1000
STANDARD
.
TEST
SAVE
ENTER
Conguring the Rate Display
The Rate display comprises two parts: a volume unit and a time-base unit. The volume portion of the Rate
display can be congured in one of ve preprogrammed engineering units or in a user-dened unit (for
use with a calculated divisor). To display the volume portion in multiples of 1,000 units, continue scrolling
through the volume unit options until the ×1000 entry is displayed, along with the appropriate unit of
measure.
The time-base portion of the Rate display can be congured in one of four preprogrammed engineering units:
per day, per hour, per minute, or per second.
Users can specify a decimal point position, ranging from no decimal up to 0.001 of a unit.
To Congure the Rate Display:
Enter the Display menu. Press DISPLAY MENU.
Enter the volume factor used to
express ow rate (Ex.: bbl in bbl/day).
Press LEFT ARROW. The volume
unit of measure in the bottom portion
of the LCD window should begin
blinking.
Press UP ARROW until the desired
volume unit of measure is displayed.
Note—If a calculated divisor was
entered, select user-dened (no units
visible).
Enter the time-base factor used to
express ow rate (Ex. /day in bbl/day).
Press LEFT ARROW. The time-base
factor in the bottom portion of the
LCD window should begin blinking.
Press UP ARROW until the desired
time-base factor is displayed.
Enter the decimal point position. Press LEFT ARROW twice, or until
the decimal point in the Rate display
begins blinking.
Press UP ARROW to change the
position of the decimal point.
Press ENTER. “SAVING” will appear
in the bottom display.
28
Page 35

MC-III™ EXP Flow Analyzer Section 3
Conguring the 4-20 mA Rate Output
Caution: Before performing any 4-20 mA conguration, ensure that all peripheral equipment con-
nected to the 4-20 mA current loop is either disconnected or disabled. Conguring and
testing the 4-20 mA output feature on the MC-III EXP with the peripheral equipment in
operation may cause false alarms or erroneous operation of the peripheral device or associated equipment.
The MC-III EXP has a 4-20 mA output feature that represents ow rate. Zero and full-scale values can be
congured to represent any ow rate range within the range of the owmeter.
The low (or zero) setting is the ow rate value that will produce a 4-mA output. The high (or full-scale)
setting is the ow rate value that will produce a 20-mA output. Typically, the high value is greater than the
low value; this scenario is dened as “direct mode” in Figure 3.1.
Alternatively, users may congure the 4-mA and 20-mA outputs to have an inverse relationship, such that the
high value is less than the low value. This scenario is dened as “indirect mode” in Figure 3.1.
Figure 3.1—Two options for conguring a 4-20 mA output
See Section 2 for instructions on installing and wiring the 4-20 mA rate output.
29
Page 36

Section 3 MC-III™ EXP Flow Analyzer
[ ]
[ ]
MAX MIN
OUT CURR MIN
I I
I RATE Low I
High Low
−
= × − +
−
Flow rates in-between the minimum and maximum rate setpoints will result in an output of current between
4 mA and 20 mA according to the following calculation:
Where:
I
= output current
OUT
I
= maximum current output (20 mA)
MAX
I
= minimum current output (4 mA)
MIN
High = programmed ow rate that produces a 20-mA output
Low = programmed ow rate that produces a 4-mA output
RATE
= ow rate
CURR
30
Page 37

MC-III™ EXP Flow Analyzer Section 3
OUTPUT
MENU
TEST
Toggles between
“off” and “on”
SAVE
ENTER
TEST
00000000
/MIN
CF
.
LOG
00000000
/MIN
CF
TEST
LOG
SAVE
ENTER
TEST
00000000
/MIN
CF
.
LOG
00000000
/MIN
CF
TEST
LOG
SAVE
ENTER
To Congure the 4-20 mA Output:
Enter the Output menu. Press OUTPUT MENU.
Enable or disable the 4-20 mA output. Press UP ARROW to toggle output to
“on” or “off”.
Press ENTER. If the 4-20 mA output
is enabled, the LCD will display the
“Low” ow rate and the decimal point
in the numeric display will begin
blinking.
Enter the decimal point position for the
“Low” ow rate. The words “4-20 mA
LOW” should appear at the bottom of
the LCD.
Enter the “Low” (4-mA) ow rate.
Digits are entered from right to left.
Enter the decimal point position for the
“High” ow rate. The words “4-20 mA
HIGH” should appear at the bottom of
the LCD.
Press UP ARROW to change the
position of the decimal point.
Press LEFT ARROW until the
rightmost digit in the top display
begins blinking.
Press UP ARROW to change the
digit.
Press LEFT ARROW to select the
next digit to the left.
Continue pressing UP ARROW and
LEFT ARROW alternately to enter all
remaining digits.
Press ENTER. The LCD will display
the “High” ow rate and the decimal
point in the numeric display will begin
blinking.
Press UP ARROW to change the
position of the decimal point.
Enter the “High” (20-mA) ow rate.
Digits are entered from right to left.
The Pulse Output menu prompt will appear immediately following the entry of 4-20 mA parameters. See
Conguring the Pulse Output, page 32, for the pulse output conguration procedure.
Press LEFT ARROW until the
rightmost digit in the top display
begins blinking.
Press UP ARROW to change the
digit.
Press LEFT ARROW to select the
next digit to the left.
Continue pressing UP ARROW and
LEFT ARROW alternately to enter all
remaining digits.
Press ENTER.
31
Page 38

Section 3 MC-III™ EXP Flow Analyzer
OUTPUT
MENU
SAVE
ENTER
TEST
Toggles between
“off” and “on”
SAVE
ENTER
TEST
00000000
M
3
BBL
GAL
LIT
CF
X1000
...
.
LOG
00000000
M
3
BBL
GAL
LIT
CF
X1000
...
TEST
LOG
SAVE
ENTER
Conguring the Pulse Output
The pulse output feature of the MC-III EXP is typically disabled to reduce current consumption. When the
pulse output is not needed, Cameron recommends that this feature be disabled.
If the pulse output feature is required, the user will be prompted to enter a pulse output scale factor, which is
the volume increment that will cause a pulse output to occur.
If the pulse output is congured via interface software instead of via the keypad Output menu, the user can
also specify a pulse length (pulse width), which determines the length of each output pulse in milliseconds
(ms). This parameter is congurable only with the interface software. See Section 4 for more information.
See Section 2 for instructions on installation and eld wiring of the pulse output feature.
To Congure the Pulse Output:
Enter the Output menu. Press OUTPUT MENU.
Locate the Pulse Output setting. Press ENTER repeatedly until the
words “Pulse Output” appear in the
lower display.
Enable or disable the pulse output. Press UP ARROW to toggle output to
“on” or “off”.
Press ENTER. If the pulse output is
enabled, the LCD will display “Pulse
Output Scaler” and the decimal point
in the numeric display will begin
blinking.
Enter the decimal point position for the
output scale factor.
Press UP ARROW to change the
position of the decimal point.
Enter the pulse output scale factor.
Digits are entered from right to left.
The Slave Address menu prompt will appear immediately following the entry of pulse output parameters. See
Entering the Slave Address, page 33, for information on entering the slave address.
32
Press LEFT ARROW until the
rightmost digit in the top display
begins blinking.
Press UP ARROW to change the
digit.
Press LEFT ARROW to select the
next digit to the left.
Repeat using UP and LEFT arrows to
enter all remaining digits.
Press ENTER.
Page 39

MC-III™ EXP Flow Analyzer Section 3
OUTPUT
MENU
SAVE
ENTER
00000000
...
TEST
LOG
SAVE
ENTER
OUTPUT
MENU
SAVE
ENTER
115200
TEST
SAVE
ENTER
Entering the Slave Address
The slave address is a setting used in Modbus® communications. It is a number that ranges from 1 to 65535,
excluding 252 to 255 and 64764. If the Modbus® request message contains the matching address, the
device will respond to the request. In network arrangements, the device must have a unique slave address.
For more information about Modbus® communications, refer to the protocol manual section. If Modbus®
communications are not used, leave the slave address at the factory setting (1).
To Enter Slave Address:
Enter the Output menu. Press OUTPUT MENU.
Locate the Slave Address setting. Press ENTER until the words “Slave
Address” appear in the lower display.
The rightmost digit in the top display
will begin blinking.
Enter the Slave Address.
(range: 1 to 65535, excluding 252 to
255 and 64764)
Press UP ARROW until the correct
digit is displayed.
Then press LEFT ARROW to select
the next digit to the left.
Repeat using UP and LEFT arrows to
enter all remaining digits.
Press ENTER.
The Baud Rate menu prompt will appear immediately following the entry of the slave address. See Entering
the Baud Rate below for the baud rate entry procedure.
Entering the Baud Rate
The baud rate is the number of bits per second that are on the serial port. This setting must match the setting
of the master device polling the MC-III EXP or the serial port. This only applies to the Modbus® communica-
tions; if Modbus® communications are not used, leave the baud rate at the factory setting (9600).
To Enter the Baud Rate:
Enter the Output menu. Press OUTPUT MENU.
Locate the Baud Rate setting. Press ENTER repeatedly until the
words “Baud Rate” appear in the
lower display.
Enter the baud rate. Press UP ARROW until the correct
baud rate is displayed.
Press ENTER. “SAVING” will appear
in the bottom display.
33
Page 40

Section 3 MC-III™ EXP Flow Analyzer
34
Page 41

MC-III™ EXP Flow Analyzer Section 4
Section 4—Conguration and Operation via Software
The MC-III™ interface software provides easy access to all conguration parameters and is the quickest way
to congure the device. Instead of navigating keypad menus, users enter conguration parameters with their
computer keyboard.
While basic parameters can be congured with the keypad (see Section 3), the interface software is the
only means of accessing every congurable parameter. For example, multipoint calibration for liquid or
gas measurement and gas volume correction parameters for measuring gas in standard cubic feet must be
congured via the interface software.
Table 4.1, page 45, provides a quick reference for determining whether a congurable parameter is accessible
through both the keypad menu and the interface software, or only through the interface software.
Installing the Software
The MC-III interface software is stored on a CD that is shipped with each instrument, and it installs directly
onto a PC or laptop. To install the interface software on a computer, perform the following steps:
Place the MC-III CD in your CD-ROM drive.
1.
The MC-III install screen will load automatically.
2.
3.
Click on “Next” to initiate the installation, and follow the instructions on the screen. An MC-III icon
(Figure 4.1) will appear on the desktop of the user’s PC or laptop when installation is complete.
To access the interface software, click on the MC-III icon on your desktop or go the Start menu and select
Programs>NuFlo>MC-III>MC-III.
Figure 4.1—MC-III desktop icon
Accessing Help
The Help menu, accessible from the task bar at the top of the Welcome screen (Figure 4.2, page 36), provides
easy access to documentation designed to assist the user in installing, conguring, and operating the MC-III
EXP ow analyzer. This documentation includes:
a “read me” le for general reference (includes contact information for technical assistance)
•
an electronic copy of the user manual
•
an electronic copy of the quick-start guide for installing and conguring the MC-III EXP
•
a COM troubleshooting guide for addressing communications errors (this guide will automatically display
•
on screen when a communication error is detected)
35
Page 42

Section 4 MC-III™ EXP Flow Analyzer
Connecting to the Software
Important: Before attempting to load the interface software, verify that the MC-III EXP is connected
to a computer with an RS-485 to RS-232 converter (see Optional Parts List, page 93). See
Section 2 for RS-485 output wiring diagrams (Figures 2.12 through 2.14, pages 19 and 20).
Once the software is installed, the program will automatically launch with the click of the NuFlo MC-III icon
on the desktop.
To connect to the MC-III software, perform the following steps:
Click on the NuFlo MC-III icon on the desktop, or select Start>Programs>NuFlo>MC-III>MC-III. The
1.
Welcome screen (Figure 4.2) will appear and a Select COM Port window will prompt the user to select a
communications port be used for connecting with the MC-III EXP (Figure 4.2).
2.
Select a communications port from the dropdown list and click “OK.” The
software will attempt to con-
nect with the MC-III EXP (via an RS-485 to RS-232 converter). This automatic launch feature is referred
to as an “express connect.”
3.
If the internal time and date programmed into the instrument differs from the time and date displayed on
the computer by more than 60 seconds, the software will prompt the user to synchronize the instrument
time/date to match the computer time/date (Figure 4.3, page 37). This ensures that the instrument displays
correct time, regardless of time zone differences.
Figure 4.2—Select COM Port window
36
Page 43

MC-III™ EXP Flow Analyzer Section 4
Figure 4.3—Prompt for authorizing time and date synchronization
The time difference setting used to generate a synchronize prompt is user-congurable. For more information,
see General Options, page B-1.
Automating Functions on Software Startup
When the software connects with the instrument, the Device Autorun Options screen appears (Figure 4.4).
From this screen, users can congure the instrument, download logs, or upload previously saved conguration
settings.
A checkbox at the bottom of the Device Autorun Options screen allows the user to bypass the Device Autorun
Options screen and perform a selected function each time the software connects to the instrument.
Example: To download all logs on connection, select Download all logs from the Device Autorun Options
screen and check the “Always do...” checkbox. Each time the software computer connects to the instrument,
the software will bypass the Device Autorun Options screen, open the Flow Archive screen, and download all
logs. See Section 5 for more information on ow logs.
Figure 4.4—Device Autorun Options screen
37
Page 44

Section 4 MC-III™ EXP Flow Analyzer
Changing Autorun Settings
To change an autorun setting —that is, to initiate an autorun action, to terminate an autorun action, or to
change to a different autorun action—without exiting to the Welcome screen, choose Options/Program
Options from the menu bar and select Autorun from the dropdown list (Figure 4.5).
Figure 4.5—Options/Program Options screen for changing autorun settings
Express Connect Option
By default, the MC-III EXP interface software automatically attempts to connect to the instrument when a
user clicks on the desktop application icon. For more information on disabling the “express connect” feature
and changing communications options, see Appendix B.
Canceling Express Connect
To temporarily cancel the “express connect” function without exiting the software program, click in the LCD
area of the device on the Welcome screen or choose File>Cancel Express Connect from the menu bar (Figure
4.6, page 39). The software will stop all attempts to connect to the device. The “express connect” function
will be restored when the user exits the program and attempts to re-open the software.
38
Page 45

MC-III™ EXP Flow Analyzer Section 4
Figure 4.6—Cancel Express Connect option
To reattempt a connection to the device after canceling the “express connect” function, click the LCD on the
Welcome screen again, or choose File>Express Connect from the menu bar.
Changing the Communications Port
The computer will attempt to connect to the MC-III EXP via the port that the user selects the rst time
he connects to the instrument. However, if a network dictates that the computer connect through another
communications port (actual or virtual), the user must specify the appropriate COM port. To change the COM
port setting, click on Options>Select COM Port (Figure 4.7), and select the appropriate COM port from the
list of ports detected.
Figure 4.7—COM port selection menu
Software Connection in Multi-Device Network
In most cases, the automatic launch (or “express connect”) feature is a convenient time-saver. However, if
multiple devices are daisy-chained together in a network, this feature can interfere with the user’s ability to
connect to a specic device. The MC-III allows the user to temporarily disable the “express connect” feature
and query the system for all connected devices. From the resulting list of devices, the user can then connect to
the appropriate slave address.
39
Page 46

Section 4 MC-III™ EXP Flow Analyzer
To select a device from a network of instruments, perform the following:
From the Welcome screen, choose File>Cancel Express Connect (
1.
®
2.
Click File>Discover Modbus
3.
Enter a range of addresses you want to search (Figure 4.8).
4.
Enter the baud rate established for network communications.
5.
Adjust the time-out setting, if necessary.
6.
Click “Search.” The software will scan all addresses specied and display all instruments connected.
7.
Click on the appropriate address to connect to a device.
Note: In daisy-chain congurations, verify that each device has a unique slave address.
Slaves.
Figure 4.6, page 39).
Figure 4.8—Automatic detection of all connected devices
A user who knows the address of a specic device may also connect to it by clicking File>Connect Device at
Address (Figure 4.9, page 41).
40
Page 47

MC-III™ EXP Flow Analyzer Section 4
Figure 4.9—Slave address selection screen
Setting Log Download Preferences
The MC-III EXP automatically saves daily ow logs on the contract hour, and hourly ow logs around the
clock. The instrument also automatically creates an event record each time a user change is made. After
downloading these logs from the instrument, the instrument saves the data in a le. By default, the logs are
saved as .csv les.
The le format of the auto-save ow log and event log les is user-congurable. Users can congure the
instrument to download the auto-save ow and event logs as Excel (.xls) les by selecting Options>Program
Options>Downloading from the menu bar (Figure 4.10).
Figure 4.10—Log le type selection
41
Page 48

Section 4 MC-III™ EXP Flow Analyzer
Conguring the MC-III EXP
The MC-III EXP offers three methods for conguring parameters:
The “Conguration Wizard” (Figure 4.11) condenses the conguration process into nine easy-to-follow
•
steps (compensated gas measurement and multipoint linearization are not supported in the wizard).
The MC-III Main screen (Figure 4.12, page 43) gives users complete access to all conguration param-
•
eters.
The Advanced screen (Figure 4.13, page 43) provides access to Modbus® registers that can be modied to
•
change conguration parameters (recommended only for system congurators and host programmers).
If the desired conguration settings have been saved previously, the conguration le can also be uploaded,
eliminating the need to re-input conguration data. See Saving and Uploading Conguration Files, page 66,
for details.
Figure 4.11—Conguration Wizard (for novice users)
42
Page 49

MC-III™ EXP Flow Analyzer Section 4
Figure 4.12—MC-III Main conguration option for complete access to congurable parameters
Figure 4.13—Advanced Access conguration option for system congurators and host programmers
43
Page 50

Section 4 MC-III™ EXP Flow Analyzer
Conguration Wizard
The Conguration Wizard is ideal for rst-time users who want to perform a basic calibration for liquid or gas
measurement. By following the instructions on nine screens, even a rst-time user can successfully congure
the MC-III EXP.
See Table 4.1, page 45, for a list of settings that are congurable with the keypad, the software Conguration
Wizard, and the software MC-III Main Screen.
Important: The Conguration Wizard does not allow multipoint calibration or gas volume
correction. To select these parameters, the user must access the MC-III Main screen.
Caution: Do not use the Conguration Wizard to change individual settings. When the Congura
tion Wizard is used, system default settings are restored before the new settings entered
in the Calibration Wizard are written to the program. Previous conguration settings are
saved automatically in C:\NuFlo log data\MC-III\Cong Backup Files.
Using the Pencil Tool
-
The data entry elds in the Conguration Wizard are highly intuitive, and most can be completed by clicking
in the eld and entering new data or selecting a checkbox. For data elds that require the user to enter a value,
such as a K-factor, and designate a decimal position, a pencil icon provides a link to a data-entry window.
To enter a new value, click on the pencil icon (Figure 4.14). A new window will appear, allowing the user
to enter a new value, and designate the appropriate decimal position using a slide bar. This method ensures
that the decimal point setting and data-entry resolution displayed in the software and on the instrument LCD
correlate.
This tool is used to enter the calibration factor, ow rates for 4-20 mA output, and the scale factor for pulse
output.
Figure 4.14—Pencil tool icon and data-entry window
44
Page 51

MC-III™ EXP Flow Analyzer Section 4
Table 4.1—Menus for Conguring Parameters
Congurable Parameter Instrument
Keypad
Well Name — Step 1 Wellsite
LCD Contrast — — System Setup 50
Security Setup — — System Setup 51
Contract Hour — Step 2 System Setup 50
Volume Display (units,
decimal location)
Rate Display (units, decimal
location)
Input Type Yes Step 3 Turbine Input 55
Input Sensitivity Yes — Turbine Input 55
Input Cut-off Thresholds — — Turbine Input 55
Calculation Period (seconds) — — Turbine Input 55
K-Factor Yes Step 4 K-Factor Entry 56
Multipoint K-Factor — — K-Factor Entry 57
Gas Volume Correction — — K-Factor Entry 58
4-20 mA Output Yes Step 6 4-20 mA Output 60
Pulse Output Yes Step 7 Pulse Output 63
Slave Address Yes Step 8 COM Port 51
Baud Rate Yes Step 8 COM Port 52
Bus Delay — — COM Port 52
Bus Timeout — — COM Port 53
Yes Step 5 Turbine Input 54
Yes Step 5 Turbine Input 54
Conguration
Wizard
Menu Screen
(accessed from
MC-III Main)
Information
For
information,
see page …
53
45
Page 52

Section 4 MC-III™ EXP Flow Analyzer
MC-III Main Screen
The MC-III Main menu screen (Figure 4.15) is the conguration hub of the MC-III EXP. From the Main
screen, users can
review all current instrument settings and ow readings
•
check the log archive and instrument status
•
access all submenus for changing congurable parameters
•
reset the total to zero
•
Figure 4.15—MC-III Main screen provides direct access to all menu functions using the scrolling menu bar at
the left side of the screen.
Data Display and Updates
Each time the software polls the instrument, a small icon appears briey in the lower left corner of the screen.
If the “Live Updates” checkbox in the lower right corner of the screen is checked, the instrument settings and
the LCD displays will automatically update with each poll.
“Live Updates” Checkbox
The “Live Updates” option is enabled by default. However, in the event that slow communication speeds are
used or the system times out frequently, the user can uncheck the “Live Updates” checkbox and periodically
query the system by clicking on the LCD graphic on the Main screen.
Reset Flow Total Button
The ow total can be reset to zero at any time by clicking on the “Reset Flow Total” button.
Scroll Bar
A scroll bar at the left side of the screen (Figure 4.15) gives the user easy access to any of seven conguration
menus and two log archive screens (see pages 48 and 49). Using these menus, the user can change all
congurable parameters of the instrument. Once the instrument has been congured, the Main screen access
should always be used for changing individual parameters while retaining all other conguration settings.
46
Page 53

MC-III™ EXP Flow Analyzer Section 4
Buttons and Tools
Apply and OK Buttons
Changing parameters on a submenu screen involves selecting the proper screen from the scroll bar, selecting
information from dropdown menus or entering data in data elds, and saving the data using the “Apply”
or “OK” button. “Apply” allows the user to apply the changes without leaving the submenu screen. “OK”
allows the user to apply the changes and returns the user to the Main screen.
Refresh and Cancel Buttons
To update the display of settings on any submenu screen by forcing a reread of congured parameters, press
the “Refresh” button. The “Refresh” button clears any entry that has not been applied, therefore, pressing
“Refresh” is also a convenient way to erase an incorrect entry. A “Cancel” button allows the user to close out
of a submenu screen without saving new settings and returns the user to the Main screen.
Pencil Tool for Data Entry
The data-entry elds in the MC-III Main sub-menu screens are highly intuitive, and most can be completed
by clicking in the eld and entering new data, or selecting a checkbox. For data elds that require the user
to enter a value, such as a K-factor, and designate a decimal position, a pencil icon provides a link to a dataentry window.
To enter a new value, click on the pencil icon (Figure 4.16). A new window will appear, allowing you to
enter a new value, and designate the appropriate decimal position using a slide bar. This method ensures
that the decimal point setting and data-entry resolution displayed in the software and on the instrument LCD
correlate.
This tool is used to enter the calibration factor, ow rates for 4-20 mA output, and the scale factor for pulse
output.
Figure 4.16—Pencil tool icon and data-entry window
47
Page 54

Section 4 MC-III™ EXP Flow Analyzer
7ELLSITE)NFORMATION
3YSTEM3ETUP
#OMMUNICATIONS0ORT
4URBINE)NPUT
+&ACTOR%NTRY M!/UTPUT
Conguration Submenus (See Scroll Bar on MC-III Main Screen)
48
Page 55

MC-III™ EXP Flow Analyzer Section 4
0ULSE/UTPUT
&LOW!RCHIVE
%VENT!RCHIVE
Conguration Submenus (cont’d)
49
Page 56

Section 4 MC-III™ EXP Flow Analyzer
System Setup
The rst of the submenus on the Main screen scroll bar—System Setup—allows users to adjust time/date,
set the desired contract hour, enable or disable the password-protected security option, and adjust the LCD
contrast.
Figure 4.17—System Setup screen
Time/Date Synchronization
The MC-III EXP includes a real-time clock for timekeeping and log time stamps. Upon connecting with
the instrument, the interface software prompts the user to synchronize the instrument time and date with
the time and date displayed on the computer if the time difference exceeds 60 seconds. To change the clock
synchronization threshold to a value other than 60 seconds, see General Options, page B-1.
A user can synchronize the instrument and computer clocks at any time by clicking the “Sync to Computer
Time” button on the System Setup screen.
Contract Hour
Hourly ow totals are logged in the archive on the hour. The contract hour determines the exact time when
the daily ow total is logged. The contract hour is easily adjusted by selecting the appropriate hour from the
dropdown list on the System Setup screen.
LCD Contrast Adjustment
LCD contrast is temperature-dependent and may require adjustment for optimum readout visibility. A slide
bar allows users to quickly adjust the contrast of the LCD.
50
Page 57

MC-III™ EXP Flow Analyzer Section 4
Security Setup
Setting a keypad security code will prevent unauthorized personnel from altering calibration data or resetting
totals, and the security function is recommended to preserve data integrity of the system. The MC-III EXP’s
keypad security feature is disabled at the factory.
To enable the security protection, check the “Keypad Lock” checkbox on the System Setup screen, and enter
a four-digit lock code in the eld below the checkbox. (Do not use “0000.”) The security feature will be
activated the next time a user attempts to access the keypad.
Firmware Version Number
As rmware is upgraded, rmware version numbers change. The rmware version number shown may assist
technical support personnel in troubleshooting an operational issue.
Serial Number
The serial number of your MC-III EXP can be used to track the history of your unit to include warranty status.
Communications Port
The Communications Port screen (Figure 4.18) allows users to change the settings that are required for
Modbus® communication.
Figure 4.18—Communications Port screen
Slave Address
The slave address allows the MC-III EXP to communicate with other devices via Modbus®. It is a number
that ranges from 1 to 65535, excluding 252 to 255 and 64764. If a Modbus® request message contains the
matching slave address, the device will respond to the request. In network arrangements, the slave device
must have a unique address. For more information about Modbus® communications, refer to the protocol
manual section.
51
Page 58

Section 4 MC-III™ EXP Flow Analyzer
To change the slave address, select a number using the “plus” and “minus” buttons on the screen, or using the
page-up and page-down keys on your computer keyboard. If Modbus® communication is not used, leave the
slave address at the factory setting (1).
Baud Rate
The baud rate is the number of bits per second that are on the serial port. Baud rates supported by the MC-III
EXP range from 300 to 115.2K. This setting must match the setting of the master device polling the MC-III
EXP or the serial port. This only applies to the Modbus® communications; if Modbus® is not used, set the baud
rate to 9600.
To change the baud rate, slide the selector bar to the appropriate setting. The default setting is 9600 baud.
Note that the 9600 baud rate is available in both the low-power and high-power modes. When the instrument
is powered by batteries alone, the low-power mode is recommended.
Auto-Negotiate Option
When connected devices are capable of switching baud rates automatically or when devices are directly
connected to an MC-III EXP, a user may congure the MC-III interface to automatically negotiate the fastest
baud rate during device connection. This “negotiated” baud rate does not replace the congured baud rate,
but rather provides a temporary boost of baud rate while the computer is connected to the device for faster
downloads. After the software disconnects, the device reverts to the congured baud rate.
By default, this function is disabled. To enable automatic baud rate negotiation on device connect, choose
Options/Program Options from the menu bar, select Communications from the dropdown options list, check
the “Attempt auto-negotiation...” checkbox, and click “OK” (Figure 4.19). To initiate an immediate search
for the fastest baud rate without exiting tto the Welcome screen, check the “Enable auto-negotiated baud
rate” checkbox, click the “Test Now” button to the right of the checkbox, and click “Yes” at the prompt in the
Conrm dialog box. See also Auto-Negotiate Option, page B-4.
Figure 4.19—Communications Options screen
52
Page 59

MC-III™ EXP Flow Analyzer Section 4
Bus Delay
Bus delay is the amount of time (in milliseconds) that passes before the MC-III EXP attempts to take control
of the RS-485 bus and transmit a message back to the requesting device. The MC-III EXP responds very
quickly to incoming Modbus® requests—in some cases, too quickly. A congurable delay allows the user to
control this response time. A setting of 10 ms is normally sufcient, but may require adjustment when the
MC-III EXP is communicating with a radio or other end device that responds more slowly.
Bus Timeout
Bus timeout is the amount of time (in milliseconds) that must pass to cause the MC-III EXP to reset its
internal Modbus® message handler. The default value of 50 ms is normally sufcient.
Software Communication Options
The default timing parameters in the MC-III EXP support communication with most radios and Modbus®
devices. However, if the MC-III EXP is used with a device that has a very slow response time, it may be
necessary to adjust the timing parameters to enhance performance. For information about these parameters,
see Appendix B, Software Program Options.
Wellsite Information
The Wellsite Information screen (Figure 4.20) allows users to enter information that distinguishes the wellsite,
such as company name, well name, and site location. While most of the elds on this screen are optional, a
well name should be assigned.
The well name (limited to 20 characters in length) will also serve as the name of the folder where ow logs
generated by the MC-III software will be archived. If a well name is not entered on this screen, logs will be
saved in a folder titled “NO_WELLNAME.”
Figure 4.20—Wellsite Information screen
53
Page 60

Section 4 MC-III™ EXP Flow Analyzer
Turbine Input
The Turbine Input screen (Figure 4.21) allows users to congure the displays for volume and rate, select the
type of input to be used (turbine input or pulse input), determine cut-off thresholds for measuring ow, and
determine the display update frequency.
Figure 4.21—Turbine Input screen
Volume Display
The Volume display can be congured to display totals in one of ve preprogrammed engineering units or in a
user-dened unit (for use with a calculated divisor).
Important: If volume is to be measured in user-dened units, the K-Factor unit must also be
entered as “pulses per unit.” For more information, see Entering a Calculated Divisor, page
25.
To display the volume in multiples of 1,000 units, check the “Multiplier” checkbox. Users can specify
decimal point position, from 0.1 to 0.0001 of a unit, using the slide bar on the Turbine Input screen.
Important: Before enabling or disabling the “× 1000” unit option for displaying ow totals, clear the
total display to zero. If the total is not cleared, the accumulated total displayed will represent a combination of two different units and will not provide an accurate ow reading.
Rate Display
The Rate display comprises two parts: a volume unit and a time-base unit. The volume portion of the Rate
display can be congured in one of ve preprogrammed engineering units or in a user-dened unit (for use
with a calculated divisor). To display the volume portion in multiples of 1,000 units, check the “Multiplier”
checkbox.
54
Page 61

MC-III™ EXP Flow Analyzer Section 4
The time-base portion of the Rate display can be congured in one of four preprogrammed engineering units:
per day, per hour, per minute, or per second. Users can specify decimal point position, from no decimal up to
0.001 of a unit, using the slide bar on the Turbine Input screen.
Important: If the volume portion of the Rate display is to be measured in user-dened units, the
K-Factor unit must also be entered as “pulses per unit.” For more information, see
Entering a Calculated Divisor, page 25.
Input Type and Sensitivity Conguration
The MC-III EXP accepts either a turbine input or a pulse input. When the turbine input is selected, the user
can also specify one of three sensitivity levels (low, medium, or high) to help minimize noise interference in
the signal reception. A “low” sensitivity setting will detect a signal of approximately 20 mV peak-to-peak,
while a “high” sensitivity setting will detect only signals that exceed 40 mV, peak-to-peak.
When a pulse input is selected, no sensitivity setting is required.
Cut-Off Thresholds
Periods of very low or interrupted ow can lead to inaccuracies in indicated ow totals. To help prevent these
inaccuracies, the user can establish cut-off thresholds to determine the minimum frequency and/or ow rate at
which a signal will be recorded.
The ow rate cut-off is a setpoint for the accumulation of ow time in the hourly and daily records, and can
be applied to either a turbine input or pulse input.
The frequency cut-off is reserved for the turbine input only. When the low-frequency cut-off is congured, the
MC-III EXP will ignore inputs that are less than the user-entered value.
Calculation Period
The ow calculation period is the number of seconds that are allowed for calculating the ow condition. This
setting is easily adjusted with the “plus” and “minus” buttons on the screen, or the page-up and page-down
keys on your computer keyboard. Increasing this setting value results in ow rates with greater resolution.
This setting is also the time allowed for processing of display updates.
55
Page 62

Section 4 MC-III™ EXP Flow Analyzer
K-Factor Entry
The K-Factor Entry screen (Figure 4.22) allows users to calibrate the MC-III EXP using a single calibration
factor from a turbine owmeter or multipoint linearization. Users can also congure the MC-III EXP to
compensate for the effect of pressure, temperature, and compressibility on gas volume measurements.
Figure 4.22—K-Factor Entry screen
K-Factor Units
K-Factor entry consists of selecting the K-Factor unit and type (linear or multipoint). In selecting the unit,
users can choose from ve preprogrammed units (pulses per gallon, barrel, cubic meter, cubic foot, or liter). If
a calculated divisor is to be used, “pulses per unit” should be selected.
K-Factor Type
For linear calibration, the user need only select the Linear checkbox and enter the K-factor of the turbine
meter. To enter the K-factor value, click on the pencil icon to open a data-entry window (Figure 4.23). Enter
the digits, left to right, and adjust the slide bar to move the decimal point to the proper position.
Figure 4.23—Data-entry screen for linear K-factor
56
Page 63

MC-III™ EXP Flow Analyzer Section 4
For multipoint calibration, the user selects the Multipoint checkbox, and then enters the number of calibration
points he desires using the “plus” and “minus” buttons on the screen or the page-up and page-down keys on
a computer keyboard. Up to 12 calibration points may be entered. Frequency and factor data-entry elds are
automatically activated for the number of calibration points selected. The user can then enter the appropriate
data for each point.
K-Factor Backup
Each time a calibration factor is entered or changed, the software prompts the user to copy the previous
settings to backup memory (Figure 4.24). In the event that an error is made while entering conguration
parameters, the user can restore the last saved set of conguration settings to the instrument.
Figure 4.24—Prompt to copy previous calibration settings to backup
Select “yes” to save the previous calibration factor to memory. The date and time of this backup is displayed
next to the “Retrieve K-Factor Backup” button on the K-Factor Entry screen. Only the last saved backup can
be retrieved.
To retrieve the last saved K-Factor backup, perform the following steps:
Press the “Retrieve K-Factor Backup” button. A conrmation screen will appear with a prompt to proceed
1.
or terminate the retrieval.
2.
Press “yes” to retrieve the last backup.
3.
Click “OK” or “Apply” to save the retrieved settings to the conguration le. Because the retrieval of
these settings represents a change to the current K-Factor settings, you will again be prompted to copy the
previous settings to backup.
57
Page 64

Section 4 MC-III™ EXP Flow Analyzer
Gas Volume Correction (Supercompressibility Calculation)
Gas turbine meters are calibrated in actual cubic feet (ACF), and measure gas in actual cubic feet. In some
applications, a user may benet from referencing gas measurements back to standard conditions by measuring
in terms of standard cubic feet (SCF). The MC-III EXP makes this process quick and easy, by using xed
average values for the owing gas temperature and owing gas pressure.
By default, this option is disabled.
To access this feature, check the “Enable volume correction” checkbox in the Gas Correction section of the
K-Factor screen. The “STANDARD” annunciator on the LCD will illuminate, and all other Gas Volume
Correction data elds will be activated (Figure 4.25).
Figure 4.25—Gas volume correction settings on K-Factor Entry screen
Atmospheric pressure is set at 14.73 psia by default, but can be adjusted to local conditions.
To compensate the gas measurement to standard conditions, complete the following steps:
Enter the atmospheric pressure.
1.
Enter the base pressure and unit. The base pressure is the pressure to which the gas will be compensated
2.
(typically, 14.73 psia).
3.
Enter the base temperature and unit. The base temperature is the temperature to which the gas will be
compensated (typically, 60°F).
4.
Enter the working pressure and unit. The working pressure is the user-entered pressure that represents the
average working (owing) pressure.
5.
Enter the working temperature and unit. The working temperature is the user-entered temperature that
represents the average working (owing) temperature.
58
Page 65

MC-III™ EXP Flow Analyzer Section 4
6.
Enter a known compressibility factor, or press “Calculate compressibility from gas comp.” to view a
selection of gas compositions (Figure 4.26).
•
To automatically calculate the compressibility factor, enter the gas composition and click on
“Calculate.” The software will calculate owing gas compressibility in accordance with the
AGA-8 detail method.
•
The K-Factor Entry screen will reappear, and the calculated super-compressibility factor will be
displayed.
Figure 4.26—Gas Composition screen
59
Page 66

Section 4 MC-III™ EXP Flow Analyzer
4-20 mA Output
Caution: Before performing any 4-20 mA calibration, ensure that all peripheral equipment con-
nected to the 4-20 mA current loop is either disconnected or disabled. Calibrating and
testing the 4-20 mA output feature on the MC-III EXP with the peripheral equipment in
operation may cause false alarms or erroneous operation of the peripheral device or as-
sociated equipment.
The 4-20 mA Output screen (Figure 4.27) allows users to congure the MC-III EXP to provide a 4-20 mA
output representing ow rate. Zero and full-scale values can be congured to represent any ow rate range
within the range of the owmeter. A test mode function is also included, allowing a user to calibrate and/or
verify the output received by an end device.
Figure 4.27—4-20 mA Output screen
The low (or zero) setting is the ow rate value that will produce a 4-mA output. The high (or full-scale)
setting is the ow rate value that will produce a 20-mA output. Typically, the high value is greater than the
low value; this scenario is dened as “direct mode” in Figure 4.28, page 61.
Alternatively, users may congure the 4-mA and 20-mA outputs to have an inverse relationship, such that the
high value is less than the low value. This scenario is dened as “indirect mode” in Figure 4.28, page 61.
60
Page 67

MC-III™ EXP Flow Analyzer Section 4
[ ]
[ ]
MAX MIN
OUT CURR MIN
I I
I RATE Low I
High Low
−
= × − +
−
Figure 4.28—Two options for conguring a 4-20 mA output
Flow rates in-between the minimum and maximum rate setpoints will result in an output of current between
4 mA and 20 mA according to the following calculation:
Where:
I
= output current
OUT
I
= maximum current output (20 mA)
MAX
I
= minimum current output (4 mA)
MIN
High = programmed ow rate that produces a 20-mA output
Low = programmed ow rate that produces a 4-mA output
RATE
= ow rate
CURR
61
Page 68

Section 4 MC-III™ EXP Flow Analyzer
Enabling 4-20 mA Output
By default, the 4-20 mA output option is disabled. To enable this feature, perform the following steps:
Check the “Enable” checkbox.
1.
Click on the pencil icon next to the Low Flow Rate eld to launch a data-entry window (Figure 4.29) and
2.
enter the “low” or “zero” ow rate value that will produce a 4-mA output. Adjust the decimal position,
if necessary, using the slide bar. A ow rate less than or equal to this minimum setpoint will result in an
output of 4 mA.
3.
Click on the pencil icon next to the High Flow Rate eld and enter the “high” or “full-scale” ow rate
value that will produce a 20-mA output. Adjust the decimal position, if necessary, using the slide bar. A
ow rate equal to or greater than this maximum setpoint will result in an output of 20 mA.
Figure 4.29—Data-entry screen for 4-20 mA low and high values
4-20 mA Output Testing
The MC-III software allows users to test the 4-20 mA output by entering an output current value and reading
the live value generated in response.
To use the test mode, press the “Test 4-20 mA Output” button at the bottom of the 4-20 mA Output screen.
The test page will appear (Figure 4.30, page 63), and the 4-20 mA Output option will be temporarily disabled.
To test the output, enter a value in the Output Current (mA) eld, and press “Set Output.”
62
Page 69

MC-III™ EXP Flow Analyzer Section 4
Figure 4.30—4-20 mA output test screen
Pulse Output
The Pulse Output screen (Figure 4.31) allows users to congure the MC-III EXP to provide a pulse output
representing increments in volume. A test mode function is also included, allowing a user to calibrate and/or
verify the output received by an end device.
Figure 4.31—Pulse Output screen
63
Page 70

Section 4 MC-III™ EXP Flow Analyzer
Conguring Pulse Output
By default, the pulse output option is disabled to reduce current consumption. To conserve power, do not
enable this feature unless it will be used.
To enable the pulse output option, perform the following steps:
Check the “Enable” checkbox.
1.
Enter the pulse duration value using the “plus” and “minus” buttons on the screen, or the page-up and
2.
page-down keys on a computer keyboard. The pulse length (pulse width) determines the length of each
output pulse in milliseconds (ms).
3.
Click on the pencil icon next to the scale eld to open a data-entry window (Figure 4.32), and enter the
scale factor. Adjust the decimal position, if necessary, using the slide bar. The scale factor sets the volume
increment that will cause a pulse output to occur. The unit for this factor is determined by the unit set for
the volume display.
Figure 4.32—Data-entry screen for pulse output scale factor
Note—The scale factor can be any number; it is not limited to powers of 10 (1, 10, 100, etc.).
In applications where high ow rates may occur for extended periods, pulses can be lost due to the
instrument’s inability to register the ow rate at the maximum output frequency. To avoid the loss of pulses,
users can raise the scale factor or shorten the pulse duration. The software calculates the maximum ow
rate that can be reached before pulse caching is likely to occur, and displays the information on the Pulse
Output screen. In applications where short bursts of high ow rates are common (separators, tank loading,
dump cycles, etc.), the displayed ow rate can exceed the maximum ow rate for short periods without
compromising the accuracy of the total represented by the pulse output.
64
Page 71

MC-III™ EXP Flow Analyzer Section 4
Pulse Output Testing
The MC-III software allows users to test the pulse output by writing a value to the pulse accumulator. Such
tests can aid in troubleshooting problems with hardware compatibility, threshold settings, and pulse duration
settings.
To use the test mode, press the “Test Pulse Output” button at the bottom of the Pulse Output screen. The test
page will appear (Figure 4.33), and the Pulse Output option will be temporarily disabled.
To test the output, enter a value in the Pulse Count eld, and press “Set Output.” The value in the Live Value
eld will decrement to zero in accordance with the programmed pulse duration.
Figure 4.33—Pulse output test screen
65
Page 72

Section 4 MC-III™ EXP Flow Analyzer
Saving and Uploading Conguration Files
The MC-III EXP allows a user to save conguration settings in a le that is stored on the user’s computer and
can be uploaded to the MC-III EXP as needed. Conguration les are easily identied by the .mc3 extension.
The default lename begins with “cong” and uses the following structure:
File Format Filename Structure
.mc3 “cong”<date (YYMMDD)> <time (hhmmss)>.mc3
Example: cong050209133922.mc3 is a conguration le that was
downloaded on February 9, 2005 at 1:39:22 p.m.
Saving a Conguration File
To save current conguration settings for future reference, perform the following steps:
Select File>Save Conguration File (Figure 4.34). A “Save MC3 Conguration File” screen will appear,
1.
prompting the user to save the le to the computer hard drive. The default directory is C:\NuFlo log data\
MC-III\<WELL NAME>, however the user can specify a new location, if desired.
Figure 4.34—File dropdown menu allows user to save a conguration le
Click “Save.” An “Information” window will appear to conrm that the le has been saved.
2.
The “wellname” folder will bear the well name that appears on the Wellsite Information screen. If no well
name is entered on this screen, the folder will be named “NO_WELLNAME” (Figure 4.35, page 67).
66
Page 73

MC-III™ EXP Flow Analyzer Section 4
Figure 4.35—Default directory for conguration les
Uploading a Conguration File
To upload a conguration le, perform the following steps:
From the Main screen, select File>Return to Welcome Screen (Figure 4.36).
1.
Click on the LCD to connect to the MC-III EXP.
2.
3.
Click “Upload a conguration” (
tion File” window will appear (Figure 4.38, page 68), displaying the contents of the MC-III folder.
4.
Click on the appropriate well name folder, select the conguration le of your choice, and click “Open.”
A “Progress” window will appear momentarily, followed by an “Information” window conrming the
upload.
Figure 4.37, page 68) and click “Do It Now.” A “Load MC3 Congura-
Figure 4.36—File dropdown menu allows user to return to the Welcome screen
67
Page 74

Section 4 MC-III™ EXP Flow Analyzer
Figure 4.37—Upload a Conguration option
Figure 4.38—Default directory for conguration les
68
Page 75

MC-III™ EXP Flow Analyzer Section 4
Advanced Access
System congurators and host programmers can also access the software through the Advanced Access menu
(Figure 4.39). This option provides access to the Modbus® registers for the MC-III EXP. A series of tabs on
the right side of the screen (real time, input conguration, output conguration...) allows the user to view a
specic group of registers, or to view all registers in one list.
Important: The Advanced Access option is not required for the routine operation of the MC-III EXP,
and novice users should not access this portion of the software unless instructed to do
so by Cameron technical support personnel.
Data retrieved from the MC-III EXP while in Advanced access mode can be logged to a le by enabling the
“Automatically log data polls” checkbox on the Advanced Options screen. The le will include values that are
retrieved from the instrument when the user clicks the “Get All Data” button or enables “Auto Polling” on the
Advanced Access screen. See also Automatic Data Logging, page B-6.
Figure 4.39—Advanced Access screen
69
Page 76

Section 4 MC-III™ EXP Flow Analyzer
70
Page 77

MC-III™ EXP Flow Analyzer Section 5
Section 5—Flow Logs and Event Logs
The MC-III™ EXP’s ow archive expands the user’s ability to track ow volume over time by allowing the
user to view ow data in tabular and trend formats, to save or print log data in reports, and to export log data
into a spreadsheet. Additionally, an event archive allows users to identify changes to conguration parameters
and other settings for troubleshooting operational issues.
A user can download logs from the Flow Archive and Event Archive screens as needed, or congure the
software to automatically download the logs upon connection with the instrument. See Automating Functions
on Software Startup, page 37, for more information.
When the “download all logs” or “download only new logs” option is selected from the Device Autorun
Options menu and the “Always do...” checkbox is checked, the software will download both ow logs and
event logs each time the software connects to the MC-III EXP (Figure 5.1).
Figure 5.1—Device Autorun Options screen allows automated log downloads with every connection
Auto-Save Log Formats
The MC-III EXP automatically saves daily ow logs on the contract hour, and saves hourly ow logs around
the clock. The instrument also automatically saves an event log each time a user change is made. After
downloading these logs from the instrument, the software saves the data in a le. By default, the logs are
saved as .csv les.
The le format of the auto-save ow log and event log les is user-congurable. To save logs in Excel (.xls)
format, click Options>Program Options in the task bar, select Downloading from the dropdown options list,
and check the “XLS-MS Excel File” checkbox (Figure 5.2, page 72).
71
Page 78

Section 5 MC-III™ EXP Flow Analyzer
Figure 5.2—Log download options
Log Directory and Filenames
Auto-save log les are saved in C:\NuFlo log data\MC-III\<WELL NAME>. The “wellname” folder will bear
the well name that appears on the Wellsite Information screen. If no well name is entered on this screen, the
folder will be named “NO_WELLNAME.”
Log lenames incorporate the serial number of the MC-III EXP, the date, the time, and a capital letter
indicating the log type, as shown below.
File Format Filename Structure
.xls or .csv <Serial number>_<date (YYYYMMDD)>_<time (hhmmss)>_<log
type indicator> where the log type indicator is
“H” for hourly, “D” for daily, or “E” for event
Example: 16_20050302_102031_H.xls is an hourly log le from the
MC-III EXP serial number 16 that was downloaded on March 2, 2005
at 10:20:31 AM.
Flow Archive
The MC-III EXP automatically saves daily ow logs on the contract hour, and hourly ow logs. The Flow
Archive screen (Figure 5.3, page 73) allows users to download, view, and print trend charts, and export daily
and hourly logs. On the Flow Archive screen, users can view up to 384 daily logs and 768 hourly logs in
tabular format (note the Daily Logs and Hourly Logs tabs at the bottom of the screen), or in a trend chart (see
Daily Trend and Hourly Trend tabs).
72
Page 79

MC-III™ EXP Flow Analyzer Section 5
Figure 5.3—Flow Archive screen
Downloading Flow Logs
To download ow logs, click the “Download” button on the Flow Archive screen, and select either Download
All Flow Logs or Download Only New Flow Logs (Figure 5.4, page 74). (Download Only New Flow Logs
will display only ow logs that have been created since the last download was performed.) Tabular views of
the archive record (Figure 5.5, page 74) include a time stamp showing the exact time each log was recorded,
as well as ow volume, run time, and supply voltage. Trend views (Figure 5.6, page 75) show the ow
volume and time stamp only.
73
Page 80

Section 5 MC-III™ EXP Flow Analyzer
Figure 5.4—Menu for downloading ow logs from the Flow Archive screen
Figure 5.5—Downloaded ow logs (tabular view)
74
Page 81

MC-III™ EXP Flow Analyzer Section 5
Viewing Trend Charts
In the daily and hourly trend views, ow volumes are charted on a grid, with ow record numbers forming
the horizontal axis, and ow volumes shown on the vertical axis. A graphical line dened by two yellow
endpoints represents the range of archived logs available for viewing. A yellow triangle marks the rst record,
and a yellow circle marks the nal record. The arrowhead cursor is paired with dotted circle. As the user drags
the cursor across the chart, the circle’s position corresponds with the record displayed at the top of the screen
(Figure 5.6). The circle’s snap function allows the user to pinpoint transitional points within the trend display;
the greater the zoom, the more precise the navigation.
Note—The interactive cursor cannot be turned off.
To zoom in, left-click and drag the mouse to the right and down.
•
To zoom out, drag the mouse up and to the left.
•
To reposition the chart within the viewing window, right-click the chart and move the mouse slowly in
•
any direction.
To exit the page and return to the Main screen, press OK.
•
Figure 5.6—Flow Archive screen, trend view
Printing/Saving a Report
A ow log can be printed and/or saved as a table (Figure 5.7, page 76) or a trend chart (Figure 5.8, page 76).
To print a log, select the appropriate tab at the bottom of the Flow Archive screen, and press the “Print”
button in the upper right corner of the Flow Archive screen. (If the display is tabular, the button will read
75
Page 82

Section 5 MC-III™ EXP Flow Analyzer
“Print Table”; if the display is a chart, the button will read “Print Chart.”) A Print Preview screen will appear,
displaying the image to be printed.
To print the report, select File>Print from the task bar (Figure 5.7).
Figure 5.7—Print preview, tabular view
Figure 5.8—Print preview, trend view
76
Page 83

MC-III™ EXP Flow Analyzer Section 5
To save the report, perform the following steps:
Select File>Save from the task bar (
1.
Figure 5.8, page 76). A “Save Report As” window will open (Figure
5.9).
2.
Enter a lename. The lename extension will be .rps.
3.
Click “Save.” By default, log archive reports are saved in C:\NuFlo log data\MC-III\<WELL NAME>,
however the user can specify a new location, if desired. The “wellname” folder will bear the well name
that appears on the Wellsite Information screen. If no well name is entered on this screen, the folder will
be named “NO_WELLNAME.”
Figure 5.9—Save Report As screen
Viewing a Saved Report
To view a saved report, perform the following steps:
From the Flow Archive screen, click “Print Table” (or “Print Chart” for trend chart views)
1.
right corner of the screen.
2.
Select File>Load from the task bar at the top of the page (
Figure 5.10, page 78). A Load Report window
will open (Figure 5.11, page 78).
3.
Click on the report you wish to view. A preview of the report will appear in the right portion of the win
dow.
4.
Click “Open.”
in the upper
-
77
Page 84

Section 5 MC-III™ EXP Flow Analyzer
Figure 5.10—Menu for loading a saved report
Figure 5.11—Load Report screen for viewing saved ow log reports
78
Page 85

MC-III™ EXP Flow Analyzer Section 5
Exporting Flow Logs
Flow logs can be directly exported to an .xls or .csv le for ease in viewing and distributing. To export a le,
perform the following steps:
Click the “Export Data” button near the top of the Flow Archive screen and select the .xls or .csv format
1.
(Figure 5.12).
2.
When the “Export Daily (or Hourly) Log Data...” window appears, click “Save.” By default, exported
logs are saved in C:\NuFlo log data\MC-III\<WELL NAME>, however the user can specify a new loca-
tion, if desired (Figure 5.13, page 80). The “wellname” folder will bear the well name that appears on the
Wellsite Information screen. If no well name is entered on this screen, the folder will be named “NO_
WELLNAME.”
Important Users can also specify the le format to be used for all auto-save logs (.csv or .xls). To
change the auto-save format, follow the procedure described in Downloading Options,
page B-5.
Figure 5.12—Dropdown menu for exporting log data
79
Page 86

Section 5 MC-III™ EXP Flow Analyzer
Figure 5.13—Default directory for exported log les
Event Archive
The Event Archive screen (Figure 5.14) allows users to download, view, export, and print up to 345 user event
logs. Event logs are generated to track user changes such as K-Factor changes, input setting changes, power-
on and “watch-dog” resets, and the ow and frequency cut-off settings.
Figure 5.14—Event Archive screen
80
Page 87

MC-III™ EXP Flow Analyzer Section 5
Downloading Event Logs
To download event logs, click the “Download” button on the Flow Archive screen, and select either
Download All Event Logs or Download Only New Event Logs, (Figure 5.15). Download Only New Event
Logs will display only ow logs that have been created since the last download was performed. Tabular
views of the archive record (Figure 5.16, page 82) include a time stamp showing the exact time each log was
recorded, as well as the name of the register changed, and the old and new values assigned to that register.
Figure 5.15—Menu for downloading event logs from Event Archive screen
81
Page 88

Section 5 MC-III™ EXP Flow Analyzer
Figure 5.16—Downloaded event logs
Printing/Saving a Report
To print an event log, press the “Print Table” button in the upper right corner of the Event Archive screen. A
Print Preview screen will appear, displaying the image to be printed.
To print the report, select File>Print from the task bar.
To save the report, perform the following steps:
Select File>Save from the task bar. A “Save Report As” window will open.
1.
Enter a lename. The lename extension will be .rps.
2.
3.
Click “Save.” By default, log archive reports are saved in C:\NuFlo log data\MC-III\<WELL NAME>,
however the user can specify a new location, if desired.The “wellname” folder will bear the well name
that appears on the Wellsite Information screen. If no well name is entered on this screen, the folder will
be named “NO_WELLNAME.”
The procedure for printing and saving an event log report is nearly identical to the procedure for printing and
saving a ow log report. See the ow log screen captures, pages 75 through 77, for reference.
Exporting Event Logs
Event logs can be directly exported to an .xls or .csv le for ease in viewing and distributing. To export a le,
perform the following steps:
Click the “Export Data” button near the top of the Event Archive screen and select the .xls or .csv format
1.
(Figure 5.17, page 83).
82
Page 89

MC-III™ EXP Flow Analyzer Section 5
When the “Export Event Logs...” window appears, click “Save.” By default, exported logs are saved in
2.
C:\NuFlo log data\MC-III\<WELL NAME>, however the user can specify a new location, if desired. The
“wellname” folder will bear the well name that appears on the Wellsite Information screen. If no well
name is entered on this screen, the folder will be named “NO_WELLNAME.”
Important Users can also specify the le format to be used for all auto-save logs (.csv or .xls). To
change the auto-save format, follow the procedure described in Downloading Options,
page B-5.
Figure 5.17—Dropdown menu for exporting log data
83
Page 90

Section 5 MC-III™ EXP Flow Analyzer
84
Page 91

MC-III™ EXP Flow Analyzer Section 6
Section 6 - MC-III EXP Maintenance
The MC-III™ EXP is designed to provide many years of service with minimal maintenance. Batteries require
periodic replacement, and battery life depends on whether battery power is the primary or secondary power
source.
All conguration settings are stored in nonvolatile memory; therefore, conguration settings will not be lost
in the event of battery failure.
The circuit assembly or keypad may also require replacement over the life of the instrument. Procedures are
provided in this section.
Lithium Battery Replacement
The MC-III EXP uses a lithium battery with a life expectancy of approximately 2 years. Due to the at
discharge characteristics of the lithium battery, it is difcult to determine how much life remains in a battery
at any given time. To preserve conguration and accumulated volume data, replace the battery at 2-year
intervals.
Warning: To prevent ignition of hazardous atmospheres, do not remove the cover while circuits are
alive. Under normal conditions, the MC-III EXP poses no hazard when opened in a safe
area.
Warning: The lithium battery that powers the MC-III EXP is a sealed unit; however, should a lithium
battery develop a leak, toxic fumes could escape upon opening the enclosure. Ensure
that the instrument is in a well-ventilated area before opening the enclosure to avoid
breathing fumes trapped inside the enclosure. Exercise caution in handling and
disposing of spent or damaged batteries. See additional information on lithium batteries
in Appendix C of this manual.
Important: Press the ENTER/SAVE key on the keypad before replacing the lithium battery to save
the accumulated total to nonvolatile memory. Once the battery is replaced and power is
restored to the unit, the last saved accumulated total will be displayed in the LCD.
The lithium battery is secured inside the enclosure by a velcro strap and connected to a connector (J1) near the
top of the circuit assembly.
To replace a lithium battery in the MC-III EXP, perform the following steps:
Unscrew the cover of the enclosure counter-clockwise until it separates from the main body of the enclo
1.
-
sure.
2.
Using a small standard blade screwdriver, remove the two #4-40 × 7/8” screws located to the right and
left side of the display (Figure 6.1, page 86).
85
Page 92

Section 6 MC-III™ EXP Flow Analyzer
Remove screws
to access battery
compartment
Figure 6.1— Removal of faceplate/keypad assembly
Lift the display/keypad assembly from the enclosure, making sure the circuit assembly does not contact
3.
the enclosure.
4.
Loosen the velcro strap, disconnect the battery from the J1 connector on the circuit assembly, and remove
the battery from the enclosure (Figure 6.2).
Figure 6.2— Removal/replacement of lithium battery
86
Page 93

MC-III™ EXP Flow Analyzer Section 6
Install the new battery in the enclosure in the same position as the original battery, and secure the Velcro
5.
tightly around the battery.
6.
Connect the replacement battery to the J1 connector.
7.
Place the circuit assembly over the standoffs and fasten with the two #4-40 × 7/8” screws, ensuring that
all connector wiring is inside the enclosure.
8.
Replace the enclosure cover, threading it onto the enclosure in a clockwise direction.
Important: The interruption of power to the MC-III EXP will cause the internal clock time to be inac-
curate. Reset the time via the interactive software. See Time/Date Synchronization, page
50.
Alkaline Battery Replacement
The alkaline battery pack will require periodic replacement. The dimming of the LCD may be an indicator
that battery power is diminishing, and the battery pack should be replaced.
Warning: To prevent ignition of hazardous atmospheres, do not remove the cover while circuits are
alive. Under normal conditions, the MC-III EXP poses no hazard when opened in a safe
area.
Important: Press the ENTER/SAVE key on the keypad before replacing the alkaline battery to save
the accumulated total to nonvolatile memory. Once the battery is replaced and power is
restored to the unit, the last saved accumulated total will be displayed in the LCD.
The shrink-wrapped alkaline battery pack is secured inside the MC-III EXP enclosure by a Velcro strap and
connected to a connector (J1) near the top of the circuit assembly.
To replace the battery pack, perform the following steps:
Unscrew the cover of the enclosure counter-clockwise until it separates from the main body of the enclo-
1.
sure.
2.
Using a small standard blade screwdriver, remove the two #4-40 × 7/8” screws located to the right and
left side of the display (Figure 6.3, page 88).
87
Page 94

Section 6 MC-III™ EXP Flow Analyzer
Remove screws
to access battery
compartment
Figure 6.3—Removal of faceplate/keypad assembly
Lift the display/keypad assembly from the enclosure.
3.
Loosen the Velcro strap, disconnect it from the J1 connector on the circuit assembly, and remove the bat-
4.
tery from the enclosure (Figure 6.4).
Figure 6.4—Removal/replacement of alkaline battery pack
88
Page 95

MC-III™ EXP Flow Analyzer Section 6
Install the new shrink-wrapped battery pack in the same position as the original battery pack as shown in
5.
Figure 6.4, page 88, and secure the Velcro strap to hold the pack tightly in place.
6.
Connect the replacement battery pack to the J1 connector.
7.
Place the circuit assembly over the standoffs and fasten with the two #4-40 × 7/8” screws, ensuring that
all connector wiring is inside the enclosure.
8.
Replace the enclosure cover, threading it onto the enclosure in a clockwise direction.
Important: The interruption of power to the MC-III EXP will cause the internal clock time to be inac-
curate. Reset the time via the interactive software. See Time/Date Synchronization, page
50.
Circuit Assembly Replacement
Warning: To prevent ignition of hazardous atmospheres, do not remove the cover while circuits are
alive. Under normal conditions, the MC-III EXP poses no hazard when opened in a safe
area.
Important: Static electricity can damage a circuit board. Handle new boards only by their edges,
and use proper anti-static techniques (such as wearing anti-static wrist strap or touching
metal to establish an earth ground) prior to handling a board.
Important: If possible, record the accumulated total and all conguration settings before replacing
the circuit board. This information can be recorded by hand or captured by saving a conguration le that can be reloaded into the unit after the circuit board is replaced. (See
Saving and Uploading Conguration Files, page 66.)
To replace the circuit assembly, perform the following steps:
Unscrew the cover of the enclosure counter-clockwise until it separates from the main body of the enclo-
1.
sure.
Using a small standard blade screwdriver, remove the two #4-40 × 7/8” screws located to the right and
2.
left side of the display.
Lift the display/keypad assembly from the enclosure.
3.
Record the locations of all cable connections to the circuit assembly.
4.
Using a small standard blade screwdriver, remove all wiring from terminal blocks TB1, TB2, and TB3,
5.
and J2, ensuring that all wiring that is connected to powered circuits is insulated with tape.
Unplug the battery cable from connector J1 on the circuit assembly.
6.
Remove the two #4-40 × 5/16” screws fastening the circuit assembly to the keypad assembly (Figure 6.5,
7.
page 90).
89
Page 96

Section 6 MC-III™ EXP Flow Analyzer
Figure 6.5—Disassembly of circuit board/keypad assembly
Disconnect the keypad ribbon cable from the J3 connector on the LCD side of the circuit assembly as fol-
8.
lows:
Grasp the black clip between a thumb and forenger (see white arrows in Figure 6.6 below).
a.
Squeeze both sides of the clip and gently pull to release the clip from the plastic connector that holds
b.
it in place. DO NOT PULL on the ribbon cable. When the black plastic clip is properly disengaged,
the cable will release freely.
Figure 6.6—To release the ribbon cable from the connector, press in on the side tabs of the connector (white
arrows) and gently pull forward (black arrow).
90
Page 97

MC-III™ EXP Flow Analyzer Section 6
Remove the original circuit assembly from the enclosure.
9.
Connect the ribbon cable of the keypad to the J3 connector on the LCD side of the circuit assembly as
10.
follows:
Insert the end of the ribbon cable into the plastic clip.
a.
While holding the ribbon cable in place, press the black plastic clip into the connector until it snaps.
b.
Mount the circuit assembly to the keypad with the two #4-40 × 5/16” screws.
11.
Reconnect the battery cable to J1 on the circuit assembly.
12.
Reconnect all wiring to terminal blocks TB1, TB2 and TB3 (and J2, if applicable).
13.
Mount the display/keypad assembly to the enclosure with the two #4-40 × 7/8” screws.
14.
Recalibrate the MC-III EXP, then replace the enclosure cover.
15.
Re-establish power to the peripheral circuitry.
16.
Keypad Replacement
Warning: To prevent ignition of hazardous atmospheres, do not remove the cover while circuits are
alive. Under normal conditions, the MC-III EXP poses no hazard when opened in a safe
area.
To replace the keypad of the MC-III EXP, perform the following steps:
Unscrew the cover of the enclosure counter-clockwise until it separates from the main body of the enclo-
1.
sure.
Using a small standard blade screwdriver, remove the two #4-40 × 7/8” screws located to the right and
2.
left side of the display.
Lift the display/keypad assembly from the enclosure.
3.
Remove the two #4-40 × 5/16” screws fastening the circuit assembly to the keypad (Figure 6.5, page 90).
4.
Disconnect the keypad ribbon cable from the J3 connector on the LCD side of the circuit assembly as fol-
5.
lows:
Grasp the black clip between a thumb and forenger (see white arrows in Figure 6.6, page 90).
a.
Squeeze both sides of the clip and gently pull to release the clip from the plastic connector that holds
b.
it in place. DO NOT PULL on the ribbon cable. When the black plastic clip is properly disengaged,
the cable will release freely.
Remove the circuit assembly.
6.
Connect the ribbon cable of the keypad to the J3 connector on the LCD side of the circuit assembly as
7.
follows:
Insert the end of the ribbon cable into the plastic clip.
a.
While holding the ribbon cable in place, press the black plastic clip into the connector until it snaps.
b.
8.
Mount the circuit assembly to the keypad with the two #4-40 × 5/16” screws.
91
Page 98

Section 6 MC-III™ EXP Flow Analyzer
Mount the display/keypad assembly to the enclosure with the two #4-40 × 7/8” screws.
9.
Recalibrate the MC-III EXP if necessary and replace the enclosure cover.
10.
Firmware Update
Before installing new rmware or moving the instrument to a new site, it is recommended that the user
clear the EEPROM, which will erase all conguration settings and log data. To clear the EEPROM, choose
Options/Program Options from the menu bar, select Advanced from the dropdown options list, and click on
the “Clear EEPROM” button (Figure 6.7).
Technical assistance is typically required for upgrading rmware. Contact Cameron’s Measurement Systems
Division to arrange an upgrade.
Warning: Clicking the “Clear EEPROM” button will delete all conguration settings and log records
in the MC-III EXP memory.
Figure 6.7—EEPROM clearing and automatic data log option
92
Page 99

MC-III™ EXP Flow Analyzer Section 6
Spare Parts List
Quantity Part Number Description
1 9A-30166003 Assembly, Switchplate
1 9A-50160002 Circuit Assembly
1 9A-90017002 Cable Assembly, Flowmeter
1 9A-100005111 Battery - Lithium, 3.6 V
1 9A-50099002 Battery Pack, Alkaline (3 “C”), Shrink-wrapped
1 9A-100002605 Desiccant Packet
1 9A-50074001 Assembly, Installation Software CD and CD
Pocket Folder, MC-III
1 9A-50165003 Manual, User
1 9A-50165004 Manual, Quick-Start
1 9A-100017622 Union, 1-in.
1 9A-50053010 Control Drawing, Intrinsically Safe RS-485
Connection, MC-III EXP
Optional Parts List
Quantity Part Number Description
1 9A-30054001 Assembly, Reset Switch, Explosion-Proof,
with Extension, Fits ¾ in. Female Pipe Thread
(CSA), for Standard Enclosure
1 9A-50053008 Assembly, Reset Switch, Explosion-Proof, for
Alternate Enclosure (Red Rim on Cover)
1 9A-50053009 IS Barrier, RS-485
1 9A-90017004 Cable Assembly, 3/4 in. NPT Explosion-Proof
Union, 2-Pin Connector, 10 in., for External RS485 Communications (CSA)
1 9A-101283116 Converter, RS-485 to RS-232, 9-Pin, with 10-ft
Cable
1 9A-100025195 Converter, RS-485 to RS-232, 25-Pin
1 9A-0112-9015T Converter, RS-485 to RS-232, Serial Port
Powered, DB9 Connector on Both Ends
1 9A-30028004 Kit, Pole Mount, Plated Steel
1 9A-30028005 Kit, Pole Mount, Stainless Steel
CAUTION: EXPLOSION HAZARD—SUBSTITUTION OF COMPONENTS MAY IMPAIR SUITABILITY
FOR CLASS I, DIVISION 1. USE OF SPARE PARTS OTHER THAN THOSE IDENTIFIED BY
CAMERON VOIDS CSA CERTIFICATION. CAMERON BEARS NO LEGAL RESPONSIBILITY
FOR THE PERFORMANCE OF A PRODUCT THAT HAS BEEN SERVICED OR REPAIRED
WITH PARTS THAT ARE NOT AUTHORIZED BY CAMERON.
93
Page 100

Section 6 MC-III™ EXP Flow Analyzer
94
 Loading...