

Page 1

Title Page
Cabletron Systems
9A128-01
™
Management Module Guide
for Microsoft
®
Windows
™
Page 2

Notice
Cabletron Systems reserves the right to make changes in specifications and other information
contained in this document without prior notice. The reader should in all cases consult Cabletron
Systems to determine whether any such changes have been made.
The hardware, firmware, or software described in this manual is subject to change without notice.
IN NO EVENT SHALL CABLETRON SYSTEMS BE LIABLE FOR ANY INCIDENTAL, INDIRECT,
SPECIAL, OR CONSEQUENTIAL DAMAGES WHATSOEVER (INCLUDING BUT NOT LIMITED
TO LOST PROFITS) ARISING OUT OF OR RELATED TO THIS MANUAL OR THE INFORMATION
CONTAINED IN IT, EVEN IF CABLETRON SYSTEMS HAS BEEN ADVISED OF, KNOWN, OR
SHOULD HAVE KNOWN, THE POSSIBILITY OF SUCH DAMAGES.
Virus Disclaimer
Cabletron has tested its software with current virus checking technologies. However, because no antivirus system is 100% reliable, we strongly caution you to write protect and then verify that the
Licensed Software, prior to installing it, is virus-free with an anti-virus system in which you have
confidence.
Cabletron Systems makes no representations or warranties to the effect that the Licensed Software is
virus-free.
Copyright
Printed in the United States of America.
Order Number: 9031589-03 August 1997
Cabletron Systems, Inc.
P.O. Box 5005
Rochester, NH 03866-5005
Cabletron Systems , SPECTRUM , BRIM , DNI , FNB , INA , Integrated Network Architecture ,
LANVIEW , LANVIEW Secure , Multi Media Access Center , MiniMMAC , and TRMM are registered
trademarks, and Bridge/Router Interface Modules , BRIM-A100 , CRBRIM-W/E , CRXMIM ,
CXRMIM , Desktop Network Interface , Distributed LAN Monitoring , Distributed Network Server ,
DLM , DNSMIM , E1000 , E2000 , E3000 , EFDMIM , EMM-E6 , EMME , EPIM , EPIM-3PS , EPIM-A ,
EPIM-C , EPIM-F1 , EPIM-F2 , EPIM-F3 , EPIM-T , EPIM-T1 , EPIM-X , ESXMIM , ETSMIM , ETWMIM ,
FDCMIM-04 , FDCMIM-08 , FDMMIM , FDMMIM-04 , Flexible Network Bus , FOMIM , FORMIM ,
HubSTACK , IRBM , IRM , IRM-2 , IRM-3 , Media Interface Module , MicroMMAC , MIM , MMAC ,
MMAC-3 , MMAC-3FNB , MMAC-5 , MMAC-5FNB , MMAC-8 , MMAC-8FNB , MMAC-M8FNB ,
MMAC-Plus , MRX , MRXI , MRXI-24 , MultiChannel , NB20E , NB25E , NB30 , NB35 , NBR-220/420/620 ,
RMIM , SecureFast Switch, SecureFast Packet Switching , SFS, SFPS , SPECTRUM Element
Manager , SPECTRUM for Open Systems , SPIM-A , SPIM-C , SPIM-F1 , SPIM-F2 , SPIM-T , SPIM-T1 ,
TPMIM , TPMIM-22 , TPMIM-T1 , TPRMIM , TPRMIM-36 , TPT-T , TRBMIM , TRMM-2 , TRMMIM ,
and TRXI are trademarks of Cabletron Systems, Inc.
1997 by Cabletron Systems, Inc. All rights reserved.
i
Page 3

AppleTalk, Apple, Macintosh, and TokenTalk are registered trademarks; and Apple Remote Access
and EtherTalk are trademarks of Apple Computer, Inc.
SmartBoost is a trademark of American Power Conversion
ST is a registered trademark and C++ is a trademark of AT&T
Banyan and VINES are registered trademarks of Banyan Systems, Inc.
cisco, ciscoSystems, and AGS+ are registered trademarks; and cBus, cisco Router, CRM, IGS, and MGS
are trademarks of cisco Systems, Inc.
GatorBox is a registered trademark; and GatorMail, GatorMIM, GatorPrint, GatorShare, GatorStar,
GatorStar GX-M, and XGator are trademarks of Cayman Systems, Inc.
CompuServe is a registered trademark of CompuServe Incorporated
X Window System is a trademark of Consortium, Inc.
CTERM, DECnet, and ULTRIX are registered trademarks; and DEC, DEC C++, DECnet-DOS,
DECstation, VAX DOCUMENT, VMA, and VT are trademarks of Digital Equipment Corporation
Fore Systems, ForeRunner, and ForeRunner ASX-100 are trademarks of Fore Systems, Inc.
PC/TCP is a registered trademark of FTP Software, Inc.
HP OpenView is a registered trademark of Hewlett-Packard, Inc.
AIX, IBM, OS/2, NetView, and PS/2 are registered trademarks; and AT, Micro Channel, PC, PC-DOS,
PC/XT, Personal Computer AT, Operating System/2, Personal System/2, RISC System/6000, and
Workplace Shell are trademarks of International Business Machines Corporation
i960 microprocessor is a registered trademark; and Intel and Multichannel are trademarks of Intel
Corporation
Microsoft, MS-DOS, and Windows are registered trademarks of Microsoft Corporation
Chameleon, ChameleonNFS, Chameleon 32, IPX/link, and NEWT are trademarks of
NETMANAGE, Inc.
NetWare and Novell are registered trademarks; and Internetwork Packet Exchange (IPX), IPX, and
Network File System (NFS) are trademarks of Novell, Inc.
Motif and MS are registered trademarks; and Open Software Foundation, OSF, OSF/1, and OSF/Motif
are trademarks of The Open Software Foundation, Inc.
Silicon Graphics and IRIS are registered trademarks; and Indigo and IRIX are trademarks of Silicon
Graphics, Inc.
NFS, PC-NFS, SPARC, Sun Microsystems, and Sun Workstation are registered trademarks; and
OpenWindows, SPARCstation, SPARCstation IPC, SPARCstation IPX, Sun, Sun-2, Sun-3, Sun-4,
Sun386i, SunNet, SunOS, SunSPARC, and SunView are trademarks of Sun Microsystems, Inc.
OPEN LOOK and UNIX are registered trademarks of Unix System Laboratories, Inc.
Ethernet, NS, Xerox Network Systems and XNS are trademarks of Xerox Corporation
ii
Page 4

ANNEX, ANNEX-II, ANNEX-IIe, ANNEX-3, ANNEX-802.5, MICRO-ANNEX-XL, and MICROANNEX-ELS are trademarks of Xylogics, Inc.
MAXserver and Xyplex are trademarks of Xyplex, Inc.
Restricted Rights Notice
(Applicable to licenses to the United States Government only.)
1. Use, duplication, or disclosure by the Government is subject to restrictions as set forth in
subparagraph (c) (1) (ii) of the Rights in Technical Data and Computer Software clause at DFARS
252.227-7013.
Cabletron Systems, Inc., 35 Industrial Way, Rochester, New Hampshire 03867-0505.
2. (a) This computer software is submitted with restricted rights. It may not be used, reproduced, or
disclosed by the Government except as provided in paragraph (b) of this Notice or as otherwise
expressly stated in the contract.
(b) This computer software may be:
(1) Used or copied for use in or with the computer or computers for which it was acquired,
including use at any Government installation to which such computer or computers may
be transferred;
(2) Used or copied for use in a backup computer if any computer for which it was acquired
is inoperative;
(3) Reproduced for safekeeping (archives) or backup purposes;
(4) Modified, adapted, or combined with other computer software, provided that the
modified, combined, or adapted portions of the derivative software incorporating
restricted computer software are made subject to the same restricted rights;
(5) Disclosed to and reproduced for use by support service contractors in accordance with
subparagraphs (b) (1) through (4) of this clause, provided the Government makes such
disclosure or reproduction subject to these restricted rights; and
(6) Used or copied for use in or transferred to a replacement computer.
(c) Notwithstanding the foregoing, if this computer software is published copyrighted computer
software, it is licensed to the Government, without disclosure prohibitions, with the minimum
rights set forth in paragraph (b) of this clause.
(d) Any other rights or limitations regarding the use, duplication, or disclosure of this computer
software are to be expressly stated in, or incorporated in, the contract.
(e) This Notice shall be marked on any reproduction of this computer software, in whole or in part.
iii
Page 5

iv
Page 6

Chapter 1 Introduction
Using This Guide ..........................................................................................................1-1
Related Reading ............................................................................................................1-2
Software Conventions .................................................................................................. 1-3
Common Window Fields...................................................................................... 1-3
Using Buttons .........................................................................................................1-4
Getting Help ..................................................................................................................1-4
Using On-line Help................................................................................................ 1-4
Getting Help from the Cabletron Systems Global Call Center .......................1-5
Firmware Versions Supported.....................................................................................1-6
Contents
Chapter 2 The 9A128-01 Module View
Viewing Module Information......................................................................................2-2
Front Panel Information........................................................................................ 2-2
Menu Structure....................................................................................................... 2-4
Port Status Displays............................................................................................... 2-8
Selecting a Port Status View.......................................................................... 2-9
Bridge Port Status Displays........................................................................... 2-9
Bridge Port Status Color Codes........................................................... 2-10
The FDDI Port Status Displays................................................................... 2-10
FDDI Port Status Color Codes............................................................. 2-12
The Chassis Manager Window.......................................................................... 2-12
Viewing Hardware Types ................................................................................... 2-13
Device Type ...................................................................................................2-13
Module Type.................................................................................................. 2-13
Viewing I/F Summary Information.................................................................. 2-14
Interface Performance Statistics/Bar Graphs........................................... 2-15
Interface Statistics Window......................................................................... 2-17
Making Sense of Interface Statistics.................................................... 2-19
Using the Find Source Address Feature ...........................................................2-19
Managing the Hub...................................................................................................... 2-20
Setting the Device Date and Time .....................................................................2-20
Enabling and Disabling Ports ............................................................................ 2-21
Bridge Ports ................................................................................................... 2-21
Module Ports................................................................................................. 2-22
Chapter 3 ATM Configuration
Accessing the ATM Connections Window ................................................................ 3-1
v
Page 7

Contents
Configuring Connections............................................................................................. 3-4
Adding a New Connection...................................................................................3-4
Deleting a Connection........................................................................................... 3-5
Chapter 4 FDDI Management
Configuration................................................................................................................. 4-2
Connection Policy .........................................................................................................4-6
Station List...................................................................................................................... 4-8
Stations Panel..........................................................................................................4-9
Performance .................................................................................................................4-10
Chapter 5 Bridging
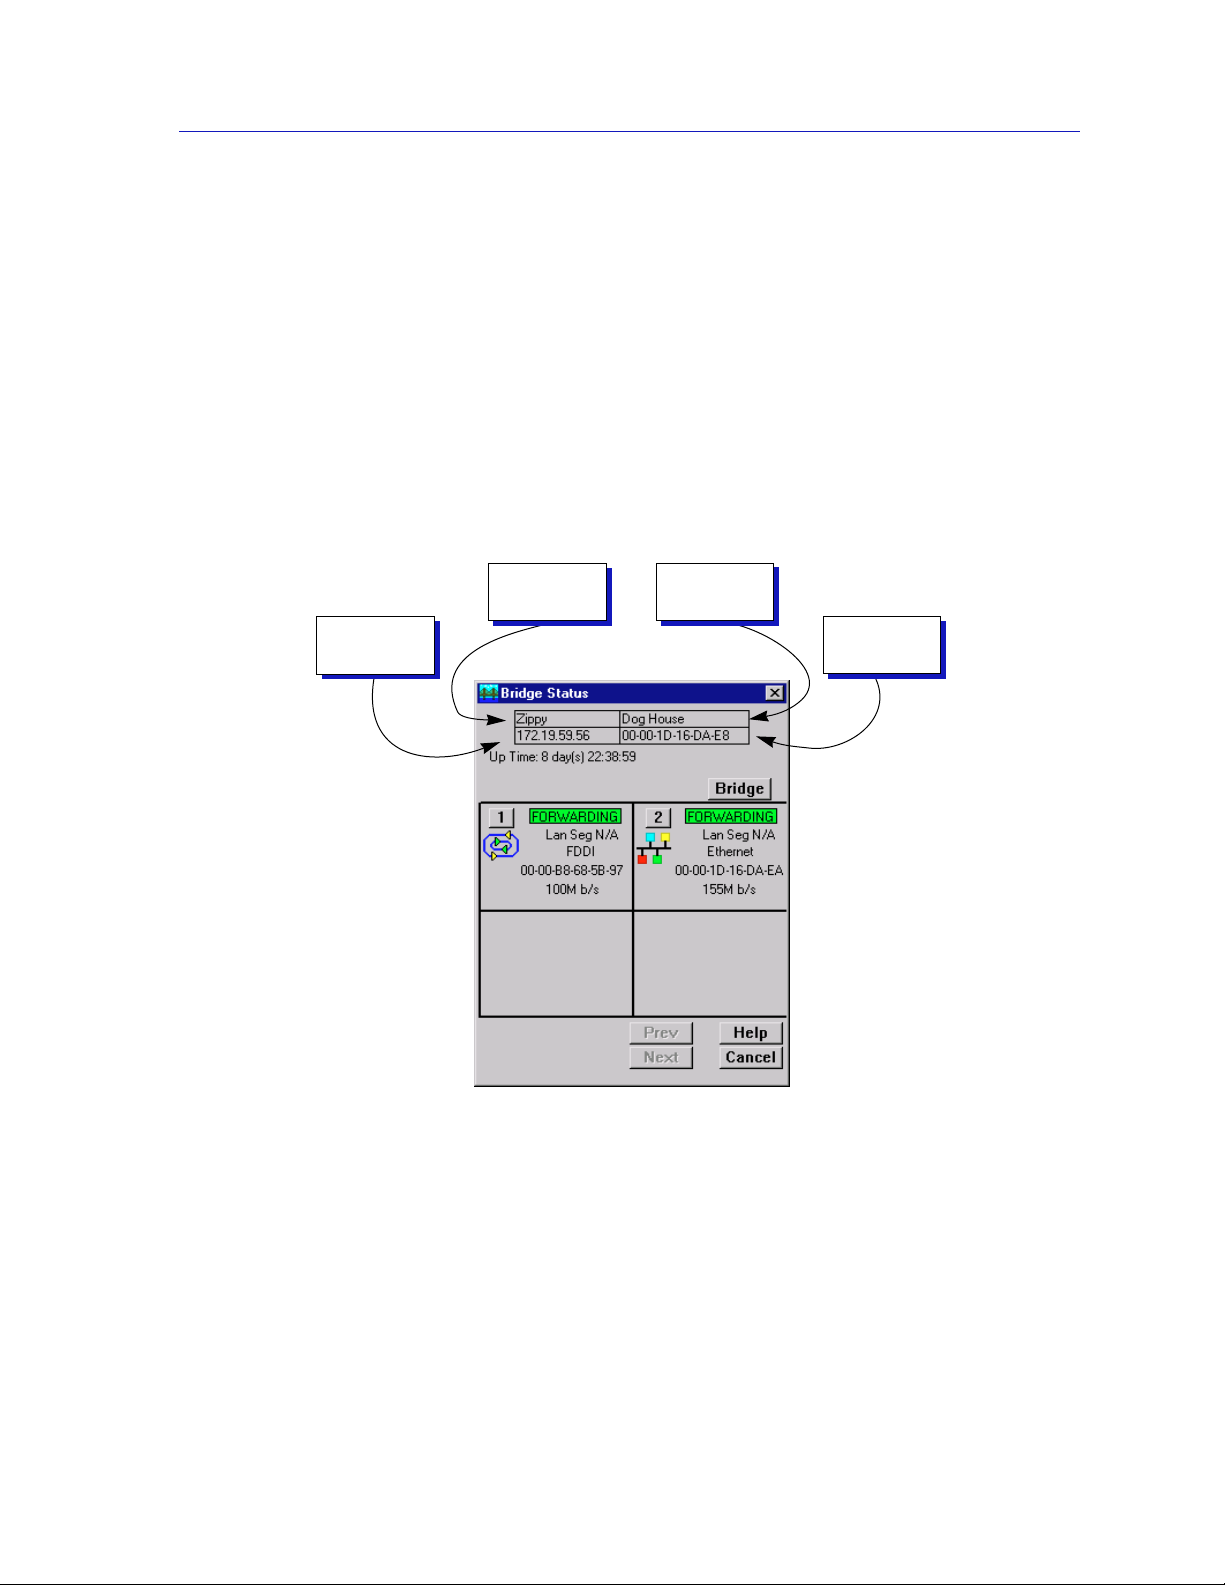
The Bridge Status Window.......................................................................................... 5-2
Accessing Other Management Options from the
Bridge Status Window ...................................................................................5-3
Configuring Duplex Modes......................................................................................... 5-4
Enabling and Disabling Bridging ...............................................................................5-5
Bridge Statistics .............................................................................................................5-6
Performance Graphs..............................................................................................5-6
Configuring the Bridge Performance Graphs............................................. 5-8
The Bridge Detail Breakdown Window....................................................... 5-8
The Bridge Port Detail Breakdown Window ..............................................5-9
The Interface Statistics Window.........................................................................5-10
Using Source Addressing........................................................................................... 5-12
Setting the Ageing Time...............................................................................5-13
Bridge Spanning Tree..................................................................................................5-14
Configuring the Bridge Spanning Tree Window.............................................5-15
Changing Bridge Spanning Tree Parameters................................................... 5-18
Changing Bridge Priority ............................................................................5-19
Changing the Spanning Tree Algorithm Protocol Type.......................... 5-19
Changing Hello Time................................................................................... 5-19
Changing Max Age Time .............................................................................5-20
Changing Forwarding Delay Time............................................................. 5-20
Changing Port Priority.................................................................................5-20
Changing Path Cost......................................................................................5-21
Filtering Database .......................................................................................................5-21
Configuring the Filtering Database................................................................... 5-25
Altering the Ageing Time ............................................................................5-26
Changing the Type of Entry ........................................................................5-26
Changing the Receive Port ..........................................................................5-26
Changing the Port Filtering Action............................................................ 5-26
Adding or Deleting Individual Entries......................................................5-26
Clearing All Permanent, Static, or Dynamic Entries................................5-27
Index
vi
Page 8

Chapter 1
Introduction
How to use this guide; getting help; software conventions; related reading; firmware versions
Welcome to the Cabletron Systems MMAC-Plus™ Remote Management for the
9A128-01™ User’s Guide. We have designed this document to serve as a simple
reference guide for using MMAC-Plus Remote Management for the 9A128-01
FDDI/ATM bridge module. You should read through this guide to fully
understand SPECTRUM Element Manager remote management for the 9A128-01.
The 9A128-01 ATM Access Module provides two bridging interfaces which allow
you to connect an external ATM network to either one of the two FDDI networks
resident on the MMAC-Plus hub’s FNB backplane. External front panel
connections are made via a SONET, OC3 ATM interface. The 9A128-01 can be
used to aggregate FNB traffic to an ATM backbone, or provide connectivity
between ATM workstations and traditional LAN users. The 9A128-01 is an 802.3
LAN Emulation Client (LEC) device and will operate in an 802.3 emulated LAN;
see Chapter 6, LEC Administrator, in your SPECTRUM Element Manager Tools
Guide for more information.
IETF RFC 1483 — Multi-Protocol Encapsulation over ATM Adaptation Layer 5 —
specifies a number of methods for encapsulating LAN traffic for transmission
over ATM networks. Current versions of the 9A128-01 firmware use 802.3
VC-based multiplexing for bridging protocols; the most recent version of
firmware (2.10.13) supports ATM Forum LAN Emulation and UNI 3.0/3.1 SVC
signaling; future version will add support for Cabletron’s SecureFast Switching.
Using This Guide
Each chapter in this guide describes one major functionality or a collection of
several smaller functionalities supported by the 9A128-01 module. This guide
contains information about software functions which are accessed directly from
the Module View; for information about functions which are accessed via the
MMAC-Plus Chassis View and/or the console window menu bar, consult the
1-1
Page 9

Introduction
Installing and Using SPECTRUM Element Manager Guide, Using MMAC+
Remote Management, User’s Guide and SPECTRUM Element Manager Tools
Guide.
Chapter 1, Introduction, provides a list of related documentation, describes
certain software conventions, and shows you how to contact Cabletron Systems’
Global Call Center. A brief description of the 9A128-01 module is also provided.
Chapter 2, The 9A128-01 Module View, describes the visual display of the
9A128-01 and explains how to use the mouse within the Module View; the
operation of several device-level management functions — such as changing the
port display, enabling and disabling ports, and setting device date and time— is
also described here.
Chapter 4, ATM Configuration, describes how to configure Permanent Virtual
Circuits (PVCs) for the ATM interface(s) available on each device’s front panel.
Chapter 5, FDDI Management, describes the Configuration, Connection Policy,
Station List, and Performance selections available from the FDDI menu. These
windows provide information about each module’s FDDI FNB connections.
Chapter 6, Bridging, provides a comprehensive look at all management options
associated with the bridge portion of the 9A128-01, including Bridge Performance
Graphs, Spanning Tree, and the Filtering Database.
We assume that you have a general working knowledge of Ethernet, IEEE 802.3,
FDDI, ANSI X3T9.5, and ATM Forum type data communications networks and
their physical layer components, and that you are familiar with basic bridging
and switching concepts.
Related Reading
The 9A128-01 user’s guide is only part of a complete document set designed to
provide comprehensive information about the features available to you through
SPECTRUM Element Manager. Other guides which supply important
information related to managing these modules include:
Cabletron Systems’ Installing and Using SPECTRUM Element Manager
Cabletron Systems’ Using MMAC-Plus Remote Management User’s Guide
Cabletron Systems’ SPECTRUM Element Manager Tools Guide
Cabletron Systems’ SPECTRUM Element Manager Remote Administration Tools
User’s Guide
Cabletron Systems’ Network Troubleshooting Guide
Microsoft Corporation’s Microsoft Windows User’s Guide
For more information about the capabilities of the 9A128-01, consult the
appropriate hardware documentation.
1-2 Related Reading
Page 10
Software Conventions
The SPECTRUM Element Manager user interface contains a number of elements
which are common to most windows and which operate the same regardless of
which window they appear in. A brief description of some of the most common
elements appears below; note that the information provided here is not repeated
in the descriptions of specific windows and/or functions.
Common Window Fields
Similar descriptive information is displayed in boxes at the top of most windows
in SPECTRUM Element Manager, as illustrated in Figure 1-1, below.
Introduction
IP Address
Figure 1-1. Sample Window Showing Group Boxes
Device
Name
Location
MAC
Address
Device Name
Displays the user-defined name of the device. The device name can be changed
via the System Group window; see the Generic SNMP User’s Guide for details.
IP Address
Displays the device’s IP (Internet Protocol) Address; this will be the IP address
used to define the device icon. IP addresses are assigned via Local Management;
they cannot be changed via SPECTRUM Element Manager.
Software Conventions 1-3
Page 11

Introduction
Using Buttons
Location
Displays the user-defined location of the device. The location is entered through
the System Group window; see the Generic SNMP User’s Guide for details.
MAC Address
Displays the manufacturer-set MAC address of the channel through which
SPECTRUM Element Manager is communicating with the device. MAC
addresses are factory-set and cannot be altered.
The button that appears at the bottom of most windows allows you to
exit a window and terminate any unsaved changes you have made. You may also
have to use this button to close a window after you have made any necessary
changes and set them by clicking on an , , or button.
An , , or button appears in windows that have
configurable values; it allows you to confirm and SET changes you have made to
those values. In some windows, you may have to use this button to confirm each
individual set; in other windows, you can set several values at once and confirm
the sets with one click on the button.
The button brings up a Help text box with information specific to the
current window. For more information concerning Help buttons, see Getting
Help, below.
The command buttons, for example , call up a menu listing the windows,
screens, or commands available for that topic.
Any menu topic followed by ... (three dots) — for example Statistics... — calls up
a window or screen associated with that topic.
Getting Help
This section describes two different methods of getting help for questions or
concerns you may have while using SPECTRUM Element Manager.
Using On-line Help
You can use the buttons to obtain information specific to a particular
window. When you click on a Help button, a window will appear which contains
context-sensitive on-screen documentation that will assist you in the use of the
windows and their associated command and menu options. Note that if a Help
button is grayed out, on-line help has not yet been implemented for the associated
window.
1-4 Getting Help
Page 12

From the Help menu accessed from the Module View window menu bar, you can
access on-line Help specific to the Module View window, as well as bring up the
Chassis Manager window for reference. Refer to Chapter 2 for information on the
Module View and Chassis Manager windows.
All of the SPECTRUM Element Manager help windows use the standard Microsoft
NOTE
Windows help facility; if you are unfamiliar with this feature of Windows, you can select
Help —>How to Use Help from the console window menu bar, or consult your
Microsoft Windows User’s Guide.
Getting Help from the Cabletron Systems Global Call Center
If you need technical support related to SPECTRUM Element Manager, or if you
have any questions, comments, or suggestions related to this manual or any of
our products, please feel free to contact the Cabletron Systems Global Call Center
via one of the following methods:
By phone: Monday through Friday between 8 AM and 8 PM
Eastern Standard Time at (603) 332-9400.
Introduction
By mail: Cabletron Systems, Inc.
PO Box 5005
Rochester, NH 03866-5005
By Internet mail: support@ctron.com
FTP: ftp.ctron.com (134.141.197.25)
Login anonymous
Password your email address
By BBS: (603) 335-3358
Modem Setting 8N1: 8 data bits, 1 stop bit, No parity
For additional information about Cabletron Systems products, visit our
World Wide Web site: http://www.cabletron.com/. For technical support,
select Service and Support.
Getting Help 1-5
Page 13

Introduction
Firmware V ersions Supported
SPECTRUM Element Manager support for the 9A128-01 module has been tested
against firmware versions up to 2.10.13. If you have an earlier version of firmware
and experience problems, contact Cabletron Systems Global Call Center for
upgrade information.
As a general rule, firmware versions for new products are liable to change rapidly; contact
NOTE
Cabletron Systems Global Call Center for upgrade information for the latest customer
release of firmware.
1-6 Firmware V ersions Supported
Page 14

Chapter 2
The 9A128-01 Module View
Information displayed in the Module View window; the Chassis Manager window; hub management
functions
The 9A128-01 Module View window is the main screen that immediately informs
you of the current configuration of your 9A128-01 via a graphical display of the
two bridge ports and the FDDI A and B ports which provide connectivity to the
FNB backplane. (The Module View does not currently provide a display which
reflects the status of the front panel ATM ports.) The Module View window serves
as a single point of access to all other 9A128-01 windows and screens, which are
discussed at length in the following chapters.
NOTE
To access the 9A128-01 Module View window, you can either double-click on the
appropriate device icon (as illustrated in Figure 2-1, below), or use the following
menu or toolbar options:
Figure 2-1. 9A128-01 Icon
1. Using the mouse, click on the 9A128-01 icon to be monitored. The icon will be
highlighted. (Note that all MMAC-Plus devices share an icon.)
2. Select M
from the toolbar; the Module View window will appear.
To model your 9A128-01 ATM Access Module as an individual device, you must select
Chassis Manager mode from the window that appears when you launch the icon. Refer to
your Using MMAC-Plus Remote Management Guide for information on how to
access the module view from the MMAC-Plus Chassis View.
anage —> Node from the primary window menu bar, or select
2-1
Page 15
The 9A128-01 Module View
Viewing Module Information
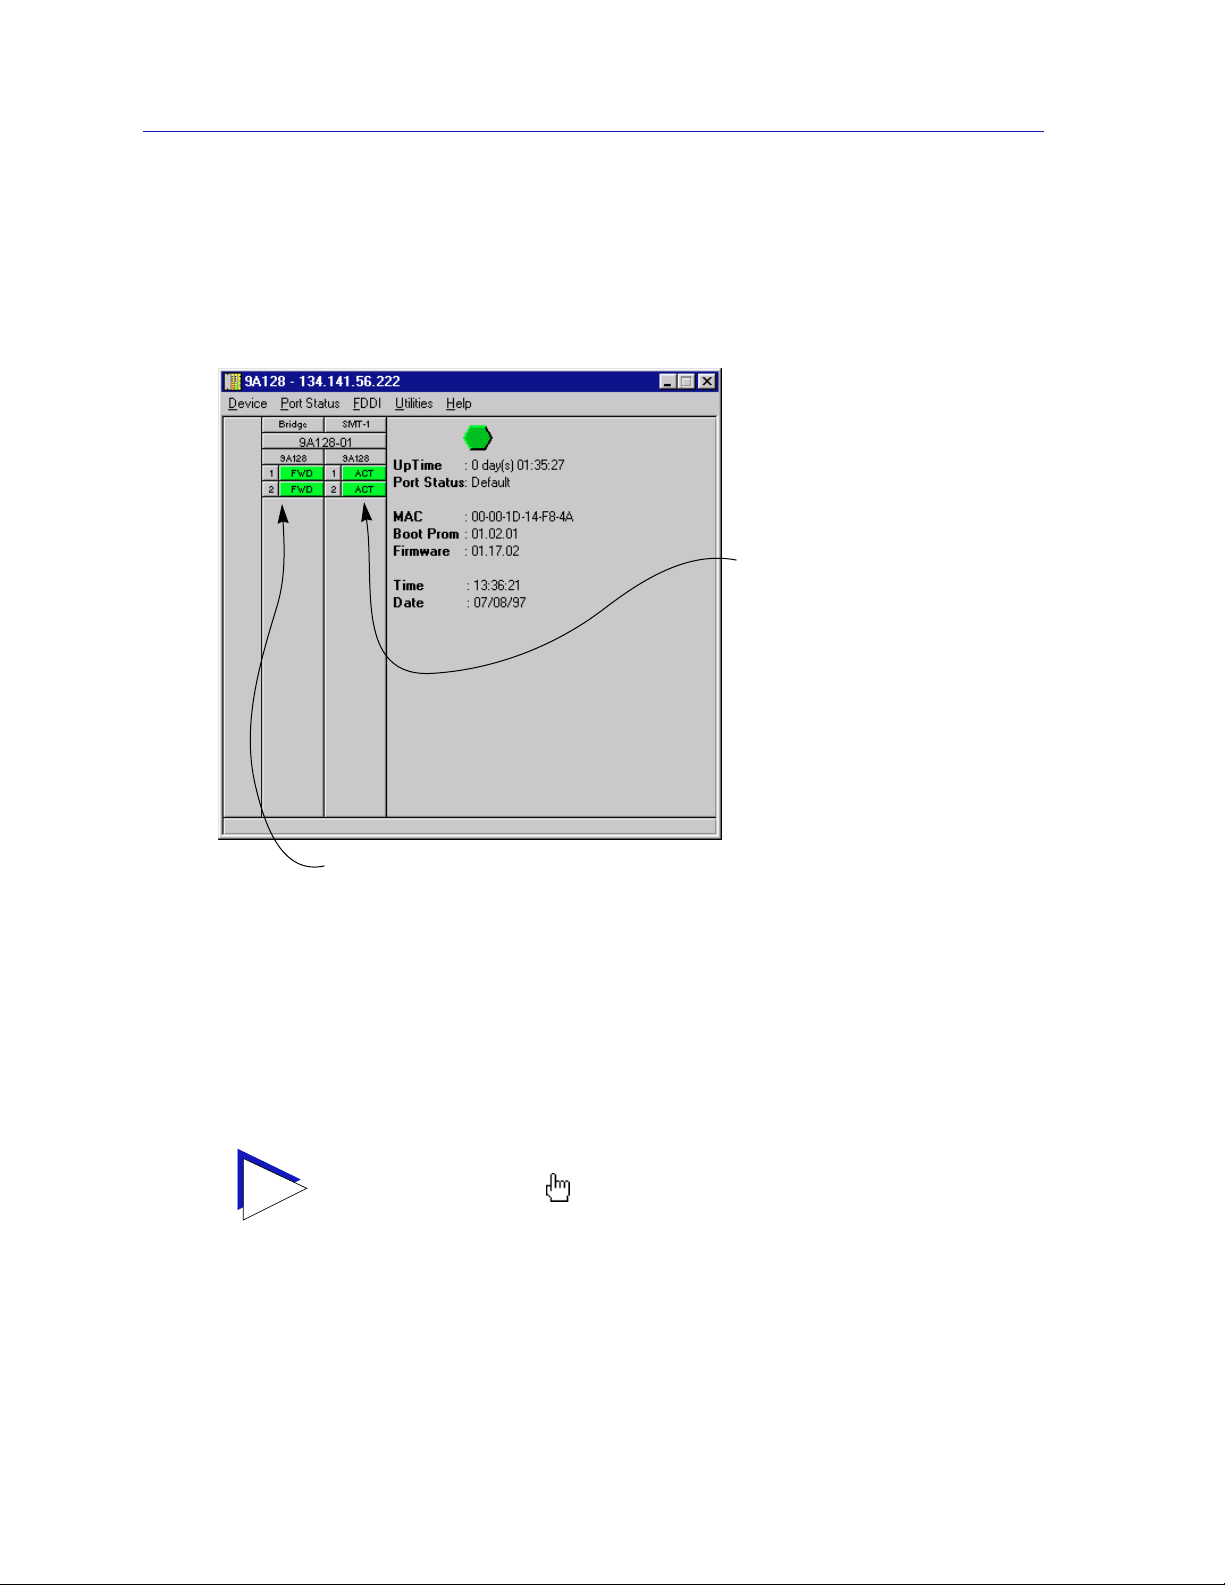
The 9A128-01 Module View window (Figure 2-2) provides a graphic
representation of the 9A128-01, including a color-coded port display which
immediately informs you of the current configuration and status of each port.
FDDI Port Status:
Ports 1 and 2 are the A
and B port connections
to the FNB FDDI
backplane.
Bridge Port Status:
Port 1 = FDDI Backplane interface
Port 2 = Front Panel ATM interface
Figure 2-2. 9A128-01 Module View Window
By clicking in designated areas of the device graphical display (as detailed later in
this chapter), or by using the menu bar at the top of the Module View window,
you can access all of the menus that lead to more detailed device and port
information.
When you move the mouse cursor over a management “hot spot,” the cursor icon will
TIP
change into a hand symbol to indicate that clicking in the current location will bring
up a management option.
Front Panel Information
In addition to the main interface display, the Module View window provides the
following device information:
2-2 Viewing Module Information
Page 16

The 9A128-01 Module View
IP
The Module View window title displays the device’s IP (Internet Protocol)
Address; this will be the IP address you have used to create the 9A128-01 module
in the Chassis Setup window, or the IP address used to create the device icon. IP
addresses are assigned via Local Management, and cannot be changed via
SPECTRUM Element Manager. Note that although each interface on the 9A128-01
module has its own MAC, or physical, address, only a single IP address is
assigned.
Connection Status
This color-coded area indicates the current state of communication between
SPECTRUM Element Manager and the 9A128-01.
• Green indicates the 9A128-01 is responding to device polls (valid connection).
• Magenta indicates that the 9A128-01 is in a temporary stand-by mode while it
responds to a physical change in the hub (a board is inserted or removed or a
board’s FNB connection has been reconfigured); note that board and port
menus are inactive during this stand-by state.
• Blue indicates an unknown contact status – polling has not yet been
established with the 9A128-01.
• Red indicates the 9A128-01 is not responding to device polls (device is off line,
or device polling has failed across the network for some other reason).
UpTime
The amount of time, in a days hh:mm:ss format, that the 9A128-01 has been
running since the last start-up.
Port Status
Indicates the Port Status display selection currently in effect for the FDDI port
display. The default port status view is connection status; if you have not changed
the port status selection since launching the Module View window, this field will
display Default. For more information about changing the port status display, see
Selecting a Port Status View on page 2-9.
MAC
The physical layer address assigned to the interface through which SPECTRUM
Element Manager is communicating with the device. Note that each interface on
the 9A128-01 module has its own MAC address; these addresses are hard-coded
in the device, and are not configurable.
Boot Prom
The revision of BOOT PROM installed in the 9A128-01.
Firmware
The revision of device firmware stored in the 9A128-01’s FLASH PROMs.
Viewing Module Information 2-3
Page 17

The 9A128-01 Module View
Time
The current time, in a 24-hour hh:mm:ss format, set in the 9A128-01’s internal
clock.
Date
The current date, in an mm/dd/yy format, set in the 9A128-01’s internal clock.
You can set the date and time by using the Edit Device Date and Edit Device Time
NOTE
options on the Device menu; see Setting Device Date and Time, page 2-20, for details.
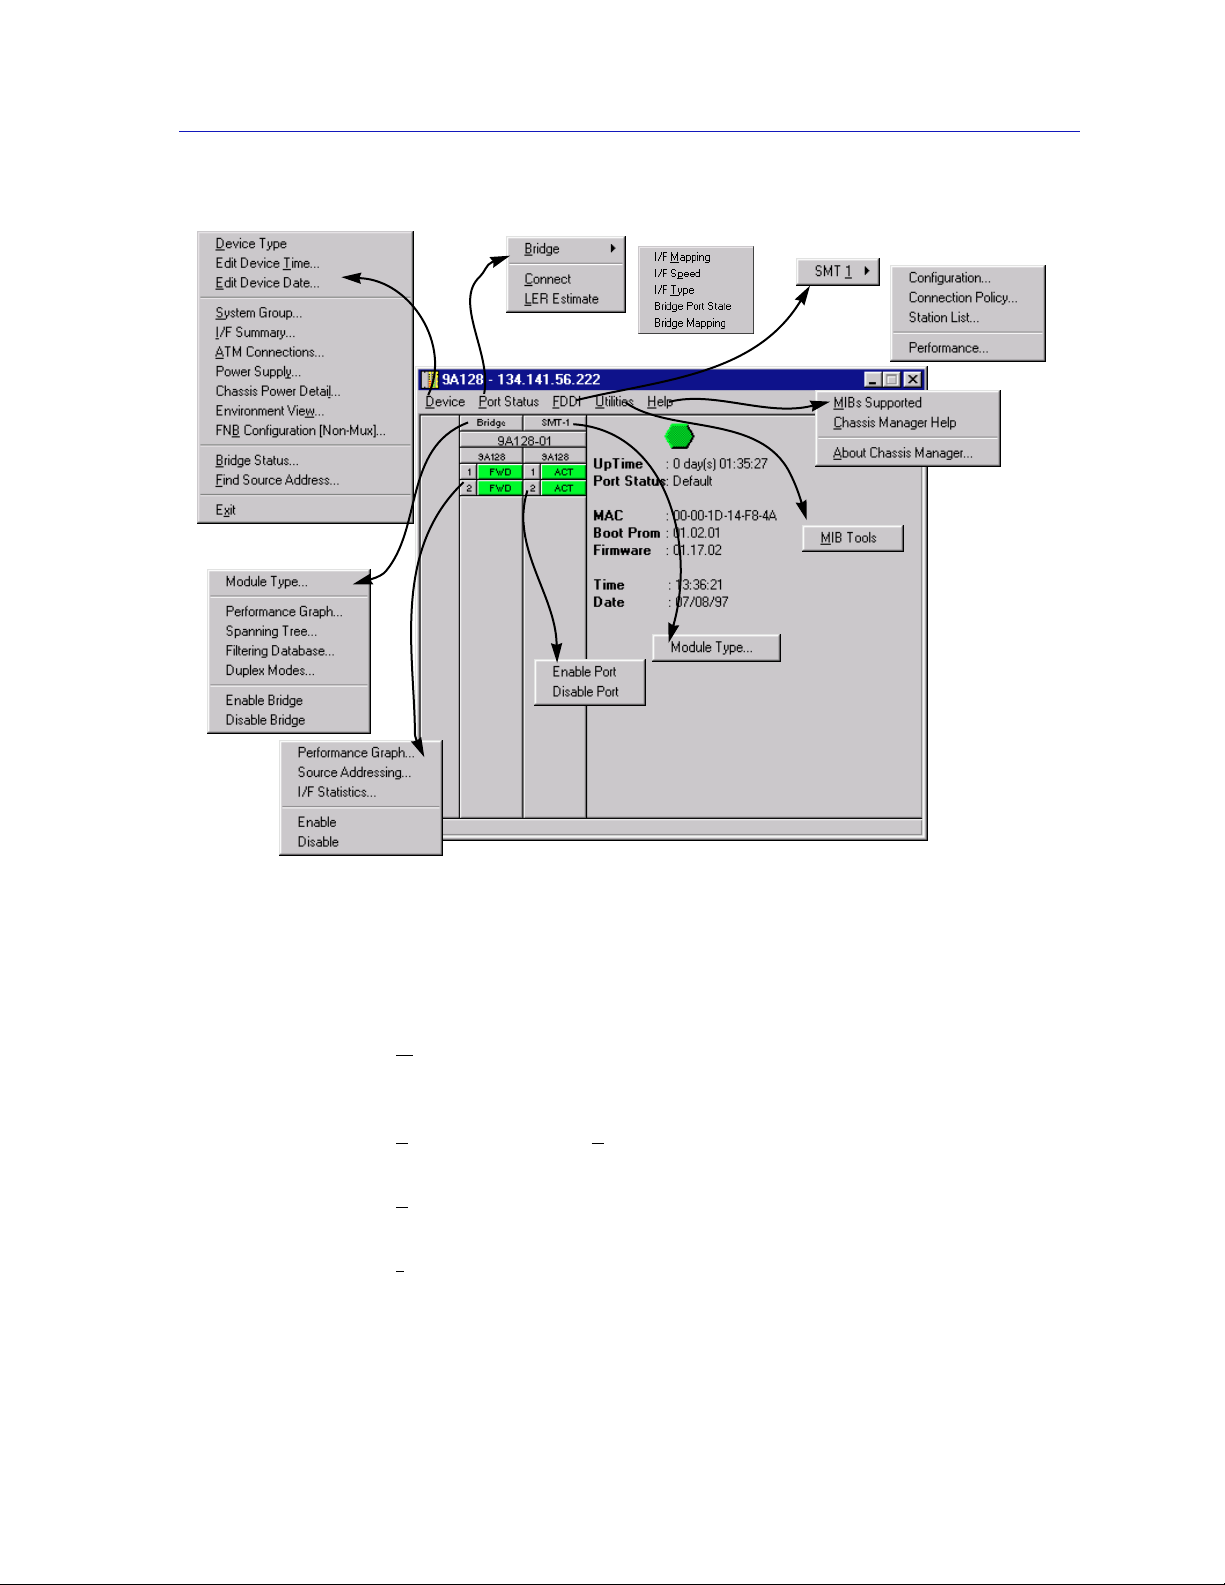
Menu Structure
By clicking on various areas of the 9A128-01 Module View display, you can access
menus which provide access to FDDI, ATM, MMAC-Plus chassis and bridging
configuration and performance information, as well as utility applications and
general device management functions. The following illustration displays the
menu structure and indicates how to use the mouse to access the various menus:
2-4 Viewing Module Information
Page 18
The 9A128-01 Module View
Figure 2-3. 9A128-01 Module View Menu Structure
The Device Menu
From the Device Menu at the Module View window menu bar, you can access the
following selections:
• Device Type..., which displays a window containing a description of the
device being modeled: 9A128-01, ATM/FDDI Bridge, with 1 ATM and 1 FNB
connection
• Edit Device Time and Edit Device Date, which allow you to set the 9A128-01’s
internal clock.
• System Group..., which allows you to manage the 9A128-01 via SNMP MIB II.
Refer to the Generic SNMP User’s Guide for further information.
• I/F Summary, which lets you view statistics (displayed both graphically and
numerically) for the traffic processed by each network interface on your
device, and provides access to some SNMP MIB-II windows. See Viewing I/F
Summary Information, page 2-14, for details.
Viewing Module Information 2-5
Page 19

The 9A128-01 Module View
• ATM Connections, which launches the window that allows you to view and
configure Permanent Virtual Circuits (PVCs) for the 9A128-01’s front panel
ATM interfaces. For more information about configuring PVCs, see Chapter 3,
ATM Configuration.
The next four menu options will appear depending on the configuration and services
NOTE
available in the MMAC-Plus chassis that this module is inserted within; for more
information on management operations directly related to the monitoring and control of
the MMAC-Plus Chassis, see the Cabletron Systems Using MMAC-Plus Remote
Management Guide.
• Power Supply... which launches the Power Supply window that displays
information about each power supply and it’s associated cooling fan in your
MMAC-Plus chassis. You can also control the operation of the cooling fan from
this window; see the Cabletron Systems Using MMAC-Plus Remote
Management Guide for more information.
• Chassis Power Detail
... which launches the Chassis Power Detail window that
displays information about the power subsystem of the MMAC-Plus chassis;
see the Cabletron Systems Using MMAC-Plus Remote Management Guide for
more information.
• Environment View... which launches the Environment View window which
provides information of the environmental conditions associated with the
modules in the MMAC-Plus chassis; see the Cabletron Systems Using
MMAC-Plus Remote Management Guide for more information.
• FNB Configuration (Non-Mux)... which launches the FNB Configuration
window that displays and allows you to configure your FNB’s current
configuration; see the Cabletron Systems Using MMAC-Plus Remote
Management Guide for more information.
• Bridge Status..., which opens a window that provides an overview of bridging
information for each port, and allows you to access all other bridge-related
options. Refer to Chapter 5, Bridging, for more information.
• Find Source Address..., which opens a window that allows you to search the
9A128-01’s 802.1d Filtering Database to determine which bridging interface a
specified source MAC address is communicating through. If the MAC address
is detected as communicating through the bridge, the port display will flash to
indicate the bridge interface of interest.
• Exit, which closes the 9A128-01 Module View window.
The Port Status Menu
The Port Status menu allows you to select the status information that will be
displayed in the Bridge and FDDI port text boxes in the Module View window:
• Bridge allows you to select one of five status type displays for the bridge ports:
I/F Mapping, I/F Speed, I/F Type, Bridge Port State, or Bridge Mapping.
2-6 Viewing Module Information
Page 20

NOTE
The 9A128-01 Module View
• Connect will display the each FDDI port’s connection status.
• LER Estimate will display the cumulative long term average of the bit error
rate for each FDDI port, which represents the quality of the physical link.
When you select the LER Estimate port status display, this port status display will be
reflected in both the bridge and FDDI ports. The FDDI ports will display the LER
Estimate while the bridge ports will display the Percent Errors.
For more information on the bridge and FDDI port display options available via
this menu, see Selecting a Port Status View, page 2-9.
The FDDI Menu
The FDDI menu provides the following options, which allow you to monitor and
manage the 9A128-01’s connection to the FNB FDDI backplane:
• Configuration
• Connection Policy
• Station List
• Performance
Refer to Chapter 4, FDDI Management, for details on these options.
The Utilities Menu
The Utilities menu provides access to the MIBTools utility, which provides direct
access to the 9A128-01’s MIB information. The MIB Tools selection is also
available from the Tools menu at the top of the SPECTRUM Element Manager
primary window; refer to your Tools Guide, included in this package, for a
thorough explanation of the MIB Tools utility.
The Help Menu
The Help Menu has three selections:
• M
IBs Supported, which brings up the Chassis Manager window, described on
page 2-12.
• Chassis Manager Help, which brings up a help window with information
specifically related to using the Chassis Manager and Module View windows.
• About Chassis Manager..., which brings up a version window for the Chassis
Manager application in use.
The Board Menus
The Board menu labeled Bridge provides access to most of the available
bridging-related selections, which are also available from the Bridge Status
window:
Viewing Module Information 2-7
Page 21

The 9A128-01 Module View
• Module Type..., which brings up a window containing a description of the
9A128-01 board; see Viewing Hardware Types, page 2-13.
• Performance Graph..., which visually displays performance between all
bridging ports on the 9A128-01; see Chapter 5, Bridging.
• Spanning Tree..., which allows you to set bridge parameters when it is
operating using the Spanning Tree Algorithm (STA) – the method that bridges
use to decide the controlling (root) bridge when two or more bridges are
installed in parallel; see Chapter 5, Bridging, for more information.
• Filtering Database..., which allows you to monitor and manage bridge
forwarding and filtering across each port of the 9A128-01; see Chapter 5 for
details.
• Duplex Modes..., which allows you to set Duplex Mode operation for
standard Ethernet interfaces on your 2E42; see Chapter 5, Bridging.
• Enable/Disable Bridge, which enables or disables bridging across the entire
9A128-01.
The menu accessed from the FNB label provides only the Module Type option.
The Port Menus
The port menu selections vary according to the port’s functionality. The menu for
the two bridging ports offers the following selections:
• Performance Graph..., which brings up windows that visually display
bridging performance at the selected port; see Chapter 5, Bridging, for details.
• Source Addressing..., which launches a window displaying the MAC
addresses of all devices communicating through the selected bridging
interface; see Chapter 5, Bridging, for details.
• I/F Statistics..., which launches a Statistics window, which displays interface
statistics for the port; see Chapter 5, Bridging for details.
• Enable/Disable, which administratively turns the selected bridging port on or
off; see Enabling and Disabling Ports, page 2-21, for more information.
The FDDI port menus offer only two selections: Enable Port, and Disable Port.
Note that you can enable and disable the A and B ports separately, if you wish;
disabling only one of the pair, however, will cause a wrap condition.
Port Status Displays
When you open the Module View, each bridge port on the 9A128-01 will by
default display the bridge port state (defined below); to change the bridge port
status display, select the Bridge option on the Port Status menu, and drag right to
select one of the available bridge port status display options; as described below.
2-8 Viewing Module Information
Page 22

Initially, each FDDI port on the 9A128-01 will by default display its current
connection status (defined below); to change this status display, select the
Connect or LER Estimate option on the Port Status menu, as described in the
following section. Note that the status display of the bridge ports will remain the
same when you change the port status display of the FDDI Ports to Connect;
however, when you change the port status display of the FDDI Ports to LER
Estimate, the bridge ports will display Percent Errors.
Selecting a Port Status View
To change the status view of your ports:
1. Click on Port Status on the menu bar at the top of the Module View window; a
menu will appear.
2. Drag down to Bridge, and to the right to select the bridge port status
information you want to display. The bridge port text boxes will display the
appropriate status information.
and/or
The 9A128-01 Module View
Drag down to select the FDDI port status information you want to display. The
FDDI port text boxes will display the appropriate status information.
Bridge Port Status Displays
You can choose from 5 different bridge port display options:
I/F Mapping
If you choose the I/F M
number (ifIndex) associated with each bridge port on the 9A128-01 module.
I/F Speed
If you choose the I/F Speed mode, the interface boxes will display the bandwidth
of each individual bridge port on the 9A128-01 module; e.g., 100 Mbits/sec.
I/F Type
If you choose the I/F Type mode, the interface boxes will display the interface
type of each bridge port on the 9A128-01 module; e.g., Eth (Ethernet).
The Bridge Port State and Bridge Mapping status modes will not be supported for devices
NOTE
which have been configured for SecureFast switching.
Firmware versions 2.10.13 and earlier do not support the ability to select SecureFast
switching; if you have a later version of firmware, check your hardware manual to see if
your version of firmware supports this feature. The toggle from traditional bridging to
SecureFast switching is performed via Local Management; see your Local Management
documentation for details.
apping mode, the interface boxes will display the interface
Viewing Module Information 2-9
Page 23

The 9A128-01 Module View
Bridge Port State
If you choose the Bridge Port State mode, a bridge port is considered:
• FWD (Forwarding) if the port is on-line and forwarding packets across the
9A128-01 from one network segment to another.
• DIS (Disabled) if bridging at the port has been disabled by management; no
traffic can be received or forwarded on this port, including configuration
information for the bridged topology.
• LRN (Learning) if the Forwarding database is being created, or the Spanning
Tree Algorithm is being executed because of a network topology change. The
port is monitoring network traffic, and learning network addresses.
• LIS (Listening) if the port is not adding information to the filtering database. It
is monitoring Bridge Protocol Data Unit (BPDU) traffic while preparing to
move to the forwarding state.
• BLK (Blocking) if the port is on-line, but filtering traffic from going across the
9A128-01 from one network segment to another. Bridge topology information
will be forwarded by the port.
• BRK (Broken) if the physical interface has malfunctioned.
Bridge Mapping
If you have selected the Bridge Mapping status mode, the port display will alter
to show the physical interface index (ifIndex) associated with each front panel
bridge port.
Bridge Port Status Color Codes
The Bridge Port Status Display options will use the following color code,
regardless of which bridge port status option is selected: green = forwarding,
blue = disabled, magenta = learning and listening, orange = blocking, and
red = broken.
The FDDI Port Status Displays
When you open the Module View, each FDDI port on the 9A128-01 will by default
display its current connection status (defined below); to change this status
display, select one of the options on the Port Status menu, as described in the
previous section.
2-10 Viewing Module Information
Page 24

The 9A128-01 Module View
FDDI port status view options are:
Connection State
The Connection State port display form indicates the port’s connection status:
• CON (connecting): the port is trying to establish a link, but has not yet been
successful. Ports which are not connected and which have not been disabled
by management will display this status.
• ACT (active): the port has been enabled by management and has successfully
established a link.
• SBY (standby): the port has a physical link, but the SMT Connection Policy is
prohibiting a logical connection to the ring because the attempted connection
is illegal. FDDI protocol always forbids connecting two master ports; all other
connections are theoretically legal, although some are not desirable. You can
view the SMT Connection Policy by selecting the SMT Connection Policy
option from the FDDI menu; for more information, see Chapter 4, FDDI
Management.
• DIS (disabled): the port has been disabled by management; note that this
status does not indicate whether or not there is a physical link connected to the
port.
LER Estimate
The Link Error Rate (LER) Estimate port display form displays a cumulative long
term average of the bit error rate, which represents the quality of the physical link.
It is computed when the port is connected and every 10 seconds thereafter. The
value of the LER Estimate can range from 10
-4
to 10
-15
, but it is always displayed
as the absolute value of the exponent; for example, if the port’s LER Estimate is
computed to be 10-5, the value displayed in the Port Status box will be 5.0, which
represents an actual rate of 1,250 bit errors per second. The lower LER Estimate
numbers represent the highest bit error rates, as summarized in the figure below.
.000000125
.00000125
.0000125
.000125
per
.00125
.0125
.125
1.25
12.5
125
1250
12500
456789101112131415
Reported LER Estimate
Bit Errors
Second
Figure 2-4. LER Estimate Values
Viewing Module Information 2-11
Page 25

The 9A128-01 Module View
The bridge ports will display Percent Errors when the LER Estimate port status display
NOTE
is selected. Percent Errors are calculated by the following formula: (ErrorPkts
/(ErrorPkts+ValidPkts))*100, where Error Pkts = IfInErrors + IfOutErrors +
ifInDiscards + ifOutDiscards + ifInUnknownProtos and
ValidPkts = ifInUcastPkts + ifOutUcastPkts + ifInNUcastPkts + ifOutNUcastPkts.
FDDI Port Status Color Codes
FDDI port status color codes always reflect the port’s connection status, even
when the LER Estimate port display form has been selected. Under that color
coding scheme:
• CON (Connecting) = yellow
• ACT (Active) = green
• SBY (Standby) = red
• DIS (Disabled) = red
The Chassis Manager Window
Like most networking devices, Cabletron’s devices draw their functionality from
a collection of proprietary MIBs and IETF RFCs. In addition, Cabletron’s newer
intelligent devices – like the 9A128-01 – organize their MIB data into a series of
“components.” A MIB component is a logical grouping of MIB data, and each
group controls a defined set of objects. For example, 9A128-01 bridging
information is organized into its own component; FDDI and ATM information
resides in two separate components, one for each of the 9A128-01’s interfaces.
Note, too, that there is no one-to-one correspondence between MIBs and MIB
components; a single MIB component might contain objects from several different
proprietary MIBs and RFCs.
The Chassis Manager window, Figure 2-5, is a read-only window that displays
the MIBs and the MIB components — and, therefore, the functionality —
supported by the currently monitored device.
To view the Chassis Manager window:
1. Click on Help on the far right of the menu bar at the top of the chassis
manager window.
2. Drag down to MIBs Supported, and release.
2-12 Viewing Module Information
Page 26
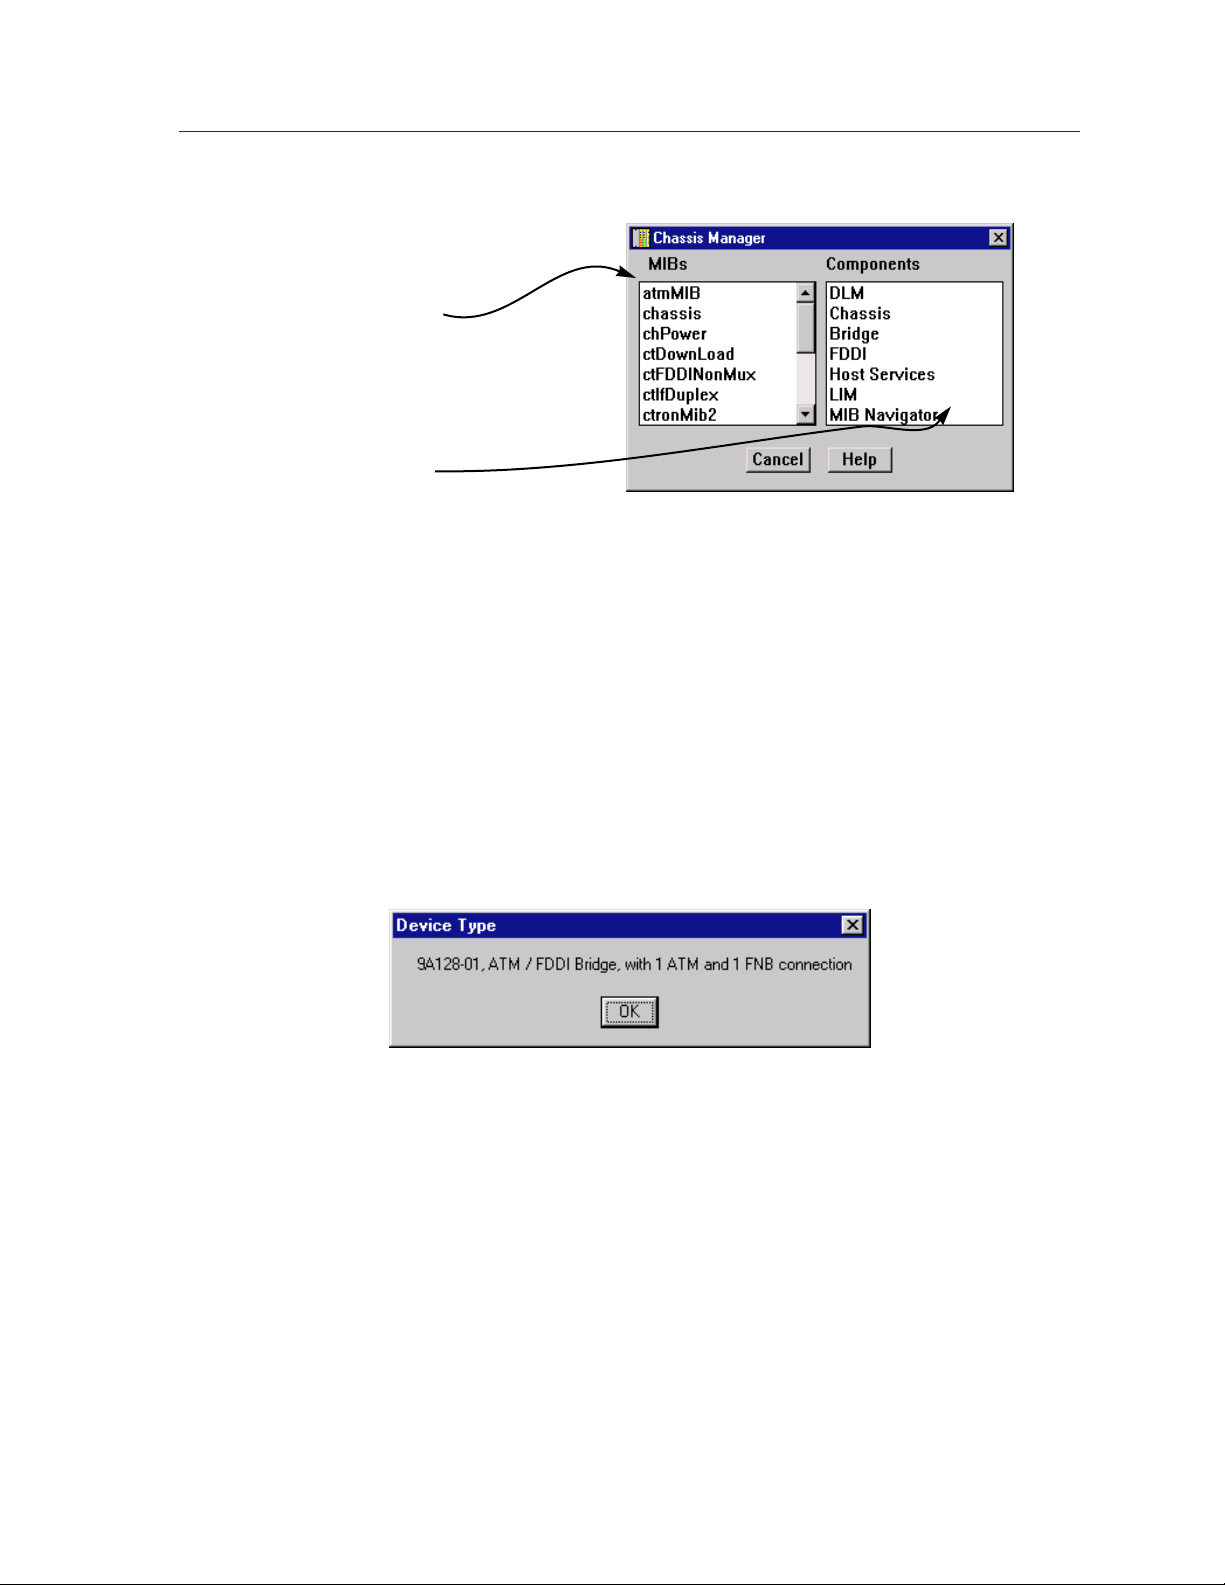
The MIBs which provide the
9A128-01’s functionality —
both proprietary MIBs and IETF
RFCs — are listed here
MIB Components are listed here;
remember, there’s no one-to-one
correspondence between MIBs
and MIB Components
Figure 2-5. Chassis Manager Window
Viewing Hardware Types
In addition to the graphical displays described above, menu options provide
specific information about the physical characteristics of ports in the 9A128-01, as
well as information about the 9A128-01 module itself.
The 9A128-01 Module View
Device T ype
Module Type
Choosing the Device Type option on the Device menu brings up a window that
describes the management device being modeled:
Figure 2-6. Device Type Window
From the Board menus labeled Bridge and FNB on the 9A128-01 Module View
window, you can view a description of the Module type: for the 9A128-01, the
same information provided in the Device Type window.
To view the Module type:
1. Click on the Bridge or FNB Board label. The Board menu will appear.
2. Drag down to Module Type.... The Module Type text box, Figure 2-7, will
appear.
Viewing Module Information 2-13
Page 27

The 9A128-01 Module View
Figure 2-7. Module Type Window
Viewing I/F Summary Information
The I/F Summary option available from the Device menu lets you view statistics
(displayed both graphically and numerically) for the traffic processed by each
network interface on your device. The window also provides access to a detailed
statistics window that breaks down Transmit and Receive traffic for each
interface.
To access the I/F Summary window:
1. From the Module View, click on the Device option from the menu bar.
2. Drag down to I/F Summary and release. The I/F Summary window,
Figure 2-8, will appear.
Figure 2-8. I/F Summary Window
The I/F Summary window provides a variety of descriptive information about
each interface on your device, as well as a bar graph and statistics which display
each interface’s performance.
The following descriptive information is provided for each interface.
2-14 Viewing Module Information
Page 28

The 9A128-01 Module View
UpTime
The UpTime field lists the amount of time, in a days, hh:mm:ss format, that the
device has been running since the last start-up.
Index
The index value assigned to each interface on the device.
Type
The type of the interface, distinguished by the physical/link protocol(s) running
immediately below the network layer. Possible values are sdlc (for the
MMAC-Plus SMB 1 proprietary management backplane), ethernet-csmacd (for
the MMAC-Plus SMB 10 ethernet management backplane), fddi (for the FDDI
FNB interface), and atm (for the front panel ATM connection).
Description
A text description of the interface: Ctron SMB (for the MMAC-Plus SMB 1 and
SMB 10 management backplane interfaces); FDDI (for the FDDI FNB interface),
or AT M.
P. Sta
Displays the current physical status — or operational state — of the interface:
Online or Offline.
L. Sta
Displays the current logical status — or administrative state — of the interface:
Up or Down.
Interface Performance Statistics/Bar Graphs
The statistical values and accompanying bar graphs to the right of the interface
description fields provide a quick summary of interface performance. You can
select the statistical value you want to display and the units in which you want
those values displayed by using the two menu buttons directly above the graphs,
as follows:
1. Click on the right menu button to select the unit in which you wish to display
the selected statistic: , , or .
2. Once you have selected the base units, click on the left menu button to
specify the statistic you’d like to display. (The options from this menu will vary
depending on the base units you have selected.)
After you select a new display mode, the statistics and graphs will refresh to
reflect the current choice, as described below.
Viewing Module Information 2-15
Page 29

The 9A128-01 Module View
Bar graphs are only available when Load is the selected base unit.
NOTE
Raw Counts
The total count of network traffic received or transmitted on the indicated
interface since device counters were last reset. Raw counts are provided for the
following parameters.
In Octets Octets received on the interface, including framing
In Packets Packets (both unicast and non-unicast) received by the
In Discards Packets received by the device interface that were
characters.
device interface and delivered to a higher-layer protocol.
discarded even though no errors prevented them from
being delivered to a higher layer protocol (e.g., to free up
buffer space in the device).
In Errors Packets received by the device interface that contained
errors that prevented them from being delivered to a
higher-layer protocol.
In Unknown Packets received by the device interface that were
discarded because of an unknown or unsupported
protocol.
Out Octets Octets transmitted by the interface, including framing
characters.
Out Packets Packets transmitted, at the request of a higher level
protocol, by the device interface to a subnetwork address
(both unicast and non-unicast).
Out Discards Outbound packets that were discarded by the device
interface even though no errors were detected that
would prevent them from being transmitted. A possible
reason for discard would be to free up buffer space in the
device.
Out Errors Outbound packets that could not be transmitted by the
device interface because they contained errors.
Load
The number of bytes processed by the indicated interface during the last poll
interval in comparison to the theoretical maximum load for that interface type
(1 Mbps for the SMB 1 management backplane; 10 Mbps for the SMB 10 ethernet
2-16 Viewing Module Information
Page 30

management backplane; 100 Mbps for FDDI; or 155 Mbps for ATM). Load is
further defined by the following parameters.
In Octets The number of bytes received by this interface, expressed
Out Octets The number of bytes transmitted by this interface,
Rate
The count for the selected statistic during the last poll interval. The available
parameters are the same as those provided for Raw Counts. Refer to the Raw
Counts section, above, for a complete description of each parameter.
Interface Statistics Window
The Interface Statistics window (Figure 2-9) provides MIB-II interface statistical
information — including counts for both transmit and receive packets, and error
and buffering information — for each available port interface. Color-coded pie
charts also let you graphically view statistics for both received and transmitted
Unicast, Non-Unicast, Discarded, and Error packets.
The 9A128-01 Module View
as a percentage of the theoretical maximum load.
expressed as a percentage of the theoretical maximum
load.
To open the Interface Statistics window:
1. In the I/F Summary window, click to select the interface for which you’d like to
view more detailed statistics.
2. Click on . The appropriate Interface Statistics window, Figure 2-9, will
appear.
Figure 2-9. Interface Statistics Window
Viewing Module Information 2-17
Page 31

The 9A128-01 Module View
Three informational fields appear in the upper portion of the window:
Description
Displays the interface description for the currently selected port: Ctron SMB 1,
Ctron SMB 10, FDDI, or ATM.
Address
Displays the MAC (physical) address of the selected port.
Type
Displays the interface type of the selected port: sdlc (for SMB 1), ethernet-csmacd
(for SMB 2), fddi, or atm.
The lower portion of the window provides the following transmit and receive
statistics; note that the first four statistics are also graphically displayed in the pie
charts.
Unicast
Displays the number of packets transmitted to or received from this interface that
had a single, unique destination address. These statistics are displayed in the pie
chart, color-coded green.
Non-Unicast
Displays the number of packets transmitted to or received from this interface that
had a destination address that is recognized by more than one device on the
network segment. The non-unicast field includes a count of broadcast packets —
those that are recognized by all devices on a segment. These statistics are
displayed in the pie chart, color-coded dark blue.
Discarded
Displays the number of packets which were discarded even though they
contained no errors that would prevent transmission. Good packets are typically
discarded to free up buffer space when the network becomes very busy; if this is
occurring routinely, it usually means that network traffic is overwhelming the
device. To solve this problem, you may need to re-configure your bridging
parameters, or perhaps re-configure you network to add additional bridges or
switches. Consult the Cabletron Systems Network Troubleshooting Guide for
more information.
These statistics are displayed in the pie chart, color-coded magenta.
Error
Displays the number of packets received or transmitted that contained errors.
These statistics are displayed in the pie chart, color-coded red.
Unknown Protocol (Received only)
Displays the number of packets received which were discarded because they were
created under an unknown or unsupported protocol.
2-18 Viewing Module Information
Page 32

The 9A128-01 Module View
Packets Received (Received only)
Displays the number of packets received by the selected interface.
Transmit Queue Size (Transmit only)
Displays the number of packets currently queued for transmission from this
interface. The amount of device memory devoted to buffer space, and the traffic
level on the target network, determine how large the output packet queue can
grow before the 9A128-01 will begin to discard packets.
Packets T ransmitted (Transmit only)
Displays the number of packets transmitted by this interface.
Making Sense of Interface Statistics
The statistics available in this window can give you an idea of how an interface is
performing; by using the statistics in a few simple calculations, it’s also possible to
get a sense of an interface’s activity level:
To calculate the percentage of input errors:
Received Errors /Packets Received
To calculate the percentage of output errors:
Transmitted Errors /Packets Transmitted
To calculate the total number of inbound and outbound discards:
Received Discards + Transmitted Discards
To calculate the percentage of inbound packets that were discarded:
Received Discards /Packets Received
To calculate the percentage of outbound packets that were discarded:
Transmit Discards /Packets Transmitted
Using the Find Source Address Feature
You can select the Find Source Address option to discover which bridging
interface a specified source MAC address is communicating through. When you
select the Find Source Address option, a search is made of the 802.1d Bridge
Filtering Database to discover the bridge interface associated with the address
that you specify. If the search is successful, the corresponding interface will flash
in the Module View window. For more information on the Filtering Database and
bridging in general, refer to Chapter 5, Bridging.
Use the Find Source Address option as follows:
1. Click to display the Device menu.
Viewing Module Information 2-19
Page 33

The 9A128-01 Module View
2. Drag to Find Source Address.... The following window will appear.
3. In the text field in the middle of the window, enter a valid MAC address in Hex
format and then click .
If the address is found in the 802.1d Bridge Filtering Database, the port through
which the address is communicating will flash in the front panel Module View
port display.
If the address is not found in the Filtering Database, a separate window will
appear with a “Can’t Find Source Address” message.
Figure 2-10. Find Source Address Window
Managing the Hub
In addition to the performance and configuration information described in the
preceding sections, the Module View also provides you with the tools you need to
configure your hub and keep it operating properly. Hub management functions
include setting device date and time and enabling and disabling ports.
Setting the Device Date and Time
From the Device menu you can select the Edit Device Time and Edit Device Date
options to change the date and time stored in the device’s internal clock.
To edit the device time:
1. Click on Device on the Module View window menu bar to access the Device
menu; drag down to Edit Device Time, and release.
2. The Device Time change window, Figure 2-11, will appear.
2-20 Managing the Hub
Page 34

The 9A128-01 Module View
Figure 2-11. New Time Window
3. Enter the new time in a 24-hour hh:mm:ss format, either by highlighting the
field you wish to change and using the up and down arrow buttons, or by
simply entering the new value in the appropriate field.
4. Click on to save your changes, or on to cancel.
To edit the device date:
1. Click on Device on the Module View window menu bar to access the Device
menu; drag down to Edit Device Date, and release.
2. The Device Date change window, Figure 2-12, will appear.
Figure 2-12. New Date Window
3. Enter the new date in a mm/dd/yy format, either by highlighting the field you
wish to change and using the up and down arrow buttons, or by simply
entering the new value in the appropriate field.
4. Click on to save your changes, or on to cancel.
Enabling and Disabling Ports
Bridge Ports
When you disable a bridge port, you disconnect that port’s network from the
bridge entirely. The port does not forward any packets, nor does it participate in
Spanning Tree operations. Nodes connected to the network can still communicate
with each other, but they can’t communicate with the bridge or with other
Managing the Hub 2-21
Page 35

The 9A128-01 Module View
networks connected to the bridge. When you enable a port, the port moves from
the Disabled state through the Learning and Listening states to the Forwarding
state; bridge port state color codes will change accordingly.
To enable or disable a bridge port:
1. Click on the appropriate Bridge Port to display the bridge port menu.
2. Drag down to Enable to enable the selected port, or to Disable to disable the
port.
For more information about bridging functions and how to determine the current state of
NOTE
each bridge port, see Chapter 5, Bridging.
Module Ports
From the port menus on the two FDDI ports in the 9A128-01 Module View
window, you can enable and disable either port.
NOTE
To enable or disable a port:
1. Click on the desired Port button. The Port menu will appear.
2. Click on Enable Port to enable the port, or Disable Port to disable the port.
Your port will now be enabled or disabled as desired.
You can separately enable and disable the A and B ports which provide the backplane FNB
connection; however, disabling only one of this port pair will cause a wrap condition on
the backplane ring.
2-22 Managing the Hub
Page 36

Chapter 3
ATM Configuration
Viewing connection data; configuring Permanent Virtual Circuits (PVCs); adding and deleting
connection entries
The ATM interfaces provided by the 9A128-01 module provides the connectivity
that allows you to merge ATM network segments with traditional LAN
technologies via the FDDI FNB backplane. Current versions of 9A128-01 firmware
use 802.3 VC-based multiplexing for bridging protocols to move PVC traffic
between the ATM front panel connection and the switching backplane, and
support ATM Forum LAN Emulation; future versions will add support for
Cabletron’s SecureFast Switching.
An ATM network uses two types of virtual channels, or circuits: Switched Virtual
Circuits, or SVCs, and Permanent Virtual Circuits, or PVCs. SVCs are created and
dismantled dynamically on an as-needed basis, and require no management
definition; PVCs, however, must be manually configured. The Current ATM
Connections window provides the means for accomplishing these configurations.
For current firmware versions available for the 9A128-01, you can only view current
NOTE
connections; you will not be allowed to add new connections or modify existing
connections.
Accessing the ATM Connections Window
To access the ATM Connections window from the Module View:
1. Click on Device on the Module View menu bar to access the Device menu.
2. Drag down to ATM Connections..., and release. The Current ATM
Connections window, Figure 3-1, will appear.
3-1
Page 37

ATM Configuration
Due to a firmware
anomaly,
Connection Data will
not be available in
this window for the
9A128. Also, you will
not be able to set any
new connections or
modify any existing
connections from this
window .
Figure 3-1. The Current ATM Connections Window
TIP
NOTE
The Current ATM Connections window provides the following information about
the device’s ATM connections:
Connection Data
The Connection Data fields provide the following information about each ATM
interface available on the device:
I/F Displays the index number assigned to each ATM
interface present on the selected module. The 9A128-01
has a single ATM interface, indexed 4.
The 9A128-01 supports a total of four interfaces. For more detailed information about the
interfaces present on each module and their index number assignment, see Viewing I/F
Summary Information in Chapter 2.
Maximum Connections Displays the maximum number of connections allowed
by current device firmware.
Current Configured Displays the number of Permanent Virtual Circuits, or
PVCs, currently configured.
Connection Data will not be available for the 9A128-01’s ATM interface.
3-2 Accessing the ATM Connections Window
Page 38

ATM Configuration
Settings
The Settings portion of the window contains a list box which displays information
about each of the currently configured PVCs, as well as the fields used to
configure new connections:
I/F The device interface on which the PVC was configured.
VPI Displays the Virtual Path Identifier assigned to the
connection; current versions of 9A128-01firmware allow
values from 0 - 3. Virtual Path Identifiers are used to
group virtual connections, allowing for channel trunking
between ATM switches. Each VPI can be configured to
carry many different channels (designated by VCIs)
between two points.
VCI Displays the Virtual Channel Identifier assigned to the
connection; allowable values are 0 - 1023 for each VPI.
Each assigned VCI must be unique within its defined
VPI: for example, you can assign a VCI of 14 as many as
four times: once with a VPI of 0, once with a VPI of 1, and
so on. Remember, it is the combined VPI and VCI
designations assigned to a channel that creates the
grouping of virtual connections.
NOTE
Encapsulation Type Displays the method used to encapsulate LAN packets
on the selected circuit. Current versions of 9A128-01
firmware use 802.3 VC-based multiplexing for bridging
protocols (designated VC MUX 802.3 Bridged); future
versions will add support for ATM Forum LAN
Emulation and Cabletron’s SecureFast Switching. You
may also see some connections assigned a type of
“other”; these are default connections that cannot be
modified or deleted.
Status Displays the current administrative status of the
connection: enabled or disabled. In current versions of
firmware, all connections are enabled by default, and
cannot be disabled.
UpTime The length of time the selected connection has been
enabled.
You can only view current connections; you will not be allowed to add new connections,
delete existing connections, or modify existing connections, on 9A128-01’s with the
firmware currently supported.
Accessing the ATM Connections Window 3-3
Page 39

ATM Configuration
Selecting the Add button either adds a new connection or modifies an existing
one, using the parameters entered in the fields below the list box. A confirmation
window will appear for both additions and modifications.
Selecting the Delete button deletes the selected connection; a confirmation
window requires that you confirm the deletion.
Selecting Refresh refreshes the connection information displayed in the window.
Configuring Connections
Adding a New Connection
NOTE
To configure new Permanent Virtual Circuits (PVCs), enter the following
information in the text fields which appear just below the settings list box:
Current versions of 9A128-01 firmware do not support the ability to add new
connections, delete existing connections, or modify existing connections.
1. In the I/F text box, click on the down-arrow to the right of the text field, and
drag down to select the interface f or which y ou wish to configure a connection.
All available ATM interfaces will be listed in this menu: index 4 for the
9A128-01.
2. In the VPI text box, enter the Virtual Path Identifier you wish to assign to this
connection. Allo w able values are 0 to 3; remember, the VPI y ou assign will be
used to group virtual connections, allowing for channel trunking between ATM
switches.
3. In the VCI text box, enter the Virtual Channel Identifier you wish to assign to
this connection. Allowable values are 0 to 1023 for each VPI. For example,
you could assign the same channel identifier — say, 25 — as many as four
times: once with a VPI of 0, once with a VPI of 1, and so on. Again, remember
that it is the combination of VPI and VCI that will be used to direct cells
through the intermediate switches between the source and destination.
3-4 Configuring Connections
Page 40

4. In the Encapsulation Type field, click on the down arrow located to the right
of the field, and drag down to select the desired encapsulation type. Current
versions of 9A128-01 firmware use 802.3 VC-based multiplexing for bridging
protocols (designated VC MUX 802.3 Bridged); future versions will add
support for additional encapsulation methods.
Selecting any of the other encapsulation types listed in the field’s menu will cause a “Set
TIP
Failed” error when you attempt to add the new connection.
5. Click to add the new permanent circuit to the ATM interface. The
circuit is automatically enabled, and will remain in place until it is manually
removed.
Deleting a Connection
To delete an existing PVC:
1. In the connections list box, click to select the connection you wish to delete.
ATM Configuration
2. Click on . A confirmation window will appear, listing the parameters
assigned to the connection and asking you to verify that you wish to delete it.
Click on OK to proceed with the deletion, or on Cancel to cancel.
Configuring Connections 3-5
Page 41

ATM Configuration
3-6 Configuring Connections
Page 42

FDDI Management
Configuration; connection policy; station list; and performance
The FDDI menu lets you access windows to view FDDI configuration, connection
policy, station list, and performance with respect to the single Station
Management (SMT) entity which provides each device’s connectivity to the FDDI
FNB backplane.
SMT provides the system management services for the FDDI protocols, including
connection management, node configuration, error recovery, statistics collection,
and management frame encoding. SMT is comprised of various subcomponent
functions, including Connection Management (CMT) and Ring Management
(RMT).
Chapter 4
The 9A128-01 is also encoded with MAC (Media Access Control) protocol layer
information — which you can assign to either FNB 1 or FNB 2. The primary
function of the MAC layer is to deliver frames for stations attached to the ring;
this involves transmitting frames onto the ring, removing frames from the ring,
and repeating frames. Other services provided by the MAC component include
providing attached stations with access to the ring in a fair and structured
manner, providing address recognition for incoming frames, and generating and
verifying frame check sequences. Each ring must have at least one MAC
associated with it for correct operation.
The windows that provide information about the FDDI component of the
9A128-01 module are:
• Configuration — This window displays the current configuration of the
selected module with respect to its SMT entity, and shows the status of the
backplane ring to which it is connected.
• Connection Policy — This window shows the types of connections between
the four FDDI PHY (port) types — A, B, M, and S — that will be allowed by the
SMT entity.
4-1
Page 43

FDDI Management
• Station List — With this window you can see the configuration of the ring on
which the SMT entity resides, including number of nodes, node addresses
(both Canonical and MAC), node class, and current ring topology.
• Performance — This window lets you view the number of frames transmitted
and received on the ring as detected by the selected SMT entity, along with
error and lost frames, and the number of ring initializations.
To use the FDDI menu:
1. Click on FDDI in the Module View; drag down to select SMT 1, and to the right
to reveal the following FDDI menu (Figure 4-1).
Figure 4-1. The FDDI Menu
2. Drag to select the desired option.
Configuration
The Configuration window, Figure 4-2, informs you about the configuration of
the selected module’s FDDI backplane connection and the operating state of the
FDDI ring to which it is connected, and displays parameters relating to ring
initialization.
Figure 4-2. The Configuration Window
4-2 Configuration
Page 44

FDDI Management
MAC State
This field indicates the current state of the selected module’s MAC component.
(The RMT component of SMT monitors MAC operation and takes actions
necessary to aid in achieving an operational ring.) Possible states are:
Not Available There is no MAC on the FDDI ring associated with the
SMT entity, or the selected SMT entity is not attached to
the main ring through the backplane FNB A and B ports.
Ring-Op The ring is functioning normally. While in this state, the
MAC being managed is part of an operational FDDI ring.
Isolated SMT has just initialized RMT or RMT has entered this
state during a path test (trace) after ring beaconing; RMT
is not aware of the ring path or state.
Non-Op The MAC being managed by the selected SMT is
participating in ring recovery; the ring is not operational.
Detect The claim (beacon) process of the FDDI ring protocol has
exceeded one second. There may be a problem on the
ring; any duplicate address conditions are being
detected. In this state, the ring is still alive, but no data is
being transmitted.
Non-Op-Dup The ring is not operational; the address of the MAC
under control of the SMT entity has been found to
duplicate that of another MAC on the ring. The duplicate
address condition prevented ring recovery and
initialization after a claim and beacon process. This state
will not occur unless you are using locally-administered
addresses, as factory-set MAC addresses are guaranteed
to be unique.
Ring-Op-Dup The ring is operational; however, the address of the MAC
under control of the SMT entity has been found to
duplicate that of another MAC on the ring. Corrective
actions will be attempted before the duplicate address
condition causes ring initialization to fail after the claim
and beacon recovery process. Like Non-Op-Dup, this
state will not occur unless you are using
locally-administered addresses.
Directed The beacon process did not complete within 7 seconds.
The selected SMT has directed the controlled MAC to
send beacon frames to notify the other stations that a
serious problem exists on the ring, and a Trace state is
soon to follow.
Trace A problem exists on the ring which could not be
corrected during the beaconing process, and a Trace has
been initiated. During a Trace (or Path Test), the SMT
sends a signal that forces its nearest upstream neighbor
Configuration 4-3
Page 45

FDDI Management
to remove from the ring and conduct a self-test. If the
ring does not recover, each subsequent upstream station
will be forced to remove from the ring and conduct
self-tests until the problem has been corrected. While the
test is being conducted, ring management re-enters the
isolated state.
SMT Version
Displays the version number of the Station Management (SMT) entity. SMT
provides the system management services for the FDDI protocols, including
connection management, node configuration, error recovery, and management
frame encoding. SMT frames have a version ID field that identifies the structure
of the SMT frame Info field. The version number is included in the SMT frame so
that a receiving station can determine whether or not its SMT version is able to
communicate with the SMT version of another station. Knowing the version
number allows the stations to handle version mismatches. Each FDDI station
supports a range of SMT versions. The supported version range is identified
within the ietf-fddi MIB by two smtTable attributes: snmpFddiSMTLoVersionId
and snmpFddiSMTHiVersionId. If a received frame is not within the supported
version range, the frame is discarded.
T -Req. (Requested Target T oken Rotation Time)
The token rotation time bid made by the selected SMT entity during ring
initialization. Each station detecting that the ring must be initialized begins a
claim token process and issues a stream of Claim Frames, which negotiate the
value assigned to the Target Token Rotation Time (TTRT). The information field of
these frames contains the issuing station’s bid for the value of TTRT. Each
claiming station inspects incoming Claim frames (from other issuing stations) and
either continues its own bid (and removes the competing Claim Frame from the
ring) or defers (halts transmission of its own bid and repeats the competing bid)
according to the following hierarchy of arbitration:
• A Claim Frame with the lowest TTRT bid has precedence.
• If the values of TTRT are equal, the frame with the longest source address
(48 vs. 16 bits) has precedence.
• If both TTRT value and source address length are equal, the frame with the
highest address has precedence.
The 9A128-01 is shipped with a T-Req = 83 msec (earlier versions of firmware) or
6 msec (later firmware versions). T-Req is stored within the MIB in units of
nanoseconds (one billionth of a second) rather than milliseconds (one thousandth
of a second); SPECTRUM Element Manager converts nanoseconds to
milliseconds for display purposes. You can use any SNMP Set Request tool to edit
the T-Req value; just remember that you must enter your value in nanoseconds,
rather than milliseconds.
T-Neg. (Negotiated)
The winning time negotiated in the ring initialization sequence.
4-4 Configuration
Page 46

FDDI Management
Concentrator M Ports
This field displays the number of Master (M) ports on the device that are
associated with the selected SMT entity. A Master port is a port that provides a
connection for Single Attachment Station (SAS) devices to the FDDI network. The
9A128-01 does not support M ports, so this field will always display 0.
Concentrator Non-M Ports
This field display the number of non-Master ports (A, B, or S ports) on the device
that are associated with the selected SMT entity. The 9A128-01 supports only two
FDDI ports: the backplane A and B ports that supply each device’s connection to
the FDDI FNB backplane.
Number of MACs
The number of Media Access Control entities present on the device associated
with the selected SMT entity. For the 9A128-01, this number will be 1.
MAC Path
Indicates the configuration of the MAC in respect to the logical ring, as
determined by the Connection Management (CMT) portion of SMT. CMT controls
the establishment of a media attachment to the FDDI network, the connections
with other nodes in the ring, and the internal configuration of the various entities
within a node. CMT provides the link confidence test, and specifies a Link Error
Monitor (LEM) which monitors active links on a per-link basis to ensure that
failing links are detected and, if required, removed from the network. Possible
values are:
• Primary indicates that the MAC is inserted into the primary path of the
currently used FNB ring.
• Secondary indicates that the MAC is inserted into the secondary path of the
currently used FNB ring.
• Local means that the MAC is not inserted into a primary or secondary path of
a dual ring, but may be connected to one or more other nodes. This is not a
valid value for the 9A128-01.
• Isolated means that the MAC has no connection to the ring or other
concentrator ports.
• Not Available means that there is no MAC on the FDDI ring associated with
the selected SMT entity. Again, this state will not occur for the 9A128-01.
• Unknown means that device firmware cannot determine the MAC path.
• ? indicates that SPECTRUM Element Manager cannot determine the MAC
path.
Ring Configuration
The current configuration of the MAC and physical layers of the A and B ports.
Configuration 4-5
Page 47

FDDI Management
Connection Policy
The SMT Connection Policy determines which types of connections are allowed
among the four FDDI port types: A, B, M (Master), and S (Slave). FDDI protocol
forbids Master—>Master connections; all other connection types are legal,
although some are considered to be undesirable.
The Connection Policy window, Figure 4-3, lists potential connection types in a
“Reject X-Y” format, where X represents the FDDI port on the selected module,
and Y represents the attaching node. An X in the checkbox next to a Connection
Policy indicates that the connection has been disallowed.
The following table summarizes the FDDI connection rules:
V —valid connection
X —illegal connection
U —undesirable (but legal) connection; this requires that SMT is notified.
P —valid, but when both A and B are connected to M ports (a dual-homing
Though technically legal under FDDI connection rules, undesirable connections will
!
CAUTION
cause a twisted or wrapped ring.
Figure 4-3. The Connection Policy Window
Table 4-1. FDDI Connection Rules
ABSM
AV, U V V, U V, P
B V V, U V, U V, P
S V, U V, U V V
MVVVX
configuration), only the B connection is used.
4-6 Connection Policy
Page 48

TIP
FDDI Management
Each device has its own connection policy; however, when two devices attempt to
connect, their combined established connection policies dictate the connections
that will be allowed. In an attempted connection between two nodes, the most
lenient policy will determine whether the connection (as long as it is legal) can be
made. For example, if two FDDI nodes attempt an A—>A connection, and this
connection is not allowed at one FDDI node but allowed at the other, the
connection would be accepted. If the connection policy at both nodes disallows
the connection, the connection will be rejected.
This is a read-only window; you currently cannot edit the connection policy via
SPECTRUM Element Manager.
You can use any SNMP Set Request or MIB tool to edit the Connection Policy for your
device by setting the fddimibSMTConnectionPolicy MIB OID (part of the MIB-II FDDI
Transmission MIB (RFC1512). fddimibSMTConnectionPolicy is simply a 16-bit integer
value (ranging from 32768 to 65535) that corresponds to the connection policy (in the
“Reject X-Y” format, where X represents a port on the FDDI Switch Module, and Y
represents the attaching node).
To set the connection policy for the device, total the bit values corresponding to
the desired connection policy according to the table below, and then use your SNMP
Set Request or Mib tool to set the value for the appropriate SMT index. For example,
to set a connection policy that disallowed the undesirable A-A or B-B connections
you would set the fddimibSMTConnectionPolicy MIB OID to 32,801:
32,768 (reject M-M, required) + 32 (reject B-B) + 1 (reject A-A).
Policy Power
reject A-A 20 (1)
reject A-B 21 (2)
reject A-S 22 (4)
reject A-M 23 (8)
reject B-A 24 (16)
reject B-B 25 (32)
reject B-S 26 (64)
reject B-M 27 (128)
reject S-A 28 (256)
reject S-B 29 (512)
reject S-S 2
reject S-M 2
reject M-A 2
reject M-B 2
reject M-S 2
10
(1,024)
11
(2,048)
12
(4,096)
13
(8,192)
14
(16,384)
reject M-M 215 (32,768 — a permanently set value for this bit)
Connection Policy 4-7
Page 49

FDDI Management
Station List
The Station List illustrates the configuration of the ring associated with the
currently selected SMT entity, including number of nodes on the ring, node
addresses (both Canonical and MAC), node class, and ring topology.
Figure 4-4. The Station List Window
The Station List provides the following information about the ring with which the
SMT is currently associated:
Number of Nodes
The number of stations inserted into the FDDI ring with which the SMT entity is
currently associated.
Address Mode
Displays the current mode being used to display the addresses of the devices in
the Station List. The two possible modes are Canonical (FDDI) or MAC (Ethernet).
To change the current Address Mode, click on the Address Mode button at the
bottom of the window. The current address mode will change in the Address
Mode field and the Stations panel.
4-8 Station List
Page 50

Stations Panel
FDDI Management
The Stations Panel displays a list of the stations on the ring to which the selected
SMT is connected, in ring sequence from the MAC, along with each station’s node
class and current topology.
Note that the information displayed in the Station List is static once the window is
opened; for updated information, click on the Refresh button.
If the number of nodes exceeds the panel size, scroll bars will appear will appear
in the list box that will allow you to scroll through the station list to view the node
of interest.
Information provided in the Stations Panel includes:
#
An index number assigned to each station that indicates its position on the ring in
relation to the monitored SMT’s MAC address. The monitored SMT’s MAC is
always the first entry (1) in the station list.
MAC Address
Displays the 48-bit hardware address — used for universal address assignment
— of the node inserted into the ring. These addresses are hardcoded into the
device, and are not configurable. The address will appear in Canonical or MAC
format, as currently selected.
Node Class
Displays the type of ring device. Possible values are:
Station Indicates an FDDI node capable of transmitting, receiving, and
repeating data.
Concentrator Indicates an FDDI node that provides attachment points to the
ring for stations that are not directly connected to the dual ring.
Topology
Indicates the node’s MAC configuration topology.
Upstream Neighbor
Displays hardware address (in Canonical or MAC format, as currently selected) of
each node’s upstream neighbor.
Station List 4-9
Page 51

FDDI Management
Performance
The Performance window, Figure 4-5, provides graphical and numeric
performance statistics for the selected SMT entity, including:
• Transmit Frames
• Receive Frames
• Frame Errors
• Lost Frames
• Ring Ops
Figure 4-5. Performance Window
Statistics are displayed in three ways:
• By count (i.e., the number detected of each for the selected interval).
• By rate (i.e., the number of each per second, as averaged over the selected
interval).
• Graphically, as a percentage of each with respect to total network load
processed by the selected interface during the last interval (e.g., a transmit
frames rate of 75% during a delta interval indicates that of all frames processed
by the selected interface, 75% were transmitted by that interface).
You can view performance for three different intervals:
• Absolute — Counts recorded since the selected module was last started.
• Cumulative — Counts recorded since the Performance window was opened.
• Delta — Counts recorded during a single polling interval that is set for
SPECTRUM Element Manager (refer to the Installing and Using... guide for
information on setting polling intervals).
To change the interval, click to select the desired radio button in the Count
Display panel in the top right hand corner of the window.
4-10 Performance
Page 52

FDDI Management
Available statistics are:
Transmit Frames
The number of frames transmitted by the MAC associated with the SMT during
the chosen interval.
Receive Frames
The number of frames received by the MAC associated with the SMT during the
chosen interval.
Frame Errors
The number of error frames detected by the MAC associated with the SMT during
the chosen interval that had not been detected previously by other stations. Error
frames may include frames with an invalid Frame Check Sequence (FCS), with
data length errors, or with internal errors that prevent the MAC from transferring
the frame to the Logical Link Control (LLC) layer.
Lost Frames
The number of frames detected by the MAC associated with the SMT during the
chosen interval that have an unknown error, so their validity is in doubt. When
the MAC encounters a frame of this type, it increments the Lost Frame counter
and strips the remainder of the frame from the ring, replacing it with idle
symbols.
Ring Ops
The number of times the ring has entered the “Ring Operational” state from the
“Ring Not Operational” state during the selected interval. This counter updates
when the MAC informs Station Management (SMT) of a change in Ring
Operation status.
Performance 4-11
Page 53

FDDI Management
4-12 Performance
Page 54

Chapter 5
Bridging
Bridge management overview; the Bridge Status window; enabling and disabling bridging; Bridge
Performance Graphs; bridge detail breakdown; the Bridge Spanning Tree window; changing bridge
Spanning Tree parameters; the Filtering Database window; configuring the filtering database
With SPECTRUM Element Manager’s Bridge Status window, you can view and
manage each bridging interface supported by the 9A128-01. You manage your
bridge by using the following windows:
• The Bridge Status window provides you with basic information about the
current status of each available bridging interface, and allows you to enable or
disable bridging at each interface. The Bridge Status window also provides
access to additional windows which allow you to configure bridging
parameters.
• The bridge-level Duplex Modes option allows you to set Duplex Mode
operation for the FDDI interface; although the window is available, duplex
mode operation is not currently supported for the 9A128-01.
• The Performance Graph and Interface Statistics windows graphically display
the traffic passing between your bridged networks, and let you compare and
contrast traffic processed by each interface; the Source Addressing window
lists the MAC addresses of devices communicating through each interface.
• The Spanning Tree window shows bridge port information and protocol
parameters relating to the Spanning Tree Algorithm (the method of
determining the controlling bridge when a series of bridges are placed in
parallel).
• With the Filtering Database window, you can see the contents of the Static and
Learned databases – the two address databases which construct the IEEE 802.1
Source Address Table. The bridge uses the contents of these databases to make
its packet filtering and forwarding decisions. You can configure entries in these
databases to increase bridging efficiency across your network.
The following sections detail how to use each of the bridge management
windows.
5-1
Page 55

Bridging
By default, the 9A128-01 perform traditional switching (or bridging). Firmware version
NOTE
2.10.13 and earlier do not support the ability to select SecureFast switching; if you have a
later version of firmware, check your hardware manuals to see if your version of firmware
supports this feature. The toggle from traditional bridging to SecureFast switching is
performed via Local Management; see your Local Management documentation for details.
Bridging-related windows will not be available for devices which have been configured for
SecureFast switching.
The Bridge Status Window
The Bridge Status window provides you with basic information about the current
status of bridging across your 9A128-01. Color-coding of each port display allows
you to quickly ascertain the status of each interface. The Bridge Status window
also lets you access further windows to control bridging parameters. To access the
Bridge Status window from the Module View window:
1. In the Module View window, click on Device to display the Device menu.
2. Drag down to Bridge Status..., and release. The appropriate Bridge Status
window, Figure 5-1, will appear.
Figure 5-1. The Bridge Status Window
The following information is provided by the Bridge Status window for each
available bridging interface:
5-2 The Bridge Status Window
Page 56

Bridging
Up Time
At the top of the Bridge Status window, you can see the time period (in a days,
hh:mm:ss format) that has elapsed since the selected module was last reset or
initialized.
Bridge State on Interface
Indicates the state of bridging over the port interface. Note that this state (and its
corresponding color-code) will also be reflected on the bridge port display in the
Module View window. Possible bridge states and their corresponding colors are:
• Forwarding (green) – the port is on line, and is configured by Spanning Tree
Algorithm to forward frames to and from its attached network.
• Disabled (blue) – bridging at the port has been disabled by management; no
traffic can be received or forwarded, including configuration information for
the bridged topology.
• Listening (magenta) – this bridge port is not adding information to the
Filtering Database. The port is monitoring Bridge Protocol Data Unit (BPDU)
traffic while preparing to move to the Forwarding state.
• Learning (magenta) – the Forwarding database is being created or the
Spanning Tree Algorithm is being executed due to a network topology change;
the port is monitoring network traffic, learning network addresses.
• Blocking (orange) – Spanning Tree Algorithm has configured this port to block
(filter) frames to prevent redundant data loops in the bridged network; the
port can’t receive or forward traffic, but bridge topology information will be
forwarded.
• Broken (red) — the physical interface has malfunctioned.
Interface Type
Indicates the interface type which applies to each bridge port interface (fddi, atm,
or other for the INB). The interface type (ifType) is a mandatory object type from
the SNMP MIB-II Interface (IF) Group.
Bridge Address
Indicates the physical (MAC) address of the bridge port.
Speed
Indicates the theoretical maximum speed of the selected interface in kilobytes per
second: 2500 Mbits for the INB interface; 100 Mbits for FDDI; and 155 Mbits for
ATM.
Accessing Other Management Options from the
Bridge Status Window
At the top of the Bridge Status window, you can click on to access a menu
that provides other bridge management options:
The Bridge Status Window 5-3
Page 57

Bridging
• A Module Type window that contains a description of the 9A128-01 module,
see Viewing Hardware Types in Chapter 2 for more information.
• A Bridge Performance Graph that displays statistics for traffic across the entire
bridge (see Bridge Statistics, page 5-6).
A Performance Graph window is also available for each individual interface,
by clicking on a port index button to display the port level management
options (see Bridge Statistics, page 5-6).
• The Spanning Tree window, which allows you to set the Spanning Tree
Algorithm parameters (see Bridge Spanning Tree, page 5-14).
• The Filtering Database window, which lets you configure the bridge’s
acquired and permanent filtering databases to filter or forward traffic across
the selected module (see Filtering Database, page 5-21).
• The Duplex Modes window, which allows you to configure duplex mode (on
or off) for standard Ethernet and FDDI interfaces; see Configuring Duplex
Modes, below, for details.
Configuring Duplex Modes
Enabling Full Duplex mode on an interface allows the interface to receive and
transmit packets at the same time, effectively doubling the available bandwidth
(and, therefore, the wire speed) on the selected interface. Interfaces which are not
set to Full Duplex mode must receive and transmit separately, waiting for one
activity to be completed before the other is begun.
Although this option appears on the menu accessed from the Bridge Status window, the
NOTE
Duplex Mode functionality is not supported by the 9A128-01 module. Attempting to set
options in these windows will generate Set Failed errors, but will not affect the device’s
bridging functions.
To access the Duplex Modes window:
1. Click on to display the main Bridge menu;
2. Drag down to Duplex Mode(s)..., and release. The Duplex Modes Window,
Figure 5-2, will appear.
5-4 Configuring Duplex Modes
Page 58

Bridging
Figure 5-2. The Duplex Modes Window
The main portion of the Duplex Modes window consists of a list of the interfaces
available on the 9A128-01 module and their current Full Duplex state: ON
indicates that Full Duplex mode has been enabled for the selected interface; OFF
indicates that it has not; N/A indicates that Full Duplex is not available.
To configure the Duplex Mode for any standard Ethernet or FDDI interface:
1. In the Duplex Modes window, highlight the interface whose Duplex Mode you
wish to change. Note that only one interface can be selected at a time.
2. Double-click the selected interface to toggle the Full Duplex setting from ON
to OFF, or vice versa. The set will take place immediately.
Enabling and Disabling Bridging
When you disable a bridge port, you disconnect that port’s network from the
bridge entirely. The port does not forward any packets, nor does it participate in
Spanning Tree operations. Nodes connected to the network can still communicate
with each other, but they can’t communicate with the bridge and other networks
connected to the bridge. When you enable a port, the port moves from the
Disabled state through the Learning and Listening states to the Forwarding or
Blocking state (as determined by Spanning Tree).
To enable or disable bridging at the port interface level from the Bridge Status
window:
1. Click on the desired Port button ( ) to display the port menu.
2. Drag down to Enable to restart bridging on the selected interface, or Disable
to halt bridging across the selected interface.
Enabling and Disabling Bridging 5-5
Page 59

Bridging
To enable or disable bridging at all ports from the Bridge Status window:
1. Click on to display the bridge menu.
2. Drag down to Enable Bridge to restart bridging across all interfaces, or
Disable Bridge to halt bridging across all interfaces.
You can also disable bridging across all ports or for an individual bridge port on
from the Module View window; see Enabling and Disabling Ports in Chapter 2
for details.
Bridge Statistics
The following sections describe the Statistics windows available for the selected
bridge, both at the device and port levels.
Performance Graphs
You use the Bridge Performance Graphs to view a color-coded strip chart that
shows you the traffic being bridged through all networks or an individual
network supported by your device. You can configure the display to show frames
filtered, forwarded, and/or transmitted, as well as the number of errors. The
graph has an x axis that indicates the 60 second interval over which charting
occurs continuously, while its y axis measures the number of packets or errors
that are processed by the selected module as a whole or by one of its bridging
interfaces.
For the 9A128-01, selecting the Detail button on the device-level performance
graph window allows you to compare the packets forwarded, filtered, or
transmitted across all networks supported by the 9A128-01, as well as errors on
all networks; for a selected bridged network, the Detail button allows you to view
the number of packets forward to, or received from, each other network
supported by the 9A128-01.
You can select the statistics you wish to monitor by using the menu buttons
provided; when you change Performance Graph parameters, the graph will
refresh and generate a strip chart based on the newly defined parameters.
To access the collective Bridge Performance Graph window:
1. From the Bridge Status window, click on to display the bridge menu.
or
From the Module View window, click on the Bridge label in the module
display; the bridge menu will appear.
5-6 Bridge Statistics
Page 60

Bridging
2. Drag down to Performance Graph..., and release. The Bridge Performance
Graph window, Figure 5-3, will appear. (The individual port Bridge
Performance Graph windows are similar, except that they display a graph
applicable to the selected interface.)
Figure 5-3. Bridge Performance Graph
To access the port-level Bridge Performance Graph windows:
1. From the Bridge Status window, click on the appropriate port button ( ) to
display the port menu.
or
From the Module View window, click on the appropriate Port Index on the
bridge port display; the Port menu will appear.
2. Drag down to Performance Graph..., and release. The port-level Bridge
Performance Graph window will appear.
For each chosen statistic, Performance Graphs display both average and peak
activity, as well as the date and time the peak values were recorded; average
values are also displayed graphically.
The Average statistics are updated every two seconds, as averaged over the
previous four two-second intervals; the graphical display also updates at
two-second intervals. For the first 60 seconds of graphing, you will note the graph
lines extending as each interval’s data is added to the graph. Once the first 60
seconds has passed, the newest data is added at the right edge of the graph, and
the oldest data is scrolled off to the left.
Available performance statistics are:
Forwarded (Green)
Forwarded The number of frames forwarded by the bridge, at the device or
port level.
Nothing The Frames Forwarded function is currently not measuring any
statistics.
Bridge Statistics 5-7
Page 61

Bridging
Filtered (Magenta)
Filtered The total number of frames filtered by the bridge, at the device or
port level.
Nothing The Filtered scale is not currently measuring the number of
packets filtered by the bridge.
Total Errors (Red)
Total Errors The total number of errors experienced by all bridging interfaces
on the selected module, or by an individual bridge interface.
Nothing The Errors scale is currently not measuring error packets coming
through the device as a whole or a single port.
Xmitted (Blue)
Xmitted The total number of frames transmitted by the selected bridge
interface, or by all bridge interfaces.
Nothing The Xmitted scale is not currently measuring the number of
packets filtered by the bridge or the selected individual interface.
Configuring the Bridge Performance Graphs
To configure the Bridge Performance Graph:
1. Using the mouse, click on (with green statistics to the right). The
Forwarded menu will appear. Click on the desired mode.
2. Click on (with magenta statistics to the right). The Filtered menu
will appear. Click on the desired mode.
3. Click on (with red statistics to the right). The Errors menu will
appear. Click on the desired mode.
4. Click on (with blue statistics to the right). The Xmitted menu will
appear. Click on the desired mode.
Once you have selected a new mode, it will appear in its respective button, and
after the next poll the Performance Graph will refresh and begin to measure using
the new mode.
The Bridge Detail Breakdown Window
The Bridge Detail Breakdown window allows you to compare the number of
frames forwarded, filtered, and transmitted on the network segments connected
to each bridging interface on your 9A128-01, as well as the number of errors
experienced on each interface.
To access this window from the Bridge performance graph, click on . The
Bridge Detail Breakdown window, Figure 5-4, will appear.
5-8 Bridge Statistics
Page 62

Bridging
Figure 5-4. The Bridge Detail Breakdown Window
The following information is available for the network segments connected to
each of the bridge ports on the 9A128-01. The information is expressed both
numerically and in pie charts. Each port’s network segment has a corresponding
color for its statistics or pie chart segments (LAN 1 = red, LAN 2 = light green,
LAN 3 = yellow, LAN 4 = blue).
The values given in these fields are cumulative totals read from the 9A128-01.
Forwarded
The total number of frames forwarded on each port’s network segment.
Filtered
The total number of frames filtered on each port’s network segment.
Errors
The total number of frames (either inbound or outbound) containing errors which
prevented them from being processed.
Xmitted
The total number of frames transmitted over each port’s network segment.
The Bridge Port Detail Breakdown Window
For the selected bridge interface, the Bridge Port Detail Breakdown window
allows you to view the number of packets forwarded to or received from each of
the other interfaces on your 9A128-01.
To access the Bridge Port Detail Breakdown window from the port Bridge
performance graph, click on . The Bridge Port Detail Breakdown window,
Figure 5-5, will appear.
Bridge Statistics 5-9
Page 63

Bridging
Figure 5-5. The Bridge Port Detail Breakdown Window
The following information is available for each bridge interface on the 9A128-01;
the information is expressed both numerically and in pie charts:
Forwarded to
The number of frames forwarded by the selected bridge interface to each other
interface on the bridge.
Forwarded from
The total number of frames received by the selected bridge interface from each of
the other bridge interfaces.
The Interface Statistics Window
The Interface (IF) Statistics window (Figure 5-6) provides MIB-II interface
statistical information — including counts for both transmit and receive packets,
and error and buffering information — for each of the interfaces available on the
9A128-01. A color-coded pie chart in the middle of the window lets you
graphically view statistics for Unicast, Non-Unicast, Discarded, and Error
packets.
This window is also available for all port interfaces via the I/F Summary window available
TIP
from the Module View Device menu. See Viewing I/F Summary Information in
Chapter 2 for more information.
To access the IF Statistics window:
1. Click on the appropriate bridge port index ( ) to reveal the Port menu.
2. Drag down to IF Statistics..., and release.
5-10 Bridge Statistics
Page 64

Figure 5-6. Interface Statistics Window
Bridging
Three informational fields appear in the upper portion of the window:
Description
Displays the interface description for the currently selected port.
Address
Displays the MAC (physical) address of the selected port.
Type
Displays the interface type of the selected port.
The lower portion of the window provides the following transmit and receive
statistics; note that the first four statistics are also graphically displayed in the pie
charts.
Unicast
Displays the number of packets transmitted to or received from this interface that
had a single, unique destination address. These statistics are displayed in the pie
char, color-coded green.
Non-Unicast
Displays the number of packets transmitted to or received from this interface that
had a destination address that is recognized by more than one device on the
network segment. The non-unicast field includes a count of broadcast packets —
those that are recognized by all devices on a segment. These statistics are
displayed in the pie chart, color-coded dark blue.
Bridge Statistics 5-11
Page 65

Bridging
Discarded
Displays the number of packets which were discarded even though they
contained no errors that would prevent transmission. Good packets are typically
discarded to free up buffer space when the network becomes very busy; if this is
occurring routinely, it usually means that network traffic is overwhelming the
device. To solve this problem, you may need to re-configure your bridging
parameters, or perhaps re-configure your network to add additional bridges.
Consult the Cabletron Systems Network Troubleshooting Guide for more
information.
These statistics are displayed in the pie chart, color-coded magenta.
Error
Displays the number of packets received or transmitted that contained errors.
These statistics are displayed in the pie chart, color-coded red.
Unknown Protocol (Received only)
Displays the number of packets received which were discarded because they were
created under an unknown or unsupported protocol.
Packets Received (Received only)
Displays the number of packets received by the selected interface.
Transmit Queue Size (Transmit only)
Displays the number of packets currently queued for transmission from this
interface. The amount of device memory devoted to buffer space, and the traffic
level on the target network, determine how large the output packet queue can
grow before the 9A128-01 will begin to discard packets.
Packets T ransmitted (Transmit only)
Displays the number of packets transmitted by this interface.
Using Source Addressing
You can use the Port Source Addresses window to view the MAC addresses that
are communicating through a selected bridge interface.
To open the Source Addresses window from the Bridge Status window:
1. Click on the individual index ( ) of the bridge interface of interest. The port
menu will appear.
2. Select Source Addressing... . The Source Addresses window , Figure 5-7, will
appear.
5-12 Using Source Addressing
Page 66

TIP
Bridging
Figure 5-7. The Port Source Addresses Window
You can also open the Port Source Addresses window from the Module View by clicking
on the bridge interface of interest and selecting the Source Addressing option.
The Port Source Addresses window displays the MAC addresses of all devices
that have transmitted packets that have been forwarded through the selected
bridging interface during the last cycle of the Filtering Database’s defined ageing
timer (learned addresses that have not transmitted a packet during one complete
cycle of the ageing timer are purged from the Source Address Table). For more
information on the Filtering Database, see Filtering Database on page 5-21.
Setting the Ageing Time
To alter the Source Address Ageing Time:
1. Click the I-bar cursor ( ) next to the Device Ageing Time field. The Device
Ageing Time window, Figure 5-8, will appear.
Figure 5-8. Device Ageing Time Window
Using Source Addressing 5-13
Page 67

Bridging
2. Type in the new Ageing Time (allo wab le range is 10 to 1,000,000 seconds; the
default is 300 seconds).
3. Click to accept the new Ageing Time, or click to exit the
window without making changes.
Note that the Source Addresses Ageing Time is the same as the Ageing Time displayed
NOTE
(and configured) via the Filtering Database window; setting the Ageing Time in the
Source Addresses window also changes the time in the Filtering Database window, and
vice versa.
Bridge Spanning Tree
The Bridge Spanning Tree window allows you to display and modify the selected
module’s bridge port information and protocol parameters relating to the
Spanning Tree Algorithm.
In a network design with multiple bridges placed in parallel (i.e., attached to the
same LAN), data loops must be prevented. The Spanning Tree Algorithm (STA) is
the method that bridges use to communicate with each other to ensure that only a
single data route exists between any two end stations. On a LAN interconnected
by multiple bridges, Spanning Tree selects a controlling Root Bridge and Port for
the entire bridged LAN, and a Designated Bridge and Port for each individual
LAN segment. A Designated Port/Bridge for a LAN segment forwards frames
from that LAN towards the Root Bridge, or from the Root Bridge onto the LAN.
All other bridge ports attached to that LAN are configured to filter (block) frames.
When data passes from one end station to another across a bridged LAN, it is
forwarded through the Designated Bridge/Port for each LAN segment towards
the Root Bridge, which in turn forwards frames towards Designated
Bridges/Ports on its opposite side.
During the Root Bridge Selection process, all bridges on the network
communicate STA information via Bridge Protocol Data Units (BPDUs). With
BPDUs, all network bridges collectively determine the current network topology
and communicate with each other to ensure that the topology information is kept
current.
To access the Bridge Spanning Tree window:
1. From the Bridge Status window, click on to display the Bridge menu.
or
From the Module View window, click on the Bridge label in the module
display; the bridge menu will appear.
2. Drag down to Spanning T ree..., and release. The Bridge Spanning Tree
window, Figure 5-9, will appear.
5-14 Bridge Spanning Tree
Page 68

Figure 5-9. Bridge Spanning Tree Window
Bridging
Configuring the Bridge Spanning Tree Window
The Bridge Spanning Tree window displays STA parameters and allows you to
alter parameters for the selected bridge as a whole, and for each individual
bridging interface.
The currently selected bridging interface is highlighted in the lower right
quadrant of the window. To alter the parameters of another interface, click on the
appropriate Port X name listed in the quadrant.
The Bridge Spanning Tree window provides the following bridge-level
information:
Bridge Priority
This field displays the “priority” component of the module’s unique bridge
identifier. The Spanning Tree Algorithm assigns each bridge a unique identifier,
which is derived from the bridge’s MAC address and the Priority. The bridge with
the lowest value of bridge identifier is selected as the Root. A lower priority
number indicates a higher priority; a higher priority enhances a bridge’s chance
of being selected as the Root.
You can edit this text box to change network topology, if needed. The default
value is 8000.
Bridge Spanning Tree 5-15
Page 69

Bridging
TIP
Part of a bridge’s Identifier is based on its MAC address. In most network installations,
the difference between bridge performance may be negligible. You may, however, find your
data bottle-necked in installations where both a low-performance bridge and a
high-performance bridge are attached to the same LAN segment and the two (or more)
bridges have the same Priority component set (e.g., at the default 8000 Hex). In such a
scenario you may want to alter the Priority component of the higher performance bridge to
ensure that it becomes root for the segment (or overall root). Remember, if Priority
components are equal the bridge on the segment with the lowest Hex value of MAC
address would have a better chance of being selected as the root bridge — as it would have
a lower Bridge Identifier. If your bridges come from multiple vendors, they will have
different MAC address values (e.g., Cabletron devices have a lower MAC address than
3Com devices); if they come from the same vendor, the bridge with the earlier manufacture
date will be likely to have the lower MAC address value.
Root Bridge
Displays the MAC address of the bridge that is currently functioning as the Root
Bridge.
Root Cost
Indicates the cost of the data path from this bridge to the Root Bridge. Each port
on each bridge adds a “cost” to a particular path that a frame must travel. For
example, if each port in a particular path has a Path Cost of 1, the Root Cost
would be a count of the number of bridges along the path. (You can edit the Path
Cost of bridge ports as described later.) The Root Bridge’s Root Cost is 0.
Root Port
This field displays the identifier (the physical index number) of the selected
module’s bridge port that has the lowest cost path to the Root Bridge on the
network. If the selected module is currently the Root Bridge, this field will read 0.
Protocol
Displays the Spanning Tree Algorithm Protocol type the selected module is
currently using. The choices are:
• 802.1
• DEC (DEC Lanbridge 100)
• None
The following four fields display values used for various Spanning Tree timers
that are set at the Root Bridge and this bridge. In Spanning Tree operations, the
value used for the tree is the one set at the Root Bridge (with the exception of
Hold Time, which is a fixed value); but you can change the value for each bridge
on your network in the event that it becomes Root.
5-16 Bridge Spanning Tree
Page 70

Bridging
Hello Time
This parameter indicates, in seconds, the length of time the Root Bridge (or bridge
attempting to become the Root) waits before resending Configuration BPDUs.
The range for this field is 1 to 10 seconds, with a default value of 2 seconds. The
Root Bridge sets the Hello Time.
Max Age
This parameter displays the bridge’s BPDU ageing timer. This controls the
maximum time a BPDU can be retained by the bridge before it is discarded.
During normal operation, each bridge in the network receives a new
Configuration BPDU before the timer expires. If the timer expires before a
Configuration BPDU is received, it indicates that the former Root is no longer
active. The remaining bridges begin Spanning Tree operation to select a new Root.
The current Root Bridge on the network sets the Max Age time. The range for this
field is 6 to 40 seconds, with a default value of 20 seconds.
Forwarding Delay
This parameter displays the time period which elapses between states while the
bridge is moving to the Forwarding state. For example, while moving from a
Blocking to a Forwarding state, the port first moves from Blocking to Listening to
BPDU activity on the network, remains there for the Forward Delay period, then
moves to the Learning State (and remains in it for the Forward Delay period), and
finally moves into a Forwarding state. This timer is set by the Root Bridge. During
a topology change, the Forward Delay is also used as the Filtering Database
Aging Time (refer to Filtering Database, page 5-21), which ensures that the
Filtering Database maintains current topology information.
Hold Time
This parameter displays, in seconds, the minimum time that can elapse between
the transmission of Configuration BPDUs through a bridge port. The Hold Time
ensures that Configuration BPDUs are not transmitted too frequently through any
bridge port. Receiving a BPDU starts the Hold Timer. After the Hold Timer
expires, the port transmits its Configuration BPDU to send configuration
information to the Root. The Hold Time is a fixed value, as specified by the IEEE
802.1d specification.
The following fields are applicable to each bridge port on the selected module:
Priority
If two or more ports on the same bridge are connected to the same LAN segment,
they will receive the same Root ID/Root Cost/Bridge ID information in
Configuration BPDUs received at each port. In this case, the BPDU’s Port ID
information – the transmitting port’s identifier and its manageable Priority
component – is used to determine which is the Designated Port for that segment.
A lower assigned value gives the port a higher Priority when BPDUs are
compared. The allowable range is 0-FF hexadecimal (0-255 decimal); the default is
80 hexadecimal.
Bridge Spanning Tree 5-17
Page 71

Bridging
Path Cost
Displays the cost that this port will contribute to the calculation of the overall
Root path cost in a Configuration BPDU transmitted by this bridge port. You can
lower a port’s Path Cost to make the port more competitive in the selection of the
Designated Port – for example, you may want to assign a lower path cost to a port
on a higher performance bridge. The allowable range is 1 to 65535.
Designated Cost
Displays the cost of the path to the Root Bridge of the Designated Port on the
LAN to which this port is attached. This cost is added to the Path Cost to test the
value of the Root Path Cost parameter received in Configuration BPDUs.
Designated Root
Displays the unique bridge identifier of the bridge that is assumed to be the Root
Bridge.
Designated Bridge
Displays the network address portion of the Bridge ID (MAC address/priority
component) for the bridge that is believed to be the Designated Bridge for the
LAN associated with this port.
The Designated Bridge ID, along with the Designated Port and Port Identifier
parameters for the port, is used to determine whether this port should be the
Designated Port for the LAN to which it is attached. The Designated Bridge ID is
also used to test the value of the Bridge Identifier parameter in received BPDUs.
Designated Port
Displays the network address portion of the Port ID (which includes a
manageable Priority component) of the port believed to be the Designated Port
for the LAN associated with this port.
The Designated Port ID, along with the Designated Bridge and Port Identifier
parameters for the port, is used to determine whether this port should be the
Designated Port for the LAN to which it is attached. Management also uses it to
determine the Bridged LAN topology.
Topology
This indicates how many times the bridge’s Topology Change flag has been
changed since the selected module was last powered up or initialized. The
Topology Change flag increments each time a bridge enters or leaves the network,
or when the Root Bridge ID changes.
Changing Bridge Spanning Tree Parameters
The Bridge Spanning Tree window allows you to update the following
parameters for your bridge. When you have finished making changes to the
following individual parameters, you must click on at the bottom of the
Spanning Tree window to write the changes to the selected module.
5-18 Bridge Spanning Tree
Page 72

Any values you set at the bridge will cause a Topology Change flag to be issued in the next
NOTE
Changing Bridge Priority
Configuration BPDUs it transmits. This will cause the bridged network to immediately
recalculate Spanning Tree and change topology accordingly.
To change the part of the bridge address that contains the identifier used in the
Spanning Tree Algorithm for priority comparisons:
1. Highlight the Bridge Priority field.
2. Enter the new identifier, in hexadecimal format; the allowed range is 0-FFFF
hexadecimal.
3. Click on Set.
The selected Bridge Priority will be applied to the bridge (a lower number
indicates a higher priority in the root selection process).
Bridging
Changing the Spanning Tree Algorithm Protocol Type
To change the type of protocol used in Spanning Tree:
1. Click the mouse on the appropriate option button: IEEE 802.1, DEC, or None.
2. Click on Set.
The selected Spanning Tree Algorithm protocol type will be applied to the bridge.
If you selected None, the Spanning Tree Algorithm will be disabled (if it already
was enabled). If STA Protocol Type was changed from None to IEEE 802.1 or DEC,
you must restart the bridge for the newly selected STA protocol to be applied.
All bridges in a network must use the same Spanning Tree version. Mixing Spanning Tree
!
CAUTION
Changing Hello Time
Algorithm protocols will cause an unstable network.
If the bridge is the Root Bridge, or is attempting to become the Root, and you
want to change the length of time the bridge waits between sending configuration
BPDUs:
1. Highlight the Hello Time field, and type in a new value.
2. Click on Set.
The IEEE 802.1d specification recommends that Hello Time = 2 seconds; the
allowable range is 1 to 10 seconds.
Bridge Spanning Tree 5-19
Page 73

Bridging
Changing Max Age Time
If the selected module is the Root Bridge or attempting to become the Root, and
you want to change the maximum time that bridge protocol information will be
kept before it is discarded:
1. Highlight the Max Age field, and type in a new value.
2. Click on Set.
The IEEE 802.1d specification recommends that Max Age = 20 seconds; the
allowable range is 6 to 40 seconds.
Changing Forwarding Delay Time
If the selected module is the Root Bridge or attempting to become the Root, and
you want to change the time period the bridge will spend in the Listening state
(e.g. either listening to BPDU activity on the network while moving from the
Blocking to the Learning state or in the Learning state while the bridge is moving
from the Listening to the Forwarding state):
1. Highlight the Forwarding Delay field, and type in a new value.
2. Click on Set.
The IEEE 802.1d specification recommends that Forward Delay = 15 seconds; the
allowable range is 4 to 30 seconds.
To ensure proper operation of the Spanning Tree Algorithm, the IEEE 802.1d specification
NOTE
recommends that you always observe the following relationship between Forwarding
Delay and Max Age:
Changing Port Priority
To change the part of the Port Priority used in priority comparisons:
1. If necessary , select the desired port by clicking the mouse to highlight the port
2. Highlight the port Priority field, and enter the new priority identifier. Only valid
3. Click on Set. The new port priority will be saved.
2 x (Forwarding Delay - 1.0) > Max Age
in the lower right quadrant of the window. The lower left quadrant of the
window will now allow you to edit parameters for the selected port.
hexadecimal numbers (0 to FF) are allowed in this field. The default is 80
hexadecimal.
5-20 Bridge Spanning Tree
Page 74

Changing Path Cost
To change the Path Cost:
1. If necessary , select the desired port by clicking the mouse to highlight the port
in the lower right quadrant of the window. The lower left quadrant of the
window will now allow you to edit parameters for the selected port.
2. Highlight the Path Cost field, and type in a new v alue from 1 to 65535 decimal
(default is 100 decimal).
3. Click on Set.
The new path cost will be applied to the port.
Filtering Database
The Filtering Database, which makes up the IEEE 802.1 Source Address Table, is
used to determine which frames will be forwarded or filtered between the
selected module’s bridging ports.
Bridging
Transparent bridges like the 9A128-01 use the Filtering Database to determine a
packet’s route through the bridge. During initialization, the bridge copies the
contents of its Permanent Database to the Filtering Database. Next, the bridge
learns network addresses by entering the source address and port association of
each received packet into the Filtering Database. When in the Forwarding state,
the bridge examines each received packet and checks it against the contents of the
Filtering Database. If the destination address is located on the network from
which the packet was received, the bridge filters (does not forward) the packet. If
the destination address is located on a different network, the bridge forwards the
packet to the appropriate network. If the destination address is not found in the
Filtering Database, the bridge forwards the packet to all networks. To keep
Filtering Database entries current, older entries are purged after a period of time,
which is called the Dynamic Ageing Time.
The Filtering Database consists of two separate databases: the Static and the
Learned Databases.
The Static Database contains addresses that are entered by a network
administrator. You add these addresses directly to the database while the bridge is
powered up, or to the selected module’s battery-backed RAM so that they are
stored on shutdown till the next power-up.
The Learned Database consists of addresses that accumulate as part of the
bridge’s learning process as it is up and running. These do not remain in the
Source Address Table when the system is shut down. The Learned Database also
contains the addresses that are in the Static Database upon start-up of the bridge.
Entries to the Source Address Table are one of four types: Permanent, Static,
Dynamic, or Learned.
Filtering Database 5-21
Page 75

Bridging
• Permanent entries are addresses that you add to the Static Database (via the
Filtering Database window) that are stored in the selected module’s
battery-backed RAM. Since they remain in the module on shutdown or restart,
they are considered “Permanent.”
• Static entries are addresses that you add to the Static Database (via the
Filtering Database window). These entries remain in the selected module’s
memory until it is shut down.
• Dynamic entries are addresses that you add to the Static Database (via the
Filtering Database window). With the Ageing Time feature, you set the time
period that these addresses are saved in the Source Address Table. Addresses
that have not transmitted a packet during one complete cycle of the ageing
timer are deleted from the database.
• Learned entries are addresses that are added to the Learned Database through
the bridge’s learning process. With the Ageing Time feature, you set the time
period that these addresses are saved in the Source Address Table. Addresses
which are inactive within a cycle of the ageing timer are dropped from the
database.
Learned address entries are divided into two types, Learned and Self. Address
entries classified as Learned have transmitted frames destined for a device
attached to a segment connected to the selected module. Address entries
classified as Self are those that have sent a frame with a destination address of
one of the selected module’s bridging port.
NOTE
At the Filtering Database window (Figure 5-10), you can view the number of
entries of each type: Permanent, Static, Dynamic, or Learned.
When you first initialize the Filtering Database window, a message will appear to inform
you that data is being retrieved. The message will disappear when all information has been
returned from the Filtering Database, and you will be able to view and configure database
entries.
5-22 Filtering Database
Page 76

Bridging
Figure 5-10. The Filtering Database Window
A scrollable Address Entry panel allows you to:
• View the address entries in the Filtering Database.
• Alter an entry’s type (e.g., from Learned to Permanent, Dynamic, or Static).
• View and configure the bridging action taking place on the packets entering
each of the bridging ports.
In addition, you can use buttons to add individual addresses to, or delete them
from, these databases, or clear all Permanent, Static, or Dynamic entries in the
database.
To access the Filtering Database window:
1. Click on to display the Bridge menu.
or
Click on the Bridge label in the module display; the bridge menu will appear.
2. Drag down to Filtering Database..., and release. The Filtering Database
window will appear.
Filtering Database 5-23
Page 77

Bridging
The following fields are listed in the top portion of the Filtering Database
window:
List
The List checkboxes indicate whether the associated entry type (Permanent,
Static, Dynamic, or Learned) will be displayed in the scrollable table of address
entries. A check next to the entry type indicates that it will be displayed.
Type
Indicates the type of entry in the database.
Number
Displays the current number of Permanent, Static, Dynamic, and Learned
Address entries.
Capacity
Indicates the total capacity of each entry type in the Static and Learned databases.
Ageing Time
Indicates the length of time, in seconds, that Dynamic and Learned Addresses in
the Source Address Table are allowed to remain inactive before they are dropped
from the database. The allowable time range for these entries is 10 to 1,000,000
seconds. Ageing time is not applicable to Static or Permanent entries. You can
configure this field, as described in the next section.
The following fields are applicable to the scrollable Address Entry panel of
Filtering Database entries.
Address
Lists the addresses for which the bridge’s Filtering Database has forwarding
and/or filtering information.
Type
Indicates the type of an entry in the database. The possible types are Static,
Dynamic, Learned, Self, or Permanent. You can alter the entry type, as described
in the next section.
Source Port
Indicates the port number on which the address entry was first detected. A
question mark (?) indicates that the address entry was not a learned entry, but
Port Filtering information applies to it (i.e., the entry is a created Permanent,
Dynamic, or Static entry and has corresponding filtering information).
5-24 Filtering Database
Page 78

Receive Port
Indicates the number of the port on which a frame must be received in order for
the entry’s Port Filtering information to apply. An asterisk (*) indicates that the
receive port is promiscuous, and applies to all ports of the bridge (assuming no
conflicting entry applies). You can change the receive port, as described in the
following section.
Port Filtering
Indicates the action that will take place at each bridge port when it receives
frames from the selected address entry. A green arrow indicates that the frames
received from the address will be forwarded to the port’s associated segment
( ). A red circle indicates that frames will be filtered (blocked) from the port’s
associated segment ( ). You can change the Port Filtering action, as described
in the next section. Use the scroll bars to view the filtering/forwarding status for
all available ports; only two consecutive ports are displayed simultaneously.
Configuring the Filtering Database
You can configure the Filtering Database by:
Bridging
NOTE
• Altering the Ageing Time for Dynamic and Learned entries.
• Changing the type of entry with the Type buttons.
• Changing the Receive port for the filter.
• Changing the Port Filtering action at each bridge port.
• Adding or deleting individual Filtering Database entries.
• Clearing all Permanent, Static, or Dynamic entries from the Filtering Database.
Note that although configuration changes will appear in the window, no action
actually takes place in the bridge’s Filtering Database until you click on the OK
button in the bottom right of the window. This saves the new configuration. If you
change the window without clicking OK, then attempt to exit the window by
clicking Cancel, a text box will appear stating “Changes have been made. Cancel
them?”. Click on Yes to exit the window without changing the Filtering Database,
or No to return to the window.
When you reconfigure the Filtering Database and click OK, the screen will clear
temporarily and a message will appear to indicate that the information is being updated.
When the changes have been successfully set and the Filtering Database has updated, the
screen information will be refreshed.
Filtering Database 5-25
Page 79

Bridging
Altering the Ageing Time
To alter the Ageing Time for Dynamic and Learned entries:
1. Highlight the Ageing Time field with the cursor.
2. Type in the new Ageing Time (allowable range is 10 to 1,000,000 seconds).
Changing the Type of Entry
You can change any entry type from its current type (Learned, Self, Permanent,
Static, or Dynamic) to either a Permanent, Static, or Dynamic entry. To do so:
1. Click on the shadowed T ype button. A menu will appear with the three
possible types to which the entry can be changed.
2. Highlight the desired type.
Changing the Receive Port
You can change the Receive port of an address entry in the scrollable panel, so
that a frame must be received at the specified port for the filtering action to apply.
To do so, click on the Receive port in the panel. With each click, the Receive port
will cycle to the next port — from * (promiscuous), to 1, to 2, and back to *.
Changing the Port Filtering Action
You can change the Port Filtering action at each bridge port from its current action
to the opposing action.
1. Maneuver the scroll bar until the desired port is in the Port Filtering panel.
2. Click on the port to alter its filtering action from forwarding frames from the
associated address ( ), to filtering frames ( ) (or vice versa).
Adding or Deleting Individual Entries
You can add or delete entries individually from the Filtering Database.
To add an address:
1. Click on the New button in the lower left of the window. A window
(Figure 5-11) will appear.
Figure 5-11. Filter Database – New Filter Window
5-26 Filtering Database
Page 80

Bridging
2. In the Filter Address field, type in the address (Hex format) for which you
desire bridging. Be sure to add “-” as a separator between each byte in the
address.
3. In the Receive Port field, type in the port at which the address must be
detected for bridging to take place. If you enter a value of 0 in this field, the
Receive Port is considered promiscuous (i.e., any port), and will be
designated by an * in the Address Entry panel.
4. Click on OK.
5. Specify the Port Filtering action on the address entry as described in the
previous section.
To delete an address:
1. Click to highlight the address entry in the Address Entry panel that you wish to
delete from the filtering database.
2. Click on Delete.
Clearing All Permanent, Static, or Dynamic Entries
To erase all Permanent, Static, or Dynamic entries from the Filtering Database,
click on the associated button in the upper portion of the window.
Filtering Database 5-27
Page 81

Bridging
5-28 Filtering Database
Page 82

Index
A
Absolute 4-10
ACT (active) 2-11
Address Mode 4-8
Ageing Time (bridging) 5-22, 5-24
ATM 3-1
B
BLK (Blocking) 2-10
Blocking 5-3, 5-5
Board Menus 2-7
Boot Prom, revision 2-3
bridge port state 5-3
Bridge Priority 5-15
Bridge Protocol Data Units (BPDUs) 5-14
bridging interface status 5-2
BRK 2-10
Broken 5-3
buffer space 2-18, 5-12
C
Cabletron Systems Global Call Center 1-5
Cancel button 1-4
channel trunking 3-3
claim token process 4-4
CMT 4-1, 4-5
color codes 2-12
color-coded port display 2-2
command buttons 1-4
Concentrator M Ports 4-5
Concentrator Non-M Ports 4-5
Configuration window 4-2
Connection Management 4-1, 4-5
Connection Policy window 4-6
connection rules 4-6
Connection State 2-11
Connection Status 2-3
Cumulative 4-10
D
data loops 5-3, 5-14
Delta 4-10
Designated Bridge 5-14, 5-18
Designated Cost 5-18
Designated Port 5-14, 5-18
Designated Root 5-18
Detect 4-3
device date 2-21
Device Menu 2-5
Device Name 1-3
device time 2-20
Device Type 2-13
Directed 4-3
DIS (Disabled) 2-10
DIS (disabled) 2-11
disable a bridge port 5-5
disabling a port 2-22
Discarded packets 2-18, 5-12
dual-homing 4-6
Dynamic entries 5-22
E
enable a bridge port 5-5
enabling a port 2-22
Encapsulation Type 3-3
F
FDDI connection rules 4-6
Forwarded from 5-10
Forwarded to 5-10
Forwarding 5-3, 5-5
Forwarding Delay 5-17
Frame Errors 4-11
Frames Filtered 5-8
Frames Forwarded 5-7
FWD (Forwarding) 2-10
G
GETTING HELP 1-4
Global Call Center 1-5
grouping of virtual connections 3-3
Index-1
Page 83

Index
H
Hello Time 5-17
Help button 1-4
Help Menu 2-7
Hold Time 5-17
I
I/F Summary
interface performance statistics 2-15
I/F Summary window 2-14
Interface Group window 2-17
interface type (bridging) 5-3
IP address 1-3, 2-3
Isolated 4-3
L
L. Sta 2-15
Learned Database 5-21
Learned entries 5-22
Learning 5-3, 5-5
LER Estimate 2-11
LER Estimate Values 2-11
LIS (Listening) 2-10
Listening 5-3, 5-5
Load 2-16
Location 1-4
Lost Frames 4-11
LRN (Learning) 2-10
M
MAC 4-1
MAC address 1-4, 2-3
MAC Path 4-5
MAC State 4-3
Master (M) port 4-5
Max Age 5-17
Media Access Control 4-1
menu structure 2-4
MIB components 2-12
Module type 2-13
Not Available 4-3
Number of MACs 4-5
Number of Nodes 4-8
O
OK button 1-4
P
P. Sta 2-15
Packets Received 2-19, 5-12
Packets Transmitted 2-19, 5-12
Path Cost 5-18
Performance window 4-10
Permanent entries 5-22
Permanent Virtual Circuits (PVCs) 3-1
port display, color codes 2-2
Port Filtering 5-25
Port Menus 2-8
Port Status 2-3
port status color codes 2-12
Port Status Menu 2-6
Priority 5-17
Protocol, bridging 5-16
R
Rate 2-17
Raw Counts 2-16
Receive Frames 4-11
Receive Port 5-25
Requested Target Token Rotation Time 4-4
Ring Configuration 4-5
Ring Management 4-1
Ring Ops 4-11
Ring-Op 4-3
Ring-Op-Dup 4-3
RMT 4-1
Root Bridge 5-14, 5-16
Root Bridge selection process 5-14
Root Cost 5-16
Root Port 5-14, 5-16
N
network topology 5-14
Node Class 4-9
Non-Op 4-3
Non-Op-Dup 4-3
Non-Unicast 2-18
Non-Unicast (Multicast) 5-11
Index-2
S
SBY (standby) 2-11
Set button 1-4
SMT Connection Policy 4-6
SMT Version 4-4
Source Address Table (bridging) 5-21
Source Port 5-24
Page 84

Spanning Tree Algorithm 5-14
Static Database 5-21
Static entries 5-22
Station List 4-8
Switched Virtual Circuits (SVCs) 3-1
T
technical support 1-5
T-Neg. 4-4
Topology 4-9
Topology Change 5-18
Trace 4-3
Transmit Frames 4-11
Transmit Queue Size 2-19, 5-12
transparent bridges 5-21
T-Req. 4-4
twisted ring 4-6
U
Unicast 2-18, 5-11
Unknown Protocol 2-18, 5-12
Up Time 2-15, 5-3
Upstream Neighbor 4-9
UpTime 2-3
Utilities Menu 2-7
Index
V
VC MUX 802.3 Bridging 3-3, 3-5
Virtual Channel Identifier (VCI) 3-3
Virtual Path Identifier (VPI) 3-3
W
wrapped ring 4-6
X
Xmitted 5-8
Index-3
Page 85

Index
Index-4
 Loading...