


BusinessObjects Performance
Manager XI 3.0 Administrator's Guide
BusinessObjects Performance Manager XI 3.0
windows

Copyright
© 2008 Business Objects. All rights reserved. Business Objects owns the following
U.S. patents, which may cover products that are offered and licensed by Business
Objects: 5,555,403; 5,857,205; 6,289,352; 6,247,008; 6,490,593; 6,578,027;
6,831,668; 6,768,986; 6,772,409; 6,882,998; 7,139,766; 7,299,419; 7,194,465;
7,222,130; 7,181,440 and 7,181,435. Business Objects and the Business Objects
logo, BusinessObjects, Business Objects Crystal Vision, Business Process On
Demand, BusinessQuery, Crystal Analysis, Crystal Applications, Crystal Decisions,
Crystal Enterprise, Crystal Insider, Crystal Reports, Desktop Intelligence, Inxight,
the Inxight Logo, LinguistX, Star Tree, Table Lens, ThingFinder, Timewall, Let
there be light, Metify, NSite, Rapid Marts, RapidMarts, the Spectrum Design, Web
Intelligence, Workmail and Xcelsius are trademarks or registered trademarks in
the United States and/or other countries of Business Objects and/or affiliated
companies. All other names mentioned herein may be trademarks of their respective
owners.
Third-party
Contributors
Business Objects products in this release may contain redistributions of software
licensed from third-party contributors. Some of these individual components may
also be available under alternative licenses. A partial listing of third-party
contributors that have requested or permitted acknowledgments, as well as required
notices, can be found at: http://www.businessobjects.com/thirdparty

Contents
Audience 7Chapter 1
Performance Manager Administrator's Guide 9Chapter 2
High-level overview....................................................................................10
Database configuration and tuning............................................................10
Dashboard and Analytics repository..........................................................11
Metric domain (CI_ prefix).........................................................................11
Performance Manager domain (IPM_ prefix)............................................12
Set Domain (SET_ prefix)..........................................................................12
Standard options for servers......................................................................13
Changing the services startup parameters on UNIX.................................17
Metric Universes........................................................................................17
Universe overview................................................................................17
Metric universe overview......................................................................17
Multiple metric universes......................................................................18
Creating a Basic Enterprise Metric.......................................................19
Set-based Metrics................................................................................26
Advanced Topics..................................................................................41
Configuring universes for process control charts.................................43
Performance Manager Setup and Administration Online Help 49Chapter 3
Dashboard and analytic applications.........................................................50
What is Dashboard Builder?.................................................................50
What is Performance Manager?...........................................................50
What is Predictive Analysis?................................................................50
What is Process Analysis?...................................................................51
BusinessObjects Performance Manager XI 3.0 Administrator's Guide 3

Contents
What is Set Analysis?...........................................................................51
Deployment of Dashboard and Analytics tools to your organization.........51
Performance Manager servers..................................................................53
Performance Manager server options..................................................54
Dashboard and Analytics launch errors...............................................61
The Performance Manager repository.......................................................62
Overview of the Dashboard and Analytics deployment........................63
Creating the Performance Manager repository....................................64
Central Management Server authentication.........................................67
Performance Manager repository migration.........................................69
Performance Manager repository integrity and cleanup......................69
Dashboard and Analytics system users....................................................74
Metric universes.........................................................................................76
About metric universes.........................................................................77
Building metric universes.....................................................................78
Making metric universes available to Dashboard and Analytics users.78
Defining connections for universes......................................................78
Updating a universe in Dashboard and Analytics Setup......................79
Object metadata in universes...............................................................80
External metric refresh.........................................................................83
Sliced metric dimensions...........................................................................85
What are dimensions and sliced metrics?............................................85
Where are dimensions defined?..........................................................86
Sliced metrics.......................................................................................93
Analytics calendars....................................................................................93
Calendar properties..............................................................................94
Moving averages in calendars...........................................................100
Difference calculations in calendars...................................................106
Rollups in calendars...........................................................................108
Rules templates.......................................................................................110
About rules and rules templates.........................................................110
4 BusinessObjects Performance Manager XI 3.0 Administrator's Guide

Contents
Creating and editing rules templates..................................................113
Universe value list templates...................................................................116
Application activity tracing.......................................................................120
Individual Profiler portrait properties........................................................122
Analytic Template Publisher.....................................................................124
Installing the XCTemplateUploader.war File......................................124
Deploying the Crystal Xcelsius templates..........................................125
Publishing a new Crystal Xcelsius template.......................................125
Publishing a Crystal Xcelsius template archive..................................127
Downloading a Crystal Xcelsius template..........................................127
Working with the template properties file...........................................128
Data sources accepted by the Crystal Xcelsius data model..............131
Modifying the XLF file after the template has been published...........131
Modifying the XLS file after the template has been published...........131
Process Analysis control charts setup.....................................................132
Control chart samplings......................................................................132
Control chart filters.............................................................................135
Control chart alarms...........................................................................137
Terms and concepts.................................................................................138
Aggregation functions.........................................................................138
What is an analytic?...........................................................................144
What is binning?.................................................................................144
What is a control chart?......................................................................144
What is differencing?..........................................................................145
What is a dimension?.........................................................................145
What is a grain?.................................................................................145
What is a metric?................................................................................146
Moving averages explained...............................................................146
What is a sliced metric?.....................................................................150
What is a variable?.............................................................................150
BusinessObjects Performance Manager XI 3.0 Administrator's Guide 5

Contents
Get More Help 153Appendix A
Index 157
6 BusinessObjects Performance Manager XI 3.0 Administrator's Guide

Audience
1

1
Audience
This guide is for administrators of BusinessObjects Performance Manager.
The first section of this guide contains information on creating metric universes
used to build analytics in Performance Manager.
The second section of the guide contains a printable version of the
Performance Manager Setup and Administration Online Help for your
convenience.
For detailed information on installation and deployment of BusinessObjects
XI 3.0 refer to the following:
•
BusinessObjects Enterprise XI 3.0 Installation and Configuration Guide
for Windows
•
BusinessObjects Enterprise Deployment Planning Guide
8 BusinessObjects Performance Manager XI 3.0 Administrator's Guide

Performance Manager Administrator's Guide
2

Performance Manager Administrator's Guide
2
High-level overview
High-level overview
As an administrator of the performance management products you need to
be familiar with of BusinessObjectsInfoView and with Designer.
For information on configuring the Dashboards and Analytics framework
refer to the Setup and Administration help that is available from the Setup
page. This help covers a number of important topics including:
Connecting to the dashboards and analytics repository
•
Connecting to the universe
•
Setting up calendars
•
Business Objects recommends that you have the guides listed below ready
for reference.
BusinessObjects XI 3.0 Administrator's Guide - provides information and
•
procedures covering a wide range of administrative tasks.
Designer's Guide - provides complete information on how to use Designer
•
to design, create, and manage Business Objects universes.
BusinessObjects XI 3.0 Installation Guide - guide provides information
•
and procedures for installing BusinessObjects, and includes detailed
instructions for the different installation modes available.
Database configuration and tuning
Although optimization of the performance management repository leads to
performance gains, the typical deployment gains the most from a well set-up
source database. A time period is one of the key factors in limiting queries
in most deployments that involve sets and metrics. Therefore, it is essential
to consider the type of SQL used in queries and key date fields. Business
Objects recommends using BusinessObjects or Web Intelligence directly
against the metric universe to generate a test SQL statement that would be
a typical metric. This SQL can then be tested and traced to check that indexes
are in place and are being used.
10 BusinessObjects Performance Manager XI 3.0 Administrator's Guide

Performance Manager Administrator's Guide
Dashboard and Analytics repository
Dashboard and Analytics repository
The performance manager (PM) repository is split into three domains or sets
of tables that are created when you deploy a new PM repository.
Metric domain: Dashboard Manager tables in which metrics, rules and
•
other performance management information is stored. The table names
have a CI_ prefix, for example, CI_PROBE_VALUE.
Performance Manager domain: Performance Manager tables in which
•
goals and target values are stored. These contain all the data required
by Performance Manager such as goals and target values, as well as
strategies and roles. The table names have an ipm_ prefix, for example,
ipm_analytic.
Set domain: Set Analyzer tables in which sets are stored for the
•
segmentation engine. These are the tables required to store the Set
Analyzer data. The table names have a SET_ prefix, for example,
SET_SET_DETAIL.
2
Metric domain (CI_ prefix)
The Metric domain (CI_ prefix) can initially be sized as the Universe domain.
In this case, the number of universes in the table corresponds to the number
of universes pushed in the performance management setup page. These
universes are stored in tables in the metric domain as the basis for metric
creation.
CI_PROBE_VALUE
As with the set domain you can use a simple calculation to determine storage
size using the CI_PROBE_VALUE table for the metric values as follows:
Number of metrics * number of periods of history
Further storage may be required for dimensioning, so consider modifying
this calculation as follows:
Number of metrics * number of periods of history * number of distinct
dimension values
BusinessObjects Performance Manager XI 3.0 Administrator's Guide 11

Performance Manager Administrator's Guide
2
Performance Manager domain (IPM_ prefix)
CI_TARGET_VALUE
If you are using Performance Manager the CI_TARGET_VALUE table can also
be of significant size. You can estimate the size as follows:
number of goals * number of periods
If you are using dimensions, the calculation is:
number of goals * number of periods * number of distinct dimensions
CI_PROBE_VALUE
The metric domain can also be set up to allow separate table spaces for the
CI_PROBE_VALUE table, which typically grows quite large compared with the
other CI_ tables.
Performance Manager domain (IPM_
prefix)
The size of the Performance Manager domain is a simple calculation based
on the number of roles, actions, and other values that can be used.
Set Domain (SET_ prefix)
The set domain contains all set metadata, including the security and
special-set user information. Start with an initial size based on the number
of users. Business Objects recommends allocating 1/2MB per user.
If you plan to use sets in your deployment you must consider the storage
requirement for set membership by answering the following questions:
What type of sets will be used?
•
What is the size of the sets?
•
If the sets are dynamic, what are the history requirements and what
•
turnover is expected?
The following example shows how you can easily estimate the size of the
Set domain of the PM repository by creating a test table.
You estimate:
12 BusinessObjects Performance Manager XI 3.0 Administrator's Guide

Performance Manager Administrator's Guide
Standard options for servers
the number of rows
•
the size of a row
•
Example:
100 dynamic sets, an average of 100,000 members, keeping 12 months
of history, with, on average, 25% turnover
100 * (100,000 + (12*(25,000))) = 40 million rows
A row in SET_SET_DETAIL (or SET_SET_DETAILC if using a character key)
consists of the following table structure:
SetID number(), ID number(), Points number(), Sdate date(),
Edate date()
The set domain performance is greatly influenced by the SET_SET_DETAIL
tables. For optimal results in a deployment in which sets are used, Business
Objects recommends:
allocating specific table space for the SET_SET_DETAIL table and its
•
index
using setup options such as table partitioning to greatly improve
•
performance
2
carrying out regular index analysis since table style and size can change
•
Set Analyzer also allows you to set parallel query options that improve
performance, if the database used to host the repository supports this.
Standard options for servers
These command-line options apply to all of the BusinessObjects Enterprise
servers, unless otherwise indicated.
BusinessObjects Performance Manager XI 3.0 Administrator's Guide 13

Performance Manager Administrator's Guide
2
Standard options for servers
BehaviorValid ArgumentsOption
Specify the friendly name
of the server.
The server registers this
name with the Central
Management Server
(CMS), and the name is
displayed in the CMC.
The default friendly name
is hostname.servertype
Note:
string-name
• Do not modify -name
for a CMS.
• If you modify -name for
an Input or Output File
Repository Server, you
must include "Input." or
"Output." as the prefix to
the value you type for
string, for example,
-name Input.Server01
or
-name Output.UK.
Specify the CMS with
which the server should
register. Add the port if
cmsname [:port]-ns
14 BusinessObjects Performance Manager XI 3.0 Administrator's Guide
the CMS is not listening
on the default (6400).
This option does not apply to the CMS itself.

Performance Manager Administrator's Guide
Standard options for servers
BehaviorValid ArgumentsOption
Specify the port on which
the server listens. The
server registers this port
with the CMS. If unspecified, the server chooses
any free port > 1024.
port-requestPort
Note: This port is used for
different purposes by different servers. Before
changing, see the section
on Changing the default
server port numbers" in
the BusinessObjects XI
Release 2 Administrator's
Guide.
2
-port
[interface:]
[port]
BusinessObjects Performance Manager XI 3.0 Administrator's Guide 15

Performance Manager Administrator's Guide
2
Standard options for servers
BehaviorValid ArgumentsOption
Binds WCA or CMS to
the specified port , or to
the specified network in
terface and port.
BInds other servers to the
specified network inter
face. Useful on multi-
homed machines or in
certain NAT firewall environments.
Use -portport or
•
-portinter
face:port for WCA
and CMS.
Use -port inter
•
facefor other
servers. The port
command is used for
different purposes by
different servers. Before changing, see
Changing the default
server port numbers
" in the BusinessObjects Enterprise XI
Release 2 Administrator's Guide.
•
16 BusinessObjects Performance Manager XI 3.0 Administrator's Guide
If you change the
default port value for
the CMS, you must
perform additional
system configuration.
For more information
see Changing the
default server port
numbers "in the
BusinessObjects Enterprise XI Release
2 Administrator's

Performance Manager Administrator's Guide
Changing the services startup parameters on UNIX
BehaviorValid ArgumentsOption
Guide
2
-restart
Server restarts if it exits
with an unusual exit code.
Changing the services startup parameters
on UNIX
If you want to change the services startup parameters on UNIX for example,
in the case of a DMZ deployment, you must:
1. Manually edit the INSTALLDIR/bobje/ccm.config file to add or change
the parameters values.
2. Restart the services.
Metric Universes
Universe overview
A universe is used to represent the underlying data schema used with the
performance management products, allowing a visual view of what can lead
to complex SQL generation. You use Designer to build universes that specify
the SQL used to define metrics. You then usePerformance Manager to create
analytics that use metrics to track performance.
For detailed information on how to design, create, and manage
BusinessObjects universes refer to the Designer's Guide .
Metric universe overview
Metrics are time-based aggregate values based on sets, set behavior, or
filters. A metric is composed of the following:
BusinessObjects Performance Manager XI 3.0 Administrator's Guide 17

Performance Manager Administrator's Guide
2
Metric Universes
Set or data based filter
The process of creating a metric universe is comprised of the following stages
that are described in more detail:
• Creating the universe on a target fact table.
• Creating measures, with filters and date restrictions
• Making the universe available to Performance Manager
• Creating the metric in Performance Manager
ExampleMetric component
SUM(SALES)Measure object
DATEFIELD between START and ENDDate-based self-join or where clause
Set based: SETSTARTDATE =
•
START, for example, Joiners
Data based: COUNTRY = 'Eng
•
land'
For in-depth information on creating universes, and specifically, on creating
measures, refer to the Designer's Guide.
Multiple metric universes
The dashboards and analytics framework supports the ability to build metrics
from multiple universes. This simplifies a system universe by breaking down
the universe structure and creating a new universe for specific subject areas.
For enterprise metrics, multiple universes can be used to select from multiple
data sources.
In the diagram below subject areas 1 and 2 are defined as enterprise metrics,
and subject areas 3 and 4 as set-based metrics. The results of metric
calculations on connections 1 and 2 are written into the dashboard and
analytics repository tables that are located in the same schema as Set
Analyzer , which is Connection 3 in the diagram below.
18 BusinessObjects Performance Manager XI 3.0 Administrator's Guide

Performance Manager Administrator's Guide
Creating a Basic Enterprise Metric
Enterprise metrics
An enterprise metric is a metric that contains a date-based filter defined on
the entire population of entities limited by a simple
WHERE restriction, for example,
COUNTRY=England
An enterprise metric is calculated at a non-set level, that is, without using
the set metadata tables
Metric Universes
2
Creating the universe on a target fact table
A fact table is the starting point in creating metrics. In Designer you create
a universe based on the fact table and define a connection to the source
database. You then load the table into the structure pane. You create classes
to organize the measures into groups. You then use this universe in
Performance Manager to create metrics from the measures.
The following image shows a sample sales table that is used to create the
measures that are the basis of the metrics. The table contains a date field,
which is an important element for time-based metrics.
BusinessObjects Performance Manager XI 3.0 Administrator's Guide 19

Performance Manager Administrator's Guide
2
Metric Universes
Creating a measure
To define the value for the basis of the metric calculation, in you need to
create a measure object using a field from the fact table. This example uses
the values in the sales_actual column from the sales table.
The select statement for the object, unlike that of an object in a typical
universe, does not contain an aggregate function, that is, sum, max, min,
avg, because you select the type of aggregate when you define the metric.
To create a measure object
In Designer:
1. Using the "sales_actual " field from the Sales table, create an object.
2. Under the Properties tab, change the object's qualification to Measure
.
The SQL generated reads:
SELECT agrfunc (SALES_ACTUAL)FROM SALES
Defining a filter
The final element of this enterprise metric universe is the population
restriction, or filter. You use these filters in Performance Manager to limit
metrics when you create them.
In this example we use the filter that is used does not limit the query at all,
which means that the query returns a total of sales on a period by period
basis for all orders in the fact table, Sales. The SQL behind the restriction in
this case is simply a true statement and does not limit the scope of the query.
To define a filter
In Designer in the "Object Properties " dialog box, click the Properties tab.
1. In Designer in the "Object Properties " dialog box, click the Properties
tab.
2. Modify the object's qualification to Measure .
20 BusinessObjects Performance Manager XI 3.0 Administrator's Guide

The SQL reads as follows:
SELECT agrfun(SALES_ACTUAL)FROM SALES WHERE sales.start_date
between @PROMPT ('BEGIN_DATE','D',,mono,free) AND @PROMPT
('END_DATE','D','D',,mono,free) AND 1=1
Exporting the universe
Once you have created and saved the metric universe, you need to make it
visible to Performance Manager to used as the basis for metric creation. In
Designer, you create a connection for the metadata, then export the universe
to the dashboard and analytics metadata tables.
Before you begin creating metrics in Performance Manager you add this
universe to the list of available universes from the "Universes " page in the
Dashboard and Analytics System Setup.
Dimension table filters
Performance Manager Administrator's Guide
Metric Universes
2
When you create filter objects you are not restricted to using the fact table
on which the metric is based. You can also use other lookup/dimension
tables.
When you modify a universe by building filters on other tables, you need to
update Dashboard and Analytics metadata with the new structure and objects.
You do this from the Universes page in the Dashboard and Analytics System
Setup by selecting the saved universe and clicking Update. The changes
and new objects are then visible for metric creation.
In the example of a filter created against a dimension table, the metric SQL
generated is:
SELECT agrfunc(SALES_ACTUAL)
FROM SALES, PRODUCT
WHERE sales.start_date between
@Prompt('BEGIN_DATE','D',,mono,free)
AND @Prompt('END_DATE','D',,mono,free)
AND SALES.PRODUCT_ID = PRODUCT.PRODUCT_ID
AND PRODUCT.DESCRIPTION='Motorola Timeport'
Refer to the Dashboards and Analytics online help for information on updating
metrics with changes in target universes.
BusinessObjects Performance Manager XI 3.0 Administrator's Guide 21

Performance Manager Administrator's Guide
2
Metric Universes
Pre-selecting aggregate functions and measure parameter passing
You may not want users to be able to set aggregate functions or perhaps
using aggregate functions is not possible, for example, in calculating an
average, as in the following SQL statement:
Sum(sales.sales)/sum(sales.volume)
In either case, you need to pre-set aggregate functions.
In the above example, if an aggregate such as sum is wrapped around the
SQL, it is invalid. If, for a particular period, there is no volume, the SQL
generates a divide-by-0 error.
You need to create an Average Sales object in Designer and then edit the
definition of the object in the"Edit Properties" dialog box.
In this case you create an Average Sales object and the enter the following
under "Description".
AGGR=SUM;DESC=Calculates average sales and avoids divide by
zero errors.
The statement says that the aggregate is already chosen and it is a sum. It
also passes in a description - note that parameters are delimited with a
semi-colon.
Under"Select" you enter the folllowing:
decode(sum(sales volume),0,0,sum.sales_actual/sum(slaes.volume))
When you look at the universe content in Performance Manager you see
that Aggregation has been pre-set and it cannot be modified.
Complexities of the self-join
A self-join is used in any generated SQL that involves the table with the
self-join. Using the self-join, however, may not always lead to the desired
results. For example, if you want to calculate a rolling value for the volume
over the past three months, the date restriction needs to take into account
the past three months rather than the fixed one-month, if a monthly calendar
is used.
22 BusinessObjects Performance Manager XI 3.0 Administrator's Guide

Performance Manager Administrator's Guide
Metric Universes
To achieve the desired result you can use one of two methods that are
explained in the following examples:
Example: You replace the self-join with an object-based WHERE clause.
In Designer in the Edit Properties dialog box:
1.
In the Select box type: sales.sales_actual
2.
In the Where box type: sales.start_date between @Prompt('BE
GIN_DATE','D',,mono,free) AND
@Prompt('END_DATE','D',,mono,free)
Example: You modify the date restriction to change the period of
observation.
1.
In the Select box type: sales.volume
2.
In the Where box type: sales.start_date between month
add(@Prompt('BEGIN_DATE','D',,mono,free),-2) AND
@Prompt('END_DATE','D',,mono,free)
2
Date lookups
Period tables are often included in data warehouses, and are often required
in metric calculation because they contain time-related information.
A common fact table may not always contain true date fields, but may instead
contain date/period ids that provide the foreign key to a period/date dimension
table.
The figure below shows how the system universe can be made to
accommodate such a schema. Note the self-join, placed against the real
(actual) date field in the period table, or date table, in this example.
BusinessObjects Performance Manager XI 3.0 Administrator's Guide 23

Performance Manager Administrator's Guide
2
Metric Universes
You need to force performance manager to use the period table, in this case
the dates table, when generating metric SQL. The simplest way to do this
is to modify the tables associated with the measure objects to force use of
the date table hence forcing use of the self-join as shown as follows:
SELECT agrfunc(SALES2.SALES_ACTUAL)
FROM SALES, DATES
WHERE SALES2.DATE_ID = DATE.DATE_ID)
AND DATES.ACTUALDATE between @Prompt('BE
GIN_DATE','D',,mono,free)
AND @Prompt('END_DATE','D',,mono,free)
AND SALES2.DATA_ID = DATES.DATE_ID
Tip: Where there is no date field in your table (no ID) but there is a simplified
date such as a year field or a year + month field, you can use the following
syntax to transform the dates.
Example: For Oracle:
SELECT...
FROM...
WHERE... yyyy between @Prompt (to_char ('BEGIN_DATE','yyyy')
Example: For SQL Server and DB2
SELECT...
FROM...
WHERE... yyyy between @Prompt (year ('BEGIN_DATE'),...)
24 BusinessObjects Performance Manager XI 3.0 Administrator's Guide

Dimensions and slicing metrics
The principle of slicing or dimensioning a metric is to take a metric value, for
example, Sales Actual, and break it down by a dimension object, for example
by promotion, by country, or by category. At the SQL level this means
employing a GROUP BY clause.
The example below shows a dimension, Promo Description. Information
about the promotion name is stored in the promotion table, therefore, this
table is added to the universe and joined to the fact table (sales) on promo
tion_type.
Performance Manager Administrator's Guide
Metric Universes
2
Standard dimension objects are then created for promotion_id and pro
mo_description from the "System Setup"against the dimension table. You
add a Global Slice Name in the "Dimension Creation" dialog box. You can
place restrictions on users to allow them to see only specific values.
You then select a measure, an aggregation function, and a dimension to
create a metric. You use these metrics to in Performance Manager to create
an Interactive Metric Trend analytic. The Interactive Metric Trend, which is
a visual representation of the data.
A link appears below the legend that allows the values in the chart to be
sliced. When selected, the Sales Actual value is split into the distinct available
values for promotion. The figure below is an example of a sliced metric.
BusinessObjects Performance Manager XI 3.0 Administrator's Guide 25

Performance Manager Administrator's Guide
2
Metric Universes
Sliced metrics can be displayed well in Kiviat and radar diagrams.
Set-based Metrics
Set-based metrics
A set-based metric is a metric that contains a filter defined on a set, or the
behavior in a set, for example, Joiners of the Gold Set. This type of metric
is set to automatically refresh with the set at fixed processing time, rather
than an independent refresh.
Design principles and SET_SET_DETAIL[C/D]
When a set is built, the set information is saved in one of the tables shown
below.
The tables allow you to use different data types in set creation. If the set is
a list of customers, where the customer_id is text-based, the set tables
resemble the figure below.
26 BusinessObjects Performance Manager XI 3.0 Administrator's Guide

Performance Manager Administrator's Guide
Metric Universes
If customer_id is a character-based value, the set is stored in the
SET_SET_DETAILC table where the ID field is character type. If you create
a set of, for example, products where the Product_Key field is numeric, the
SET_SET_DETAIL table can be used. This also holds true for date-based
sets. If you create date-based segments the SET_SET_DETAILD table can
be used in the same way.
The structure of this table allows Set Analyzer and the performance
management framework to store membership details over time. Using this
information you can section the set members/non-members into various
sub-sets. The following is an example of a set of customers where the ID is
the customer's name. As this is a character-based key you view
SET_SET_DETAILC. The set is refreshed on a monthly basis starting on
the 1st January 1999.
2
Example: Period 1
Joiners: Tom, Colin, Fran
•
Members: Tom, Colin, Fran
•
Stayers:
•
Leavers:
•
When first refreshed, the set contains one row per customer in the set. The
SDATE value is set to the period time at which the set was refreshed. The
EDATE value is set to a default date, which means that the customer has
not yet left the set. This is a reserved date that implies an infinite date; in
the case of Set Analyzer the date used is 1/1/2999.
BusinessObjects Performance Manager XI 3.0 Administrator's Guide 27

Performance Manager Administrator's Guide
2
Metric Universes
At this point, the three entries represent three customers who have met the
set criteria for the period and are therefore Members who are Joiners.
Example: Period 2
Joiners: Edd
•
Members: Edd, Tom, Colin
•
Stayers: Tom, Colin
•
Leavers: Fran
•
In period two, Fran has left the set. Set Analyzer updates the EDATE value
with the current period date to represent this. Another customer, Edd, has
joined the set. Tom and Colin are still members at this time so their records
are not updated. They are Stayers.
Example: Period 3
Joiners: Fran
•
Members: Fran, Edd, Tom, Colin
•
Stayers: Edd, Tom, Colin
•
Leavers:
•
Period three shows only one change. Fran, the leaver for the second period,
has now met the criteria to be a set member again. Therefore a new row
is entered with the SDATE value as his time of joining and again the EDATE
28 BusinessObjects Performance Manager XI 3.0 Administrator's Guide

Performance Manager Administrator's Guide
Metric Universes
value as the default for a member. He can now be classified as a re-joiner
as there is historic information on his membership.
Example: Period 4
Joiners:
•
Members: Fran, Colin
•
Stayers: Fran, Colin
•
Leavers: Tom, Edd
•
Period 4 shows no new joiners, however, the EDATE values for Tom and
Ed have been updated to the current period date. This means they have
left the set, leaving Fran and Colin as stayers/members.
2
A static (non calendar-based) set does not store the history of a segment's
membership over time. This lack of history means you are able to show
the membership of the set and not be able to break this into segments.
A static set does not store history over time. It is a fixed view of a certain
period in time which explains why it is also known as a snap-shot. For
example, such a set can show all the customers who purchased goods
yesterday. This may change over time but information on who bought goods
three days earlier is not stored.
A hybrid of this is a 'vintage set', which is a set that never changes
membership, for example customers who purchased goods in January
1976. Therefore, unlike the time-based, dynamic segments, there are never
Joiners, Leavers, and so on. You need track only Members for metrics
based on such segments. The figure below shows how snapshot/vintage
sets are stored in the set membership tables.
BusinessObjects Performance Manager XI 3.0 Administrator's Guide 29

Performance Manager Administrator's Guide
2
Metric Universes
The universe for set-based metrics is similar to an enterprise metric
universe. The notable addition is the inclusion of SET_SET_DETAIL[C/D]
in the schema.
As with an enterprise universe, you can use a self-join to limit the metric
calculation to the period of metric observation. This can also be defined in
the measure Where clause if required.
The method of passing values into prompts as used in the date restriction
is also used to select the set against which the metric is to be calculated.
The self-join syntax rules apply as with the date prompts, for example, a
case-sensitive string match.
Creating set-based metrics
You create set-based metrics Performance Manager in the same manner in
which you create enterprise metrics. With set-based metrics you have a
choice of the sets and subsets on which you base the metrics.
For example, in the set Collector, a dynamic set with membership history,
you can select behavioral subsets, such as Members, Joiners, Stayers, and
Leavers.
Creating the universe for set-based metrics
The universe for set-based metrics is similar to enterprise metric universes.
The notable addition is the inclusion in SET_SET_DETAIL[C/D] in the
schema. The figure below shows a universe that incorporates set tables.
30 BusinessObjects Performance Manager XI 3.0 Administrator's Guide
Performance Manager Administrator's Guide
Metric Universes
As with the enterprise universe, you can use a self-join to limit the metric
calculation to the period of metric observation. The period of metric
observation can also be defined in the measure WHERE clause if required.
The method of passing values into prompts as used in the date restriction
is also used to select the set against which the metric is calculated. The
following example shows the self-join syntax. The string match is
case-sensitive.
Example: Self-join
set_setdetail.setversion_id=@Prompt('SET_VER
SION','N',mono,free)
2
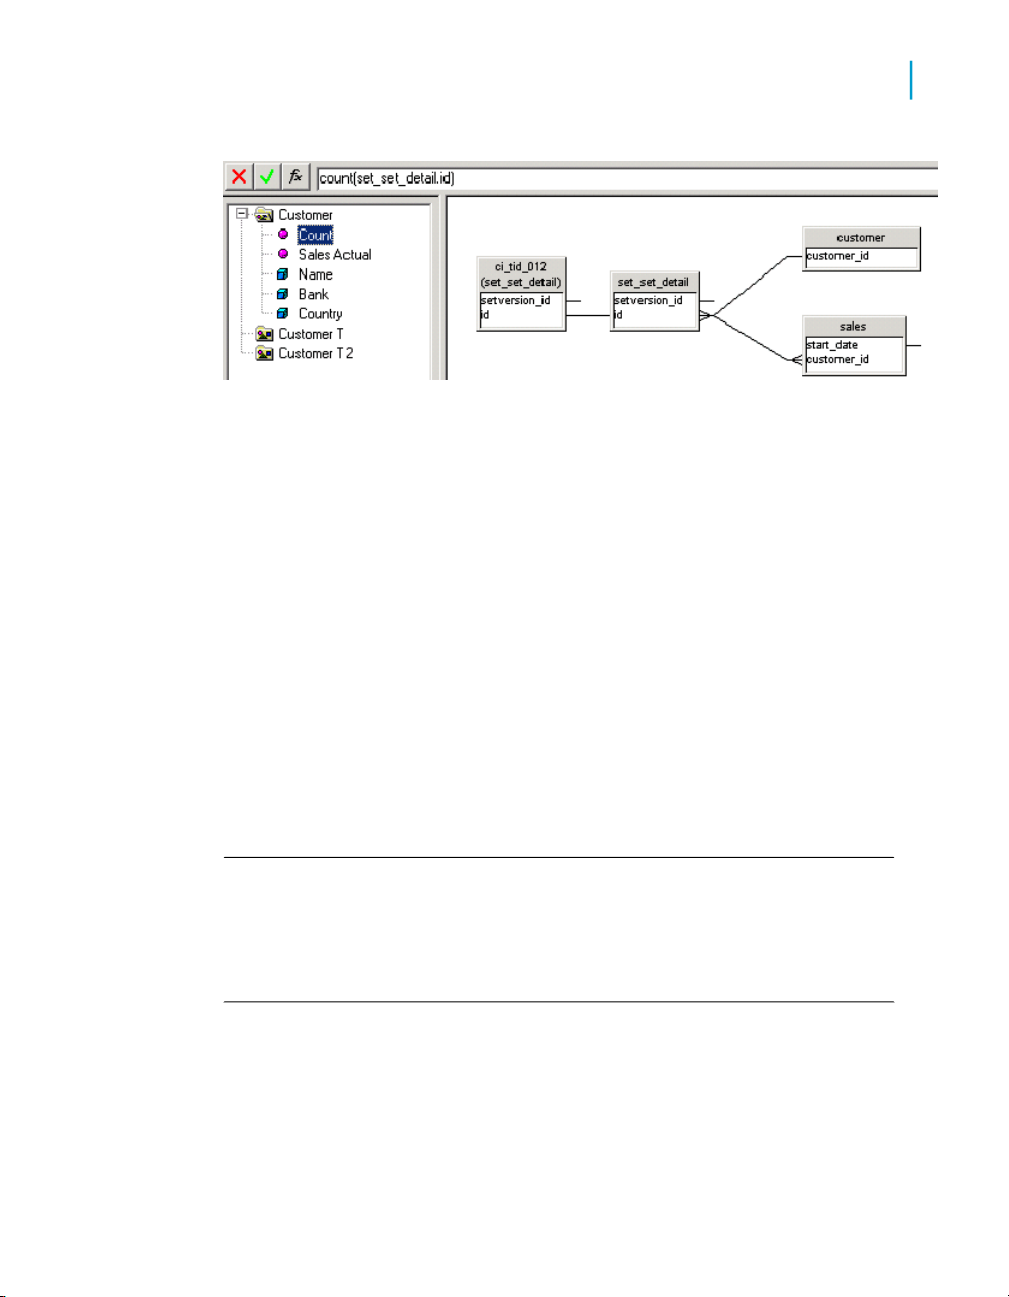
The measure Sales Actual is defined for set-based metrics in the same
way as for enterprise universe. However, a measure called count is
introduced in the set -based universe. This example shows the measure
definition of count. Note the aggregate is preselected and the count is of
the unique id, in this example, customer_id.
Example: Membership count measure definition
1.
In the Description box type: AGGR=SUM; COUNT=Y
2.
In the Select box type: count(set_set_detail.id)
Using filter objects in set-based metrics
In a set-based universe, you use filter objects to define subsets such as
Members, Joiners, and Leavers. You can copy them from the example
universe since the syntax is Set Analyzer-specific and does not change. The
figure below shows three separate classes. These class names directly relate
BusinessObjects Performance Manager XI 3.0 Administrator's Guide 31

Performance Manager Administrator's Guide
2
Metric Universes
to the subject area that holds the sets in Set Analyzer. The suffixes T and
T2 denote the type of membership that can be monitored.
The members filter under Customer is used with non-dynamic, snapshot
sets. No membership date restrictions are needed because if the customers
are currently in the set they are entered in the set detail table. If they are not
currently in the set they are not entered in the set details table. In this case,
only a restriction on the set id is required. For example, "I want to have the
metric value for all the people in the XXX set."
Defining members for a snapshot set
Name=Member
1. In the Description box type: FILTER=M
2. In the Where box type:
set_set_detail.setversion_id=@Prompt('SET_VER
SION','N',,mono,free)
The filters under the Customer T class are used for dynamic sets with
time-based history. The members definition illustrates use of begin date and
end date prompts. In this case, the dates indicate whether the customer
entered the set in the current period or an earlier one, and whether or not
he left after the end date of the current period. These dates determine whether
the customer is in the set during the observation period.
32 BusinessObjects Performance Manager XI 3.0 Administrator's Guide

Defining membership for a time-based set
1. In the Description box type: FILTER=M
2. In the Where box type:
set_set_detail.sdate
<=@Prompt('TSET_END_DATE','D',,mono,free) and
set_set_detail.edat > @Prompt('TSET_END_DATE','D',,mono,free)
Once you have saved the universe you can make it available to the
performance management framework as you would an enterprise universe.
Insight into subsets
Below is the SQL for each of the four basic subset filters:
• Members
• Joiners
• Stayers
• Leavers
Performance Manager Administrator's Guide
Metric Universes
2
In the case of Same-as-Set metrics,
TSET_END_DATE
and
TSET_BEGIN_DATE
contain the same values as the
BEGIN_DATE
and
END_DATE
prompts used in the joins described earlier. However, the nature of
independent set-based metrics may mean that the dates passed to the set
differ from those passed to the metric.
Below are descriptions of the filters in the Customer T section of the universe.
BusinessObjects Performance Manager XI 3.0 Administrator's Guide 33

Performance Manager Administrator's Guide
2
Metric Universes
Members
FILTER=M; DESC=Members at the end of the period
CI_TID_01.sdate <= @Prompt('TSET_END_DATE','D',,mono,free) and
CI_TID_01.edate > @Prompt('TSET_END_DATE','D',,mono,free)
Member (p) is a Member at the end of the period (p).
Joiners
FILTER=J; DESC=Members at the end of the period that were not members
at the end of the previous period
CI_TID_01 = @Prompt('TSET_BEGIN_DATE','D',,mono,free)
Joiner (p) is a member at the end of the period (p) that was not a member
at the end of the previous period.
Stayers
FILTER=S; DESC=Members at the end of the period that were members at
the end of the previous period
CI_TID_01.sdate < @Prompt('TSET_BEGIN_DATE','D',,mono,free)
and CI_TID_01.edate > @Prompt('TSET_END_DATE','D',,mono,free)
Stayer (p) is a member at the end of the period (p) that was a member at
the end of the previous period.
Leavers
FILTER=L; DESC=Non-members at the end of the period that were members
at the end of the previous period
CI_TID_01.edate = @Prompt('TSET_BEGIN_DATE','D',,mono,free)
Leaver (p) is a Non Member at the end of the period (p) that was a member
at the end of the previous period.
34 BusinessObjects Performance Manager XI 3.0 Administrator's Guide

Example:
You can apply a quarterly metric to a segment that identifies monthly high
revenue customers to show the total revenue for these customers. These
are calculated using the filters in Customer T2.
Types of subsets
Below are the SQL definitions for each of the subset types followed by a
description of what the SQL does.
Members
FILTER=M; DESC=Members at the end of the period
CI_TID_01.sdate <= @Prompt('TSET_END_DATE','D',,mono,free) and
CI_TID_01.edate > @Prompt('TSET_END_DATE','D',,mono,free)
In the scenario shown below the customer joined in p2 and left the segment
at p9, and was definitely a member during the period of observation (p4, p5
and p6).
Performance Manager Administrator's Guide
Metric Universes
2
BusinessObjects Performance Manager XI 3.0 Administrator's Guide 35

Performance Manager Administrator's Guide
2
Metric Universes
Joiners
FILTER=J; DESC=Members at the end of the period that were not members
at the end of the previous period
CI_TID_01.sdate <= @Prompt('TSET_END_DATE','D',,mono,free) and
CI_TID_01.edate > @Prompt('TSET_END_DATE','D',,mono,free) and
CI_TID_01.id not in ( select set_set_detail.id from
set_set_detail where set_set_detail.sdate < @Prompt('TSET_BE
GIN_DATE','D',,mono,free) and set_set_detail.edate >=
@Prompt('TSET_BEGIN_DATE','D',,mono,free) and set_set_de
tail.setversion_id = @Prompt('SET_VERSION','N',,mono,free) )
Joiners must:
Not be present during the start of the period of observation.
•
• Be present at the end of the period of observation for the metric
If both these criteria are met the customers are classified as joiners. In the
diagram below, the period of observation starts at p4 and ends after p6. A
joiner is, then, a customer who is not present in p3, but who is present at the
end of p6.
36 BusinessObjects Performance Manager XI 3.0 Administrator's Guide

Stayers
Performance Manager Administrator's Guide
Metric Universes
FILTER=S; DESC=Members at the end of the period that were members at
the end of the previous period
CI_TID_01.sdate <= @Prompt('TSET_END_DATE','D',,mono,free) and
CI_TID_01.edate > @Prompt('TSET_END_DATE','D',,mono,free) and
CI_TID_01.id in ( select set_set_detail.id from set_set_detail
where set_set_detail.sdate < @Prompt('TSET_BE
GIN_DATE','D',,mono,free) and set_set_detail.edate >=
@Prompt('TSET_BEGIN_DATE','D',,mono,free) and set_set_de
tail.setversion_id = @Prompt('SET_VERSION','N',,mono,free) )
To be classified as Stayers customers must be present at the start and at
the end of the period of observation. In the diagram below, stayers are
customers who are present at the start of p4 and at the end of p6.
2
Leavers
FILTER=L; DESC=Non Members at the end of the period that were members
at the end of the previous period
CI_TID_01.id not in ( select set_set_detail.id from
set_set_detail where set_set_detail.sdate <=
@Prompt('TSET_END_DATE','D',,mono,free) and set_set_detail.edate
> @Prompt('TSET_END_DATE','D',,mono,free) and set_set_de
tail.setversion_id = @Prompt('SET_VERSION','N',,mono,free) )
BusinessObjects Performance Manager XI 3.0 Administrator's Guide 37

Performance Manager Administrator's Guide
2
Metric Universes
and CI_TID_01.sdate < @Prompt('TSET_BEGIN_DATE','D',,mono,free)
and CI_TID_01.edate >= @Prompt('TSET_BE
GIN_DATE','D',,mono,free)
Leavers are present at the start of the period of observation but not at the
end. In the diagram below, leavers are present at the start of p4 and absent
at the end of p6.
Using multiple fact tables
Multiple fact tables are easily handled in the metric universe. The following
figure shows the customer subject area extended to encompass the
complaints fact table.
38 BusinessObjects Performance Manager XI 3.0 Administrator's Guide

Performance Manager Administrator's Guide
Metric Universes
As with the sales table, a self-join, or object WHERE clause is required to
enforce period-by-period calculations. Measure objects that become the
basis for metrics are also defined in the same way as the sales fact.
2
Multiple set subject areas
To create metrics against multiple subject areas defined in Set Analyzer in
your universe you need to create new class structures for products and a
supporting schema to query the product set information against the fact table.
The figure below shows a completed system universe that allows metrics to
be built against sets of customers and sets of products. The product key is
character-based, therefore, SET_SET_DETAILC is used to hold set
membership information.
BusinessObjects Performance Manager XI 3.0 Administrator's Guide 39

Performance Manager Administrator's Guide
2
Metric Universes
The schema for product is very similar to that of the customer subject area.
All prompt syntax is identical, and the only difference is the use of the aliases
of CI_PERIOD and the sales table, and the inclusion of the product table.
There is no limit to the number of subjects that can be represented in a
system universe, but Business Objects recommends that you create separate
universes to simplify viewing and editing very large schemas.
40 BusinessObjects Performance Manager XI 3.0 Administrator's Guide

Advanced Topics
Metrics on metrics
Once you have stored metric information in the performance management
system tables, you can use the stored values as the basis for further metric
calculations. You load the metric metadata tables into the system universe
and create measure objects against these tables. Using metrics based on
metrics allows you to increase performance significantly. For example, if a
metric for sales and a metric for number of transactions have been defined,
rather than calculate average sales per transaction against the fact table,
the metric of sales can be divided by the metric for transaction, thus
calculating against the aggregated metric tables only.
Example: Metric of de-seasonalized sales
InDesigner the"Edit Properties " dialog box reads as follows:
Name: De-seasonalized Sales
•
Performance Manager Administrator's Guide
Metric Universes
2
Type: Number
•
Description: AGGR=SUM; LIST=N;DESC=Apply a MA2x12 moving average
•
on Monthly Sales metric. Don't calculate the last 6 periods.
Select:sum(probe_value_sta.prove_value*ci_peri
•
oc_stat.weight1)/sum(ci_period_stat.weight2)
Where:probe_value_sta.probe_id=8 AND ci_period_stat.id=1
•
AND period.period_type=4 AND period.period_overall
<=(ci_prove.end_overall-6)
The metric takes the value of the sum of sales metric, metric id 8, and
computes a MA2x12 smoothing using the weightings stored in the statistical
roll up table, CI_PERIOD_STAT. The SQL is hard_coded with the IDs for the
metric, the period type, and the smoothing to apply.
Note: This can cause additional overhead should metrics be changed in the
future.
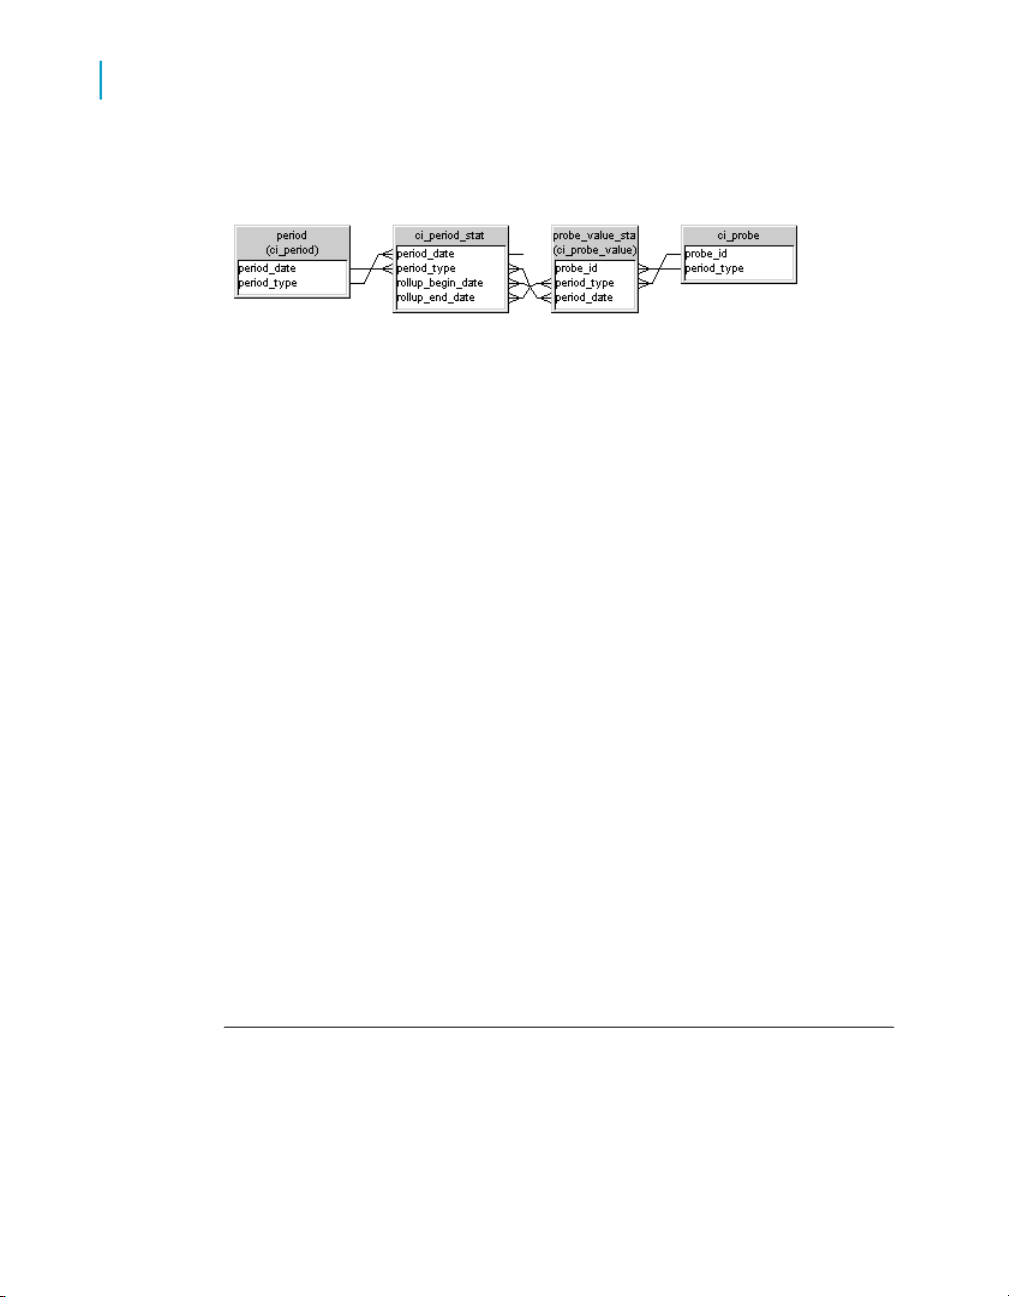
The figure below shows the tables with the appropriate joins to calculate
metrics against metrics using the statistical transformation tables. The self-join
BusinessObjects Performance Manager XI 3.0 Administrator's Guide 41
Performance Manager Administrator's Guide
2
Metric Universes
on the table ci_period_stat.period_date follows the same syntax as the
fact table self-joins.
Tip: When you refresh metrics first refresh the initial metric and the refresh
the metric that is based on the initial metric. Business Objects recommends
that you create a rule to refresh the second metric each time the first is
refreshed.
Metrics functions in the rules engine
The rules engine contains a function builder that allows access to metric
values. You query the metric values directly and do not use the system
universe.
You define metrics as variables to be used as a condition in the "Condition
Formula Editor "that you access from the "Rules " page in Performance
Manager .
Metric attribute suffixes allow the metrics, when defined as variables, to be
used in a condition.
metric1.id - returns the id of the metric.
•
metric1.value - returns the latest value of the metric.
•
These can then be used in the metric functions.
Example:
MetricValue(metric1.id) > MetricValue(metric1.id, -1)
If the current value of metric1 is greater than the value of metric 1 for the
last period.
Example:
MetricValue(metric1.id) > MetricValue(metric1.id, -12)*1.1
42 BusinessObjects Performance Manager XI 3.0 Administrator's Guide

Performance Manager Administrator's Guide
Metric Universes
If the current value of metric1 has increased by 10% over the value of
metric1 twelve months earlier.
Example:
ForecastCubic(MetricValues(metric1.id, 6), 7) > MetricValue(met
ric1.id)
Take the last six values of metric1 and forecast the seventh point using a
cubic line fit, then compare values to see if the current metric value is below
this forecast.
Configuring universes for process control charts
This section explains how to create a universe for control chart analysis. You
must have a working knowledge of process control charts and universe
design.
The new performance management process control engine uses a Business
Objects universe as metadata to access the underlying data source. The
engine is capable of working with data at a transactional level, as well as at
any level of aggregation, but there are a number of requirements that must
be met by the data source to enable the process control engine.
2
The examples used below are taken from the manufacturing sample universe
included with the performance management installation.
Universe configuration
The performance management process control engine uses a number of
elements from a specially configured BusinessObjects universe to access
the appropriate data for each control chart.
To create a universe for the process control engine, start by inserting the
appropriate fact tables that contain the transactions or aggregate values that
you chart. Each fact table needs a self-join on its timestamp to allow the
performance management framework to select data by date. Measures are
then organized into classes which are translated into subject areas.
Dimension objects for breakdown variables are also included in the
appropriate classes. Conditions are created and combined to create filters
BusinessObjects Performance Manager XI 3.0 Administrator's Guide 43

Performance Manager Administrator's Guide
2
Metric Universes
for control charts. Any control chart that needs to draw data from two fact
tables (p, np, or u charts) needs to include filters that are based on a common
dimension that joins to both fact tables.
Measures
Measure objects in the universe are used by control charts to calculate the
actual data points on the control chart. Each control chart uses either one
or two measures to calculate its data points. During configuration, you select
the measure object or objects that are used in the control chart calculation.
Then, you organize these objects in classes that are translated into subject
areas.
Each measure comes from a fact table that contains the raw data. This raw
data may be at transactional level or aggregated. In the manufacturing
example, the tables individual_measurement, defect, reject, and inspection
are used as fact tables. For example, the fact table individual_measurement
is used to construct variable control charts. In the figure shown below a
number of measure objects have been created in a class called Manufacturing
Variable.
Depending on the nature of the data, it may or may not be necessary to
include aggregate functions in the measure objects themselves. If the values
in the table are already sufficiently aggregated that no further aggregation
is necessary, as in the individual_measurement table, then no
aggregation function is included in the object.
Self-joins
Each fact table must include a self-join that is used to select values during
sampling. The self-join is on the date stamp column of the fact table and
follows this exact syntax. Changes in case and spaces can cause this self-join
to fail.
In the Expression box of the Edit Join dialog box type the following SQL:
<date stamp column> between
@Prompt('BEGIN_DT','D',,mono,free) AND
@Prompt('END_DT','D',,mono,free)
44 BusinessObjects Performance Manager XI 3.0 Administrator's Guide

Performance Manager Administrator's Guide
Metric Universes
Breakdown variable
Breakdown variables are used to automatically generate control charts for
each value in a dimension. For each breakdown variable that is used, a
dimension object needs to be created in the appropriate class in the universe.
In the manufacturing example, Reject Type is a breakdown variable in the
Manufacturing Reject class. The breakdown variable can come directly from
the fact table, if appropriate, or it may be an object that is based on a column
in a joined table. In the case of Reject Type the object is based on
reject_type.name from the joined reject_type table.
2
Filters
Filters are used to limit a particular control chart (or set of control charts for
a breakdown variable) to a particular set of data. Control chart filters are
based on combinations of conditions that are created in the universe. In the
manufacturing example, the conditions include those that limit control charts
to particular product type, as shown below.
The conditions can be based on columns directly on the fact table, or any
table that is joined to the fact table. When designing conditions, bear in mind
that control chart filters that are configured in Performance Management can
combine conditions together.
For p, np, and u charts you can draw the measures that are used in
calculating control chart points from two different fact tables. In p charts, for
example, the value on the control chart is calculated based on the number
BusinessObjects Performance Manager XI 3.0 Administrator's Guide 45

Performance Manager Administrator's Guide
2
Metric Universes
of rejects, which may come from one table, and the number of inspections,
which may come from another table. When two tables are involved they both
need to be constrained by a common filter that is based on common
conditions.
In the manufacturing example the Manufacturing Reject class uses measures
from two different tables. For number of rejects the Nb Rejected object are
used, which is based on the reject.nb_rejected column. For the number of
inspections the Nb Inspections object is used, which is based on the
inspection.nb_inspected column. The common filters are based on the name
field in common dimension table item.
Systematic sampling
If systematic sampling is required in a particular subject area, a dimension
object is needed in the appropriate class based on the timestamp column in
the fact table. For the manufacturing example the Measurement Time object
in the Manufacturing Variable class is based on the individual_mea
suremt.measuremt_time column.
Resolving loops in the universe
The universe design to support the process control engine can often result
in loops in the universe. There are two ways to deal with loops:
table aliases
•
contexts
•
46 BusinessObjects Performance Manager XI 3.0 Administrator's Guide

Performance Manager Administrator's Guide
Metric Universes
A table alias was used in the manufacturing universe to resolve a loop. In
this case the defect_type and item tables both need to be joined with the
defect and reject tables creating a loop. This loop has been resolved by
aliasing defect_type as reject_type for the join with the reject table.
An alternative approach, which may be necessary in some cases, is to use
contexts to resolve the loop. For example, the use of two fact tables for
rejects and inspections may result in a loop if a number of filter and
breakdown objects are required from different dimension tables. One context
can be named for the tables included in the rejects query, and one context
for the inspection query.
2
Note: Remember to include the self-joins in the relevant context.
Database requirements
The database design must meet the following two requirements if it is to be
used for process control charts:
Each fact table must include a date stamp in the date/time format of that
•
database.
If two tables are used in p, np, or u charts then they must have a common
•
dimension table that can be used for a common filter.
BusinessObjects Performance Manager XI 3.0 Administrator's Guide 47

Performance Manager Administrator's Guide
Metric Universes
2
48 BusinessObjects Performance Manager XI 3.0 Administrator's Guide

Performance Manager Setup and Administration Online Help
3

Performance Manager Setup and Administration Online Help
3
Dashboard and analytic applications
Dashboard and analytic applications
BusinessObjects Dashboard and Analytics connects goals, metrics, and
people in order to drive improved management, analysis, and action across
the organization. Metrics offer up-to-the-minute snapshots of your key process
indicators (KPIs) and tracking goals allows you to monitor day-to-day activity
results.
Business Objects offers the following tools to help you mine your data for
trends:
• Dashboard Builder
• Performance Manager
• Set Analysis
• Predictive Analysis
• Process Analysis
What is Dashboard Builder?
Dashboard Builder is a BusinessObjects Dashboard and Analytics application
that helps you manage and track your company's performance using analytics
and dashboards, as well as schedule the refresh of metrics, sets, control
charts, Predictive models and analytics.
What is Performance Manager?
BusinessObjects Performance Manager helps organizations align actions
with strategy. Through setting goals and tracking performance in scorecards,
people can focus their efforts, collaborate with others, and follow
recommended actions to improve organizational performance.
What is Predictive Analysis?
BusinessObjects Predictive Analysis quickly uncovers key business drivers
from your data and forecasts future business conditions. It helps people
50 BusinessObjects Performance Manager XI 3.0 Administrator's Guide

Performance Manager Setup and Administration Online Help
Deployment of Dashboard and Analytics tools to your organization
make proactive decisions more easily by providing insights via easy-to-use
dashboards across the organization.
What is Process Analysis?
BusinessObjects Process Analysis can be used for several purposes.
• It helps you automate the mechanics of quality control.
• It enables organizations to support quality improvement initiatives by
automatically tracking quality variables throughout the enterprise.
• It helps uncover specific business processes where there is variation and
identify opportunities for improvement, by providing powerful web-based
quality management and automated control charts and alarms.
What is Set Analysis?
BusinessObjects Set Analysis helps organizations define, track and analyze
segments that drive the success of business activities.
3
Deployment of Dashboard and Analytics
tools to your organization
Before users in your organization can start working with Dashboard and
Analytics applications, you need to do the following tasks.
Mandatory tasks
• Create the Performance Manager repository.
The Performance Manager repository stores the metrics, goals and
calendars leveraged across your deployment.
• Define the system users.
System user accounts initialize the Dashboard and Analytics servers and
enable the Dashboard and Analytics application engines.
• Connect to a universe.
BusinessObjects Performance Manager XI 3.0 Administrator's Guide 51

Performance Manager Setup and Administration Online Help
3
Deployment of Dashboard and Analytics tools to your organization
Universes provide the semantic layer that maps familiar business terms
to your corporate data sources.
Note: Users can also define metrics manually. To find out how to do this,
see the Performance Manager documentation.
• Define calendars.
The calendar time periods you define are used to build the aggregated
measure results for metrics over time. This allows users to perform
time-series analysis on KPIs. You can create standard calendars or import
custom calendars adapted to your business processes.
Optional tasks
For more powerful analysis, you can also:
• Associate users to dimensions.
Create associations to allow users to analyze sliced metrics, where the
value for the metric is broken down by the values on a dimension, and
lets you secure dimensions by granting access to slices to users, so that
specific users can only see results for certain slices.
For example, you could select the [Sales] metric and slice it by the
[Region] dimension in order to analyze sales per region. You could then
secure the [Region] dimension so that users working in a specific regional
sales office could only see sales results for their region.
• Apply statistical calculations such as moving average, difference, or rollup
to selected calendars.
You use statistical calculations for smoothing and aggregating time-series.
For more information, see the chapter in the documentation about
Performance Manager calendars.
Related Topics
• Overview of the Dashboard and Analytics deployment on page 63
• Moving averages in calendars on page 100
• Rollups in calendars on page 108
• The Performance Manager repository on page 62
• Dashboard and Analytics system users on page 74
• Metric universes on page 76
• Analytics calendars on page 93
52 BusinessObjects Performance Manager XI 3.0 Administrator's Guide

Performance Manager Setup and Administration Online Help
• Sliced metric dimensions on page 85
Performance Manager servers
The following table provides a description of each Performance Manager
server:
DescriptionServiceServer name
Performance Manager servers
3
AADashboard
AAIProfiler
AARepomgt
Dashboard engine
Analytics serverAAAnalytics
Metrics engineAAMetrics
Individual Profiler
engine
Repository manager
Rules engineAARules
Renders dashboards created in Dashboard Builder.
Renders the analytics by querying the
metrics metadata and then generating
the desired visualization in the format
of the selected analytic.
Works like an ETL tool to extract each
metric value, aggregate it, and then
load it into the metadata layer on the
Performance Manager repository.
Used by the Individual Profiler analytic.
Manages the Performance Manager
repository – including user security and
privileges, updates to the system parameters, and writing new metrics and rules
back to the repository.
Evaluates conditions placed against
metrics, goals, sets and then outputs
sending events to other components
AAQueryManager
BusinessObjects Performance Manager XI 3.0 Administrator's Guide 53
Set Analysis
query manager
SPC engineAASPC
Performs Set Analysis queries and
builds and processes sets.
Used by Process Analysis.
Note: The SPC alerts are actioned
upon and handled by AARules

Performance Manager Setup and Administration Online Help
3
Performance Manager servers
DescriptionServiceServer name
Predictive Analy-
PAServer
Related Topics
• Individual Profiler portrait properties on page 122
sis mining engine
Used by Predictive Analysis. For more
information, see the Predictive Analysis
documentation.
Performance Manager server options
In Dashboard and Analytics Setup > Parameters > Options, set the
following options:
• Mail Parameters
These parameters contain details of the Dashboard and Analytics SMTP
server, port number, and email address used to send automated emails
for alerts, rules, and generated lists.
• Web Parameters
These parameters contain details of the web server including the port
number, host name, and the login URL.
• General Parameters
These parameters contain details of date and number formats applied
across Dashboard and Analytics applications, SQL query optimization
parameters, Individual Profiler query limits, and the frequency for
information on external events stored in the Central Management Server
to be written to the Performance Manager repository.
• Scheduler Parameters
These parameters contain details of the directory used to cache scheduler
processes and the user account associated with those processes.
• Database Parameters
These parameters contain details of the minimum number of database
connections you wished to be kept open for a specific Dashboard and
Analytics engine.
54 BusinessObjects Performance Manager XI 3.0 Administrator's Guide

Performance Manager Setup and Administration Online Help
Performance Manager servers
Setting mail parameters for Dashboard and Analytics applications
You need to specify mail parameters so that users can use the email features
within Dashboard and Analytics applications. For example, users can build
rules, alerts, and lists that generate emails and have the ability to email some
of the analytics.
1. Go to Dashboard and Analytics Setup > Parameters > Options.
2. In the "Mail Parameters" section, configure the following parameters:
• "Outgoing SMTP server"
Type the name of the Dashboard and Analytics server from which
automated emails, such as email alerts and email lists, are sent.
• "SMTP Port Number"
Enter the port number of the SMTP (Simple Mail Transfer Protocol)
server.
• "From Address"
3
Type the email address of the SMTP server that appears in the "From"
field in email messages.
• "Reply to Address"
Type the address to which automatic replies are sent. This is usually
the same as the "From Address".
3. Click Apply.
Any modifications you made are applied the next time you restart the
Dashboard and Analytics server.
Specifying web parameters for Dashboard and Analytics applications
By default, the web server used for Dashboard and Analytics applications is
the same server on which Dashboard and Analytics is installed. The "Web
Parameters" options allow you to specify a remote web server. If you
performed a custom installation and defined a custom URL for end users to
BusinessObjects Performance Manager XI 3.0 Administrator's Guide 55

Performance Manager Setup and Administration Online Help
3
Performance Manager servers
use to access the InfoView login page, then you need to type the custom
URL you defined here.
Note: For information on performing a custom installation, see the
BusinessObjects Enterprise installation guide available at: http://support.busi
nessobjects.com/documentation.
1. Go to Dashboard and Analytics Setup > Parameters > Options.
2. In the "Web Parameters" section, configure the following parameters:
• "Web server host name"
Type the name of the web server that host Dashboard and Analytics
applications.
• "Web server port number"
Enter the port number of the host web server.
• "Performance Manager URL"
Type the URL that end users use in their web browser to launch the
InfoView home page.
3. If you want to process XLS transformations on the client machines used
by end users across your deployment, activate Push XLS
transformations to the client.
You can opt to process the XSL transformations, for example for SVG
format analytics, to the client instead of processing them on the server.
This helps lighten the load on the server, by passing the cost of the
transformation onto the client.
We recommend that you compare performance of processing the XLS
transformations on the client against processing the XLS transformations
on the server, in order to make the best decision for your deployment.
The optimum choice can differ depending on the client machines used
on your deployment and the number of concurrent users taxing the server.
Note: We recommend that you compare performance of processing the
XLS transformations on the client against processing the XLS
transformations on the server, in order to make the best decision for your
deployment. The optimum choice can differ depending on the client
machines used on your deployment and the number of concurrent users
taxing the server.
4. Click Apply.
56 BusinessObjects Performance Manager XI 3.0 Administrator's Guide

Performance Manager Setup and Administration Online Help
Performance Manager servers
Any modifications you made are applied the next time you restart the
Performance Manager server.
General parameters for Dashboard and Analytics applications
The "General Parameters" options allow you to:
• specify settings for number and date formats displayed on dashboards
• optimize SQL query processing
• limit the size of Individual Profiler queries
• specify how often the data for external events stored on the Central
Management Console (CMC) is sent to the Performance Manager
repository.
Note: External events defined on the CMC are used in Performance
Manager rules or alerts to trigger specific actions. For information about
including external events on the CMC, see the BusinessObjects Enterprise
administration documentation.
Related Topics
• Specifying general parameters in Dashboard and Analytics Setup on
page 57
3
Specifying general parameters in Dashboard and Analytics Setup
1. Go to Dashboard and Analytics Setup > Parameters > Options.
2. In the "General Parameters" section, configure the following parameters:
• "Number Format"
Select a number format for analytics and dashboards.
• "Date Format"
Select the date format for analytics and dashboards.
• "Maximum Number of Columns for Optimized SQL"
Select a number to apply to SQL queries for analytics and documents.
The option allows Dashboard and Analytics to group SQL from columns
in the same table, for the number of columns you specify, and so
optimizes the calculation process.
• "Individual Profiler Maximum Query Size"
BusinessObjects Performance Manager XI 3.0 Administrator's Guide 57

Performance Manager Setup and Administration Online Help
3
Performance Manager servers
Select the limit for the maximum number of rows returned for an
Individual Profiler query.
• "BusinessObjects Enterprise Events Polling Time"
Select the amount of time between two polling events, measured in
seconds. The option specifies how often Dashboard and Analytics
checks for an event on the Events server in the CMC, and therefore
ensures that any new external events on the CMC are written to the
Performance Manager repository for use in rules and alerts.
3. Click Apply.
Any modifications you made are applied the next time you restart the
Dashboard and Analytics server.
Related Topics
• Individual Profiler portrait properties on page 122
Specifying scheduler parameters for Dashboard and Analytics applications
If their security profile allows, end users can schedule Dashboard and
Analytics tasks, such as refreshing metrics. As an administrator, you can
specify the location of the directory used to cache scheduler processes and
specify the user account associated with the processes.
1. Go to Dashboard and Analytics Setup > Parameters > Options.
2. In the "Scheduler Parameters" section, type the appropriate information
in the following text boxes:
• "Scheduler working directory"
The directory path that appears in the text box comes from information
provided at installation.
• "Scheduled programs will run under this user account"
The user name and password used should be for machine on which
you installed the Dashboard and Analytics applications.
Note: If you change the parameters, any existing schedules become
incorrect. To update the definition of existing schedules to the new
schedule parameters, run the "Scheduled Programs""Check &
58 BusinessObjects Performance Manager XI 3.0 Administrator's Guide

Performance Manager Setup and Administration Online Help
Performance Manager servers
Cleanup" tool at Dashboard and Analytics Setup > Tools > Check
Integrity and Cleanup.
3. Click Apply.
Any modifications you made are applied the next time you restart the
Dashboard and Analytics server.
Specifying database parameters for Dashboard and Analytics applications
The "Database Parameters" allow you to specify the minimum number of
database connections kept open for a specific Dashboard and Analytics
engine. This optimizes performance.
1. Go to Dashboard and Analytics Setup > Parameters > Options.
2. In the "Database Parameters" section, click the drop-down arrow in the
text box on the right.
The list of Dashboard and Analytics engines appears.
3
3. Select the engine for which you want to specify the minimum number of
open database connections:
• Analytics
The Analytics server renders the analytics by querying the metrics
metadata and then generating the desired visualization in the format
of the selected analytic.
• Repository Management
The repository manager manages the Performance Manager repository
including user security and privileges, updates to the system
parameters, and writing new metrics and rules back to the repository.
• Process Analysis Engine
Process Analysys uses this engine.
• Metrics Engine
The metrics engine works like an ETL tool to extract each metric value,
aggregate it, and then load it into the metadata layer on the
Performance Manager repository.
• Mining Engine
BusinessObjects Performance Manager XI 3.0 Administrator's Guide 59

Performance Manager Setup and Administration Online Help
3
Performance Manager servers
Predictive Analysis uses this engine.
• Rules Engine
The rules engine evaluates conditions placed against metrics, goals,
sets and then outputs sending events to other components.
• Query Manager
The query manager performs Set Analysis queries and builds and
processes sets.
• Profiler
The Individual Profiler uses this engine.
4. Enter the number of connections you want open concurrently for the
selected engine into the "Minimum Number of Database Connections
Kept Open" text box.
5. Click Apply.
Any modifications you made are applied the next time you restart the
Dashboard and Analytics server.
Server caching parameters
The cache refresh period settings determine how often Dashboard and
Analytics refreshes the server caches with the latest values on the
Performance Manager repository and the Central Management Server (CMS).
In multi-node deployments, it is important to set the cache refresh and
clean-up periods to ensure that the Dashboard and Analytics servers across
your deployment reflect the same definitions of metrics and analytics to end
users.
Cache refresh and clean-up settings
You can specify the following cache refresh periods and clean-up periods:
• "Metadata Cache Refresh Period" – used to cache metrics, goals, and
sets. For example, you look at a speedometer the values displayed come
from this cache.
• "App Designer Cache Refresh Period" – used to cache the XML
definition of dashboards
60 BusinessObjects Performance Manager XI 3.0 Administrator's Guide

Performance Manager Setup and Administration Online Help
Performance Manager servers
• "Server Session Cache Clean-up Period" – used to cache session
information
• "Corporate Dashboard Cache Refresh Period" – used to cache
corporate dashboards
Modifying a cache refresh or clean-up period
1. Go to Dashboard and Analytics Setup > Parameters > Caching.
2. In the text box next to the option you want to modify, type the number of
minutes you want to set as the frequency for the cache refresh or clean-up.
3. Click Apply.
The settings are applied immediately.
Dashboard and Analytics launch errors
If you launch Dashboard and Analytics and an error message appears that
says that you cannot connect to Dashboard and Analytics, it is for one of the
following reasons:
• Some of the Dashboard and Analytics servers are stopped or disabled.
• The Initialization User that creates the Dashboard and Analytics server
proxies was defined inconsistently in the Central Management Server,
InfoView, and the InitConfig.properties file.
3
Verifying the Dashboard and Analytics servers
1. Log into the Central Management Console (CMC), and then click Servers.
2. Verify that all the Dashboard and Analytics servers are started.
3. If a server is not running, select the check box next to the server name,
and then click Start.
4. Make sure that all servers are enabled.
If a server is not enabled, select the check box next to the server name,
and then click Enable.
Related Topics
• Performance Manager servers on page 53
BusinessObjects Performance Manager XI 3.0 Administrator's Guide 61

Performance Manager Setup and Administration Online Help
3
The Performance Manager repository
Verifying the Initialization User
1. On the Dashboard and Analytics server, open the InitConfig.properties
file and verify that the Initialization user name and password match those
in the Central Management Server (CMS).
The InitConfig.properties file is located in the following location:
[Install Directory]\Program Files\Business Objects\Performance
Management 12.0
The strings to search for are:
• initialization.User=
• initialization.Password=
2. Log into InfoView, and then click the "Preferences" button on the InfoView
toolbar.
3. In the "Dashboard and Analytics" tab, check the name of the initialization
logon user in the "Change initialization logon user" section is the same
as that specified in the InitConfig.properties file.
4. Log into the Log into the Central Management Console (CMC), and then
click Users.
5. Check that the user defined in the InitConfig.properties is listed among
the users.
6. From the CMC home page, click Settings > Rights and check that the
initialization user has the appropriate rights.
Note: For security reasons, it is recommended that you do not provide
a real user ID for the initialization user. The default user ID is PMUser.
7. In the Central Configuration Manager, restart all of the servers.
Note: If you are using Dashboard and Analytics from a client machine,
restart the client machine.
The Performance Manager repository
The Performance Manager repository is organized as follows:
• Performance Manager tables – store the calendars, metrics, rules, goals
and target values used by Performance Manager.
62 BusinessObjects Performance Manager XI 3.0 Administrator's Guide

Performance Manager Setup and Administration Online Help
The Performance Manager repository
• Set Analysis tables – store the sets for the segmentation engine used by
Set Analysis.
Note: If this is the first time you have installed Dashboard and Analytics,
you need to create the Performance Manager repository before users can
start to work with Dashboard and Analytics applications.
Related Topics
• Creating the Performance Manager repository on page 64
Overview of the Dashboard and Analytics deployment
A Dashboard and Analytics deployment includes two repositories:
The Central Management Server (CMS) database – stores user security
•
information, documents, dashboards, analytics, performance models,
schedules and the semantic layer that maps to your corporate data
sources (for example metric universes and business views).
The Performance Manager repository – stores the metrics, calendars,
•
goals, and sets specific to Dashboard and Analytics.
3
Note: In previous Dashboard and Analytics versions, the Performance
Manager repository was called the Performance Management repository
and the Application Foundation repository (or AF Repo). In Application
Foundation 6.x versions and earlier, the equivalent to the CMS was the
BusinessObjects repository.
BusinessObjects Performance Manager XI 3.0 Administrator's Guide 63

Performance Manager Setup and Administration Online Help
3
The Performance Manager repository
The system tables stored in the repository
The Performance Manager repository stores information used in various
groups of tables used by different Dashboard and Analytics applications:
• Tables with the ci_ prefix store the metrics, rules, calendars used by
Performance Manager, for example, the ci_probe_value.
Note: Each time users refresh a metric in Performance Manager, the
data is retrieved from the universe or manual metrics data source,
calculates the values according to the calendar period you defined, and
writes those values to the Performance Manager repository.
• Tables with the ipm_ prefix store the metadata related to publishing, next
actions, and strategy builder used by Performance Manager.
For example: ipm_analytic
• Tables with the set_ prefix store sets used in Set Analysis.
For example: set_sig_field
Creating the Performance Manager repository
When you install Dashboard and Analytics, you need to:
• create a connection to the target database you selected for the
Performance Manager repository.
• deploy the system tables to the Performance Manager repository so that
users can start to use Dashboard and Analytics applications.
Note: The Total Electronics demo database is designed to accompany
the sample dashboards shipped with the Dashboard and Analytics
applications. We recommend that you do not use this demo database as
the basis of your corporate Performance Manager repository.
• verify the options, such as encoding, applied to the new Performance
Manager repository.
Note: To create the Performance Manager repository, and to make any
modifications in "Dashboard and Analytics Setup", you need to be logged
into InfoView as an administrator.
64 BusinessObjects Performance Manager XI 3.0 Administrator's Guide

Performance Manager Setup and Administration Online Help
The Performance Manager repository
Creating a connection for the Performance Manager repository
If this is the first time you have installed the Dashboard and Analytics
applications, you need to create a connection to the database on which you
want to store the Performance Manager repository. You do this using
Designer.
1. Launch Designer.
2. In the "Connections" list, select Tools > Connections, then click Add.
3. Follow the instructions in the "New Connection Wizard".
For full information, consult the Designer documentation about working
with connections.
4. Verify the connection to the Performance Manager repository.
Related Topics
• Performance Manager repository migration on page 69
• Verifying the connection to the Performance Manager repository on
page 65
3
Verifying the connection to the Performance Manager repository
Note: If this is the first time you have installed Dashboard and Analytics,
you need to create a connection to the Performance Manager repository.
1. Go to Dashboard and Analytics Setup > System Setup > Repository.
2. In the "Repository Information display" section, click Check.
If there is a problem with the connection, an error message provides
details.
Related Topics
• Creating a connection for the Performance Manager repository on page 65
BusinessObjects Performance Manager XI 3.0 Administrator's Guide 65

Performance Manager Setup and Administration Online Help
3
The Performance Manager repository
Deploying the system tables using Dashboard and Analytics setup
You need a connection to the target database before you can deploy the
system tables.
To deploy the system tables to the target database you have chosen as the
Performance Manager repository:
1. Go to Dashboard and Analytics Setup > System Setup > Repository
> Repository Information.
2. Click the drop-down arrow next to connection name.
3. Select the target database from the drop-down list.
The "System Tables Management" display section advises you whether
the system tables have been installed or not. If an earlier version of the
product has been installed, the module detects it and suggests an
upgrade. To upgrade the repository, click Upgrade.
4. The repository creation script runs.
5. Do one of the following:
• To deploy the tables now to Dashboard and Analytics, click OK.
• To deploy the system tables via an external application, click Select
All, and then copy and paste the script into the external application.
6. Log off InfoView, and then restart all servers using the Central
Configuration Manager (CCM).
Related Topics
• Creating a connection for the Performance Manager repository on page 65
Verifying the options applied to the Performance Manager repository
The repository options let you specify settings optimized for the type of
database you are using for the Performance Manager repository. You can
view the options applied to the repository and change the options if necessary.
1. Go to Dashboard and Analytics Setup > System Setup > Repository
and click View Options.
66 BusinessObjects Performance Manager XI 3.0 Administrator's Guide

Performance Manager Setup and Administration Online Help
The Performance Manager repository
The selected encoding appears in the "Encoding" box.
Encoding can be set while defining the connection to the repository or
during the repository creation.
Note: By default, the encoding for Dashboard and Analytics is Unicode
(UTF-8). For encoding other than Unicode (UTF-8), the database and the
processes go through a convertor, so performance is slower.
2. To change the encoding, click the arrow next to the "Encoding" box,
and select the appropriate encoding from the list.
Note: For certain databases, the following advanced options are activated
and allow you to customize the repository environment:
• Tablespace
• Index Post Script
• Numeric Keys Precision
• Use Long Integer Fields
Related Topics
• Creating a connection for the Performance Manager repository on page 65
• Creating the Performance Manager repository on page 64
3
Central Management Server authentication
Access to the features in Dashboard and Analytics Setup is authenticated
against the Central Management Server (CMS). The CMS controls security,
such as which users or groups have access to which dashboards.
There are several types of authentication for BusinessObjects Enterprise
and Dashboard and Analytics:
• "Enterprise" – the system default authentication. This is recommended
if you prefer to create distinct accounts and groups for use with
BusinessObjects Enterprise, or if you have not already set up a hierarchy
of users and groups in a Windows NT user database, an LDAP directory
server, or a Windows AD server.
• "LDAP" – Lightweight Directory Access Protocol. This is recommended
if you want to integrate Dashboard and Analytics authentication with a
single list of authorized users and passwords for your enterprise web,
email, and file-sharing servers.
BusinessObjects Performance Manager XI 3.0 Administrator's Guide 67

Performance Manager Setup and Administration Online Help
3
The Performance Manager repository
• "Windows NT" or "Windows AD" – You can also use Windows NT
authentication (for Microsoft Windows NT) or Windows AD authentication
(for Windows 2000).
You can verify the CMS authentication and change the authentication, if you
wish.
You can also point your Dashboard and Analytics server to a different CMS.
This is particularly useful if your deployment includes multiple CMS databases
used for different environments. For example, you may have one CMS for
your development environment and another CMS for your production
environment.
Note:
• For information on how to setup CMS authentication, refer to the
BusinessObjects Enterprise administrator's guide available at:
http://support.businessobjects.com/documentation.
• To modify parameters in Dashboard and Analytics Setup you need to
be logged into InfoView as an administrator.
Verifying or changing the Central Management Server authentication
1. Go to Dashboard and Analytics Setup > System Setup > Repository.
The name of the web server where the Central Management Server
(CMS) is installed appears by default in the "CMS Name" box.
2. If you want to redirect to another CMS, type the name of the CMS using
the following syntax:
<server_name>.<server_domain>
For example: myserver.marketing.mycompany.com
The authentication appears in the "Authentication" box.
3. If you want to select a different authentication, click the arrow next to the
"Authentication" box and select the type of authentication you want
from the list.
68 BusinessObjects Performance Manager XI 3.0 Administrator's Guide

Performance Manager Setup and Administration Online Help
The Performance Manager repository
Performance Manager repository migration
You can migrate the Performance Manager repository from a different
environment or from a previous version. The following table tells you which
white paper or guide provides information on each of the possible migration
paths:
DocumentationMigration path
3
a test environment to a production environment
Application Foundation 6.5.x to Performance Management XI R2 and higher
Performance Management XI to Performance Management XI R2 and higher
Tip: All documentation is in Adobe PDF format and available at: http://sup
port.businessobjects.com/documentation.
BusinessObjects Enterprise administrator documents
BusinessObjects Enterprise migration
guides
BusinessObjects Enterprise installation
guides
Performance Manager repository integrity and cleanup
In Dashboard and Analytics Setup > Tools the "Check Integrity and
Cleanup" section allow you to perform an integrity check on the following
information stored in the Performance Manager repository:
• Universes
The metric universes stored on the Performance Manager repository.
• Rules
The rules set up using Performance Manager.
• Metrics
The metrics defined using Performance Manager.
• Alerts
BusinessObjects Performance Manager XI 3.0 Administrator's Guide 69

Performance Manager Setup and Administration Online Help
3
The Performance Manager repository
Email alerts (triggered by events) created using Performance Manager.
• Users
User accounts already defined in the system.
Note: You cannot remove users while they are logged into "Dashboard
and Analytics".
• Predictive Analysis
The populations, variables, binnings, models, and advanced metrics
defined using Predictive Analysis.
• Scheduled Programs
"Scheduled Programs" allows you to update the scheduling parameters
for a pre-existing scheduled program to match those currently specified
in Dashboard and Analytics Setup > Parameters > Options >
Scheduler Parameters.
These tools help you to remove faulty or redundant data from the
Performance Manager repository.
Note: Erasing any of the entries physically removes them from the
Performance Manager repository database.
Checking system universe integrity in the Performance Manager setup
Checking the integrity of the metric universes enables you to ensure that the
universes used to define Dashboard and Analytics metrics work correctly.
1. Go to Dashboard and Analytics Setup > Tools.
2. In the "Check Integrity" section, click Universe.
The "Check Integrity" window appears.
Any universes that contain errors are flagged here.
3. To find out more information about an error, click the universe.
The errors are detailed in the "Check Details" section.
For information about resolving errors in universes, refer to the Designer
documentation available at http://support.businessobjects.com.
70 BusinessObjects Performance Manager XI 3.0 Administrator's Guide

Performance Manager Setup and Administration Online Help
The Performance Manager repository
Checking the integrity of Performance Manager rules
Checking rules allows you to ensure that any rules based on events, created
by Dashboard and Analytics users, function correctly.
1. Go to Dashboard and Analytics Setup > Tools.
2. In the "Check & Cleanup" section, click Rules.
Any rules that include errors are listed. You can delete rules here or modify
rules in Performance Manager.
3. To delete a rule, select the rule you want to delete and click Erase.
Note: To modify a rule, exit Dashboard and Analytics Setup, open
Performance Manager and in the "Rules" tab, select the rule and click
Edit. See the Performance Manager documentation for information on
editing rules.
Checking the integrity of Performance Manager metrics
3
Checking metrics allows you ensure that the metrics created and analyzed
by Dashboard and Analytics users function correctly.
1. Go to Dashboard and Analytics Setup > Tools.
2. In the "Check & Cleanup" section, click Metrics.
The "Check & Cleanup Metrics" window appears.
Any metrics that contain errors are flagged here.
3. To find out more information about an error, click the metric.
The errors are detailed in the "Check Details" section.
4. To delete a metric, select the metric you want to delete and click Erase.
Checking the integrity of Performance Manager alerts
Checking alerts allows you to ensure any alerts created by Performance
Manager users function correctly.
1. Go to Dashboard and Analytics Setup > Tools.
2. In the "Check & Cleanup" section, click Alerts.
BusinessObjects Performance Manager XI 3.0 Administrator's Guide 71

Performance Manager Setup and Administration Online Help
3
The Performance Manager repository
The "Check & Cleanup Alerts" window appears. Any alerts that contain
errors are flagged here.
3. To find out more information about an error click the alert.
The errors are detailed in the "Check Details" section.
4. To delete an alert, select the alert you want to delete and click Erase.
Checking the integrity of Performance Manager users
Checking users allows you to remove user accounts that fail the integrity
test from the Central Management Server (CMS).
1. Go to Dashboard and Analytics Setup > Tools.
2. In the "Check & Cleanup" section, click Users.
The "Check & Cleanup Users" window appears. Any user profiles that
contain errors are flagged here.
3. To find out more information about an error click the user name.
The errors are detailed in the "Check Details" section.
4. To delete a user, select the user you want to delete and click Erase.
Note: You cannot delete users who are currently logged into Dashboard
and Analytics.
Checking the integrity of Predictive Analysis objects
You can check the integrity of the populations, variables, binnings, models,
and advanced metrics defined using Predictive Analysis.
1. Go to Dashboard and Analytics Setup > Tools.
2. In the "Check & Cleanup" section, click Predictive Analysis.
The "Check & Cleanup Predictive Analysis" window appears.
3. Click the drop down arrow next to the list box at the top of the window,
then select the subject area for which you want to make the integrity
check.
Any populations, variables, binnings, models or advanced metrics that
include errors are listed and more information about each error is provided
in the "Check Details" section.
72 BusinessObjects Performance Manager XI 3.0 Administrator's Guide

Performance Manager Setup and Administration Online Help
The Performance Manager repository
4. To delete a service, select the Predictive Analysis service you want to
delete and click Erase.
Note: You cannot delete users who are currently logged into InfoView.
Checking the integrity of parameters for a scheduled program in Dashboard and Analytics Setup
The scheduling parameters integrity check verifies:
• the user name and password specified as the user account for scheduled
programs.
By default, it is the user account for the operating system on which
Dashboard and Analytics is installed (for example, the NT user account).
• the working directory in which the scheduled programs are run.
Note: The schedule parameters can be modified in Dashboard and
Analytics Setup > Parameters > Options > Scheduler Parameters.
It is recommended you check the parameter integrity whenever the Scheduler
Parameters are modified, so that any existing scheduled programs are
updated to match the new parameters.
3
Some typical situations that cause errors to occur include:
• the scheduled account user password changes for security purposes.
• the scheduling program working directory changes from one drive to
another to suit disk capacity needs.
• the system is migrated to a new environment, and so the scheduling
parameters need to be updated.
1. Go to Dashboard and Analytics Setup > Tools > Check & Cleanup.
2. Click Scheduled Programs.
The "Check & Cleanup Scheduled Programs" window appears,
displaying the current scheduling user name and working directory, as
well as a list of all the currently existing scheduled programs that do not
having matching parameters.
For each inconsistency, the tool lists the task id, description, username,
whether the password matches, working directory, start date, end date,
and period type.
BusinessObjects Performance Manager XI 3.0 Administrator's Guide 73

Performance Manager Setup and Administration Online Help
3
Dashboard and Analytics system users
3. To update the parameters of a schedule to the current scheduling
parameters, select the schedule you want to update and then click Fix.
To update all the schedules with erroneous parameters, you can click
Select All, then Fix.
Dashboard and Analytics system users
Before users in your organization can use Dashboard and Analytics
applications, you need to specify system users in "Dashboard and Analytics
Setup". These users initialize the Dashboard and Analytics servers and
enable the engines for Performance Manager and Set Analysis.
Note: To modify the users defined in Dashboard and Analytics Setup, you
need to be logged into InfoView as an administrator.
Defining a Dashboard and Analytics system user
Specifying a Dashboard and Analytics system user enables the Performance
Manager engine, which end users need for goals.
Note: The system user must have Administrator rights specified in the Central
Management Console (CMC). For information on how to set security rights
for Dashboard and Analytics, see the BusinessObjects Enterprise
administrator documentation.
1. Go to Dashboard and Analytics Setup > System Setup > System
User.
2. In the "System User" section, type Administrator in the "User Name"
text box.
3. In the "Password" box, type the password.
By default, there is no password for Administrator. It is strongly
recommended that you define a password for the Administrator user. See
the BusinessObjects Enterprise administrator documentation for
information on passwords.
4. To verify that the CMC recognizes the user as a user with administrator
rights, click Check.
Note: If an enterprise authentication error appears, the user name you
entered does not have Administrator rights allocated to it in the CMC.
74 BusinessObjects Performance Manager XI 3.0 Administrator's Guide

Performance Manager Setup and Administration Online Help
Dashboard and Analytics system users
You need to either launch the CMC and modify the security profile of the
user, or enter a different user name that already has administrator rights
in the CMC.
5. To save the new user, click Apply.
Defining a Dashboard and Analytics Set Analysis guest user
Typically, only a small number of users in a deployment create sets. Most
users use existing sets to build metrics when they use Performance Manager.
Specifying a Set Analysis guest user enables all valid Dashboard and
Analytics users to use sets. End users who do not have a profile to create
sets automatically borrow the Set Analysis guest user profile when they open
Dashboard and Analytics. The guest user allows users to visualize sets
for metric creation and analysis.
Note:
3
Before you can define the Set Analysis guest user, you need to set a user
in the Central Management Server (CMS) that has all of the Set Analysis
features enabled. You create the user in the CMS in the Central Management
Console. For information on how to do this, refer to the BusinessObjects
Enterprise administrator documentation.
You need to then create the same user in Set Architect, the Windows setup
application designed for Set Analysis. For information on how to set up the
Set Analysis guest user in Architect, refer to the Set Architect online help.
1. Verify that the Set Analysis guest user exists on the CMS and has all the
Set Analysis features enabled.
2. Verify that the same Set Analysis guest user is defined in Architect.
3. Go to Dashboard and Analytics Setup > System Setup > System
User.
4. In the "Set Analyzer Guest User" section, type the guest user name in
the "User Name" text box.
Note: The Set Analysis guest user you type here must also be set up as
a guest user in Architect.
5. To verify that the user is a known user, click Check.
BusinessObjects Performance Manager XI 3.0 Administrator's Guide 75

Performance Manager Setup and Administration Online Help
3
Metric universes
Note: If an enterprise authentication error appears, the user name you
entered is not registered as a guest user in Set Architect. If this is the
case, you need to launch Architect and create a guest user.
6. To save the new user, click Apply.
Defining a Dashboard and Analytics Initialization user
Specifying the Initialization User allows Dashboard and Analytics to initialize
the Dashboard and Analytics servers and create the proxies in the server
cache.
Note: For security reasons, it is recommended that you do not allocate
Administrator rights to the Initialization user and that you do not re-use a real
user profile. The default user ID is PMUser, defined as a member of the
Everyone user group.
1. Go to Dashboard and Analytics Setup > System Setup > System
User.
2. In the "Initialization User" section, type in a valid user in the User Name
text box.
3. In the "Password" box, type the password.
4. To verify that the user is recognized by the Central Management Server
(CMS) as a user with Dashboard and Analytics rights, click Check.
Note: If an enterprise authentication error appears, this means that the
user name you entered does not exist in the CMS. If this is the case, you
need to launch the Central Management Console, create the user, and
assign that user Everyone rights. You can then return to step 1, above.
5. To save the new user, click Apply.
Metric universes
The data for metrics can be supplied from metric universes built using
Designer or from data entered manually using Performance Manager.
This section gives you information on:
• Metric universes
76 BusinessObjects Performance Manager XI 3.0 Administrator's Guide

• Making universes available to users
Note: For information about entering metrics manually refer to the
Performance Manager documentation.
Related Topics
• About metric universes on page 77
• Making metric universes available to Dashboard and Analytics users on
page 78
About metric universes
Metric universes contain the metrics and goals used by Dashboard and
Analytics users across a deployment. When you design universes for use
with Dashboard and Analytics, you need to follow specific design guidelines
to generate metrics.
For example, metric universes include a time parameter that allows users
to associate values of a specific calendar to the metric they want to analyze.
To create a time parameter, you need to define a query condition on a date
object.
Performance Manager Setup and Administration Online Help
Metric universes
3
Note: The Performance Manager repository allows 34 characters as the
maximum length of the universe name.
Each time a metric is refreshed, the metric values for the selected calendar
are stored in the Performance Manager repository. This lets users analyze
metrics over time, and so perform time-series analysis on KPIs.
Note: On metric universes, aggregates do not need to be defined for
measures at the universe level. This lets users apply different aggregate
calculations when they build metrics on the measures in Dashboard Builder.
However, if you select a metric universe to build an ad hoc query, using Web
Intelligence for example, measures are aggregated at the report level and
thus slow down the query run time.
Related Topics
• Overview of the Dashboard and Analytics deployment on page 63
BusinessObjects Performance Manager XI 3.0 Administrator's Guide 77

Performance Manager Setup and Administration Online Help
3
Metric universes
Building metric universes
You build metric universes using Designer. For step-by-step information on
how to build universes and metrics universes see the Designer
documentation, available at: http://support.businessobjects.com/documenta
tion.
Making metric universes available to Dashboard and Analytics users
Once you have a universe defined in Designer, you need to make the
universe available to Dashboard and Analytics users by following these steps:
export the universe to the Central Management Server.
•
For step-by-step information on how to export universes see the Designer
documentation.
add the universe to the Performance Manager repository.
•
Note: You build metric universes using Designer. For step-by-step information
on how to do this, see the Designer documentation, available at: http://sup
port.businessobjects.com/documentation.
Related Topics
• Adding a universe in Dashboard and Analytics Setup on page 79
Defining connections for universes
A universe is the semantic layer that maps familiar business terms to table
structures in a database. Dashboard and Analytics users to select data from
universes for metrics and analytics.
In order for data to be retrieved for metrics and analytics, a connection to
the specific database upon which the universe is mapped is defined in
Designer. For information specifying connections for universes, see the
Designer documentation, available at: http://support.businessobjects.com/doc
umentation.
78 BusinessObjects Performance Manager XI 3.0 Administrator's Guide

Performance Manager Setup and Administration Online Help
Metric universes
Adding a universe in Dashboard and Analytics Setup
Dashboard and Analytics users select source data from universes for metrics
and analytics. To make a universe available to end users, you need to add
the universe to the Performance Manager repository.
When you add a universe, certain elements that Dashboard and Analytics
applications need to build the SQL for the metrics are taken from the system
database and stored on the Performance Manager repository in the following
ci_ system tables:
• ci_source – contains the reference to the universe name
• ci_subject – contains the class names
• ci_variable – contains the names of the objects
• ci_condition – contains the conditions (or query filters)
1. Go to Dashboard and Analytics Setup > System Setup > Universes.
2. Click Add Universe.
3. In the "Add a Universe" panel, select a universe.
3
If the universe does not appear, click the refresh icon next to the "Measure
Universe" list box to refresh the list of available universes. The name of
the universe and the name of the folder where the universe is located
appear in the "Name" and "Folder" boxes.
All the connection information is retrieved using the connection server.
4. Click OK.
A message appears confirming that the universe has been added
successfully.
Updating a universe in Dashboard and Analytics Setup
1. Go to Dashboard and Analytics Setup > System Setup > Universes.
2. In "Universe Definition", select the universe you want to update.
3. If there are analytics based on the metrics using the selected universe,
activate Update Metrics and Control Charts Definitions. This option,
when activated, forces the update of the SQL definitions of each metric
BusinessObjects Performance Manager XI 3.0 Administrator's Guide 79

Performance Manager Setup and Administration Online Help
3
Metric universes
according to the latest universe definition. When the option is deactivated,
all metric properties are updated except for the SQL definitions.
When this option is activated and you update a universe, all of the
analytics and metrics based on the selected universe are updated to
reflect the new definition of the universe.
4. Click Update
The information on the universe in the Performance Manager repository
is updated.
Removing a universe from the Performance Manager repository
You can remove universes from the Performance Manager repository.
Note: If you have metrics or goals based on a universe you want to delete,
a message appears proposing to remove these metrics and goals along with
the universe itself.
1. Go to Dashboard and Analytics Setup > System Setup > Universes
> Universe Definition.
2. Select the universe you want to remove.
3. Click Remove Universe.
4. If metrics and goals refer to the universe, a message appears that
suggests that you remove these metrics and goals along with the universe
itself.
5. If no warning message appears, click OK.
The universe is removed from the Performance Manager repository.
Object metadata in universes
You can view the objects, sets, and filters on metrics universes once you
have pushed the universe to the Performance Manager repository. You can
check that any changes you have made to a universe are reflected in the
pushed universe on the Performance Manager repository.
You can:
80 BusinessObjects Performance Manager XI 3.0 Administrator's Guide

Performance Manager Setup and Administration Online Help
• view the measures and dimensions to verify the SQL for the measures
on universes.
• view the conditions and subsets to see the descriptions of conditions (or
query filters) and subsets.
Note: If you notice anything incorrect, you can open the universe using
Designer, and then make the necessary corrections. Information this is
provided in the Designer documentation at http://support.businessob
jects.com/documentation.
Viewing universe measures and dimensions
1. Go to Dashboard and Analytics Setup > System Setup > Universes
> Universe Definition.
2. Select the universe you want to verify.
3. The next step depends on what type of objects you want to view on the
universe:
• If you want to view metadata for measures and dimensions, select
Measures & Dimensions.
• If you want to view conditions (query filters) or subsets, select
Conditions & Subsets.
Metric universes
3
The objects on the selected universe appear in the Available objects
list.
4. To view details of an object select the object in the "Available objects"
list.
The following information appears:
DescriptionField
If the value here is Yes, the selected dimension or
"Temporal"
BusinessObjects Performance Manager XI 3.0 Administrator's Guide 81
measure is set-based. A temporal measure is a measure that used against time-based sets, as well as
static sets and enterprise calculations.

Performance Manager Setup and Administration Online Help
3
Metric universes
DescriptionField
If the value is Yes, the selected dimension or measure
is set-based and can be used in a list.
Note:
• In order for an object to be made available for a list,
the LIST=N tag needs to be typed into the "Descrip-
"Appear in list"
tion" field of the object properties dialog box, using
Designer. Objects that have a lot of data associated
with them may not be suitable for use in lists, since
lists can be very long and take time to generate.
• For more information about designing universes,
see the Designer documentation at: http://sup
port.businessobjects.com/documentation.
"Format"
"Aggregation"
"Description"
Provides the number format for the metric as defined
for the measure at the universe level, using Designer.
Provides the aggregation function applied to the object
at the universe level, using Designer. For example:
SUM and MIN.
The aggregation functions applied to the selected object depend on the source database. To see the aggregation calculations applied, view the ci_aggre table
on the Performance Manager repository. The table lists
all the aggregation functions you can use and gives
their help function.
For detailed information on each aggregation function,
see the Terms and concepts section.
Contains the description from th euniverse level.
When designing universes for Dashboard and Analyt-
ics, the object "Description" field can be used to inform the Dashboard and Analytics server that an object
has an aggregate function applied at the universe level.
This prevents users from being able to select an additional aggregate function when they build metrics on
that object using Dashboard Builder. For information
about designing universes for Dashboard and Analytics,
see the Designer documentation.
82 BusinessObjects Performance Manager XI 3.0 Administrator's Guide

Performance Manager Setup and Administration Online Help
Metric universes
DescriptionField
3
"SQL"
The SQL select statement used to retrieve the data for
the measure from the database.
External metric refresh
A metric can have one of two refresh types, "Independent" or "External"
refresh, that is applied in the metric's properties in Performance Manager.
An Internal refresh can be refreshed using the metric engine, however it
requires a link to a database supported by the metric engine. If you have a
database or database connection that is not supported by the metric engine,
you need to use the external refresh to delegate the refresh of the metric to
an external process.
To be able to create a metric with an external refresh, you need to connect
to a metric universe that has no executable_sql statement and have
modifications made to the ci_probe_values table after the metric is created.
The entire process for configuring an external metric refresh is available in
the BusinessObjects deployment documentation.
Configuring an external metric refresh
This procedure contains steps that require Administrator permission. For
these steps, if you do not have the proper permissions, contact your Business
Objects administrator.
1. In Designer in an existing or new universe, create a new measure that
contains no executable_sql statement, and export it to the Central
Management Server.
2. In Dashboard and Analytics Setup, push the universe to the
Performance Manager repository.
3. Create a metric based on the new measure and in the "Refresh Type"
category, activate External refresh.
BusinessObjects Performance Manager XI 3.0 Administrator's Guide 83
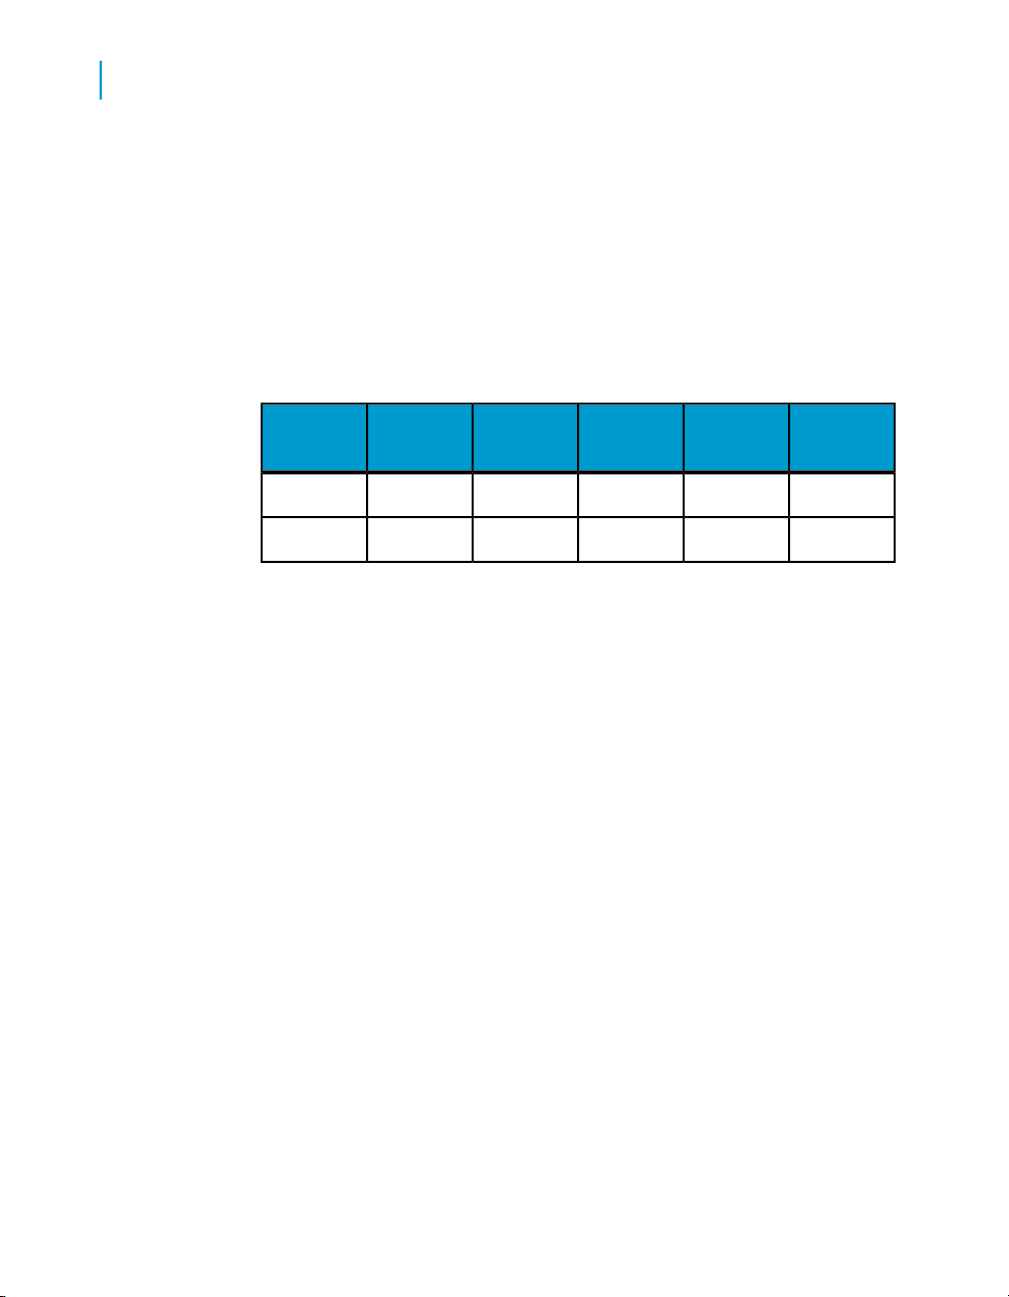
Performance Manager Setup and Administration Online Help
3
Metric universes
4. In the Performance Manager repository database execute the following
SQL statement in the probe_id:
Select * from ci_probe where probe_id=<your id>
Select * from ci_probe_value where probe_id=<your id>
Note: The ci_probe_value is initially empty.
5. Populate the ci_probe_value table with relevant data.
The following table is an example of a ci_probe_value table containing
populated data:
probe_id
6. Populate the following columns in the ci_probe table (all other columns
are updated when the metric is created):
end_date- 6/1/2000
where the date is 6/1/2000 until you have populated the data in
ci_probe_value table. In the following example the column tells the user
at what time the metric was refreshed.
refresh_date- 11/15/2006 4:47:01 PM
7. Save your changes.
8. Restart all of the AA processes.
9. In Dashboard and Analytics, create an analytic and choose the newly
created metric.
The external metric refresh data now appears.
Related Topics
• Adding a universe in Dashboard and Analytics Setup on page 79
• Updating a universe in Dashboard and Analytics Setup on page 79
peri
od_type
peri
od_date
dim_keyprobe_dim_id
probe_val
ue
1162796005/1/200010171
1515285006/1/200010171
84 BusinessObjects Performance Manager XI 3.0 Administrator's Guide

Performance Manager Setup and Administration Online Help
Sliced metric dimensions
Dimensions enable you to create sliced, or dimensioned metrics. A metric
is sliced when it is divided into separate slices of data to enable a more
detailed analysis.
For example, a Sales Revenue metric can be sliced by the Country
dimension, so that the revenue can be analyzed by individual countries or
cities, depending on the number of slices available.
What are dimensions and sliced metrics?
You obtain slice of data by applying a dimension to a metric. When you
refresh a sliced metric, a value is calculated for each distinct value of the
associated dimension.
For example, when you refresh the Sales Revenue sliced by the Country
dimension, sales revenue is calculated and returned for each country in the
metric universe.
Sliced metric dimensions
3
Metrics can be sliced on different dimensions for display or security reasons.
For example, a large organization can slice a metric and restrict access to
specific slices, so that employees can only view data related to a specific
activity. The organization can apply an additional slice to the metric for
geographical area, so that employees can only view data related to a specific
region. The result is a single metric with two slices, whose refresh returns
different data depending on the activity and geographical location of the
employee.
Sliced metrics allow users to drill down on individual segments of data,
providing them with a more detailed look at the data that interests them.
Access restrictions on sliced metrics
Dimensions can be associated with specific user profiles so that users can
only view certain slices of data. This could be useful in an extranet situation,
or when different departments in a company need to see different slices of
a specific metric by product line, or region, for example.
BusinessObjects Performance Manager XI 3.0 Administrator's Guide 85

Performance Manager Setup and Administration Online Help
3
Sliced metric dimensions
Related Topics
• Editing the user association of a dimension on page 92
Where are dimensions defined?
Before you create a sliced metric, you must define dimensions in the metric
universe using Designer. When you create a sliced metric by applying a
dimension to a metric, the total value of the metric is calculated, as well as
an individual value for each slice (for each dimension value).
Tip: For information on defining dimensions on universes, see the Designer
documentation available at: http://support.businessobjects.com/documenta
tion.
When a sliced metric is calculated, two SQL statements are executed:
• a statement for the total value of all slices of the metric
• a statement that includes a GROUP BY statement based on the dimension
that returns a distinct result for each slice, for each value of the dimension
object
For example, if you create a dimension object for product line on the Revenue
metric, refreshing the metric executes one SQL statement to calculate total
revenue, and one SQL statement with a GROUP BY statement on the product
line object, resulting in the display of revenue for each product line.
The slice values are written to the Performance Manager repository:
Information stored about sliced dimensionsRepository table
stores the name and description of the sliced dimension.ci_probe_dim
stores the list of slices generated for the dimension. Each
ci_probe_dim_val
ue
ci_probe_val
ue
86 BusinessObjects Performance Manager XI 3.0 Administrator's Guide
row returned corresponds to an individual slice and is allocated an ID. An additional row is returned whose ID is 0 and
whose value corresponds to the all value of the metric.
stores the actual value of the metric for each distinct slice
for the defined time period.
Note: No row is created for a slice that returns no data.

Note: Since values are returned for each slice and stored in the Performance
Manager repository, Business Objects does not recommend creating a sliced
metric on a dimension with a large number of distinct values.
A dimension for use on a metric is typically built using two dimensions defined
in the universe:
• dimension code: a short name used for the GROUP BY clause and joins
• dimension description: the long name used in displaying the slice
Creating a dimension
Before you define a dimension, you must:
• Create a dimension object on the metric universe in Designer. See the
Designer documentation.
• Save and export the metric universe. See the Designer documentation.
• Update the metric universe in Dashboard and Analytics Setup > System
Setup > Universes tab. See the information on metric universes in the
Dashboard and Analytics Setup documentation.
Performance Manager Setup and Administration Online Help
Sliced metric dimensions
3
Note: Since values are returned for each slice and stored in the Performance
Manager repository, Business Objects does not recommend creating a sliced
metric on a dimension with a large number of distinct values.
1. Go to Dashboard and Analytics Setup > System Setup > Dimensions.
2. Click Add.
3. In the Create Dimension panel, type a name for the new dimension.
4. To define a sliced metric for this dimension, click Yes, I want to create
sliced metrics on this dimension and select objects.
5. Click Next.
6. If the dimension has a sliced metric, click Refresh to list all the slices in
your dimension, then Next.
The slice names and slice codes are listed. You can also change the title
of the dimension in this panel.
7. Select a dimension association and click Next.
When you create a dimension, you are creating an association for the
dimension that dictates which users can access the slices or personale
the content of an analytic.
BusinessObjects Performance Manager XI 3.0 Administrator's Guide 87

Performance Manager Setup and Administration Online Help
3
Sliced metric dimensions
Related Topics
• Configuring a dimension association on page 88
• Sliced metrics for a dimension on page 88
Sliced metrics for a dimension
To configure a dimension using a sliced metric:
1. In Dashboard and Analytics Setup > System Setup > Dimensions,
click Add.
2. In the "Create Dimension" panel, click Yes, I want to create sliced
metrics on this dimension.
3. Select a data source from the "Subject Area" list.
4. Select the universe object to use for the dimension name from the "Object
for dimension name" list.
This name is typically a long name that helps you identify the individual
slices.
5. Select the universe object to use for the dimension code from the "Object
for dimension code" list.
This object is typically a numeric key or shortened name used for the
group by and joins.
6. In the "Global slice name" text box, type a name that refers to the set
of all slices of the metric.
For example, if you are slicing on regions, you name the global slice All
Regions.
Related Topics
• Creating a dimension on page 87
Configuring a dimension association
An association dictates which users can access which slices. You can use
an association to personalize the content of an analytic (to show only the
data that interests the user) or to secure sliced metrics (by limiting the data
that different users or groups of users can access).
1. Go to Dashboard and Analytics Setup > System Setup > Dimensions.
88 BusinessObjects Performance Manager XI 3.0 Administrator's Guide

Performance Manager Setup and Administration Online Help
Sliced metric dimensions
2. Click Add.
3. In the "Create Dimension" panel, define the dimension name.
4. Click Next.
Note: If you are using a sliced metric for the dimension, you first refresh
the sliced metrics and then you are asked to select the association.
5. Select one of the available association types and Click Next.
• Select None for now if you want to create slices and associate them
to users at a later time.
Note: You can use this option only if the dimension is based on a
sliced metric.
• Select Manually, by importing users from the Business Objects
repository to search for users in the repository.
• Select Read from a database to import users from a Business Objects
universe.
Related Topics
• Sliced metrics for a dimension on page 88
• Creating a dimension on page 87
3
Importing users from a universe to secure dimension
This process shows you how to import users from a universe to create an
association on a dimension.
1. Go to Dashboard and Analytics Setup > System Setup > Dimensions.
2. Click Add to create a dimension.
3. In the "Create Dimension" panel, you define the dimension name, click
Next.
4. Select Read from a database and click Next.
5. Select the universe containing user information from the list.
If necessary, click Refresh to refresh the list of available databases.
6. From the "Object for User Name" list, select the universe object (the
database column) that contains the user name.
7. From the "Object for Dimension Name" list, select the universe object
to use for defining the dimension name.
8. From the "Object for Dimension Code" list, select the universe object
to use for defining the dimension code.
BusinessObjects Performance Manager XI 3.0 Administrator's Guide 89

Performance Manager Setup and Administration Online Help
3
Sliced metric dimensions
9. Do one of the following:
• Click End to confirm the user import from a universe.
• Click Previous to return to earlier screens.
• Click Cancel to cancel the dimension creation.
Manually importing users from the Business Objects repository to secure dimensions
This process shows you how to manually import users to create an
association on a dimension.
1. Go to Dashboard and Analytics Setup > System Setup > Dimensions.
2. Click Add to create a dimension.
3. In the "Create Dimension" panel, you define the dimension name, click
Next.
4. Select Manually, by importing users from the Business Objects
repository and click Next.
5. If you did not activate Yes, I want to create sliced metrics on this
dimension in the first Create Dimension panel, you can provide a list
of slices to use with the association.
Click Add and enter the slice name and code. You can also edit existing
slices in the list by clicking Edit Slice. When you finish selecting slices,
click Next.
6. To select the users who only have limited access to the dimension, enter
character strings into the "Search" text box and click Go.
7. From the "Available Users" list, select the users for which you want to
create an association, and use the arrows to enter them into the list of
"Selected User"s.
8. Click Next.
9. If you want slices for a user in the "Available Users" list, select the user
and activate Visible next to the slice name.
You need to do this action for each user. Activate Select All Values to
check the visible box for all slices.
Note: The global slice counts as a separate slice.
10. For each user in "Available Users" list, identify the default slice by
activating Default.
11. Do one of the following:
90 BusinessObjects Performance Manager XI 3.0 Administrator's Guide

Click End to confirm the manual user import.•
• Click Previous to return to earlier screens.
• Click Cancel to cancel the dimension creation.
Editing a dimension
You can edit the definition of a dimension, or simply edit the user association
of a dimension.
1. Go to Dashboard and Analytics Setup > System Setup > Dimensions.
2. Select a dimension from the list and click Edit.
The Update Dimension window appears.
3. Optioinally, you can modify the dimension name and the global slice
name. All other boxes are grayed out.
4. Click Next.
5. Optionally, click Refresh to list all the slices in a dimension, or change
the name of the dimension.
Performance Manager Setup and Administration Online Help
Sliced metric dimensions
3
The slice name sand slice codes are listed.
6. Click Next.
In the next screen, you have the option of editing the association defined
for the dimension. An association dictates which people can access which
slices. Use an association to personalize the content of an analytic, or to
secure sliced metrics by limiting the data that different users or groups
can access.
7. Choose an association option.
An association dictates which users can access which slices. You can
use an association to personalize the content of an analytic (to show only
the data that interests the user) or to secure sliced metrics (by limiting
the data that different users or groups of users can access).
8. Do one of the following:
• Click End.
• Click Previous to return to earlier screens.
• Click Cancel to cancel the dimension edit.
BusinessObjects Performance Manager XI 3.0 Administrator's Guide 91

Performance Manager Setup and Administration Online Help
3
Sliced metric dimensions
Related Topics
• Editing the user association of a dimension on page 92
• Configuring a dimension association on page 88
Editing the user association of a dimension
An association dictates which users can access which slices. You can use
an association to personalize the content of an analytic (to show only the
data that interests the user) or to secure sliced metrics (by limiting the data
that different users or groups of users can access).
If you did not define an association when you created the dimension, you
can edit the association later.
1. Go to Dashboard and Analytics Setup > System Setup > Dimensions.
2. Select the dimension from the list of available dimensions.
The dimension's current associations are listed in the bottom pane (if you
did not define associations for the dimension, this pane is empty). The
pane displays the user associated to each slice, and the slice name and
slice code of the slice to which the user is associated.
3. Choose an association option:
An association dictates which users can access which slices. You can
use an association to personalize the content of an analytic (to show only
the data that interests the user) or to secure sliced metrics (by limiting
the data that different users or groups of users can access).
4. Do one of the following:
• Click End.
• Click Previous to return to earlier screens.
• Click Cancel to cancel the dimension edit.
Related Topics
• Configuring a dimension association on page 88
Removing a dimension
1. Go to Dashboard and Analytics Setup > System Setup > Dimensions.
2. Select the dimension from the list.
92 BusinessObjects Performance Manager XI 3.0 Administrator's Guide

Performance Manager Setup and Administration Online Help
Analytics calendars
3. Click Remove.
Applying a secured dimension to a data source
For each data source subject you can choose a dimension to use for
individual security.
Individual security enables you to limit what users see based on a specific
dimension. Once you create dimensions, you can select a dimension for
each data source on which you want to apply Individual security. The
dimension you select, along with its associations, are applied as the secured
dimension of the data source, and dictate which data individual users can
access.
1. Go to Dashboard and Analytics Setup > System Setup > Dimensions.
2. Click Individual Security Setup at the bottom of the page.
The "Individual Security" window appears.
3. In the "Subject" pane, select the data source on which you want to apply
a secured dimension.
3
The available dimensions for the selected data source are listed in the
"Secured Dimension" pane.
4. Select the dimension with which you want to secure the data source.
5. Click OK.
Sliced metrics
Once you have created dimensions, you can slice metrics on them.
To create a sliced metric, go to Performance Manager > Metrics .
Analytics calendars
Most metrics are measured against a timeline, so you must create calendars
against which you can calculate metric values. You can create the calendars
based on the following types of periods:
• calendar periods
BusinessObjects Performance Manager XI 3.0 Administrator's Guide 93

Performance Manager Setup and Administration Online Help
3
Analytics calendars
• custom periods
• imported periods
Calendars created on this page are used to create and calculate metrics,
sets and control charts. Calendars are stored in the Performance Manager
repository. The calendar name is stored in the ci_series table and the
calendar's definition (its dates and periods) are stored in the ci_period table.
Calendar properties
Use the "Calendar Properties" panel to define the first day of the week or
year and to specify whether weekend days are included in the calendar
definitions. Calendar properties apply to all calendars you create.
Go to Dashboard and Analytics Setup > Time Config and click Options.
The Calendar Properties panel appears.
Note: If no calendars have been created, all fields are blank. Once a calendar
is created, the properties cannot be modified.
The "Calendar Properties" panel contains the following options:
• First day of the week
Select the day on which to start the weekly grain period. For example, if
the review period is Wednesday to Tuesday, define a week as beginning
on Wednesday.
• First week of the year
Select the first week of the calendar year. Define the first week of the
year as the week in which January first falls, or the first week whose days
are all in January.
• Weekend days
Select the days that the calendar skips systematically as weekend days.
Note: Once you have defined calendars based on the calendar properties,
the options cannot be changed. You can edit the calendar properties if
no calendars rely on them.
94 BusinessObjects Performance Manager XI 3.0 Administrator's Guide

Calendar granularity
A calendar's granularity is the scale on which the periods are defined.
Granularity is said to be fine if the detail is low-level.
Daily is the lowest possible level of granularity, therefore the shortest time
span on which a calendar can be based.
Adding a calendar
Before you create calendars, you need to define the calendar properties that
apply to all your calendars.
1. In Dashboard and Analytics Setup > Time Config > Calendar, click
Add.
The "Add a Calendar" window appears.
2. In the "Name" section, enter a name, and optionally, a description of the
calendar.
The name of the calendar is stored in the Performance Manager repository
ci_series table.
Performance Manager Setup and Administration Online Help
Analytics calendars
3
3. In the "Type of periods" section, select one of the following:
• Calendar to support calendar periods.
If you select "Calendar", select an interval and specify the beginning
and end dates.
• Custom to support custom periods.
• Imported to support imported periods.
4. If you select "Calendar" or "Custom", configure the calendar span.
5. Select the period display.
6. Click OK to save the calendar.
Creating a custom period calendar
Custom periods are non-standard, but consistent blocks of time, like every
3.5 weeks, every eight months, every four days.
1. Go to Dashboard and Analytics Setup > Time Config > Calendar.
BusinessObjects Performance Manager XI 3.0 Administrator's Guide 95

Performance Manager Setup and Administration Online Help
3
Analytics calendars
2. Click Add.
The "Add a Calendar" window appears.
3. Select Custom.
4. Type a number corresponding to the size of the interval.
For example, 1 for every day or every month, 2 for every other week, 3
for every three weeks.
5. Select an interval type.
6. Optionally, activate Skip weekend days if your custom calendar omits
Saturdays and Sundays.
7. Optionally, activate Skip, then define the days off by clicking days off, if
the custom calendar omits specific days.
If you activate days off, the "Selected days off" panel appears. Select
the days to omit from the calendar, and click Add to include them in the
list of days off. The days off you indicated are stored in the ci_days_off
table in the Performance Manager repository.
8. Return to the topic "Adding a Calendar" to finish the calendar.
Related Topics
• Adding a calendar on page 95
• Analytics calendars on page 93
• Calendar span on page 99
Importing a calendar
Imported periods can be non-standard and inconsistent blocks of time. You
can import a calendar stored in a .csv file. Only the following analytics support
custom calendars: speedometers, traffic lights and interactive metric trends.
1. Go to Dashboard and Analytics Setup > Time Config > Calendar.
2. Click Add.
The "Add a Calendar" window appears.
3. Select Imported.
4. Do one of the following:
• Click Browse next to the "Document" text box to navigate to a csv
file.
• In the "Document" text box, type the path to a .csv file.
96 BusinessObjects Performance Manager XI 3.0 Administrator's Guide

Performance Manager Setup and Administration Online Help
Analytics calendars
5. Select the format of the dates in the .csv file.
6. Optionally, activate First row contains column header to indicate that
the first row of the .csv file you have imported contains column header
text.
You can generate the .csv file format using a text editor or Microsoft Excel.
To create a .csv file for import, use the following guidelines:
3
Name of entry in
file
Order within the
file
1Period name*
Unique across all existing time periods, for example F2000-Q1
Data typeDescription
Char(35)
date formatDate when period begins2Begin date*
date formatDate when period ends3End date*
* indicates mandatory columns
In addition to the mandatory columns, you can define the following
components of dates using the following standard formats:
Name of entry in
file
Order within the
file
Data typeExample
Char(35)FY19984Year
Char(35)Q25Quarter
Char(35)076Month
Char(35)FW057Week
Char(35)F1998-Q28Quarter and Year
Char(35)F1998-079Month and Year
BusinessObjects Performance Manager XI 3.0 Administrator's Guide 97

Performance Manager Setup and Administration Online Help
3
Analytics calendars
Name of entry in
file
Note: You must use a carriage return (Enter) after the last line of data in the
Order within the
file
10Date Prior Year
(year-to-year comparison,
beginning on same period
last year)
.csv file.
Example: The following is an example of a Fiscal Months custom calendar
imported as a .csv file:
----------------------------------------
F2002-01,12/31/2001,2/3/2002,FY2002,Q1,1, ,F2002-Q1,F2002-01
F2002-02,2/4/2002,3/3/2002,FY2002,Q1,2, ,F2002-Q1,F2002-02
F2002-03,3/4/2002,3/31/2002,FY2002,Q1,3, ,F2002-Q1,F2002-03
F2002-04,4/1/2002,5/5/2002,FY2002,Q2,4, ,F2002-Q2,F2002-04
F2002-05,5/6/2002,6/30/2002,FY2002,Q2,5, ,F2002-Q2,F2002-05
----------------------------------------
Selecting period display options for a calendar
1. Go to Dashboard and Analytics Setup > Time Config > Calendar.
2. Click Add, or Edit for an existing calendar.
3. In the "Show" list, select the part of the period you want to display:
• First Day of Period
• Last Day of Period
• If you selected Imported in the "Type of Periods" section, select
Period name.
Data typeExample
date format
4. If you selected First Day of Period or Last Day of Period, select the
display format from the "Format" list.
The list of formats includes standard date display formats and a custom
format that you can define in the box below the "Format" list.
5. Click OK to save your changes or continue to edit the calendar options.
Related Topics
• Adding a calendar on page 95
98 BusinessObjects Performance Manager XI 3.0 Administrator's Guide

• Editing an existing calendar on page 99
Calendar span
In Dashboard and Analytics Setup > Time Config > Calendars > Add,
set a calendar span.
The setting applies to "Calendar" and "Custom" periods.
The "From" period is the first period from which data is available. The "To"
period is typically set in the future. Extend this period as needed depending
on the grain of the calendar.
For example, if you have a three-year sales revenue goal you can extend
the calendar three years in the future. However, if you have a finer-grain
calendar (daily, for example) you can to extend it one month at a time into
the future.
Defining the span for a calendar based on Calendar periods
In the "From" section, select the first period of calendar. In the "To" section,
select the last period of the calendar.
Performance Manager Setup and Administration Online Help
Analytics calendars
3
Defining the calendar span for a calendar based on custom periods
In the "From" section, select the first period of calendar, the number of
periods for which the calendar should run, and in the "To" section, select
the last period of the calendar.
Note: Business Objects does not recommend extending calendars too far
into the future, since this adds data to the calendar table in the Performance
Manager repository. Instead, revise the calendar.
Related Topics
• What is a grain? on page 145
• Calendar granularity on page 95
Editing an existing calendar
1. Go to Dashboard and Analytics Setup > Time Config > Calendar.
BusinessObjects Performance Manager XI 3.0 Administrator's Guide 99

Performance Manager Setup and Administration Online Help
3
Analytics calendars
2. Select the calendar you want to edit.
3. Click Edit.
The "Edit an existing calendar" window appears.
4. You can change the name and description.
5. In the "Type of periods" section, select one of the following:
• Calendar to support calendar periods.
If you select "Calendar", select an interval and specify the beginning
and end dates.
• Custom to support custom periods.
• Imported to support imported periods.
6. If you select "Calendar" or "Custom", configure the calendar span.
7. Select the period display.
8. Click OK to save the calendar.
Related Topics
• Calendar span on page 99
• Creating a custom period calendar on page 95
• Importing a calendar on page 96
• Selecting period display options for a calendar on page 98
Deleting an existing calendar from the repository
Before you remove a calendar, you must first remove any metrics that use
the calendar in their definitions.
1. Go to Dashboard and Analytics Setup > Time Config > Calendar.
2. Select the calendar you want to delete from the list.
3. Click Remove.
Moving averages in calendars
Moving average is a method of calculating the average value of an indicator,
over a period of time. In some time series, seasonal variation is so strong it
obscures trends or cycles. Use moving averages as a smoothing method to
100 BusinessObjects Performance Manager XI 3.0 Administrator's Guide
 Loading...