


Getting Started with Performance
Manager
BusinessObjects Performance Manager
Windows

Copyright
© 2008 Business Objects, an SAP company. All rights reserved. Business Objects
owns the following U.S. patents, which may cover products that are offered and
licensed by Business Objects: 5,295,243; 5,339,390; 5,555,403; 5,590,250;
5,619,632; 5,632,009; 5,857,205; 5,880,742; 5,883,635; 6,085,202; 6,108,698;
6,247,008; 6,289,352; 6,300,957; 6,377,259; 6,490,593; 6,578,027; 6,581,068;
6,628,312; 6,654,761; 6,768,986; 6,772,409; 6,831,668; 6,882,998; 6,892,189;
6,901,555; 7,089,238; 7,107,266; 7,139,766; 7,178,099; 7,181,435; 7,181,440;
7,194,465; 7,222,130; 7,299,419; 7,320,122 and 7,356,779. Business Objects and
its logos, BusinessObjects, Business Objects Crystal Vision, Business Process
On Demand, BusinessQuery, Cartesis, Crystal Analysis, Crystal Applications,
Crystal Decisions, Crystal Enterprise, Crystal Insider, Crystal Reports, Crystal
Vision, Desktop Intelligence, Inxight and its logos , LinguistX, Star Tree, Table
Lens, ThingFinder, Timewall, Let There Be Light, Metify, NSite, Rapid Marts,
RapidMarts, the Spectrum Design, Web Intelligence, Workmail and Xcelsius are
trademarks or registered trademarks in the United States and/or other countries
of Business Objects and/or affiliated companies. SAP is the trademark or registered
trademark of SAP AG in Germany and in several other countries. All other names
mentioned herein may be trademarks of their respective owners.
Third-party
Contributors
Business Objects products in this release may contain redistributions of software
licensed from third-party contributors. Some of these individual components may
also be available under alternative licenses. A partial listing of third-party
contributors that have requested or permitted acknowledgments, as well as required
notices, can be found at: http://www.businessobjects.com/thirdparty
2008-09-03

Contents
Introduction 7Chapter 1
What does this tutorial cover?.....................................................................8
Creating the Universe 11Chapter 2
Before you begin........................................................................................12
Lesson 1: The database connection..........................................................14
Lesson 2: Universe design........................................................................21
Lesson 3: Exporting the universe..............................................................33
To learn more about creating universes....................................................35
Accessing the New Connection Wizard...............................................14
Creating the database connection.......................................................16
Selecting the tables..............................................................................22
Creating the joins.................................................................................23
Creating universe classes....................................................................25
Setting the object properties.................................................................27
Setting the number format....................................................................29
Creating the Where restriction..............................................................31
Configuring Performance Manager 37Chapter 3
Before you begin........................................................................................38
Accessing the Setup Information Page................................................38
Checking the repository settings...............................................................40
Lesson 4: Setting up the repository...........................................................42
Lesson 5: Adding the universe..................................................................46
Lesson 6: Calendars..................................................................................48
Viewing calendars................................................................................48
Getting Started with Performance Manager 3

Contents
Adding a calendar................................................................................49
Creating Metrics 53Chapter 4
Before you begin........................................................................................54
Lesson 7: Create a metric..........................................................................54
Getting started creating metrics...........................................................55
Creating the average metrics...............................................................56
To learn more about metrics......................................................................60
Creating Analytics 61Chapter 5
Before you begin........................................................................................62
Creating a Folder..................................................................................62
Creating a Category.............................................................................63
Lesson 8: Create an Interactive Metrics Trends (IMT) analytic.................65
What is an Interactive Metric Trends graph?........................................65
Selecting the data.................................................................................65
Editing the chart display options...........................................................68
Saving your analytic.............................................................................69
Lesson 9: Create a speedometer gauge with a prompt.............................71
What is a speedometer?......................................................................71
Creating a metric prompt on a Speedometer analytic..........................71
Saving your Speedometer analytic......................................................76
Viewing what you have accomplished.......................................................76
To learn more about analytics....................................................................76
Creating Rules and Alerts 77Chapter 6
Before you begin........................................................................................78
What are Rules and Alerts? ......................................................................78
Lesson 10: Create an Alerts analytic.........................................................79
Accessing the InfoView analytic creation page....................................80
4 Getting Started with Performance Manager

Contents
Configuring the Alerts analytic..............................................................81
Lesson 11: Create a rule............................................................................82
Viewing business rules.........................................................................82
Creating a rule on the metric................................................................83
Defining the event................................................................................85
Defining the condition...........................................................................86
Selecting the action..............................................................................87
Testing the rule.....................................................................................90
Lesson 12: Refreshing your metrics..........................................................91
Viewing the effect of the refreshed metric in your IMT.........................92
Viewing the effect of the refreshed metric in your speedometer..........93
Viewing the effect of the refreshed metric on your Alerts list...............94
To learn more about rules..........................................................................95
Creating a Goal 97Chapter 7
Before you begin........................................................................................98
Getting started...........................................................................................99
Lesson 13: Create the goal........................................................................99
Start creating the goal..........................................................................99
Setting the Auto-Fill and Tolerance parameters.................................101
Saving the goal...................................................................................104
In conclusion............................................................................................105
To learn more about goals.......................................................................106
Get More Help 107Appendix A
Index 111
Getting Started with Performance Manager 5

Contents
6 Getting Started with Performance Manager
Introduction
1

Introduction
1
What does this tutorial cover?
Getting Started with Performance Manager offers an overview for people
who want to use Performance Manager to create metrics and goals, and use
them to create analytics.The overview shows you how to:
• configure the framework for Performance Manager
• create metrics and use them to build analytics
• create a rule that includes an alert
• create a goal
For more in-depth training on Performance Manager, go to http://www.busi
nessobjects.com/services/training/. We currently offer courses on
Performance Manager that are aimed at metric designers.
What does this tutorial cover?
This tutorial takes you through all the necessary steps to get started creating
metrics and goals.
The president of a small electronics company with overseas customers wants
to track how prices evolve in comparison to costs over a period of several
months. She wants to see analytics that display the average unit cost
compared with the average unit price, and the sum of the unit costs compared
with the sum of the unit prices.
Using this tutorial, you will:
• create two analytics that are visual representations of the data using the
AFDEMO sample database included with Performance Manager:
• the Interactive Metric Trend (IMT) to show the evolution of the average
unit price and the average unit cost over a period of several months
• the Speedometer gauge, which displays the average unit cost between
two data thresholds
• create an alert on the data to inform the president when the average unit
cost exceeds a specified limit, $200.
• create a goal analytic that displays the metrics you created in comparison
to a goal.
8 Getting Started with Performance Manager

Introduction
What does this tutorial cover?
Prerequisites
As a prerequisite, you need to:
• install BusinessObjects XI 3.0
• install Dashboard Builder and Performance Manager
• install SQL Server, which is required to access the demo database
• have an excellent understanding of BusinessObjects XI and be familiar
with creating universes in Universe Designer.
• have access to Universe Designer with a network connection to the
machine on which you installed Dashboard Builder and Performance
Manager if it is not on the same machine
Note:
This tutorials works only for Windows.
For detailed instructions on creating users and allocating rights in
BusinessObjects Enterprise, refer to the BusinessObjects Enterprise
Administrator's Guide.
Lessons offered in the tutorial
This tutorial is made up of the following lessons:
1
2. Creating the Universe
3. Configuring Performance Manager
4. Creating Metrics
Learn how to...Chapter
•
Lesson 1: Create a database connection
•
Lesson 2: Create a simple universe using
Universe Designer
•
Lesson 3: Export the universe
•
Lesson 4: Create the repository
•
Lesson 5: Add the universe
•
Lesson 6: Create and add the calendar
•
Lesson 7: Create metrics from a universe
Getting Started with Performance Manager 9

Introduction
1
What does this tutorial cover?
5. Creating Analytics
Learn how to...Chapter
•
Lesson 8: Create an Interactive Metric Trend
analytic
•
Lesson 9: Create a speedometer gauge analytic with a metric prompt
•
Lesson 10: Create an Alerts analytic
6. Creating Rules and
Alerts
7. Creating a Goal
•
Lesson 11: Create a rule with an alert
•
Lesson 12: Refresh metrics
•
Lesson 13: Set a goal target on a metric with
tolerance levels above and below the target
10 Getting Started with Performance Manager

Creating the Universe
2

Creating the Universe
2
Before you begin...
This lesson explains how to:
• create a simple universe in Universe Designer using the
AFDEMO_Data.mdf database
• build metrics from the universe
The lesson takes you through the following steps that allow you to make the
universe available to Performance Manager. Each of these steps is explained
in detail in this chapter:
1. Create the database connection.
2. Select the tables.
3. Create the joins.
4. Create classes.
5. Set the object properties.
6. Set the format for each measure.
7. Create the Where restriction, or self-join.
8. Export the measure universe to create a simple universe from which you
build the metrics.
Before you begin...
Before you begin verify the following:
• the AFDEMO_Data.mdf SQL Server database was installed with the
Performance Manager framework. The usual installation directory is the
following:
<INSTALLDIR>\Business Objects\Performance Management 12\Demo
12 Getting Started with Performance Manager

Creating the Universe
Before you begin...
2
• the AFDEMO_Data.mdf SQL Server database is attached to the SQL
server.
• a system Data Source Name (DSN) was configured for the AFDEMO
database.
Getting Started with Performance Manager 13

Creating the Universe
2
Lesson 1: The database connection
If any of the above is missing, contact your Business Objects administrator.
Lesson 1: The database connection
In this step, you create a universe using the AFDEMO database that is
delivered with Performance Manager. In this step you create a database
connection using the New Connection Wizard.
Accessing the New Connection Wizard
1. In Universe Designer , select File > New.
The "Universe Parameters" panel appears.
14 Getting Started with Performance Manager

Creating the Universe
Lesson 1: The database connection
2. Under the "Definition" tab in the "Name" box, type demo_universe, which
is the name of the universe that you are creating.
3. Click New.
2
The New Connection Wizard opens.
Getting Started with Performance Manager 15

Creating the Universe
2
Lesson 1: The database connection
Creating the database connection
1. In the New Connection Wizard, click Next.
The "Database Middleware Selection [2/2]" step appears.
16 Getting Started with Performance Manager

Creating the Universe
Lesson 1: The database connection
2
2. From the "Connection Type" list, select Secured for a secured connection.
3. In the "Connection Name" box, type demo connection, the name for the
connection.
4. Select Microsoft > MS SQL Server 2000 > ODBC Drivers, the
appropriate driver for an MS SQL Server database.
5. Click Next.
The "Login Parameters [3/5]" step appears.
Getting Started with Performance Manager 17

Creating the Universe
2
Lesson 1: The database connection
6. Enter the required information as follows:
• From the "Authentication Mode" list, select Use specified username
and password.
• In the "User name" box, type the user name for your SQL Server
installation.
• In the "Password" box, type the password for your SQL Server
installation.
• From the "Data source name" list, select AFDEMO.
7. Click Test connection.
A message appears in the dialog box informing you that the server is
responding.
8. Click Next.
The "Configuration Parameters [4/5]" step appears.
18 Getting Started with Performance Manager

Lesson 1: The database connection
You do not modify these parameters in this tutorial.
9. Click Next.
Creating the Universe
2
The "Custom Parameters [5/5]" screen appears. You do not modify the
default parameters in this tutorial.
Getting Started with Performance Manager 19

Creating the Universe
2
Lesson 1: The database connection
10. Click Finish.
The New Connection Wizard closes, and the new connection appears in
the "Universe Parameters" dialog box.
11. Click OK.
The dialog box closes and the Universe Designer window opens.
20 Getting Started with Performance Manager

Creating the Universe
Lesson 2: Universe design
2
Lesson 2: Universe design
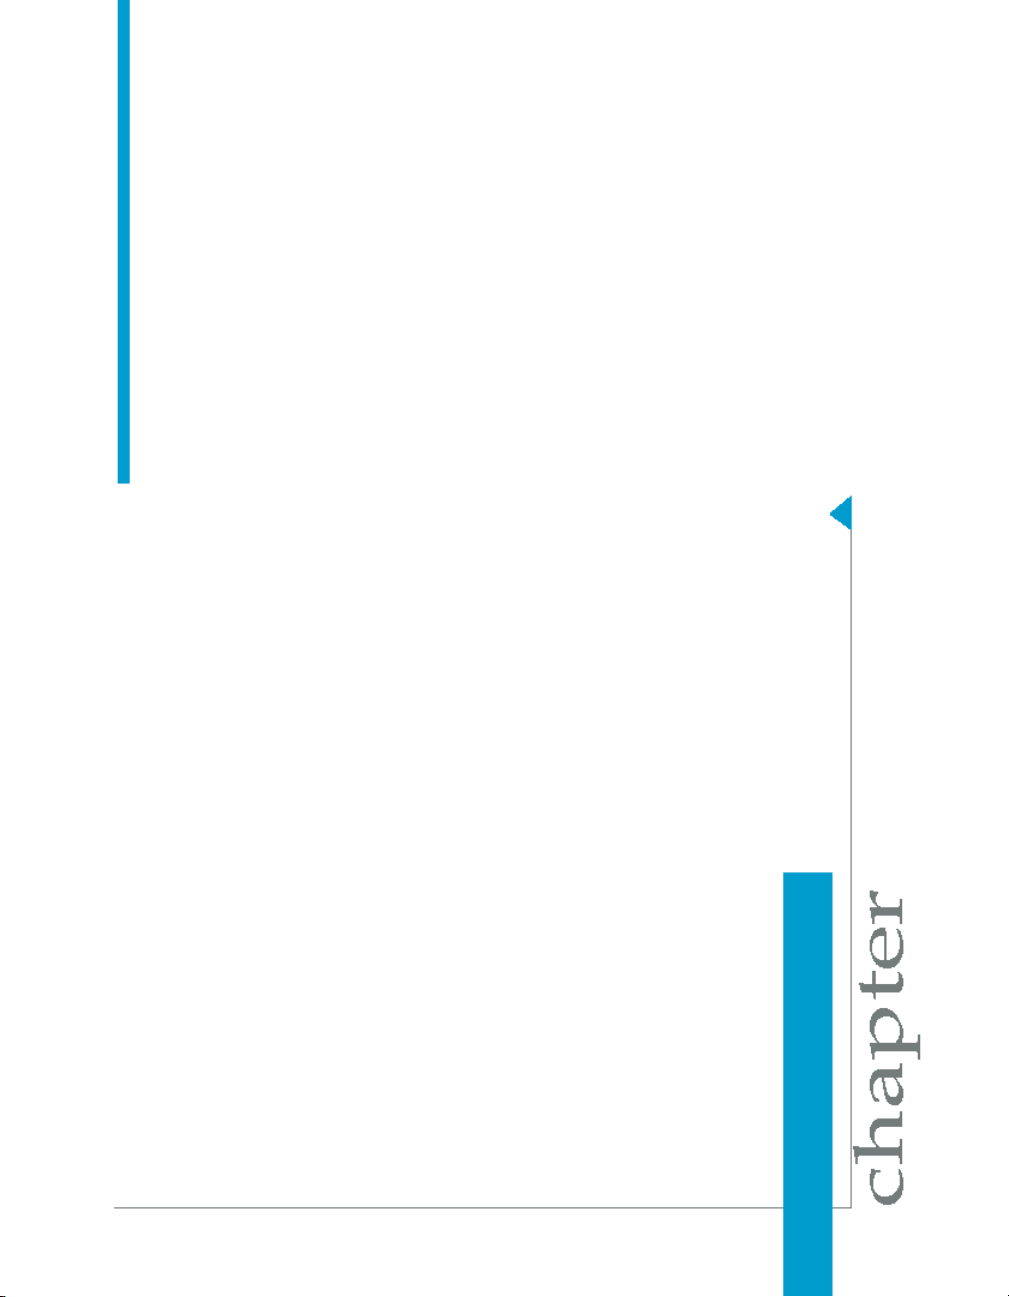
In this lesson you will design the universe. You use only four tables from the
database:
• Customers
• Orders
• OrderDetails
• Products
The OrderDetails table contains price and quantity information, whereas the
Orders table contains date information. This information is required for
creating queries.
The first step in creating a universe is to select the tables.
Getting Started with Performance Manager 21

Creating the Universe
2
Lesson 2: Universe design
Selecting the tables
1. Right-click inside the blank page in the Universe Designer window.
From the menu that appears, click Tables.
The "Table Browser" opens.
2. In AFDEMO > dbo > Products, double-click or drag and drop to the right
pane the following tables:
• Customers
• Orders
• OrderDetails
• Products
The tables appear in the right pane of the Universe Designer window as
shown below.
22 Getting Started with Performance Manager

3. Click Close in the "Table Browser" panel.
Creating the joins
The next step is to create one-to-many joins that join a row from one table
to several rows in another table.
1. In the "Orders" table, click and drag OrderID to OrderID in the
"OrderDetails" table.
A line appears between the two items.
2. Double-click the line.
Creating the Universe
Lesson 2: Universe design
2
The "Edit Join" panel appears.
3. Click Detect.
The cardinality is one of the following numeric relationship between tables:
many-to-many, many-to-one, or one-to-one.
Universe Designer detects the cardinality and creates the join.
Getting Started with Performance Manager 23

Creating the Universe
2
Lesson 2: Universe design
4. Click OK.
A one-to-many join is created between the two tables. The three-prongs
on the "Orders" side of the join indicate the many aspect of the join.
5. In the "Customer" table, click and drag CustomerID to CustomerID in
the "Orders" table.
6. Double-click the join, activate Cardinality, and click Detect, then OK.
7. In the "OrderDetails" table, click and drag ProductID to ProductID in the
"Products" table.
24 Getting Started with Performance Manager
8. Double-click the join, activate Cardinality, and click Detect, then OK.
Creating universe classes
The next step is to create classes. A class is a container of objects. A class
is the equivalent of a folder in the Windows environment. You create classes
to house objects that have a common purpose in the universe. In this step
you create the class folder and put objects in it.
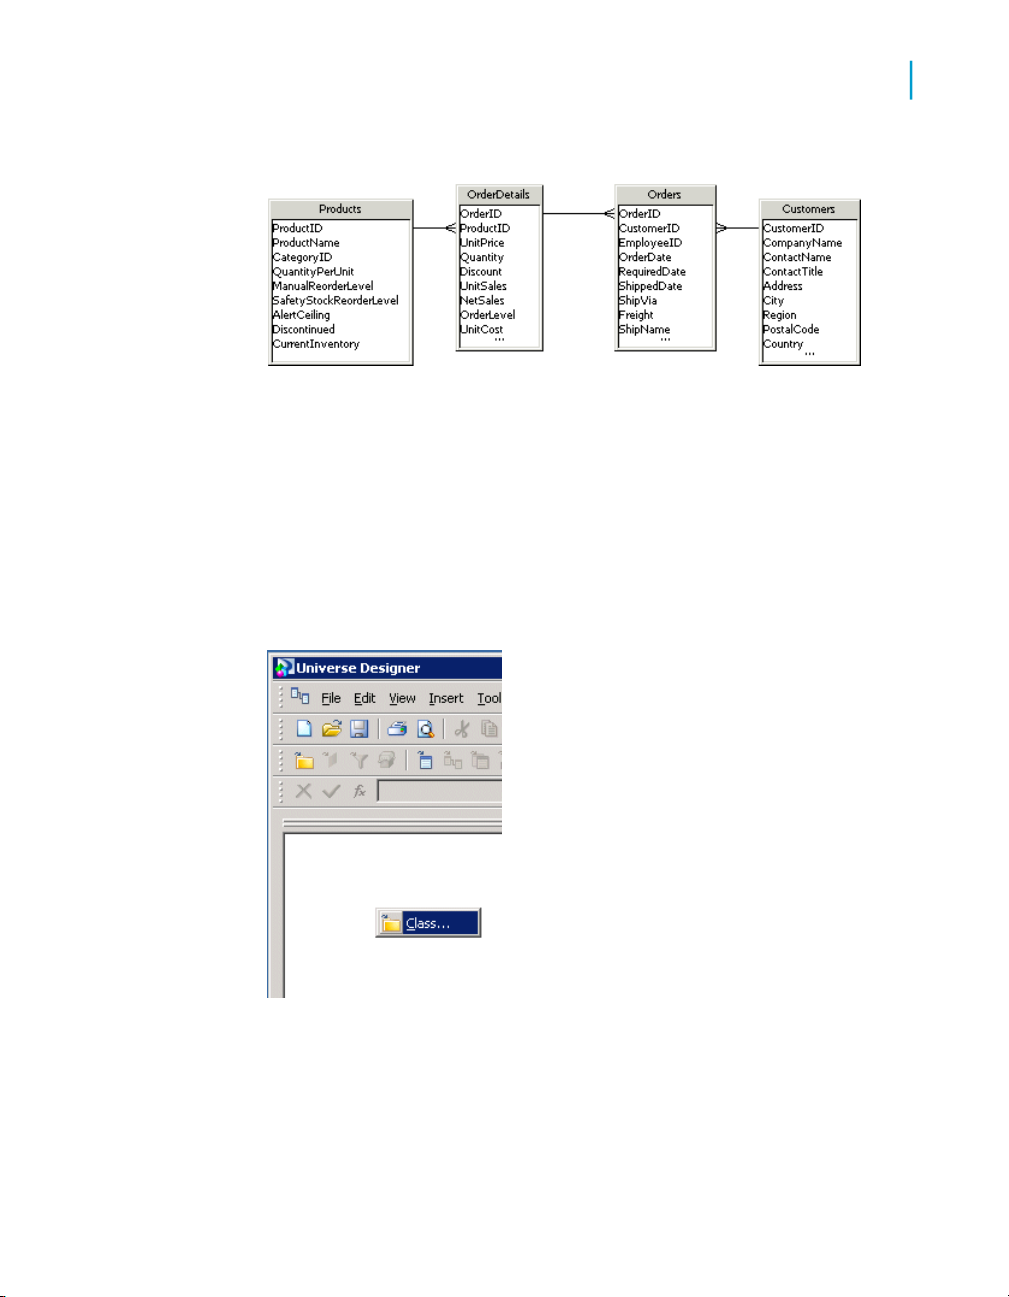
1. Right-click inside the Universe Designer left pane and select Class from
the menu.
Creating the Universe
Lesson 2: Universe design
2
The "Edit Properties" dialog box opens to the "Definition" tab.
2. In the "Class Name" text box, type a name for the class, demo universe.
Getting Started with Performance Manager 25

Creating the Universe
2
Lesson 2: Universe design
3. Click OK.
4. In the right pane, click and drag the UnitPrice field in the "OrderDetails"
table to the class folder that you created in the left pane.
The object appears as a dimension in the object folder.
5. Click and drag the following fields to the same folder:
• UnitSales
• NetSales
• Cost
26 Getting Started with Performance Manager

Note:
If you do not see Cost in the "OrderDetails" list, use the mouse to drag
down the lower end of the "OrderDetails" box until the dimension
appears.
• UnitCost
• Quantity
Do the same for CompanyName in the "Customers" table and
ProductName in the "Products" table.
Setting the object properties
Creating the Universe
Lesson 2: Universe design
2
Once you have created the class folder and have put objects in it, you set
the properties of each object.
1. Double-click the object Quantity.
The "Edit Properties of Quantity" panel appears.
Getting Started with Performance Manager 27

Creating the Universe
2
Lesson 2: Universe design
By default, the name of the object, quantity, type, and number appear in
the appropriate boxes in the "Definition" tab.
2. Click the Properties tab.
3. Under "Qualification" select Measure.
The panel changes to display a box in which you choose how the measure
is projected when aggregated. By default, "Sum" is selected in the
"Function" list. Leave this value.
28 Getting Started with Performance Manager

Creating the Universe
Lesson 2: Universe design
2
By default Associate a List of Values is selected. A measure object
should not have a list of values associated with it.
4. Disactivate Associate a List of Values.
5. Click Apply, then click OK.
6. Repeat steps 1 - 5 for:
• Unitcost
• Cost
• Netsales
• Unitsales
• Unitprice
Setting the number format
Because quantity, unit price, and unit cost all represent numeric values, you
need to set the number format for each measure.
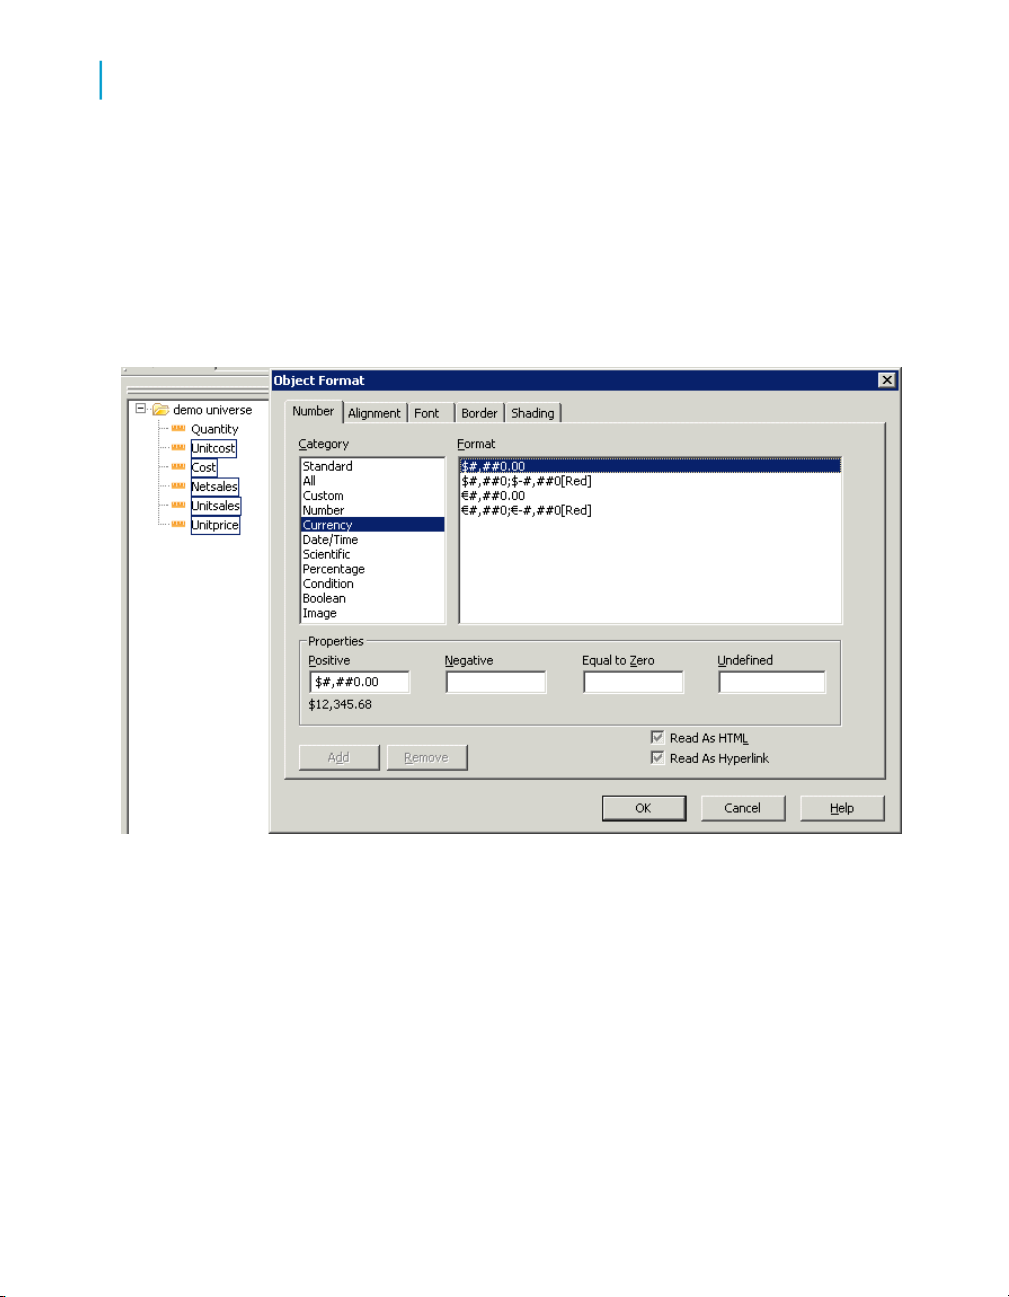
1. Press the Control key and select the following measures:
Getting Started with Performance Manager 29
Creating the Universe
2
Lesson 2: Universe design
UnitCost•
• Cost
• Netsales
• Unitsales
• Unitprice
2. Right-click the group and select Object Format from the menu.
The "Object Format" panel appears.
3. Click the Number tab.
4. Under Category, select Currency.
5. Under "Format", select the first dollar format.
6. Click OK.
7. Right-click the "Quantity" measure and select Object Format from the
menu.
8. From the "Number" tab, under "Category", select Number and under
"Format" select #,##0.
30 Getting Started with Performance Manager

Creating the Universe
Lesson 2: Universe design
2
9. Click OK.
Creating the Where restriction
In this step you create a self join on the measure using a "Where" restriction.
A self-join is a join that compares the table to itself. Using the "Where"
restriction forces the join to the date restriction.
1. Double-click Quantity.
The "Edit Properties for Quantity" panel appears.
2. In the "Definition" tab, enter the following syntax in the "Where" box:
Orders.OrderDate between @Prompt('BEGIN_DATE','D',,mono,free)
AND @Prompt('END_DATE','D',,mono,free)
Note:
Business Objects recommends that you type this syntax into a text editor,
and then copy and paste this syntax for each measure to avoid errors.
There must be a space between "AND" and "@Prompt" or you will
encounter a syntax error.
Getting Started with Performance Manager 31

Creating the Universe
2
Lesson 2: Universe design
3. Click Parse to verify that the SQL syntax is correct.
The following message appears on your screen: Parsing is OK.
4. Click OK twice.
5. Double-click each of the following measures and repeat steps 2 through
4:
• Unitcost
• Cost
• Netsales
• Unitsales
• Unitprice
Your universe should now look like the following image:
32 Getting Started with Performance Manager

Creating the Universe
Lesson 3: Exporting the universe
6. Click the Save icon, then save the demo universe.
Note:
For more information on the complexities of the self join, refer to the Universes
chapter in the Dashboard and Analytics administrator documentation. For
detailed information on creating universes, refer to the Universe Designer
documentation.
2
Lesson 3: Exporting the universe
After you have created the Where restriction on the measures and have
checked the parsing, you are ready to export the universe. Exporting the
universe makes it available for use in Dashboard Builder and Performance
Manager.
1. From the main menu, select File > Export.
The "Export Universe" panel appears.
2. Click Browse to locate the folder that corresponds to the domain server
to which you want to export your universe.
3. Click OK to return to the "Export Universe" panel.
4. Select Everyone, which is the group to which you assign the universe.
Getting Started with Performance Manager 33

Creating the Universe
2
Lesson 3: Exporting the universe
5. Click OK.
The universe is successfully exported.
6. Click OK and exit Universe Designer.
Congratulations. You have successfully created and exported a universe. In
the next lesson, you learn how to configure your Performance Manager setup
and to add the universe that you just created to the list of available universes.
34 Getting Started with Performance Manager

Creating the Universe
To learn more about creating universes
To learn more about creating universes
To learn more about creating the metric universe, such as creating
pre-aggregated measures and filters,
enroll in BusinessObjects Dashboard Builder XI: Designing Dashboards.
This course is available as classroom training and as eLearning. For more
information, consult Business Objects Education Services at the following
location: http://www.businessobjects.com/services/training/.
2
Getting Started with Performance Manager 35

Creating the Universe
To learn more about creating universes
2
36 Getting Started with Performance Manager

Configuring Performance Manager
3

Configuring Performance Manager
3
Before you begin...
In this lesson you learn how to perform the basic configuration tasks that are
indispensable for using Performance Manager.
These tasks are:
• setting up the repository
• creating the target database connection
• adding the universe
• creating and adding the calendar
Before you begin...
Before you begin, go to the Dashboard and Analytics Setup, the starting
point of post-installation deployment, where you define the target connection
and create the system tables for Performance Manager.
Accessing the Setup Information Page
1. Do one of the following:
• Start InfoView Java via the Start menu.
• In the address bar of your browser, enter the URL for the InfoView
application.
The "Log On to InfoView" page appears.
38 Getting Started with Performance Manager

2. Enter the following information:
Configuring Performance Manager
Before you begin...
3
DescriptionOption
System
Username
Password
Authentication
BusinessObjects Enterprise XI 3.0 opens to the InfoView home page.
The name of the server on which your Dashboard and
Analytics applications are installed
Your user name
Your password
Contact your BusinessObjects administrator to find out
which authentication you need to use.
Getting Started with Performance Manager 39

Configuring Performance Manager
3
Checking the repository settings
3. Click Open > Dashboard and Analytics Setup.
While this tutorial does not cover all the parameters that you set from the
setup, you can take a few moments to read the information contained on
the "Setup" page.
Checking the repository settings
1. Click the System Setup tab.
40 Getting Started with Performance Manager

Configuring Performance Manager
Checking the repository settings
3
By default the "Repository" sub tab appears. The repository page contains
all information pertaining to the Central Management Server (CMS) and
to the repository. The CMS hosts the BusinessObjects Enterprise
repository and user and document domains. If this is a new installation,
you must create the repository.
Getting Started with Performance Manager 41

Configuring Performance Manager
3
Lesson 4: Setting up the repository
Note:
If you do not have Java2 Runtime installed, the installer for the software
asks to install the software. Accept the installation, which takes a few
minutes, depending on your connection.
2. Take a moment to check that the repository has been set up correctly. If
the boxes under "Repository Information" are blank, you must set up the
repository.
3. If your repository is already selected, you only need to click Check to
verify that the server is responding.
The system tables management section of the "Repository" sub tab lets you
know if the system tables have been installed. The system tables store
information that is central to the application.
If an earlier version of the product has been installed, the module detects it
and suggests an upgrade.
Lesson 4: Setting up the repository
Note:
A warning panel may appear during one of the steps in this lesson that
requires you to restart the Dashboard and Analytics servers and web server.
You will need to log out of InfoView and contact your BusinessObjects
Enterprise administrator to have the servers restarted. When the servers are
restarted, you can complete this lesson and the subsequent lessons.
1. Under "Repository Information", click Change.
The "Choose repository connection" panel appears.
2. From the "Universe Connection" list, select the name of the universe
connection that you created in Universe Designer , demo connection.
42 Getting Started with Performance Manager

Configuring Performance Manager
Lesson 4: Setting up the repository
When you select the universe connection, the "Database Engine", "Target
Database", and "User Name" boxes are completed by default as follows:
• Database Engine: "MS SQL Server"
• Target Database: "AFDEMO"
• User name: the default entry, "sa" or the user name you entered when
you installed the database engine
3. Click OK to close the panel.
If a warning panel appears that requests you to restart the Dashboard
and Analytics servers and web server, you need to contact your
BusinessObjects Enterprise administrator to have this task completed.
Bookmark this page and log out of InfoView until the servers have been
restarted. You can then continue on to the next step.
3
4. Under "Repository Information", click Check to make sure that the
database connection is working.
A message informs you that the server is responding.
Getting Started with Performance Manager 43
Configuring Performance Manager
3
Lesson 4: Setting up the repository
5. Click OK.
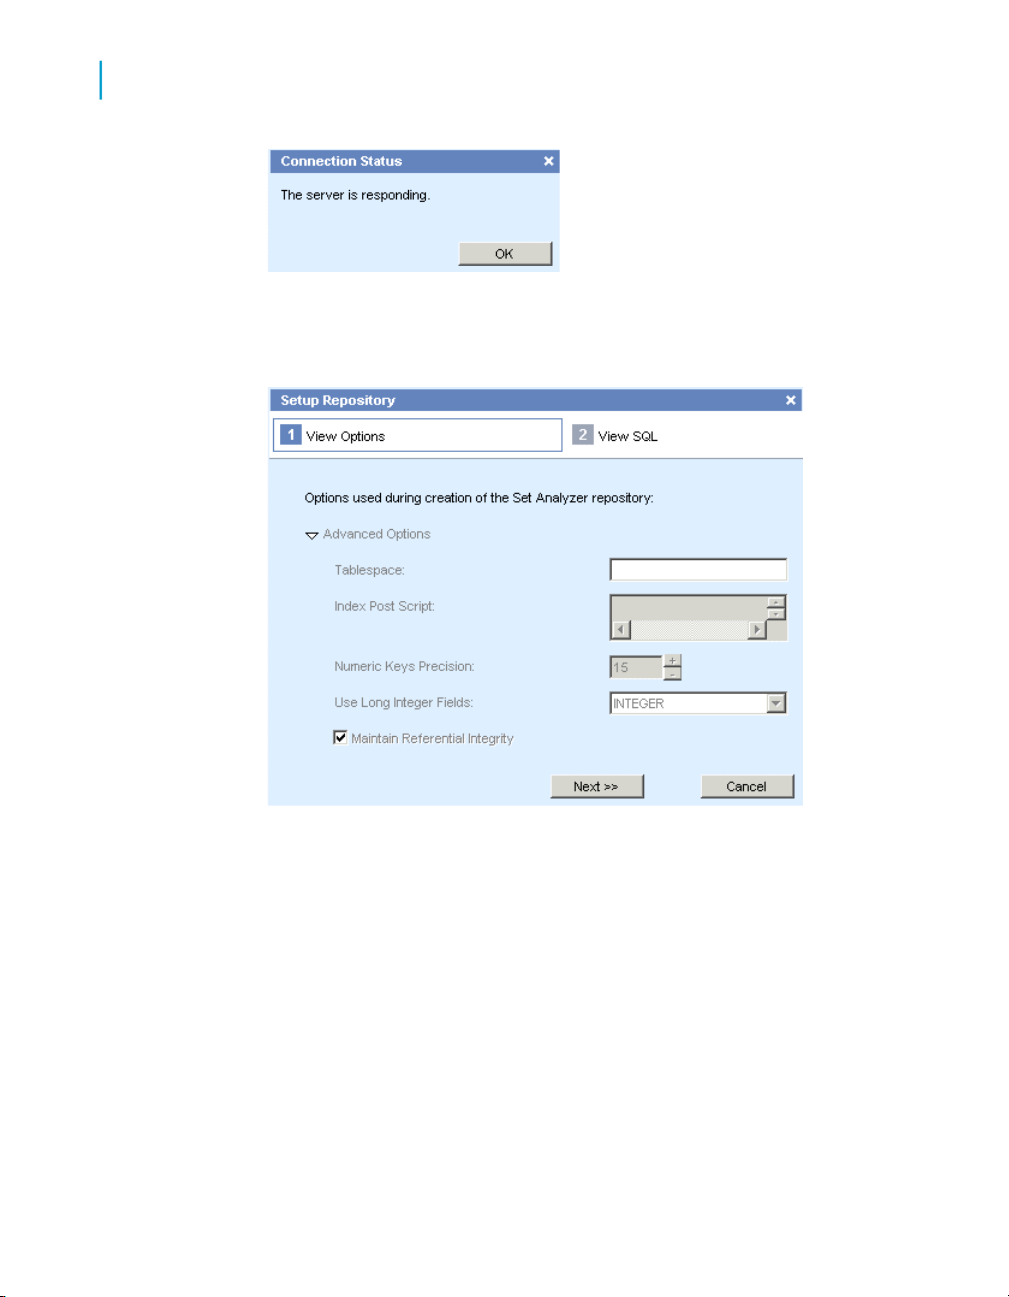
If the system tables have not been created, the "Setup Repository" panel
appears. In the next steps, you create the system tables.
6. Leave the default values, then click Next.
The "View SQL" page of the dialog box appears. This page lists the SQL
to generate.
44 Getting Started with Performance Manager
.

Configuring Performance Manager
Lesson 4: Setting up the repository
3
7. Click Execute.
The Setup executes the SQL.
When the SQL has been generated, a message appears on your screen,
and the system tables management section changes to inform you that
the repository is up-to-date.
Getting Started with Performance Manager 45

Configuring Performance Manager
3
Lesson 5: Adding the universe
8. Click OK.
You return to the "Repository" sub tab.
Lesson 5: Adding the universe
You define, connect, and edit universes in System Setup > Universes.
In this step, you add the universe that you created in Universe Designer .
1. In the "Universe Definition" section, click Add Universe.
The "Add a Universe" dialog box appears.
2. Select demo universe from the "Measure Universe" list.
As you make a selection the name of the universe and the domain in
which it is located appear in the boxes.
3. Click OK.
The demo universe is added to the list of available universes.
46 Getting Started with Performance Manager

Configuring Performance Manager
Lesson 5: Adding the universe
4. Highlight the demo universe that you just added.
The Update button is activated.
5. Click Update.
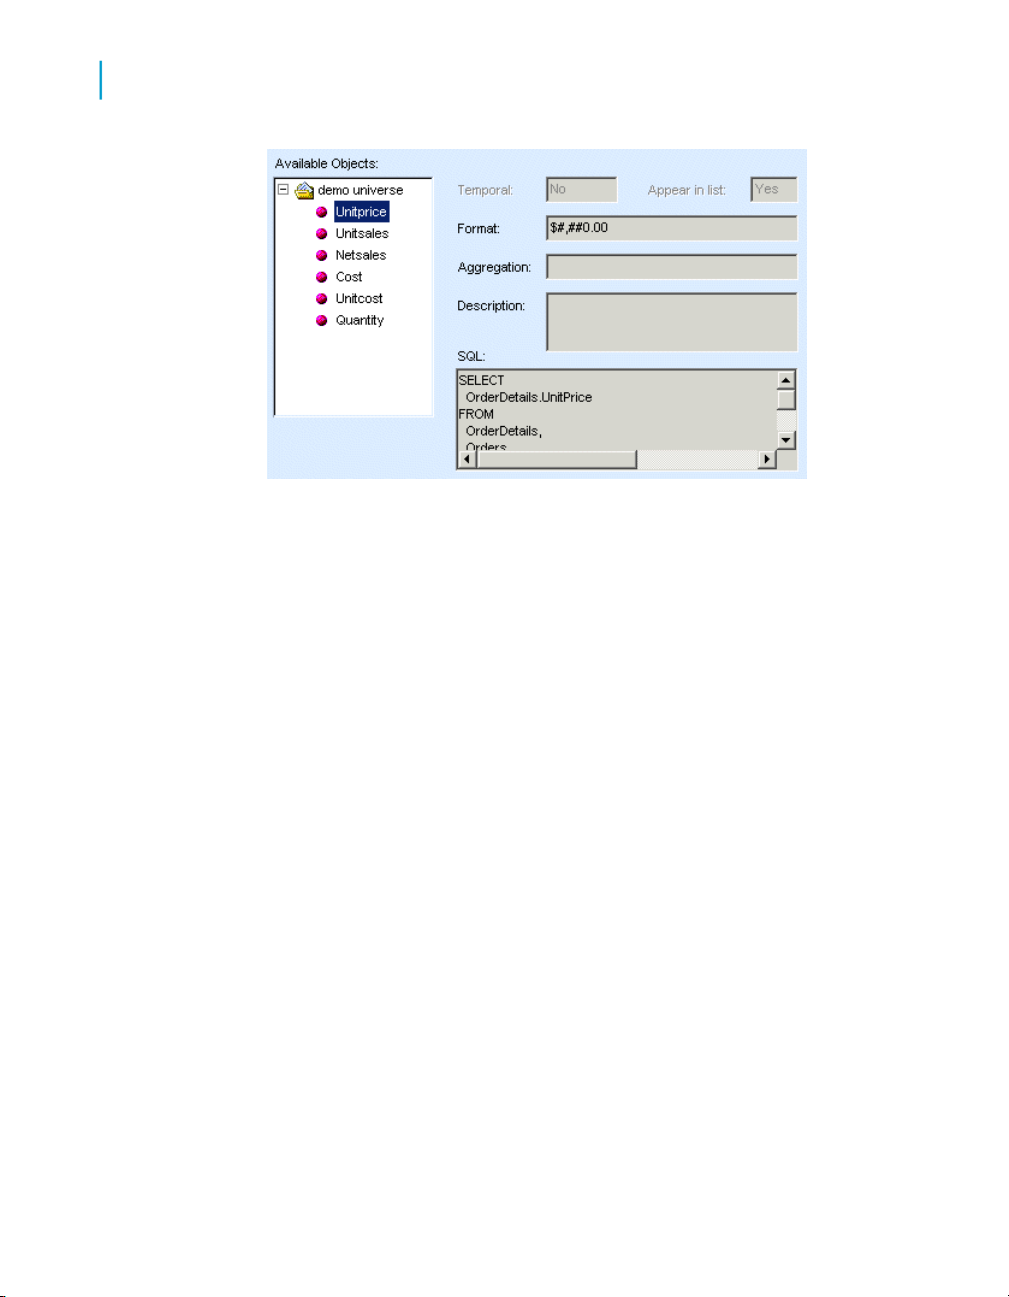
The lower part of the screen displays the universe content.
3
The objects that you created in the demo universe are displayed under
the demo universe folder. As you highlight each of the measures the
corresponding SQL code appears in the "SQL" text box. You can see the
Where clause that you entered in Universe Designer .
Getting Started with Performance Manager 47
Configuring Performance Manager
3
Lesson 6: Calendars
The objects that you created in the demo universe are displayed under
the demo universe folder. As you highlight each of the measures the
corresponding SQL code appears in the "SQL" text box. You can see the
Where clause that you entered in Universe Designer.
Lesson 6: Calendars
You will create the appropriate calendar. Both metrics, which you learn to
create in Lesson 7, and goals, which you learn to create in Lesson 13, are
based on a specific time period. When you create metrics and goals, you
associate them to a calendar.
Several demonstration calendars are delivered with Dashboard Builder and
Performance Manager. If you created the repository with the AFDEMO target
database, which you did in this tutorial, you can view these calendars.
Before you add a calendar, look at the existing ones.
Viewing calendars
1. Click the Time Config tab.
2. Click the Calendar sub tab.
A list of available calendars appears in "Available Calendars".
48 Getting Started with Performance Manager

Configuring Performance Manager
Lesson 6: Calendars
Take a moment to examine the calendar span and parameters of the available
calendars.
The date values in the demo database that you used to create your universe
cover a period of nearly five years, starting in January of 2000.
While you could use one of the existing calendars, for the purpose of this
tutorial you create a calendar.
3
Data is available for nearly every date over the entire period. For this tutorial,
to ensure a clear display of the data points in the Interactive Metric Trend
graph, you create a monthly calendar.
Adding a calendar
1. Click Add.
The "Add a Calendar" panel appears.
Getting Started with Performance Manager 49

Configuring Performance Manager
3
Lesson 6: Calendars
2. Enter the name of the calendar: demo universe.
3. Enter a description: monthly calendar for AFDEMO.
4. Under "Type of Periods", select Calendar.
5. In the "Interval" box, select Monthly.
6. Under "Period Display", select First day of period, and from the "Format"
list select the appropriate format for your computer.
7. Under "Calendar Span", select the values:
• From Jan/2000
• To Dec/2004
8. Click OK.
The "calendar demo" universe appears in the list of available calendars.
50 Getting Started with Performance Manager

Configuring Performance Manager
Lesson 6: Calendars
At this point, you are ready to create metrics on your universe.
9. Click Open > Close Dashboard and Analytics to exit the setup.
For more information about any of the tabs accessed from "System Setup",
click Help within "Dashboard and Anaytics Setup".
3
Getting Started with Performance Manager 51

Configuring Performance Manager
Lesson 6: Calendars
3
52 Getting Started with Performance Manager

Creating Metrics
4

Creating Metrics
4
Before you begin...
You want to compare the average unit price of your products with their
average unit cost. In this lesson, you create two metrics using data from the
universe that you built in Universe Designer: "Average of Unitcost" and
"Average of Unitprice". Then you build an Interactive Metric Trends analytic
using the metrics. The Interactive Metric Trend gives a visual representation
of metric data.
Before you begin...
Before you begin, in InfoView click Open > Dashboard and Analytics >
Performance Manager.
The "Performance Manager " tab contains the following sub tabs that
correspond to tasks that you perform when creating metrics, rules, and goals.
In this tutorial, you use the following sub menus:
• Metrics
• Rules
• Goals Management
Lesson 7: Create a metric
Using Performance Manager, you will create the following metrics based on
the measures from the demo universe that you created in Universe Designer
:
• Average of Unitcost
• Average of Unitprice
• Average of Cost
You create metrics in the "Goal & Metric Publishing Wizard" wizard.
54 Getting Started with Performance Manager

Getting started creating metrics
1. Go to Open > Dashboard and Analytics > Performance Manager >
Metrics.
2. Under "Available Metrics" select demo universe from the list.
3. Click Add and select New Metric from the list.
The "Create Metric" panel opens to "Measure", the first of three steps.
Creating Metrics
Lesson 7: Create a metric
4
Getting Started with Performance Manager 55

Creating Metrics
4
Lesson 7: Create a metric
On the left side of the "Measure" step, under "Select a measure", the
measure objects that you created in Universe Designer are displayed.
On the right side, a list of available aggregate functions is displayed.
Begin by creating a metric for the average unit cost.
Creating the average metrics
1. In the "Measure" step of the "Create Metric" wizard, select Unitcost.
2. Select Average.
56 Getting Started with Performance Manager

3. Click Next.
Creating Metrics
Lesson 7: Create a metric
4
The dialog box changes to display the "Filters" step.
Only one filter is available, None.
4. Select None, then click Next.
The "Create Metric" dialog box changes once again to display the
"Attributes" step.
Getting Started with Performance Manager 57

Creating Metrics
4
Lesson 7: Create a metric
By default, "Average of Unitcost" appears as the metric name.
5. In the "Calculation interval" box, select demo universe.
Leave the default values under:
• "Refresh type"
• "Storage options"
• "Parameters"
6. Click the calendar icon under "Metric History", then select the start date
Jan / 2000.
58 Getting Started with Performance Manager
Creating Metrics
Lesson 7: Create a metric
7. Activate Stop metric calculation and select the stop date Dec / 2001.
8. Click Finish.
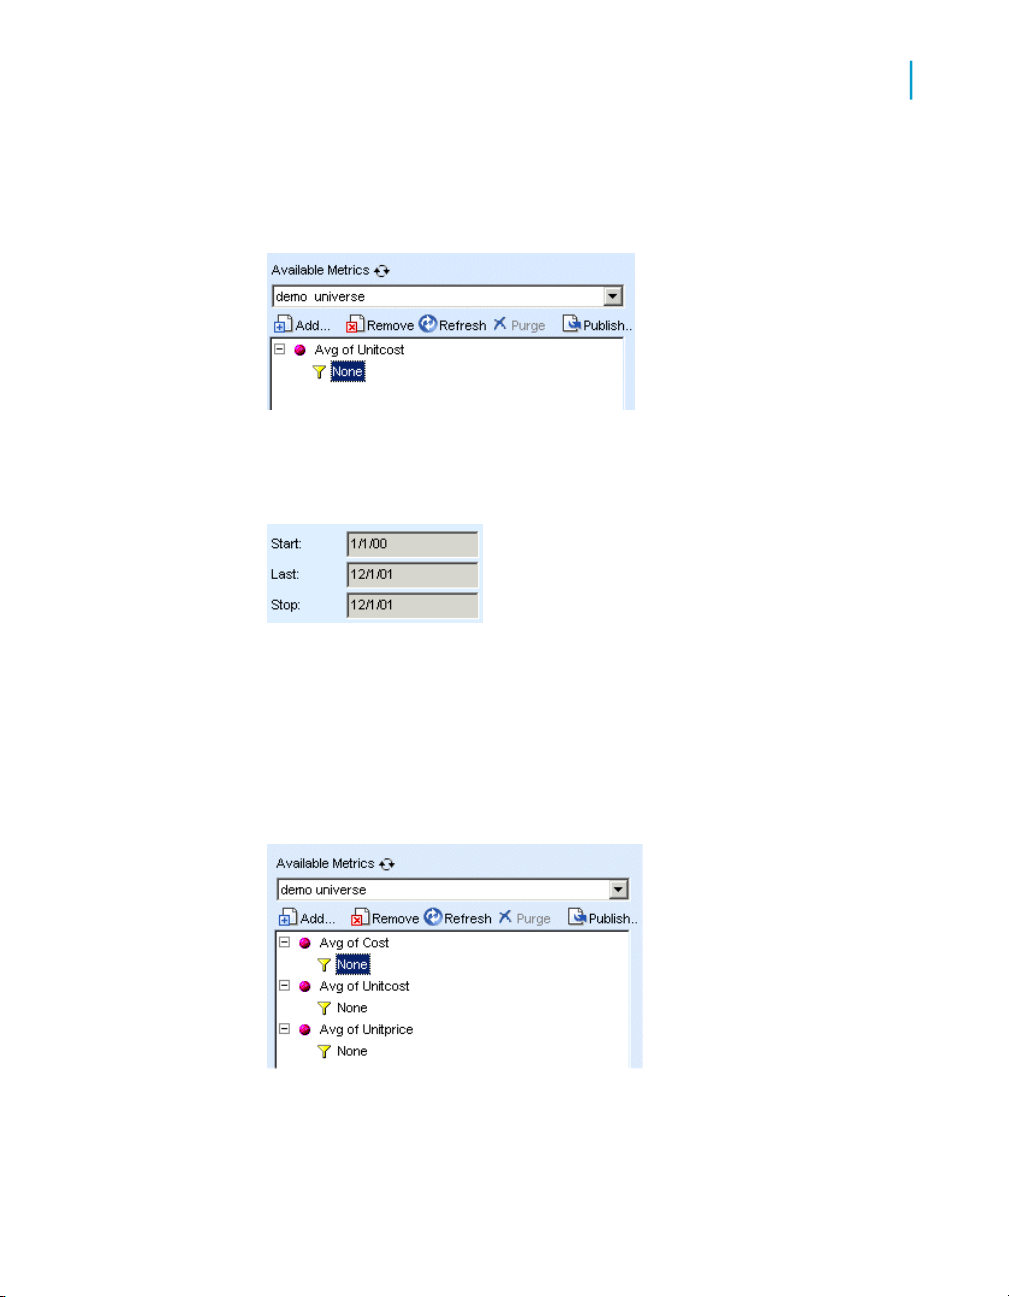
The metric "Avg of Unitcost" is added to the list of available metrics.
9. Click Refresh, then OK to confirm the operation.
When the metric is refreshed, the "Metric history" section of the dialog
box changes to display the "Start", "Last", and "Stop" dates of the metric.
4
Caution:
If you forget to click Refresh, the data does not display properly when
you create your analytic because the latest data has not been retrieved
from the database.
10. Repeat the above procedure to create two metrics:
• "Avg of Unitprice"
• "Avg of Cost"
You have created three metrics that you are going to use to create analytics.
When you created your universe in Universe Designer, you created two
dimensions along with the measures.
Getting Started with Performance Manager 59

Creating Metrics
4
To learn more about metrics
Filters are conditions that limit the information that is returned to that specific
information that is most useful to you.
Using filters is an integral part of using the Performance Manager, however
you do not use them in this tutorial. For more information on using filters,
refer to the Performance Manager documentation.
To learn more about metrics
To learn more about creating metrics, such as creating sliced, manual-entry,
and external metrics, you can do one of the following:
• Refer to the Performance Manager documentation available on the
Business Objects website or in the Performance Manager application.
• Enroll for Business Objects classroom training and eLearning. For more
information, consult Business Objects Education Services at the following
location: http://www.businessobjects.com/services/training/.
60 Getting Started with Performance Manager

Creating Analytics
5

Creating Analytics
5
Before you begin...
In this lesson you learn how to create an Interactive Metric Trend graph and
a Speedometer gauge using the metrics that you created in the preceding
chapter.
Before you begin...
Before you start creating analytics, you need to create a folder and a category
in the InfoView Document List.
Note:
For the purposes of this tutorial, you will create a folder in the "My Favorites"
personal folder, however if you were publishing an actual corporate analytic,
you would create a folder in "Corporate Folders" so that others could view
its contents.
Creating a Folder
1. In InfoView, click Document List.
2. In the "Folders" tree, select My Favorites.
3. Click New > Folder
62 Getting Started with Performance Manager

4. In the "Create Folder" panel, type demo folder.
5. Click OK.
The demo folder appears in the "My Favorites" list.
Creating Analytics
Before you begin...
5
Creating a Category
Categories are used to classify documents.
1. In InfoView, click Document List.
2. In the "Categories" tree, select Personal Categories.
Getting Started with Performance Manager 63

Creating Analytics
5
Before you begin...
3. Click New > Category
4. In the "Create Category" panel, type demo category.
5. Click OK.
The demo category appears in the "Personal Categories" list.
64 Getting Started with Performance Manager

Creating Analytics
Lesson 8: Create an Interactive Metrics Trends (IMT) analytic
Lesson 8: Create an Interactive Metrics
Trends (IMT) analytic
You are ready to create an analytic. In this procedure, you create an IMT
analytic to compare the "Average of Unit cost" to the "Average of Unit Price".
In the first step of creating your analytic, you select the data to display.
What is an Interactive Metric Trends graph?
An Interactive Metric Trend (IMT) graph lets you analyze trends in data. In
this lesson, you create an IMT that compares the average unit cost to the
average unit price of the products that you are selling. You can see at a
glance when an increase in price offsets an increase in cost.
Selecting the data
5
1. In Dashboard and Analytics > Dashboard Builder, click Create New
Analytic.
The "Create New Analytic" sub tab displays a list of analytic categories
that are available to you according to the Dashboard and Analytics
applications installed. By default the "Dashboard Analytics" category is
selected.
2. Click Interactive Metric Trends.
Getting Started with Performance Manager 65

Creating Analytics
5
Lesson 8: Create an Interactive Metrics Trends (IMT) analytic
The page changes to display the IMT edit panel.
3. Expand "Select Metrics to Display", then select Top Metrics from the list.
4. Click Add.
The "Add a Metric" panel appears.
5. Select demo universe.
66 Getting Started with Performance Manager

Creating Analytics
Lesson 8: Create an Interactive Metrics Trends (IMT) analytic
6. Expand Avg of Unitcost and highlight the None filter beneath it.
7. Click OK.
8. Repeat steps 4-7 for Avg of Unitprice.
Do not modify the default values on the page.
5
The metrics are displayed in the "Select Data to Display" list as shown
below:
Getting Started with Performance Manager 67

Creating Analytics
5
Lesson 8: Create an Interactive Metrics Trends (IMT) analytic
Editing the chart display options
In this step you edit the graph and legend options.
1. Expand Graph and Legend.
The page changes to display the various options available.
2. Under "Title and Legend Options", activate Display Text.
3. In the text box, type the title for your analytic: Avg Unit Cost vs Avg Unit
Price.
Under "Legend", activate Show Legend.
4. Expand Display Mode.
5. Activate the following options:
• Hide Selected Metrics panel
• Hide Graph Options panel
68 Getting Started with Performance Manager

Creating Analytics
Lesson 8: Create an Interactive Metrics Trends (IMT) analytic
6. Click OK.
The IMT analytic is displayed.
Note:
If this is the first time you are working with analytics, and the Dashboard
and Analytics "Rich Client Option" in the InfoView Preferences is
deactivated, a panel appears requesting that you download Adobe SVG
Viewer. Accept the installation request and follow the installation
instructions. This only takes a few minutes, depending on your connection
speed. If you want view analytics using Macromedia Flash. You activate
Use Macromedia Flash when available under "Rich Client Option".
Each data point corresponds to a value that is calculated from the data in
the "OrderDetails" table that you used when you created the "demo universe"
in Universe Designer .
Take a few minutes to highlight the data points. As you place your cursor
over each data point, the date and the dollar value of your data on that date
appears on your screen.
5
When you added the demo universe calendar in Lesson 6, you selected a
monthly time interval. Vertical black lines on the X axis represent the data
intervals.
Before doing anything else, save your analytic!
Saving your analytic
1. Click Save As.
A save information page appears.
Getting Started with Performance Manager 69

Creating Analytics
5
Lesson 8: Create an Interactive Metrics Trends (IMT) analytic
2. Under "General", enter the title demo imt.
3. Enter the description Avg unit cost to avg unit price Jan 2000 to Dec 2001.
4. In "Location", expand Favorites Folder, and highlight demo folder.
5. In "Categories", expand Personal Categories and select demo category.
6. Click OK and close the analytic.
70 Getting Started with Performance Manager

Creating Analytics
Lesson 9: Create a speedometer gauge with a prompt
Lesson 9: Create a speedometer gauge
with a prompt
In this section you create a Speedometer gauge with a metric prompt.
Your boss wants to be able to see at a glance whether the average total cost
of specific products sold each month is within an acceptable range.
A speedometer is an excellent means of displaying this information, because
it shows the value of the data at a given point in time on a color-coded
background. Because your boss often asks for the average unit prices and
unit costs of products sold, you need a prompt that asks your boss which of
these questions she wants answered when she opens the analytic.
A "Prompt for a Metric" in the "Select Data to Display" list of the analytic edit
panel allows you to set up a prompt that appears when the analytic is opened.
This prompt allows you to select any metric in the universe, and always
defaults to the last metric selected using the prompt. You determine the
prompt text that appears. For example, if you want to set up a prompt on a
product line universe, you can create a prompt that asks "What product line
do you want to see?"
5
What is a speedometer?
A speedometer is a gauge that displays data in a given range based on
pre-determined values.
Creating a metric prompt on a Speedometer analytic
1. In Dashboard and Analytics > Dashboard Builder, click Create New
Analytic.
2. From the "Dashboard Analytics" category, click Speedometer.
Getting Started with Performance Manager 71

Creating Analytics
5
Lesson 9: Create a speedometer gauge with a prompt
The page changes to display the analytic edit page.
72 Getting Started with Performance Manager
Creating Analytics
Lesson 9: Create a speedometer gauge with a prompt
5
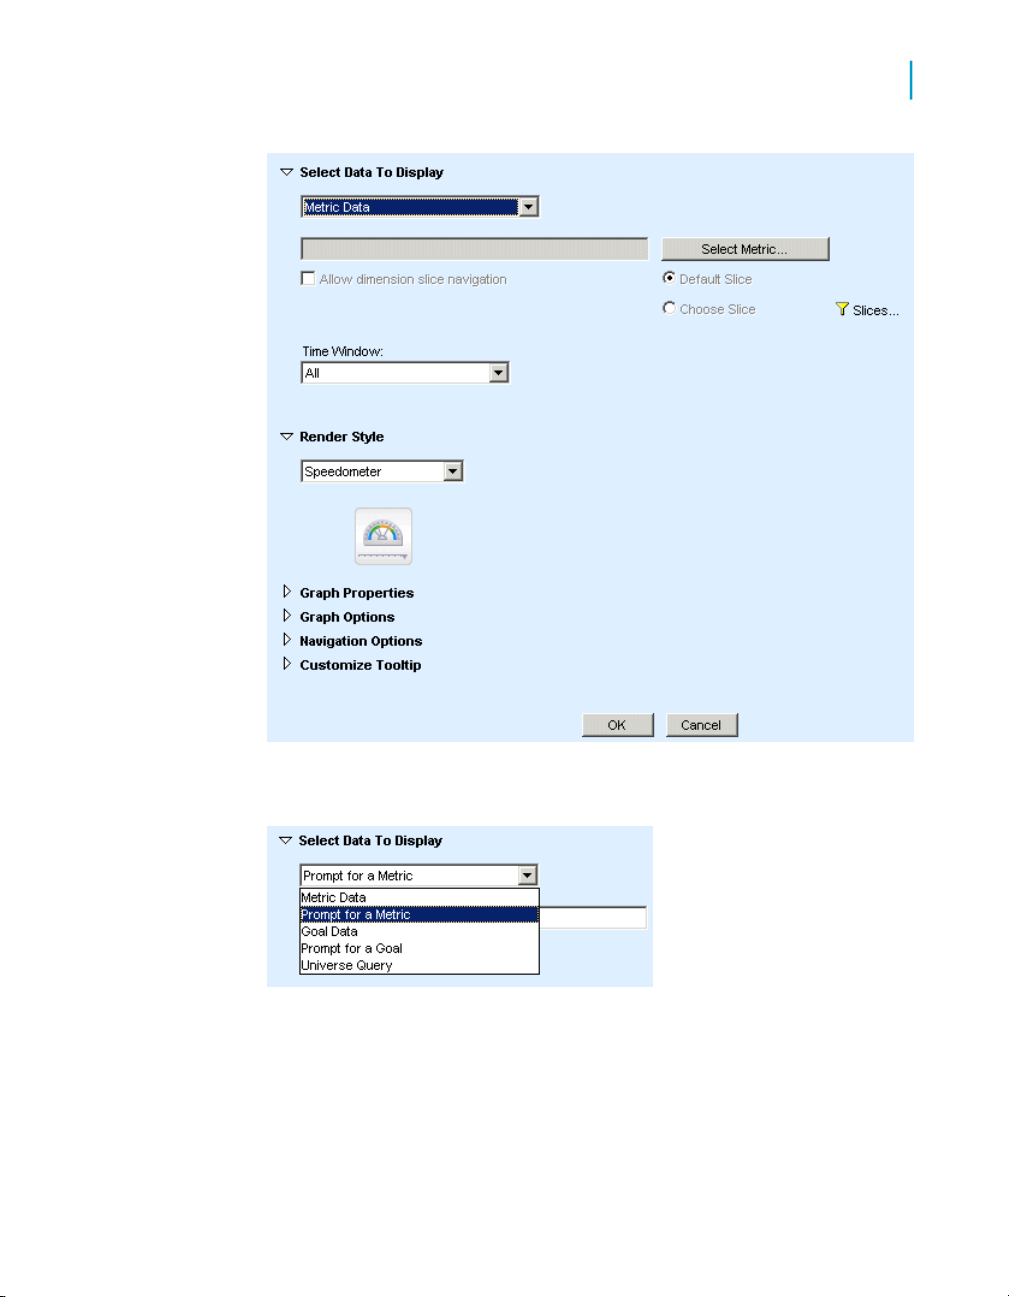
3. Expand "Select Data to Display".
4. Select Prompt for a Metric from the list.
5. Type Which averages do you want to see?
Getting Started with Performance Manager 73

Creating Analytics
5
Lesson 9: Create a speedometer gauge with a prompt
6. Expand Render Style.
Speedometer is selected by default.
In this tutorial, you do not modify the other graph and navigation options.
Note, however, that the "Graph Properties" section contains two options,
"Boundaries" and "Zone" that allow you to change the speedometer
appearance.
7. Click OK.
8. In the "Select a metric" panel, select demo universe from the dropdown
list.
9. From the list of available metrics, expand Average of Cost and highlight
the filter None.
10. Click OK.
The speedometer prompt now shows the metric you selected.
74 Getting Started with Performance Manager
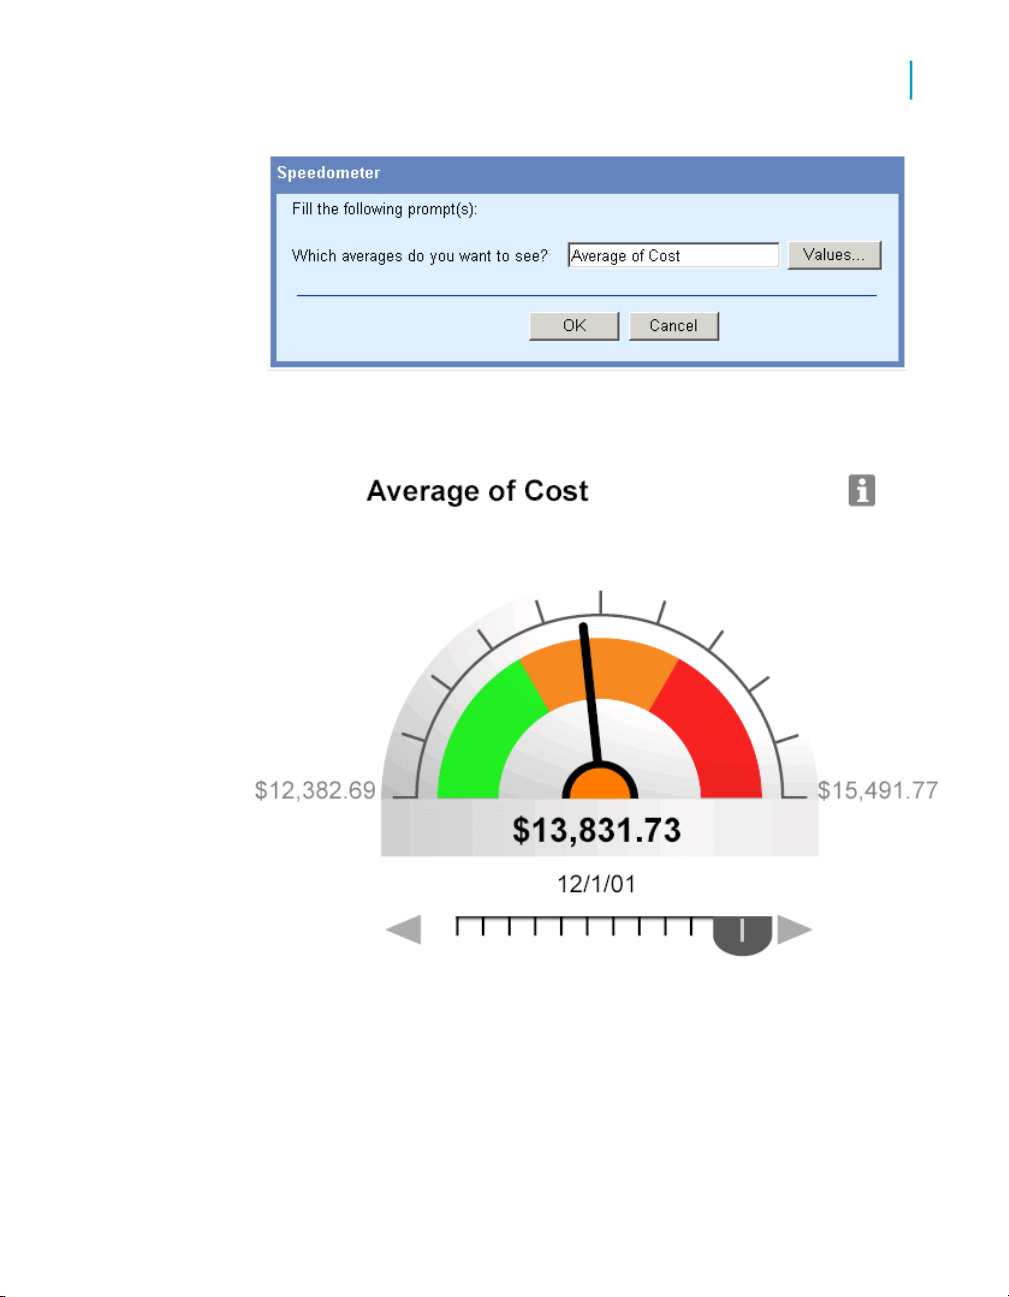
11. Click OK.
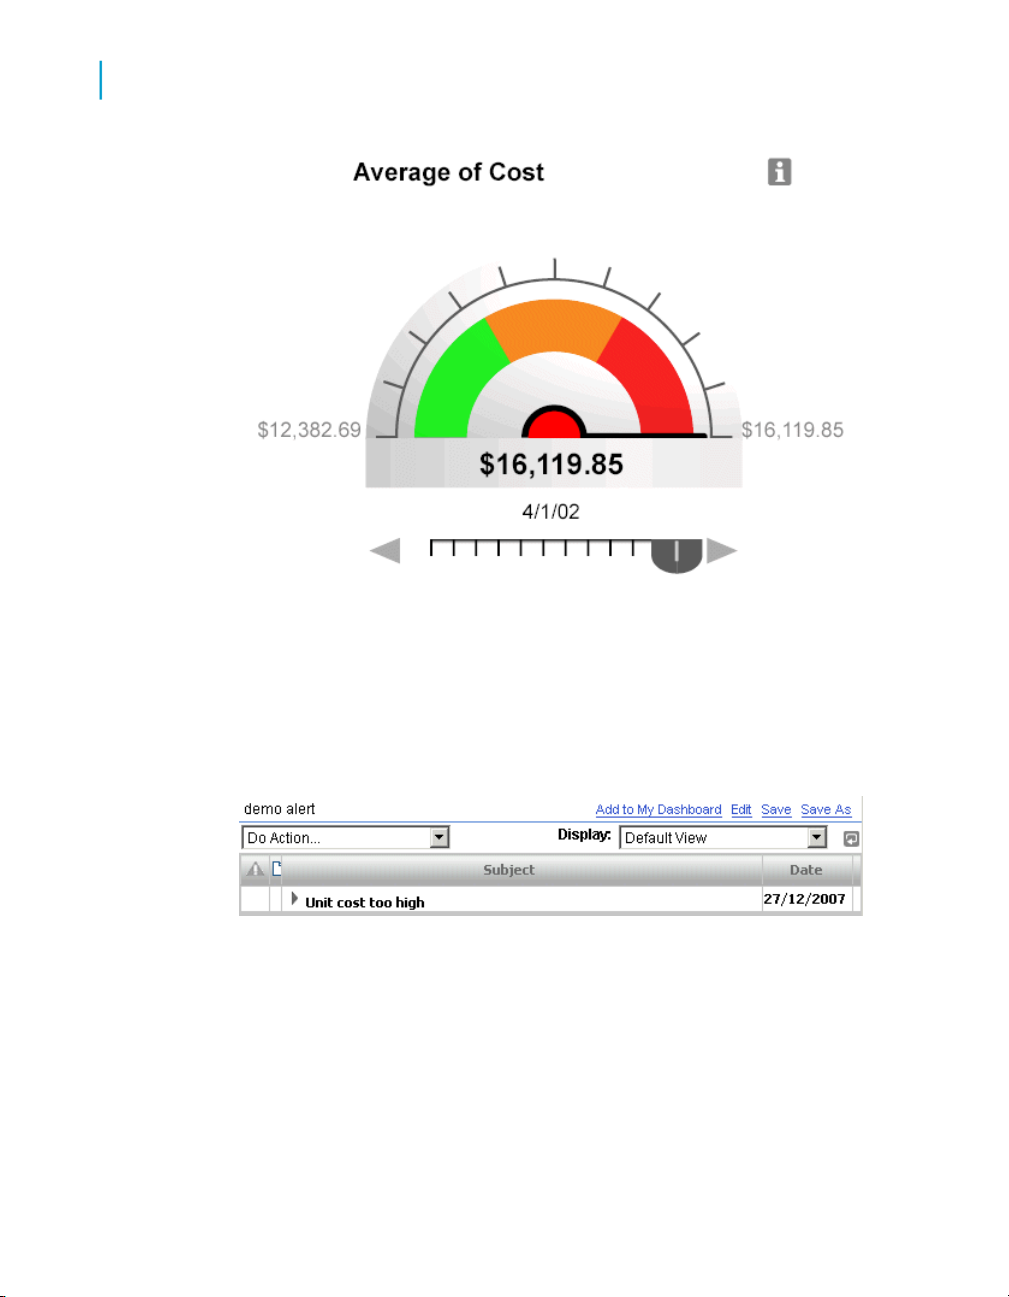
The speedometer appears.
Creating Analytics
Lesson 9: Create a speedometer gauge with a prompt
5
The needle points to the value on 12/1/01, $13,831.73 which is in the
orange, or caution, zone. By using your cursor to slide the pointer on the
slider below the speedometer, you can view values on different dates.
For example, the average of total costs on 1/1/01 is $12,896.33, which
lies in the acceptable zone. On the other hand, on 8/1/01, average of total
costs was $15,251.79 which was in the red, or unacceptable, zone.
Getting Started with Performance Manager 75

Creating Analytics
5
Viewing what you have accomplished
Saving your Speedometer analytic
1. Click Save As.
2. Under "General", enter the title demo gauge.
3. Enter the description Prompt for average cost and price.
4. In "Location", expand Favorites Folder, and highlight demo folder.
5. In "Categories", expand Personal Categories and select demo category.
6. Click OK and close the analytic.
Viewing what you have accomplished
In InfoView, look at what you have completed.
Go to Document List > My Favorites.
In demo folder, you find the:
• demo gauge
• demo imt
In the next lesson you learn how to create a rule with an alert for the demo
imt.
To learn more about analytics
To learn about...
• Query-based analytics
• Statistical analytics
• Pareto Chart analytics
• Map and Metric Tree analytics
Do one of the following:
• Refer to the Performance Manager and Dashboard Builder documentation.
• Enroll in Business Objects classroom training or eLearning. For more
information, consult Business Objects Education Services at the following
location: http://www.businessobjects.com/services/training/.
76 Getting Started with Performance Manager

Creating Rules and Alerts
6

Creating Rules and Alerts
6
Before you begin...
In this lesson you learn how to create a rule that sends an alert when the
value of the specified data is higher than a specified value.
In this lesson, you learn how to:
• create an Alerts analytic
• create a basic rule
• refresh metrics to activate an alert
Before you begin...
Before you begin, take another look at the data points in demo imt. The
average unit cost of your products was relatively stable throughout 2000 until
April 2001 when the average unit cost dropped approximately $70. The
average unit price also dropped proportionately to the average unit cost.
The president of your company wants to be notified when the average unit
cost exceeds $200. You create a rule to meet this requirement.
Assume that the current month is April 2002.
What are Rules and Alerts?
A rule is a method of telling Performance Manager what to do when a specific
condition is met.
A rule:
• is triggered by an event
• evaluates a condition
• raises an action if the condition is verified
An alert is an action executed by the rules engine. When you create a rule
to raise an alert, you determine whether the scope of the alert is available
only to you, or to all.
Rules and alerts automate the process of detecting and interpreting change,
and delivering relevant analysis to key individuals or operational systems.
78 Getting Started with Performance Manager
Creating Rules and Alerts
Lesson 10: Create an Alerts analytic
You can use rules to track large changes, generate lists, and automate basic
procedures like refreshing a report.
The "Rules" sub tab in Performance Manager allows you to create these
rules.
You can do the following:
• create a rule
• define events, a condition, and actions for a rule
• edit, execute or delete an existing rule
• duplicate a rule
You use the Alerts analytic to receive and view your alerts.
6
Lesson 10: Create an Alerts analytic
The rule that you will create in this lesson alerts you if the average unit cost
exceeds $200.
First you create the Alerts analytic, then you create the rule to raise the alert.
You can create an Alerts analytic from the "Create New Analytic" sub tab in
Dashboard Builder or via InfoView.
Getting Started with Performance Manager 79

Creating Rules and Alerts
6
Lesson 10: Create an Alerts analytic
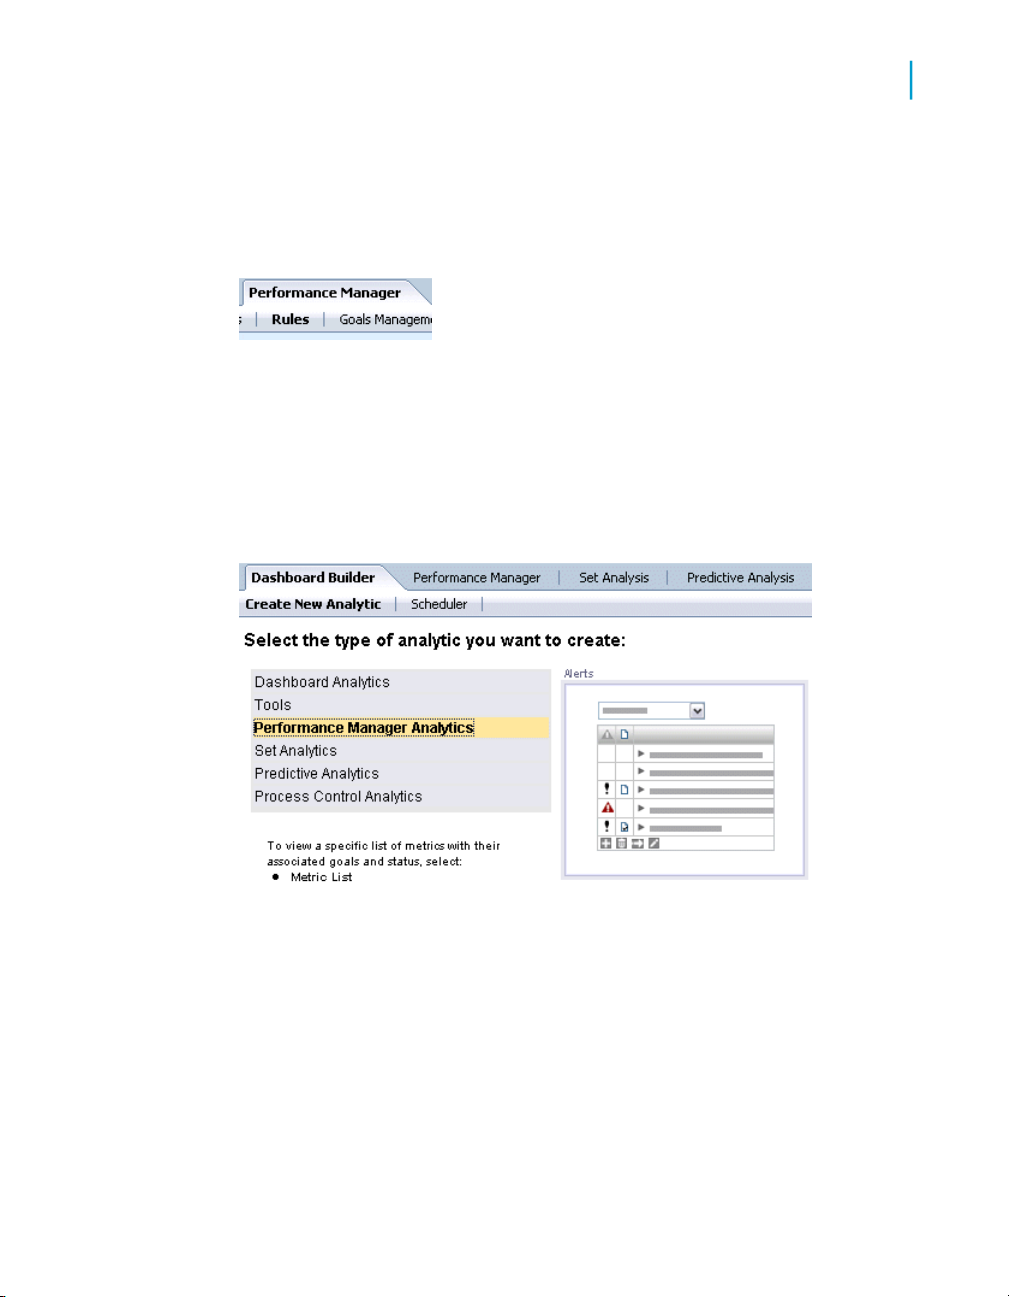
You can access the "Create New Analytic" page directly from InfoView.
Accessing the InfoView analytic creation page
1. From InfoView "Document List", click New > Analytic.
A list of options appears.
2. Select Analytic.
The analytic creation page opens in InfoView.
By default, the page opens to the "Dashboard Analytics" category.
80 Getting Started with Performance Manager

Creating Rules and Alerts
Lesson 10: Create an Alerts analytic
3. Select the "Performance Manager Analytics" category.
4. Click the Alerts analytic icon.
The Alerts analytic edit page appears.
6
Configuring the Alerts analytic
You use categories to classify alerts by importance.
1. Deactivate Display only private alerts.
2. Activate Display alerts with the same title only once.
3. Click OK.
Getting Started with Performance Manager 81

Creating Rules and Alerts
6
Lesson 11: Create a rule
The alert analytic appears.
4. Click Save As.
5. Enter the title demo alert, and save the alert in "Favorites Folder" in "demo
folder".
Lesson 11: Create a rule
Rules are typically created from existing templates designed by the metric
designer or by the system administrator.
In this example you use the Generic rule, which is an alert "on this event, if
a condition is met, do actions".
The most common types of events to trigger rules are:
• Schedule
• Metric refresh
• Named event (initiated by an event external to Performance Manager)
Viewing business rules
Before you create your first rule, look at some of the available business rules.
Go to Performance Manager > Rules.
The list of rules appears.
82 Getting Started with Performance Manager

Creating Rules and Alerts
Lesson 11: Create a rule
When you select a rule in the "Available Business Rules" list, the description
of the rule appears in the lower pane. In each case, there is an event, a
condition, and an action. In some cases, the rule allows feedback to be sent
to a specific person.
6
Creating a rule on the metric
You want to create a rule to send an alert when the average unit cost exceeds
$200.
1. On the "Rules" sub tab under "Available Business Rules", click Add.
The "Add Rule" panel appears.
Getting Started with Performance Manager 83

Creating Rules and Alerts
6
Lesson 11: Create a rule
2. Enter the name demo rule.
3. Select the Activated checkbox.
4. Under "Scope", select Public.
Activating the "Scope" option allows all users to view your alert.
5. From the "Template List", select Generic rule.
The description of the rule appears in the dialog box under "Rule
description".
84 Getting Started with Performance Manager

Creating Rules and Alerts
Lesson 11: Create a rule
At this point, you define each of the components of the rule.
6
Defining the event
You define the event, the condition, and the action on each rule in a series
of dialog boxes.
1. Click Events.
The "Rule triggering events" panel appears.
Getting Started with Performance Manager 85

Creating Rules and Alerts
6
Lesson 11: Create a rule
2. Under "Type of Events", select metric refresh, then click >> to move the
event to the "Triggering events" list box.
The "Metric Selection" panel appears.
3. Select demo_universe from the dropdown list.
4. Under "Available metrics", click Avg of Unitcost, then highlight the filter,
None.
5. Click >>.
"Average of Unitcost" appears in the "Selected metric(s)" list box.
6. Click OK, then OK a second time, to return to the "Add Rule" panel.
Now you define the condition.
Defining the condition
1. In the "Add Rule" panel, click Condition.
The "Condition Formula Editor" appears.
Under "Variables", the metric that you selected appears as a variable:
metric1 = Average of Unitcost
Under "Functions and Operators" you can see some folders that contain
the functions and operators that you use in rules.
2. Under "Formula", enter the following: METRICVALUE(metric1.ID,0)>200
86 Getting Started with Performance Manager
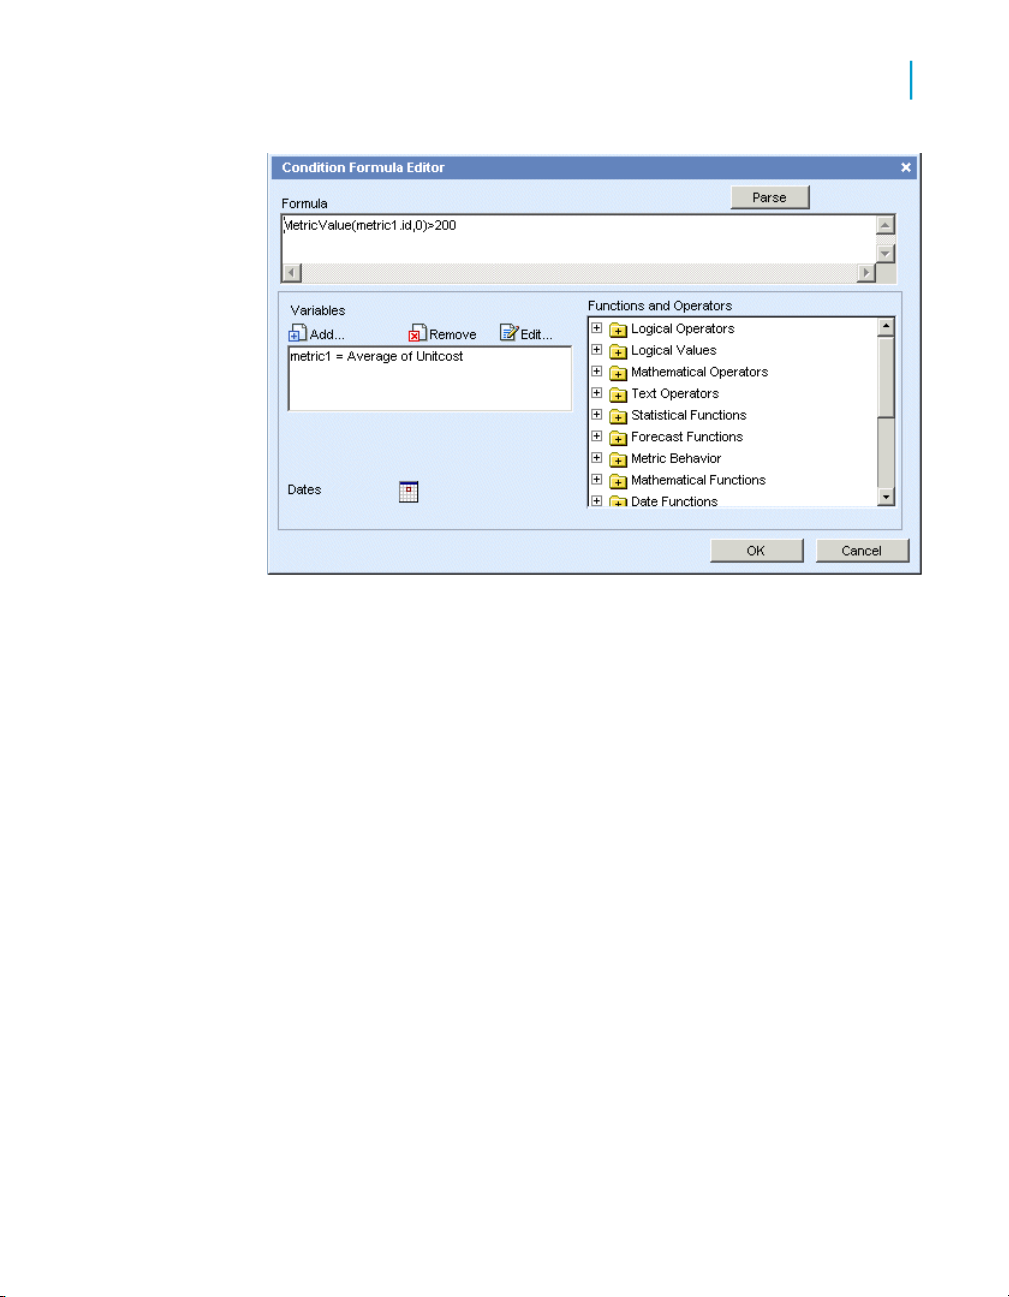
3. Click Parse to check the syntax of the formula.
A message box appears to tell you that the parsing is OK.
Creating Rules and Alerts
Lesson 11: Create a rule
6
4. Click OK, then OK a second time to return to the "Add Rule" panel.
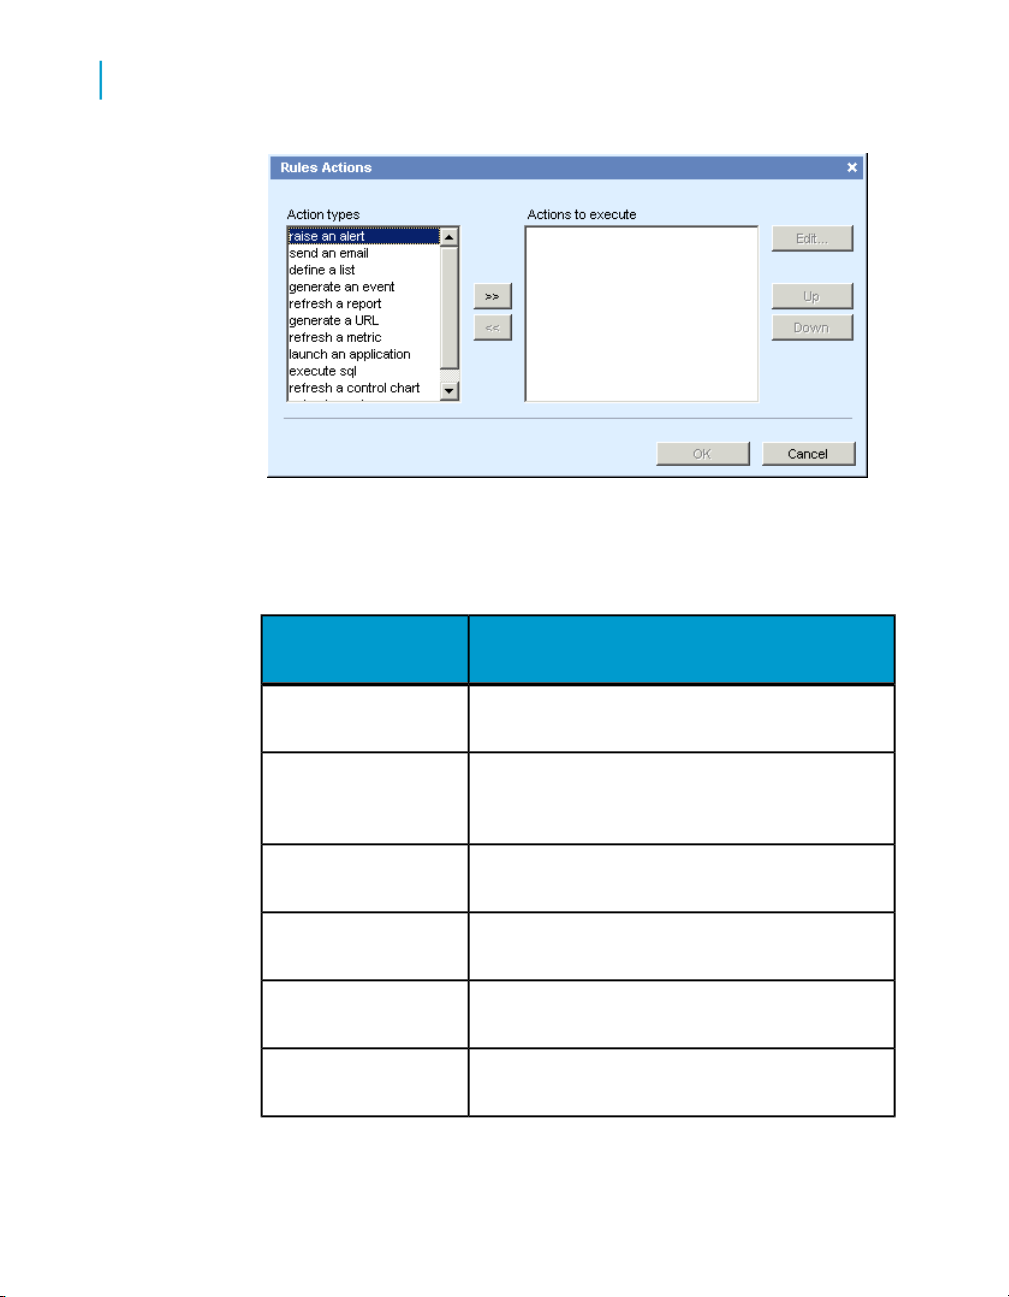
Selecting the action
1. Click Actions.
The "Rules Actions" panel appears.
Getting Started with Performance Manager 87
Creating Rules and Alerts
6
Lesson 11: Create a rule
2. Under "Action types", select raise an alert.
The "Alert definition" panel appears.
Complete the "Alert definition" dialog box as follows:
Type or selectUnder
Alert title
Scope
Alert text
88 Getting Started with Performance Manager
Unit cost too high
Public, which makes the alert available to everyone
InformationLevel
The average unit cost exceeds $200.
Leave blankAssociated Report
Leave blankCategory

Creating Rules and Alerts
Lesson 11: Create a rule
Type or selectUnder
NeverAlert expiration
6
3. Click OK.
You return to the "Rules Actions" panel.
Under "Actions to execute" the following appears: "create the alert: Unit
cost too high".
4. Click OK, then click OK in the "Add Rule" panel.
Getting Started with Performance Manager 89
Creating Rules and Alerts
6
Lesson 11: Create a rule
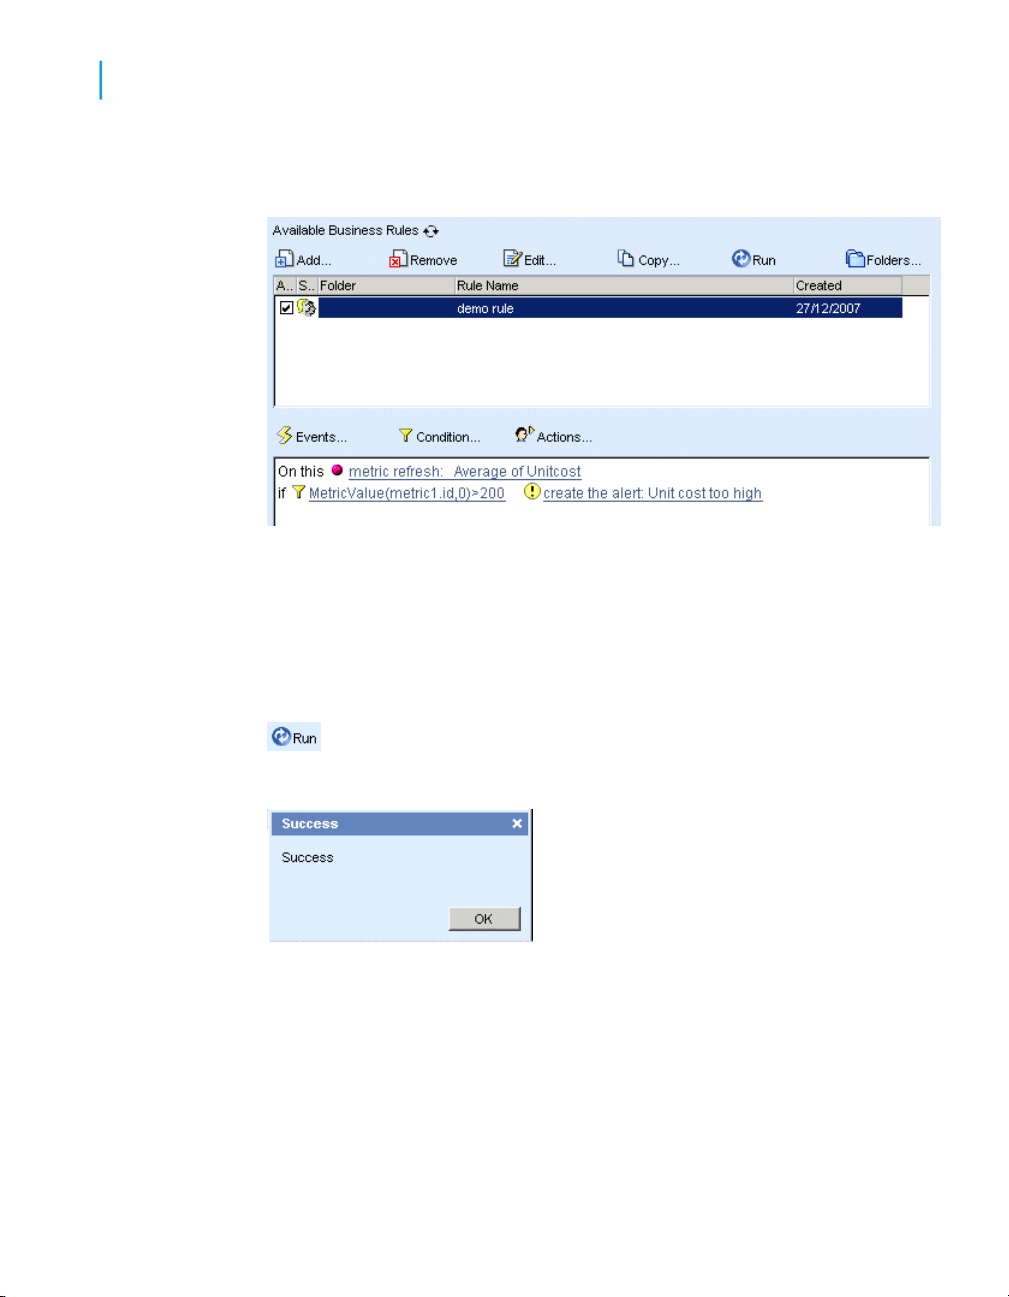
Now test the rule.
Testing the rule
The rule you created, "demo rule", appears in the list of available business
rules.
1. Highlight the rule, then click Run.
The message box "Success" appears on your screen.
This message means that your test has run successfully.
2. Click OK.
Note:
An alert is sent only when the condition set in the alert is met. It is possible
for your test to run successfully without an alert being sent.
90 Getting Started with Performance Manager

Creating Rules and Alerts
Lesson 12: Refreshing your metrics
Lesson 12: Refreshing your metrics
For this example you need new data. You update your metrics for "Average
Unitprice" and "Average Unitcost".
1. Click Performance Manager > Metrics.
2. Under "Available Metrics", select demo universe from the dropdown list.
3. Highlight "Avg of Unitcost", then click Purge.
The "Metric Purge" panel appears.
6
4. Select Purge all periods, then click OK.
All the data is deleted, or purged, from the metric.
5. Highlight the filter, None under "Avg of Unitcost".
6. Under "Metric history", set the value for the "Stop metric calculation" to
Apr 2002.
Getting Started with Performance Manager 91

Creating Rules and Alerts
6
Lesson 12: Refreshing your metrics
7. Click Apply.
8. Click Refresh, then OK to confirm.
The data is refreshed.
The "Metric history" data changes. The start date is unchanged, but the
last date and the stop date are now set to 4/01/02.
9. Repeat steps 3 - 8 for "Avg of Unitprice".
You have updated the period of the metrics. These updated metrics are
automatically applied to demo imt.
Viewing the effect of the refreshed metric in your IMT
Return to InfoView to look at your analytics.
1. In Document List > My Favorites > demo folder, select "demo imt".
2. Click Actions > View.
3. In the title bar of "demo imt", click the expand icon.
The demo imt appears.
4. Click the refresh icon.
92 Getting Started with Performance Manager

Creating Rules and Alerts
Lesson 12: Refreshing your metrics
The IMT changes to display new data points.
5. Click Save.
Examine the analytic. Data points have been added to show the average
unit cost and average unit price for the additional months.
Place your cursor over the last data point for "Average of unitcost".
The tooltip displays the average unit cost on 4/1/02 as $433.00 which
exceeds the limit of $200.
Viewing the effect of the refreshed metric in your speedometer
From Document List > My Favorites > demo folder, double-click on demo
gauge.
The speedometer has not changed.
6
You have updated the metrics for "average unit cost" and "average unit
price", but you did not update the metric "average of cost", which was used
in creating the speedometer.
Return to Performance Manager and update the "average of cost" metric to
April 2002 following the steps in Lesson 12. Remember to refresh the metric
after you have purged it.
When you reopen demo gauge and refresh it, the average cost on 4/1/02 is
over $16,000 and is well in the red, or unacceptable, zone!
Getting Started with Performance Manager 93
Creating Rules and Alerts
6
Lesson 12: Refreshing your metrics
Viewing the effect of the refreshed metric on your Alerts list
Open demo alert from your demo folder. You see the alert you created: "Unit
cost too high".
Click the arrow next to the alert title.
The alert opens and you can read the text you entered: "The average unit
cost exceeds $200."
94 Getting Started with Performance Manager

If the average unit cost had been under $200, the rule would have run without
meeting the condition, so you would not have received an alert.
To learn more about rules
To learn more about using variables and creating rules on sliced metrics,
refer to the Performance Manager documentation. For information on
Performance Manager coursework, consult Business Objects Education
Services at the following location: http://www.businessobjects.com/ser
vices/training/.
Creating Rules and Alerts
To learn more about rules
6
Getting Started with Performance Manager 95

Creating Rules and Alerts
To learn more about rules
6
96 Getting Started with Performance Manager

Creating a Goal
7

Creating a Goal
7
Before you begin...
The objective of this lesson is to create a metric called "average of net sales",
and to set target values on this metric by creating a goal.
Before you begin...
You use Performance Manager to create goals.
Prepare a metric on which to base the goal
For this lesson pretend that the current month is August 2000. Create a
metric in Performance Manager > Metrics called "Average of Netsales" for
the period from January to August 2000.
If you are unsure of how to create the metric, refer to the procedures in the
lesson on "Creating Metrics" for creating the average of unit cost metric and
the average of cost metric.
Once you have created the "Average of Netsales" metric, you are ready to
create your goal.
98 Getting Started with Performance Manager

Getting started
Your company president wants to view the average net sales of the products
that your company sells. The net sales are the total sales less the discount,
which varies from one order to another.
The company to increase net sales in the year 2000 by three percent per
period of one month, however your boss will tolerate under-performance of
one percent.
In this lesson, you create a goal on the metric "Average of Netsales" for the
year 2000.
Lesson 13: Create the goal
When you create a goal, you are setting a target and then determining a
range in which off-target performance is permitted. This range is called the
tolerance zone. You can set either absolute values or percentage values for
the upper and lower tolerance levels. You can also choose not to set a
tolerance level.
Creating a Goal
Getting started
7
You create your goal using the "New Goal" wizard.
Start creating the goal
You need to have created an "Average of Netsales" metric. For more
information, refer to the "Before you begin..." section in this lesson.
1. In Performance Manager, click the Goals Management sub tab.
2. Under "Available Goals", select demo universe.
3. Click Add.
The "New Goal" wizard opens to the "Name and Metric" step.
Getting Started with Performance Manager 99

Creating a Goal
7
Lesson 13: Create the goal
In this step, you identify the goal.
4. Under "Goal Info" in the "Goal Name" text box, type Average net sales
goal.
5. From the "Goal Type" dropdown list, select None.
Target types are useful as a filing system when you have many goals,
however in this tutorial you do not use goal types.
6. Under "Metric Info", click Select a Metric.
The "Select a Metric" panel appears.
7. Select the None filter for Avg of Netsales, then click OK.
8. Under "Goal span", select the following dates:
• From: Jan / 2000
• To: Jan / 2001
The "Name and Metric" step now looks like this:
100 Getting Started with Performance Manager
 Loading...