


Crystal Reports XI Release 2
User's Guide
Crystal Reports XI Release 2

Patents
Business Objects owns the following U.S. patents, which may cover products that are offered
and sold by Business Objects: 5,555,403, 6,247,008 B1, 6,578,027 B2, 6,490,593 and
6,289,352.
Trademarks
Copyright
Third-party
contributors
Business Objects, the Business Objects logo, Crystal Reports, and Crystal Enterprise are
trademarks or registered trademarks of Business Objects SA or its affiliated companies in the
United States and other countries. All other names mentioned herein may be trademarks of
their respective owners.
Copyright © 2005 Business Objects. All rights reserved.
Business Objects products in this release may contain redistributions of software licensed
from third-party contributors. Some of these individual components may also be available
under alternative licenses. A partial listing of third-party contributors that have requested or
permitted acknowledgments, as well as required notices, can be found at:
http://www.businessobjects.com/thirdparty

Contents
Chapter 1 Introduction to Crystal Reports XI R2 23
About Crystal Reports . . . . . . . . . . . . . . . . . . . . . . . . . . . . . . . . . . . . . . . . 24
About this guide . . . . . . . . . . . . . . . . . . . . . . . . . . . . . . . . . . . . . . . . . . . . . 25
Online help . . . . . . . . . . . . . . . . . . . . . . . . . . . . . . . . . . . . . . . . . . . . . . 25
Business Objects information resources . . . . . . . . . . . . . . . . . . . . . . . 25
Chapter 2 What’s New in Crystal Reports XI R2 27
Introduction . . . . . . . . . . . . . . . . . . . . . . . . . . . . . . . . . . . . . . . . . . . . . . . . 28
Crystal Reports XI R2 . . . . . . . . . . . . . . . . . . . . . . . . . . . . . . . . . . . . . . . . 28
Crosstabs . . . . . . . . . . . . . . . . . . . . . . . . . . . . . . . . . . . . . . . . . . . . . . . 28
Enterprise connectivity . . . . . . . . . . . . . . . . . . . . . . . . . . . . . . . . . . . . . 28
Exporting . . . . . . . . . . . . . . . . . . . . . . . . . . . . . . . . . . . . . . . . . . . . . . . 28
Formatting . . . . . . . . . . . . . . . . . . . . . . . . . . . . . . . . . . . . . . . . . . . . . . 29
Formulas . . . . . . . . . . . . . . . . . . . . . . . . . . . . . . . . . . . . . . . . . . . . . . . 29
General report functionality . . . . . . . . . . . . . . . . . . . . . . . . . . . . . . . . . 30
HTML Preview tab . . . . . . . . . . . . . . . . . . . . . . . . . . . . . . . . . . . . . . . . 31
Repository Explorer . . . . . . . . . . . . . . . . . . . . . . . . . . . . . . . . . . . . . . . 31
Workbench . . . . . . . . . . . . . . . . . . . . . . . . . . . . . . . . . . . . . . . . . . . . . . 32
Application development . . . . . . . . . . . . . . . . . . . . . . . . . . . . . . . . . . . . . . 32
Report Application Server (RAS) . . . . . . . . . . . . . . . . . . . . . . . . . . . . . 32
Java Reporting Component (JRC) . . . . . . . . . . . . . . . . . . . . . . . . . . . . 32
Crystal Reports .NET . . . . . . . . . . . . . . . . . . . . . . . . . . . . . . . . . . . . . . 33
Future deprecation notices . . . . . . . . . . . . . . . . . . . . . . . . . . . . . . . . . . . . . 33
General description . . . . . . . . . . . . . . . . . . . . . . . . . . . . . . . . . . . . . . . 33
Crystal Reports . . . . . . . . . . . . . . . . . . . . . . . . . . . . . . . . . . . . . . . . . . 34
Report Application Server . . . . . . . . . . . . . . . . . . . . . . . . . . . . . . . . . . 34
COM SDKs . . . . . . . . . . . . . . . . . . . . . . . . . . . . . . . . . . . . . . . . . . . . . 34
OLAP Intelligence . . . . . . . . . . . . . . . . . . . . . . . . . . . . . . . . . . . . . . . . 36
Crystal Reports User’s Guide 3

Contents
Data Integrator . . . . . . . . . . . . . . . . . . . . . . . . . . . . . . . . . . . . . . . . . . . 36
BusinessObjects Enterprise . . . . . . . . . . . . . . . . . . . . . . . . . . . . . . . . . 36
Chapter 3 Installing Crystal Reports XI R2 37
Installing Crystal Reports XI R2 . . . . . . . . . . . . . . . . . . . . . . . . . . . . . . . . . 38
Installation requirements . . . . . . . . . . . . . . . . . . . . . . . . . . . . . . . . . . . . . . . 38
Installing Crystal Reports on a local machine . . . . . . . . . . . . . . . . . . . . . . . 39
Creating an installation point and installing from a network server . . . . . . . 40
Creating an installation point for Crystal Reports . . . . . . . . . . . . . . . . . 40
Installing Crystal Reports from a network . . . . . . . . . . . . . . . . . . . . . . . 41
Customizing your installation . . . . . . . . . . . . . . . . . . . . . . . . . . . . . . . . . . . . 42
Running a silent installation . . . . . . . . . . . . . . . . . . . . . . . . . . . . . . . . . . . . . 44
Upgrading Crystal Reports components . . . . . . . . . . . . . . . . . . . . . . . . . . . 48
Chapter 4 Quick Start 49
Learning how to use Crystal Reports . . . . . . . . . . . . . . . . . . . . . . . . . . . . . 50
Sample data - Xtreme.mdb . . . . . . . . . . . . . . . . . . . . . . . . . . . . . . . . . . 50
Report Creation Wizards . . . . . . . . . . . . . . . . . . . . . . . . . . . . . . . . . . . . . . . 50
Standard . . . . . . . . . . . . . . . . . . . . . . . . . . . . . . . . . . . . . . . . . . . . . . . . 51
Cross-Tab . . . . . . . . . . . . . . . . . . . . . . . . . . . . . . . . . . . . . . . . . . . . . . . 51
Mailing Label . . . . . . . . . . . . . . . . . . . . . . . . . . . . . . . . . . . . . . . . . . . . . 51
OLAP . . . . . . . . . . . . . . . . . . . . . . . . . . . . . . . . . . . . . . . . . . . . . . . . . . . 51
Quick start for new users . . . . . . . . . . . . . . . . . . . . . . . . . . . . . . . . . . . . . . . 52
Before you begin . . . . . . . . . . . . . . . . . . . . . . . . . . . . . . . . . . . . . . . . . . 52
Creating the report . . . . . . . . . . . . . . . . . . . . . . . . . . . . . . . . . . . . . . . . 53
Record Selection . . . . . . . . . . . . . . . . . . . . . . . . . . . . . . . . . . . . . . . . . .64
Grouping and sorting . . . . . . . . . . . . . . . . . . . . . . . . . . . . . . . . . . . . . . . 68
Completing the report . . . . . . . . . . . . . . . . . . . . . . . . . . . . . . . . . . . . . . 71
Quick start for advanced users . . . . . . . . . . . . . . . . . . . . . . . . . . . . . . . . . . 72
Chapter 5 Report Design Concepts 77
Basic report design . . . . . . . . . . . . . . . . . . . . . . . . . . . . . . . . . . . . . . . . . . . 78
Deciding on the content of the report . . . . . . . . . . . . . . . . . . . . . . . . . . . . . 78
Stating the purpose . . . . . . . . . . . . . . . . . . . . . . . . . . . . . . . . . . . . . . . . 78
4 Crystal Reports User’s Guide

Contents
Determining the layout of the report . . . . . . . . . . . . . . . . . . . . . . . . . . . 79
Finding the data . . . . . . . . . . . . . . . . . . . . . . . . . . . . . . . . . . . . . . . . . . 80
Manipulating the data . . . . . . . . . . . . . . . . . . . . . . . . . . . . . . . . . . . . . . 81
Determining printing area characteristics . . . . . . . . . . . . . . . . . . . . . . . 82
Developing a prototype on paper . . . . . . . . . . . . . . . . . . . . . . . . . . . . . . . . 84
Chapter 6 Introduction to Reporting 85
Report creation options . . . . . . . . . . . . . . . . . . . . . . . . . . . . . . . . . . . . . . . 86
Report Creation Wizards . . . . . . . . . . . . . . . . . . . . . . . . . . . . . . . . . . . 86
Another report . . . . . . . . . . . . . . . . . . . . . . . . . . . . . . . . . . . . . . . . . . . 86
New report . . . . . . . . . . . . . . . . . . . . . . . . . . . . . . . . . . . . . . . . . . . . . . 86
Choosing data sources and database fields . . . . . . . . . . . . . . . . . . . . . . . 87
The Database Expert . . . . . . . . . . . . . . . . . . . . . . . . . . . . . . . . . . . . . . 87
The Field Explorer . . . . . . . . . . . . . . . . . . . . . . . . . . . . . . . . . . . . . . . . 89
About the report design environment . . . . . . . . . . . . . . . . . . . . . . . . . . . . . 91
Design tab . . . . . . . . . . . . . . . . . . . . . . . . . . . . . . . . . . . . . . . . . . . . . . 91
Preview tab . . . . . . . . . . . . . . . . . . . . . . . . . . . . . . . . . . . . . . . . . . . . . 94
HTML Preview tab . . . . . . . . . . . . . . . . . . . . . . . . . . . . . . . . . . . . . . . . 98
Creating a new report . . . . . . . . . . . . . . . . . . . . . . . . . . . . . . . . . . . . . . . . . 98
Selecting the data source . . . . . . . . . . . . . . . . . . . . . . . . . . . . . . . . . . 98
Adding tables . . . . . . . . . . . . . . . . . . . . . . . . . . . . . . . . . . . . . . . . . . . 100
Linking multiple tables . . . . . . . . . . . . . . . . . . . . . . . . . . . . . . . . . . . . 100
Placing data on the report . . . . . . . . . . . . . . . . . . . . . . . . . . . . . . . . . 102
Formatting data . . . . . . . . . . . . . . . . . . . . . . . . . . . . . . . . . . . . . . . . . 108
Record selection . . . . . . . . . . . . . . . . . . . . . . . . . . . . . . . . . . . . . . . . 109
Grouping, sorting, and summarizing data . . . . . . . . . . . . . . . . . . . . . 109
Using the drill-down option on summarized data . . . . . . . . . . . . . . . . 110
Using the zoom feature . . . . . . . . . . . . . . . . . . . . . . . . . . . . . . . . . . . 110
Inserting page headers and footers . . . . . . . . . . . . . . . . . . . . . . . . . . 111
Adding a title page to the report . . . . . . . . . . . . . . . . . . . . . . . . . . . . 112
Adding summary information to the report . . . . . . . . . . . . . . . . . . . . . 113
Exploring reports and working with multiple reports . . . . . . . . . . . . . . . . . 113
The Report Explorer . . . . . . . . . . . . . . . . . . . . . . . . . . . . . . . . . . . . . . 114
Crystal Reports User’s Guide 5

Contents
The Workbench . . . . . . . . . . . . . . . . . . . . . . . . . . . . . . . . . . . . . . . . . .115
The Dependency Checker . . . . . . . . . . . . . . . . . . . . . . . . . . . . . . . . . 117
Opening and docking explorers . . . . . . . . . . . . . . . . . . . . . . . . . . . . . 118
Beyond basic reports . . . . . . . . . . . . . . . . . . . . . . . . . . . . . . . . . . . . . . . . . 119
Chapter 7 BusinessObjects Enterprise Repository 121
What is the BusinessObjects Enterprise Repository? . . . . . . . . . . . . . . . 122
Work flow . . . . . . . . . . . . . . . . . . . . . . . . . . . . . . . . . . . . . . . . . . . . . . 122
Accessing the BusinessObjects Enterprise Repository . . . . . . . . . . . . . . . 123
Toolbar . . . . . . . . . . . . . . . . . . . . . . . . . . . . . . . . . . . . . . . . . . . . . . . . 124
Enterprise content . . . . . . . . . . . . . . . . . . . . . . . . . . . . . . . . . . . . . . . . 125
Adding subfolders and subcategories
to the repository . . . . . . . . . . . . . . . . . . . . . . . . . . . . . . . . . . . . . . . . . . . . . 126
Adding items to the repository . . . . . . . . . . . . . . . . . . . . . . . . . . . . . . . . . . 127
Adding a text object or bitmap image . . . . . . . . . . . . . . . . . . . . . . . . .127
Adding a custom function . . . . . . . . . . . . . . . . . . . . . . . . . . . . . . . . . .128
Adding a command . . . . . . . . . . . . . . . . . . . . . . . . . . . . . . . . . . . . . . 129
Using repository objects in reports . . . . . . . . . . . . . . . . . . . . . . . . . . . . . . 129
Adding a text object or a bitmap image to a report . . . . . . . . . . . . . . . 130
Adding a custom function to a report . . . . . . . . . . . . . . . . . . . . . . . . . 130
Adding a command to a report . . . . . . . . . . . . . . . . . . . . . . . . . . . . . . 130
Adding a list of values to a parameter . . . . . . . . . . . . . . . . . . . . . . . . . 131
Modifying objects in the repository . . . . . . . . . . . . . . . . . . . . . . . . . . . . . . 131
Updating connected repository objects
in reports . . . . . . . . . . . . . . . . . . . . . . . . . . . . . . . . . . . . . . . . . . . . . . . . . 132
Deleting items from the repository . . . . . . . . . . . . . . . . . . . . . . . . . . . . . . . 133
Using Undo in the repository . . . . . . . . . . . . . . . . . . . . . . . . . . . . . . . . . . . 133
Chapter 8 Designing Optimized Web Reports 135
Overview . . . . . . . . . . . . . . . . . . . . . . . . . . . . . . . . . . . . . . . . . . . . . . . . . . 136
Scale with BusinessObjects Enterprise . . . . . . . . . . . . . . . . . . . . . . . . . . . 137
Evaluation times for date functions in BusinessObjects Enterprise . . 138
Making the right design choices . . . . . . . . . . . . . . . . . . . . . . . . . . . . . . . . 139
Using faster report formats . . . . . . . . . . . . . . . . . . . . . . . . . . . . . . . . . 140
6 Crystal Reports User’s Guide

Contents
Choosing between live and saved data . . . . . . . . . . . . . . . . . . . . . . . 140
Designing summary reports . . . . . . . . . . . . . . . . . . . . . . . . . . . . . . . . 141
Using subreports carefully . . . . . . . . . . . . . . . . . . . . . . . . . . . . . . . . . 142
Using other design elements effectively . . . . . . . . . . . . . . . . . . . . . . 144
Designing reports to maximize data sharing . . . . . . . . . . . . . . . . . . . 144
Streamlining your reporting environment . . . . . . . . . . . . . . . . . . . . . . . . . 145
Selecting the fastest database and connection . . . . . . . . . . . . . . . . . 145
Using table indexes . . . . . . . . . . . . . . . . . . . . . . . . . . . . . . . . . . . . . . 145
Improving table-linking choices . . . . . . . . . . . . . . . . . . . . . . . . . . . . . 146
Using thread-safe database drivers . . . . . . . . . . . . . . . . . . . . . . . . . . 147
Using stored procedures for faster processing . . . . . . . . . . . . . . . . . 148
Using enhanced record selection formulas . . . . . . . . . . . . . . . . . . . . . . . 148
Pushing down record selection—an example . . . . . . . . . . . . . . . . . . 149
Record selection performance tips . . . . . . . . . . . . . . . . . . . . . . . . . . 149
Strategies for writing efficient record selection formulas . . . . . . . . . . 150
Incorporating parameter fields into record selection formulas . . . . . 152
Using SQL expressions where appropriate . . . . . . . . . . . . . . . . . . . . 154
Improving grouping, sorting, and totaling . . . . . . . . . . . . . . . . . . . . . . . . 155
Performing grouping on server . . . . . . . . . . . . . . . . . . . . . . . . . . . . . 155
Benefits of grouping on server—an example . . . . . . . . . . . . . . . . . . . 156
Using SQL Expressions for groups, sorts, and totals . . . . . . . . . . . . 157
Using SQL Expressions for Case Logic . . . . . . . . . . . . . . . . . . . . . . . 157
Inserting summary and running total fields where possible . . . . . . . . 158
Chapter 9 Record Selection 159
Selecting records . . . . . . . . . . . . . . . . . . . . . . . . . . . . . . . . . . . . . . . . . . . 160
Using the Select Expert . . . . . . . . . . . . . . . . . . . . . . . . . . . . . . . . . . . 161
Using formulas . . . . . . . . . . . . . . . . . . . . . . . . . . . . . . . . . . . . . . . . . . 162
Interaction of the Select Expert and the Formula Editor . . . . . . . . . . 163
Using formula templates . . . . . . . . . . . . . . . . . . . . . . . . . . . . . . . . . . . . . 164
Record selection formula templates . . . . . . . . . . . . . . . . . . . . . . . . . . 164
Pushing down record selection to the database server . . . . . . . . . . . . . . 166
Troubleshooting record selection formulas . . . . . . . . . . . . . . . . . . . . . . . 167
Crystal Reports User’s Guide 7

Contents
Correcting selections that do not generate data . . . . . . . . . . . . . . . . . 169
Chapter 10 Sorting, Grouping, and Totaling 171
Sorting data . . . . . . . . . . . . . . . . . . . . . . . . . . . . . . . . . . . . . . . . . . . . . . . . 172
Understanding sort options . . . . . . . . . . . . . . . . . . . . . . . . . . . . . . . . . 172
Sorting single and multiple fields . . . . . . . . . . . . . . . . . . . . . . . . . . . . . 173
Grouping data . . . . . . . . . . . . . . . . . . . . . . . . . . . . . . . . . . . . . . . . . . . . . . 175
Creating custom groups . . . . . . . . . . . . . . . . . . . . . . . . . . . . . . . . . . . 177
Sorting groups conditionally . . . . . . . . . . . . . . . . . . . . . . . . . . . . . . . . 178
Sorting records within groups . . . . . . . . . . . . . . . . . . . . . . . . . . . . . . . 179
Group selection . . . . . . . . . . . . . . . . . . . . . . . . . . . . . . . . . . . . . . . . . . 180
Grouping data in intervals . . . . . . . . . . . . . . . . . . . . . . . . . . . . . . . . . . 183
Grouping by the first letter of a company name . . . . . . . . . . . . . . . . . 185
Grouping data hierarchically . . . . . . . . . . . . . . . . . . . . . . . . . . . . . . . . 187
Editing groups . . . . . . . . . . . . . . . . . . . . . . . . . . . . . . . . . . . . . . . . . . . 193
Summarizing grouped data . . . . . . . . . . . . . . . . . . . . . . . . . . . . . . . . . . . . 193
Ordering groups by summarized values . . . . . . . . . . . . . . . . . . . . . . . 194
Selecting top or bottom N groups or percentages . . . . . . . . . . . . . . . 195
Selecting top or bottom groups or percentages conditionally . . . . . . . 197
Subtotaling . . . . . . . . . . . . . . . . . . . . . . . . . . . . . . . . . . . . . . . . . . . . . . . . 198
Subtotaling data . . . . . . . . . . . . . . . . . . . . . . . . . . . . . . . . . . . . . . . . . 198
Extending prices and subtotaling the extensions . . . . . . . . . . . . . . . . 199
Percentages . . . . . . . . . . . . . . . . . . . . . . . . . . . . . . . . . . . . . . . . . . . . . . . 201
Calculating a percentage . . . . . . . . . . . . . . . . . . . . . . . . . . . . . . . . . . 201
Group headers . . . . . . . . . . . . . . . . . . . . . . . . . . . . . . . . . . . . . . . . . . . . . 202
Creating group headers . . . . . . . . . . . . . . . . . . . . . . . . . . . . . . . . . . . 202
Suppressing group headers . . . . . . . . . . . . . . . . . . . . . . . . . . . . . . . . 205
Drilling-down on group headers . . . . . . . . . . . . . . . . . . . . . . . . . . . . . 206
Chapter 11 Running Totals 207
Understanding running totals . . . . . . . . . . . . . . . . . . . . . . . . . . . . . . . . . . 208
How running totals work . . . . . . . . . . . . . . . . . . . . . . . . . . . . . . . . . . .208
Creating running totals . . . . . . . . . . . . . . . . . . . . . . . . . . . . . . . . . . . . . . . 209
8 Crystal Reports User’s Guide

Contents
Creating running totals in a list . . . . . . . . . . . . . . . . . . . . . . . . . . . . . 209
Creating running totals for a group . . . . . . . . . . . . . . . . . . . . . . . . . . 210
Creating conditional running totals . . . . . . . . . . . . . . . . . . . . . . . . . . 211
Creating running totals in a one-to-many linking relationship . . . . . . 213
Creating running totals using a formula . . . . . . . . . . . . . . . . . . . . . . . . . . 214
Chapter 12 Multiple Section Reports 217
About sections . . . . . . . . . . . . . . . . . . . . . . . . . . . . . . . . . . . . . . . . . . . . . 218
Working with sections . . . . . . . . . . . . . . . . . . . . . . . . . . . . . . . . . . . . . . . 218
Inserting a section . . . . . . . . . . . . . . . . . . . . . . . . . . . . . . . . . . . . . . . 218
Deleting a section . . . . . . . . . . . . . . . . . . . . . . . . . . . . . . . . . . . . . . . 219
Moving a section . . . . . . . . . . . . . . . . . . . . . . . . . . . . . . . . . . . . . . . . 219
Merging two related sections . . . . . . . . . . . . . . . . . . . . . . . . . . . . . . . 220
Splitting and resizing sections . . . . . . . . . . . . . . . . . . . . . . . . . . . . . . . . . 221
Splitting a section . . . . . . . . . . . . . . . . . . . . . . . . . . . . . . . . . . . . . . . . 221
Resizing a section . . . . . . . . . . . . . . . . . . . . . . . . . . . . . . . . . . . . . . . 221
Using multiple sections in reports . . . . . . . . . . . . . . . . . . . . . . . . . . . . . . 222
Keeping variable length objects from overwriting each other . . . . . . 223
Eliminating blank lines when fields are empty . . . . . . . . . . . . . . . . . 224
Adding blank lines conditionally . . . . . . . . . . . . . . . . . . . . . . . . . . . . 224
Form letters . . . . . . . . . . . . . . . . . . . . . . . . . . . . . . . . . . . . . . . . . . . . . . . 225
Working with text objects . . . . . . . . . . . . . . . . . . . . . . . . . . . . . . . . . . 225
Creating a form letter using a text object . . . . . . . . . . . . . . . . . . . . . . 227
Printing conditional messages in form letters . . . . . . . . . . . . . . . . . . 232
Chapter 13 Formatting 235
Formatting concepts . . . . . . . . . . . . . . . . . . . . . . . . . . . . . . . . . . . . . . . . . 236
Using a template . . . . . . . . . . . . . . . . . . . . . . . . . . . . . . . . . . . . . . . . . . . 236
Applying a template . . . . . . . . . . . . . . . . . . . . . . . . . . . . . . . . . . . . . . 236
Removing an applied template . . . . . . . . . . . . . . . . . . . . . . . . . . . . . 237
Reapplying the last template selected . . . . . . . . . . . . . . . . . . . . . . . . 238
Using Template Field Objects . . . . . . . . . . . . . . . . . . . . . . . . . . . . . . 238
Using the Report Design Environment . . . . . . . . . . . . . . . . . . . . . . . . . . . 239
Crystal Reports User’s Guide 9

Contents
Design solutions . . . . . . . . . . . . . . . . . . . . . . . . . . . . . . . . . . . . . . . . .239
Section characteristics . . . . . . . . . . . . . . . . . . . . . . . . . . . . . . . . . . . . 240
Making an object underlay a following section . . . . . . . . . . . . . . . . . . 241
Pre-printed forms . . . . . . . . . . . . . . . . . . . . . . . . . . . . . . . . . . . . . . . . 242
Multiple columns . . . . . . . . . . . . . . . . . . . . . . . . . . . . . . . . . . . . . . . . . 243
Hiding report sections . . . . . . . . . . . . . . . . . . . . . . . . . . . . . . . . . . . . . 243
Hiding report objects . . . . . . . . . . . . . . . . . . . . . . . . . . . . . . . . . . . . . . 244
Placing text-based objects . . . . . . . . . . . . . . . . . . . . . . . . . . . . . . . . . 246
Placing multi-line, text-based objects . . . . . . . . . . . . . . . . . . . . . . . . . 248
Importing text-based objects from a file . . . . . . . . . . . . . . . . . . . . . . . 249
Spacing between text-based objects . . . . . . . . . . . . . . . . . . . . . . . . . 249
Overflow Field Representation . . . . . . . . . . . . . . . . . . . . . . . . . . . . . .255
Selecting multiple objects . . . . . . . . . . . . . . . . . . . . . . . . . . . . . . . . . . 256
Vertical placement . . . . . . . . . . . . . . . . . . . . . . . . . . . . . . . . . . . . . . . . 256
Inserting character and line spacing . . . . . . . . . . . . . . . . . . . . . . . . . . 257
Setting fractional font sizes . . . . . . . . . . . . . . . . . . . . . . . . . . . . . . . . . 258
TrueType fonts . . . . . . . . . . . . . . . . . . . . . . . . . . . . . . . . . . . . . . . . . . 258
Page margins . . . . . . . . . . . . . . . . . . . . . . . . . . . . . . . . . . . . . . . . . . . 259
Default printer . . . . . . . . . . . . . . . . . . . . . . . . . . . . . . . . . . . . . . . . . . . 259
Printer drivers . . . . . . . . . . . . . . . . . . . . . . . . . . . . . . . . . . . . . . . . . . . 260
Formatting properties . . . . . . . . . . . . . . . . . . . . . . . . . . . . . . . . . . . . . . . . 261
Working with absolute formatting . . . . . . . . . . . . . . . . . . . . . . . . . . . . . . . 262
Adding borders, color, and shading to a field . . . . . . . . . . . . . . . . . . .262
Making a report, section, area, or object read-only . . . . . . . . . . . . . . . 262
Locking an object’s size and position . . . . . . . . . . . . . . . . . . . . . . . . . 263
Changing your default field formats . . . . . . . . . . . . . . . . . . . . . . . . . . 263
Adding and editing lines . . . . . . . . . . . . . . . . . . . . . . . . . . . . . . . . . . . 265
Adding and editing boxes . . . . . . . . . . . . . . . . . . . . . . . . . . . . . . . . . .266
Adding shapes to a report . . . . . . . . . . . . . . . . . . . . . . . . . . . . . . . . . . 267
Scaling, cropping, and sizing objects . . . . . . . . . . . . . . . . . . . . . . . . . 267
Using conventional accounting formats . . . . . . . . . . . . . . . . . . . . . . . 268
Repeating report objects on horizontal pages . . . . . . . . . . . . . . . . . . 269
Using white space between rows . . . . . . . . . . . . . . . . . . . . . . . . . . . .271
10 Crystal Reports User’s Guide

Contents
Working with conditional formatting . . . . . . . . . . . . . . . . . . . . . . . . . . . . . 273
Conditional on or off properties . . . . . . . . . . . . . . . . . . . . . . . . . . . . . 273
Conditional attribute properties . . . . . . . . . . . . . . . . . . . . . . . . . . . . . 274
Changing fonts conditionally . . . . . . . . . . . . . . . . . . . . . . . . . . . . . . . 275
Changing X position conditionally . . . . . . . . . . . . . . . . . . . . . . . . . . . 276
Creating footers after the first page . . . . . . . . . . . . . . . . . . . . . . . . . . 277
Using the Highlighting Expert . . . . . . . . . . . . . . . . . . . . . . . . . . . . . . . 278
Undo/Redo activities . . . . . . . . . . . . . . . . . . . . . . . . . . . . . . . . . . . . . 281
Using the Format Painter . . . . . . . . . . . . . . . . . . . . . . . . . . . . . . . . . . . . 282
Chapter 14 Charting 283
Charting concepts . . . . . . . . . . . . . . . . . . . . . . . . . . . . . . . . . . . . . . . . . . 284
Charting overview . . . . . . . . . . . . . . . . . . . . . . . . . . . . . . . . . . . . . . . 284
Chart layouts . . . . . . . . . . . . . . . . . . . . . . . . . . . . . . . . . . . . . . . . . . . 284
Chart types . . . . . . . . . . . . . . . . . . . . . . . . . . . . . . . . . . . . . . . . . . . . . 285
Where to place a chart . . . . . . . . . . . . . . . . . . . . . . . . . . . . . . . . . . . 288
Drill-down with charts . . . . . . . . . . . . . . . . . . . . . . . . . . . . . . . . . . . . . 288
Drill-down with legends . . . . . . . . . . . . . . . . . . . . . . . . . . . . . . . . . . . 289
Creating charts . . . . . . . . . . . . . . . . . . . . . . . . . . . . . . . . . . . . . . . . . . . . . 289
Charting on details or formula fields (Advanced layout) . . . . . . . . . . 289
Charting on summary or subtotal fields (Group layout) . . . . . . . . . . 291
Charting on Cross-Tab summaries (Cross-Tab layout) . . . . . . . . . . 292
Charting on an OLAP cube (OLAP layout) . . . . . . . . . . . . . . . . . . . . 293
Working with charts . . . . . . . . . . . . . . . . . . . . . . . . . . . . . . . . . . . . . . . . . 294
Editing charts using the Chart Expert . . . . . . . . . . . . . . . . . . . . . . . . 295
Editing charts using the Chart Options menu items . . . . . . . . . . . . . . 295
Editing charts using other menu items . . . . . . . . . . . . . . . . . . . . . . . . 296
Using the zooming features with bar and line charts . . . . . . . . . . . . . 297
Auto-arranging charts . . . . . . . . . . . . . . . . . . . . . . . . . . . . . . . . . . . . 297
Formatting charts . . . . . . . . . . . . . . . . . . . . . . . . . . . . . . . . . . . . . . . . 298
Using the underlay feature with charts . . . . . . . . . . . . . . . . . . . . . . . . 299
Crystal Reports User’s Guide 11

Contents
Chapter 15 Mapping 301
Mapping concepts . . . . . . . . . . . . . . . . . . . . . . . . . . . . . . . . . . . . . . . . . . . 302
Mapping overview . . . . . . . . . . . . . . . . . . . . . . . . . . . . . . . . . . . . . . . . 302
Map layouts . . . . . . . . . . . . . . . . . . . . . . . . . . . . . . . . . . . . . . . . . . . . .302
Map types . . . . . . . . . . . . . . . . . . . . . . . . . . . . . . . . . . . . . . . . . . . . . . 303
Where to place a map . . . . . . . . . . . . . . . . . . . . . . . . . . . . . . . . . . . . . 306
Drill-down with maps . . . . . . . . . . . . . . . . . . . . . . . . . . . . . . . . . . . . . . 306
Creating maps . . . . . . . . . . . . . . . . . . . . . . . . . . . . . . . . . . . . . . . . . . . . . . 306
Mapping on details fields (Advanced layout) . . . . . . . . . . . . . . . . . . . 306
Mapping on group fields (Group layout) . . . . . . . . . . . . . . . . . . . . . . . 309
Mapping on Cross-Tab summaries (Cross-Tab layout) . . . . . . . . . . . 310
Mapping on an OLAP cube (OLAP layout) . . . . . . . . . . . . . . . . . . . . . 311
Working with maps . . . . . . . . . . . . . . . . . . . . . . . . . . . . . . . . . . . . . . . . . . 312
Editing maps using the Map Expert . . . . . . . . . . . . . . . . . . . . . . . . . . 313
Changing the map title . . . . . . . . . . . . . . . . . . . . . . . . . . . . . . . . . . . . 313
Changing the map type . . . . . . . . . . . . . . . . . . . . . . . . . . . . . . . . . . . . 313
Changing map layers . . . . . . . . . . . . . . . . . . . . . . . . . . . . . . . . . . . . . 314
Resolving data mismatches . . . . . . . . . . . . . . . . . . . . . . . . . . . . . . . . 315
Changing the geographic map . . . . . . . . . . . . . . . . . . . . . . . . . . . . . . 316
Zooming in and out on a map . . . . . . . . . . . . . . . . . . . . . . . . . . . . . . . 316
Panning a map . . . . . . . . . . . . . . . . . . . . . . . . . . . . . . . . . . . . . . . . . . 317
Centering a map . . . . . . . . . . . . . . . . . . . . . . . . . . . . . . . . . . . . . . . . . 317
Hiding and showing the Map Navigator . . . . . . . . . . . . . . . . . . . . . . . 317
Formatting Maps . . . . . . . . . . . . . . . . . . . . . . . . . . . . . . . . . . . . . . . . . 318
Using the underlay feature with maps . . . . . . . . . . . . . . . . . . . . . . . . .318
Chapter 16 OLE 319
OLE overview . . . . . . . . . . . . . . . . . . . . . . . . . . . . . . . . . . . . . . . . . . . . . . 320
OLE terminology . . . . . . . . . . . . . . . . . . . . . . . . . . . . . . . . . . . . . . . . . 320
Types of OLE objects . . . . . . . . . . . . . . . . . . . . . . . . . . . . . . . . . . . . .321
General OLE considerations . . . . . . . . . . . . . . . . . . . . . . . . . . . . . . . . 321
Inserting OLE objects into reports . . . . . . . . . . . . . . . . . . . . . . . . . . . . . . . 322
How OLE objects are represented in a report . . . . . . . . . . . . . . . . . . . . . . 323
12 Crystal Reports User’s Guide

Contents
Editing OLE objects in reports . . . . . . . . . . . . . . . . . . . . . . . . . . . . . . . . . 323
In-place editing . . . . . . . . . . . . . . . . . . . . . . . . . . . . . . . . . . . . . . . . . . 323
Dynamic OLE menu commands . . . . . . . . . . . . . . . . . . . . . . . . . . . . 324
OLE and the Insert Picture command . . . . . . . . . . . . . . . . . . . . . . . . 324
Working with static OLE objects . . . . . . . . . . . . . . . . . . . . . . . . . . . . . . . . 324
Working with embedded vs. linked objects . . . . . . . . . . . . . . . . . . . . . . . 327
Embedded objects . . . . . . . . . . . . . . . . . . . . . . . . . . . . . . . . . . . . . . . 327
Linked objects . . . . . . . . . . . . . . . . . . . . . . . . . . . . . . . . . . . . . . . . . . 328
Chapter 17 Cross-Tab Objects 331
What is a Cross-Tab object? . . . . . . . . . . . . . . . . . . . . . . . . . . . . . . . . . . 332
Cross-Tab example . . . . . . . . . . . . . . . . . . . . . . . . . . . . . . . . . . . . . . . . . 333
Report of order data—no sorting/grouping . . . . . . . . . . . . . . . . . . . . 333
Report of order data—grouped by region . . . . . . . . . . . . . . . . . . . . . 334
Report of order data—grouped by product . . . . . . . . . . . . . . . . . . . . 335
Report of order data—grouped by region and product . . . . . . . . . . . 336
Order data in a Cross-Tab object . . . . . . . . . . . . . . . . . . . . . . . . . . . . 336
Creating a Cross-Tab report . . . . . . . . . . . . . . . . . . . . . . . . . . . . . . . . . . 337
Working with Cross-Tabs . . . . . . . . . . . . . . . . . . . . . . . . . . . . . . . . . . . . . 344
Showing values as percentages . . . . . . . . . . . . . . . . . . . . . . . . . . . . 344
Abbreviating large summarized fields . . . . . . . . . . . . . . . . . . . . . . . . 344
Customizing row/column labels . . . . . . . . . . . . . . . . . . . . . . . . . . . . . 346
Using running totals in Cross-Tabs . . . . . . . . . . . . . . . . . . . . . . . . . . 346
Printing Cross-Tabs that span multiple pages . . . . . . . . . . . . . . . . . 347
Formatting Cross-Tabs . . . . . . . . . . . . . . . . . . . . . . . . . . . . . . . . . . . . . . 348
Changing width, height, and alignment of Cross-Tab cells . . . . . . . . 348
Formatting background color of entire rows/columns . . . . . . . . . . . . 348
Formatting fields individually . . . . . . . . . . . . . . . . . . . . . . . . . . . . . . . 349
Formatting several fields at one time . . . . . . . . . . . . . . . . . . . . . . . . . 349
Suppressing Cross-Tab data . . . . . . . . . . . . . . . . . . . . . . . . . . . . . . . 349
Displaying summarized fields horizontally . . . . . . . . . . . . . . . . . . . . . 350
Crystal Reports User’s Guide 13

Contents
Chapter 18 Building Queries 353
Connecting to a universe . . . . . . . . . . . . . . . . . . . . . . . . . . . . . . . . . . . . . . 354
Defining the data selection for a query . . . . . . . . . . . . . . . . . . . . . . . . . . . 354
Quick reference to objects . . . . . . . . . . . . . . . . . . . . . . . . . . . . . . . . . 356
Editing an existing query . . . . . . . . . . . . . . . . . . . . . . . . . . . . . . . . . . . . . . 357
Viewing the SQL behind a query . . . . . . . . . . . . . . . . . . . . . . . . . . . . . . . . 357
Query filters and prompts . . . . . . . . . . . . . . . . . . . . . . . . . . . . . . . . . . . . . 358
Creating query filters . . . . . . . . . . . . . . . . . . . . . . . . . . . . . . . . . . . . . . 358
Building prompts . . . . . . . . . . . . . . . . . . . . . . . . . . . . . . . . . . . . . . . . . 359
Combining query filters and prompts . . . . . . . . . . . . . . . . . . . . . . . . . 360
Using And or Or to combine query filters . . . . . . . . . . . . . . . . . . . . . . 361
Quick reference to query filter operators . . . . . . . . . . . . . . . . . . . . . . .361
Editing and removing query filters . . . . . . . . . . . . . . . . . . . . . . . . . . . .363
Filtering data using subqueries and database ranking . . . . . . . . . . . . . . . 363
What is a subquery? . . . . . . . . . . . . . . . . . . . . . . . . . . . . . . . . . . . . . . 363
Building a subquery . . . . . . . . . . . . . . . . . . . . . . . . . . . . . . . . . . . . . . . 364
What is a database ranking? . . . . . . . . . . . . . . . . . . . . . . . . . . . . . . . . 366
Creating a database ranking . . . . . . . . . . . . . . . . . . . . . . . . . . . . . . . . 366
Chapter 19 Creating and Updating OLAP Reports 369
OLAP reporting with Crystal Reports . . . . . . . . . . . . . . . . . . . . . . . . . . . . 370
OLAP grid objects . . . . . . . . . . . . . . . . . . . . . . . . . . . . . . . . . . . . . . . . 370
Creating an OLAP report . . . . . . . . . . . . . . . . . . . . . . . . . . . . . . . . . . . . . . 371
Specifying the data source . . . . . . . . . . . . . . . . . . . . . . . . . . . . . . . . .371
Defining the structure of the grid . . . . . . . . . . . . . . . . . . . . . . . . . . . . . 372
Setting sliced dimensions and specifying the number of grids . . . . . . 373
Applying a predefined style . . . . . . . . . . . . . . . . . . . . . . . . . . . . . . . . . 374
Inserting a chart . . . . . . . . . . . . . . . . . . . . . . . . . . . . . . . . . . . . . . . . . 375
Updating an OLAP report . . . . . . . . . . . . . . . . . . . . . . . . . . . . . . . . . . . . . 376
Formatting data in an OLAP grid . . . . . . . . . . . . . . . . . . . . . . . . . . . . . . . .377
Changing the background color of a dimension . . . . . . . . . . . . . . . . .378
Creating an alias for a dimension . . . . . . . . . . . . . . . . . . . . . . . . . . . . 379
Formatting grid lines . . . . . . . . . . . . . . . . . . . . . . . . . . . . . . . . . . . . . . 379
14 Crystal Reports User’s Guide

Contents
Labelling dimensions . . . . . . . . . . . . . . . . . . . . . . . . . . . . . . . . . . . . . 379
Changing the view of OLAP data . . . . . . . . . . . . . . . . . . . . . . . . . . . . . . 380
Sorting and filtering OLAP grid data . . . . . . . . . . . . . . . . . . . . . . . . . . . . . 382
Sorting data in an OLAP grid . . . . . . . . . . . . . . . . . . . . . . . . . . . . . . 382
Filtering data in an OLAP grid . . . . . . . . . . . . . . . . . . . . . . . . . . . . . . 384
Adding calculations to OLAP grids . . . . . . . . . . . . . . . . . . . . . . . . . . . . . 384
Chapter 20 Printing, Exporting, and Viewing Reports 385
Distributing reports . . . . . . . . . . . . . . . . . . . . . . . . . . . . . . . . . . . . . . . . . . 386
Printing a report . . . . . . . . . . . . . . . . . . . . . . . . . . . . . . . . . . . . . . . . . 386
Faxing a report . . . . . . . . . . . . . . . . . . . . . . . . . . . . . . . . . . . . . . . . . . 386
Exporting a report . . . . . . . . . . . . . . . . . . . . . . . . . . . . . . . . . . . . . . . 387
Working with Web folders . . . . . . . . . . . . . . . . . . . . . . . . . . . . . . . . . 396
Working with Enterprise folders . . . . . . . . . . . . . . . . . . . . . . . . . . . . 397
Viewing reports . . . . . . . . . . . . . . . . . . . . . . . . . . . . . . . . . . . . . . . . . . . . 399
What are Report Parts? . . . . . . . . . . . . . . . . . . . . . . . . . . . . . . . . . . . 399
What is navigation? . . . . . . . . . . . . . . . . . . . . . . . . . . . . . . . . . . . . . . 400
The Report Part Drilldown option . . . . . . . . . . . . . . . . . . . . . . . . . . . . 402
The Another Report Object option . . . . . . . . . . . . . . . . . . . . . . . . . . . 405
Hyperlinks displayed in the viewers . . . . . . . . . . . . . . . . . . . . . . . . . . 410
Using smart tags . . . . . . . . . . . . . . . . . . . . . . . . . . . . . . . . . . . . . . . . . . . 411
Chapter 21 Report Alerts 413
About Report Alerts . . . . . . . . . . . . . . . . . . . . . . . . . . . . . . . . . . . . . . . . . 414
Working with Report Alerts . . . . . . . . . . . . . . . . . . . . . . . . . . . . . . . . . . . . 414
Creating Report Alerts . . . . . . . . . . . . . . . . . . . . . . . . . . . . . . . . . . . . 414
Editing Report Alerts . . . . . . . . . . . . . . . . . . . . . . . . . . . . . . . . . . . . . 416
Deleting Report Alerts . . . . . . . . . . . . . . . . . . . . . . . . . . . . . . . . . . . . 417
Viewing Report Alerts . . . . . . . . . . . . . . . . . . . . . . . . . . . . . . . . . . . . 417
Referring to Report Alerts in formulas . . . . . . . . . . . . . . . . . . . . . . . . 418
Chapter 22 Using Formulas 419
Formulas overview . . . . . . . . . . . . . . . . . . . . . . . . . . . . . . . . . . . . . . . . . . 420
Typical uses for formulas . . . . . . . . . . . . . . . . . . . . . . . . . . . . . . . . . . 420
Crystal Reports User’s Guide 15

Contents
Formula components and syntax . . . . . . . . . . . . . . . . . . . . . . . . . . . . . . . 421
Formula components . . . . . . . . . . . . . . . . . . . . . . . . . . . . . . . . . . . . . 421
Formula syntax . . . . . . . . . . . . . . . . . . . . . . . . . . . . . . . . . . . . . . . . . . 422
User Function Libraries in formulas . . . . . . . . . . . . . . . . . . . . . . . . . . . . . . 423
Specifying formulas . . . . . . . . . . . . . . . . . . . . . . . . . . . . . . . . . . . . . . . . . . 423
Working with the Formula Workshop . . . . . . . . . . . . . . . . . . . . . . . . . 425
Working with the Formula Editor . . . . . . . . . . . . . . . . . . . . . . . . . . . . . 426
Creating and modifying formulas . . . . . . . . . . . . . . . . . . . . . . . . . . . . . . . . 428
Creating a formula and inserting it into a report . . . . . . . . . . . . . . . . . 428
Creating a formula in the Formula Expert . . . . . . . . . . . . . . . . . . . . . 428
Editing formulas . . . . . . . . . . . . . . . . . . . . . . . . . . . . . . . . . . . . . . . . . 430
Searching for formula text . . . . . . . . . . . . . . . . . . . . . . . . . . . . . . . . . . 430
Copying formulas . . . . . . . . . . . . . . . . . . . . . . . . . . . . . . . . . . . . . . . . 431
Deleting formulas . . . . . . . . . . . . . . . . . . . . . . . . . . . . . . . . . . . . . . . . . . . 433
Removing the working formula from your report . . . . . . . . . . . . . . . . . 433
Deleting the formula specification . . . . . . . . . . . . . . . . . . . . . . . . . . . . 434
Debugging formulas . . . . . . . . . . . . . . . . . . . . . . . . . . . . . . . . . . . . . . . . . 434
Debugging evaluation time errors . . . . . . . . . . . . . . . . . . . . . . . . . . . . 434
Debugging tutorial . . . . . . . . . . . . . . . . . . . . . . . . . . . . . . . . . . . . . . . . 435
Chapter 23 Parameter Fields and Prompts 441
Parameter and prompt overview . . . . . . . . . . . . . . . . . . . . . . . . . . . . . . . 442
Parameter field considerations . . . . . . . . . . . . . . . . . . . . . . . . . . . . . . 442
Prompt considerations . . . . . . . . . . . . . . . . . . . . . . . . . . . . . . . . . . . . 443
Understanding dynamic prompts . . . . . . . . . . . . . . . . . . . . . . . . . . . . . . . . 444
Understanding lists of values . . . . . . . . . . . . . . . . . . . . . . . . . . . . . . . . . . 446
List-of-values types . . . . . . . . . . . . . . . . . . . . . . . . . . . . . . . . . . . . . . . 447
Determining which list-of-values type to use . . . . . . . . . . . . . . . . . . . . 449
Lists of values and prompt groups contrasted . . . . . . . . . . . . . . . . . . 450
Creating a parameter with a static prompt . . . . . . . . . . . . . . . . . . . . . . . . 450
Creating a parameter with a dynamic prompt . . . . . . . . . . . . . . . . . . . . . . 453
Creating a parameter with a cascading
list of values . . . . . . . . . . . . . . . . . . . . . . . . . . . . . . . . . . . . . . . . . . . . . . . . 455
16 Crystal Reports User’s Guide

Contents
Working with lists of values . . . . . . . . . . . . . . . . . . . . . . . . . . . . . . . . . . . 457
Sharing common lists of values within a report . . . . . . . . . . . . . . . . . 457
Using separate value and description fields . . . . . . . . . . . . . . . . . . . 459
Using command objects as list-of-values data sources . . . . . . . . . . . 460
Null handling . . . . . . . . . . . . . . . . . . . . . . . . . . . . . . . . . . . . . . . . . . . 460
Best practices for prompting . . . . . . . . . . . . . . . . . . . . . . . . . . . . . . . . . . 460
Unmanaged reports . . . . . . . . . . . . . . . . . . . . . . . . . . . . . . . . . . . . . . 460
Managed reports . . . . . . . . . . . . . . . . . . . . . . . . . . . . . . . . . . . . . . . . 461
Converting unmanaged reports to managed reports . . . . . . . . . . . . . 462
Deploying managed reports with dynamic prompts . . . . . . . . . . . . . . 462
Deleting parameter fields . . . . . . . . . . . . . . . . . . . . . . . . . . . . . . . . . . . . . 463
Responding to parameter field prompts . . . . . . . . . . . . . . . . . . . . . . . . . . 464
Previewing a report for the first time . . . . . . . . . . . . . . . . . . . . . . . . . 464
Refreshing report data . . . . . . . . . . . . . . . . . . . . . . . . . . . . . . . . . . . . 464
Advanced parameter features . . . . . . . . . . . . . . . . . . . . . . . . . . . . . . . . . 466
Creating a parameter with multiple prompting values . . . . . . . . . . . . 466
Applying conditional formatting using parameter fields . . . . . . . . . . . 467
Creating a report title using parameter fields . . . . . . . . . . . . . . . . . . . 468
Specifying single or ranges of values . . . . . . . . . . . . . . . . . . . . . . . . 468
Incorporating a parameter into a formula . . . . . . . . . . . . . . . . . . . . . . 469
Defining sort order using parameter fields . . . . . . . . . . . . . . . . . . . . . 470
Defining entry type and format using the Edit Mask . . . . . . . . . . . . . 471
Chapter 24 Subreports 473
What are subreports? . . . . . . . . . . . . . . . . . . . . . . . . . . . . . . . . . . . . . . . . 474
Unlinked vs. linked subreports . . . . . . . . . . . . . . . . . . . . . . . . . . . . . . 474
How subreport linking works . . . . . . . . . . . . . . . . . . . . . . . . . . . . . . . 475
Database links vs. subreports in one-to-many situations . . . . . . . . . . 476
Inserting subreports . . . . . . . . . . . . . . . . . . . . . . . . . . . . . . . . . . . . . . . . . 477
Previewing subreports . . . . . . . . . . . . . . . . . . . . . . . . . . . . . . . . . . . . 478
Saving a subreport as a primary report . . . . . . . . . . . . . . . . . . . . . . . 478
Updating subreports . . . . . . . . . . . . . . . . . . . . . . . . . . . . . . . . . . . . . . 479
Linking a subreport to the data in the primary report . . . . . . . . . . . . . . . . 480
Crystal Reports User’s Guide 17

Contents
Linking a subreport to the main report without modifying the selection
formula . . . . . . . . . . . . . . . . . . . . . . . . . . . . . . . . . . . . . . . . . . . . . . . . 481
Combining unrelated reports by using subreports . . . . . . . . . . . . . . . . . . 482
Combining two or more unrelated reports . . . . . . . . . . . . . . . . . . . . . .482
Using subreports with unlinkable data . . . . . . . . . . . . . . . . . . . . . . . . . . . . 483
Linking to/from a formula field . . . . . . . . . . . . . . . . . . . . . . . . . . . . . . . 483
Linking unindexed tables . . . . . . . . . . . . . . . . . . . . . . . . . . . . . . . . . . . 484
Creating an on-demand subreport . . . . . . . . . . . . . . . . . . . . . . . . . . . . . . 485
Adding captions to on-demand subreports . . . . . . . . . . . . . . . . . . . . . 485
Showing different views of the same data in a report . . . . . . . . . . . . . . . . 486
Chapter 25 Understanding Databases 487
Databases overview . . . . . . . . . . . . . . . . . . . . . . . . . . . . . . . . . . . . . . . . . 488
Relational database basics . . . . . . . . . . . . . . . . . . . . . . . . . . . . . . . . . 488
Aliases . . . . . . . . . . . . . . . . . . . . . . . . . . . . . . . . . . . . . . . . . . . . . . . . 489
Locating files . . . . . . . . . . . . . . . . . . . . . . . . . . . . . . . . . . . . . . . . . . . . 490
Indexed tables . . . . . . . . . . . . . . . . . . . . . . . . . . . . . . . . . . . . . . . . . . .491
Linking tables . . . . . . . . . . . . . . . . . . . . . . . . . . . . . . . . . . . . . . . . . . . . . . 493
Link from and link to . . . . . . . . . . . . . . . . . . . . . . . . . . . . . . . . . . . . . . 494
Link relationships . . . . . . . . . . . . . . . . . . . . . . . . . . . . . . . . . . . . . . . . 494
Performance considerations in one-to-many links . . . . . . . . . . . . . . . 495
Data file considerations . . . . . . . . . . . . . . . . . . . . . . . . . . . . . . . . . . . .497
SQL database considerations . . . . . . . . . . . . . . . . . . . . . . . . . . . . . . . 499
Performance considerations for all reports . . . . . . . . . . . . . . . . . . . . . 500
The Database Expert Links tab . . . . . . . . . . . . . . . . . . . . . . . . . . . . . .502
Linking indexed tables . . . . . . . . . . . . . . . . . . . . . . . . . . . . . . . . . . . . . 502
Link processing order . . . . . . . . . . . . . . . . . . . . . . . . . . . . . . . . . . . . .503
Linking options . . . . . . . . . . . . . . . . . . . . . . . . . . . . . . . . . . . . . . . . . . 504
Using SQL and SQL databases . . . . . . . . . . . . . . . . . . . . . . . . . . . . . . . . 514
What is SQL? . . . . . . . . . . . . . . . . . . . . . . . . . . . . . . . . . . . . . . . . . . . 514
SQL DBMS . . . . . . . . . . . . . . . . . . . . . . . . . . . . . . . . . . . . . . . . . . . . . 517
How does Crystal Reports use SQL? . . . . . . . . . . . . . . . . . . . . . . . . . 518
The SQL language . . . . . . . . . . . . . . . . . . . . . . . . . . . . . . . . . . . . . . . 519
18 Crystal Reports User’s Guide

Contents
Server-side processing . . . . . . . . . . . . . . . . . . . . . . . . . . . . . . . . . . . . . . 521
How server-side grouping affects the SQL query . . . . . . . . . . . . . . . 523
Mapping database fields . . . . . . . . . . . . . . . . . . . . . . . . . . . . . . . . . . . . . 524
About the Map Fields dialog box . . . . . . . . . . . . . . . . . . . . . . . . . . . . 524
Remapping processes . . . . . . . . . . . . . . . . . . . . . . . . . . . . . . . . . . . . 525
Remapping altered database fields . . . . . . . . . . . . . . . . . . . . . . . . . . 526
Saved Data Indexes . . . . . . . . . . . . . . . . . . . . . . . . . . . . . . . . . . . . . . . . . 527
How Report Indexing works . . . . . . . . . . . . . . . . . . . . . . . . . . . . . . . . 528
Considerations for using Saved Data Indexes . . . . . . . . . . . . . . . . . . 528
Indexing the right field(s) . . . . . . . . . . . . . . . . . . . . . . . . . . . . . . . . . . 529
Unicode support in Crystal Reports . . . . . . . . . . . . . . . . . . . . . . . . . . . . . 530
For additional information . . . . . . . . . . . . . . . . . . . . . . . . . . . . . . . . . . . . . 530
Chapter 26 Accessing Data Sources 531
Introduction . . . . . . . . . . . . . . . . . . . . . . . . . . . . . . . . . . . . . . . . . . . . . . . 532
Six types of data . . . . . . . . . . . . . . . . . . . . . . . . . . . . . . . . . . . . . . . . 532
Direct access database files . . . . . . . . . . . . . . . . . . . . . . . . . . . . . . . . . . 533
Advantages . . . . . . . . . . . . . . . . . . . . . . . . . . . . . . . . . . . . . . . . . . . . 533
Disadvantages . . . . . . . . . . . . . . . . . . . . . . . . . . . . . . . . . . . . . . . . . . 533
Three layers . . . . . . . . . . . . . . . . . . . . . . . . . . . . . . . . . . . . . . . . . . . . 534
Common database formats . . . . . . . . . . . . . . . . . . . . . . . . . . . . . . . . 535
ODBC data sources . . . . . . . . . . . . . . . . . . . . . . . . . . . . . . . . . . . . . . . . 543
Advantages . . . . . . . . . . . . . . . . . . . . . . . . . . . . . . . . . . . . . . . . . . . . 544
Disadvantages . . . . . . . . . . . . . . . . . . . . . . . . . . . . . . . . . . . . . . . . . . 545
Five layers . . . . . . . . . . . . . . . . . . . . . . . . . . . . . . . . . . . . . . . . . . . . . 545
Installing database clients . . . . . . . . . . . . . . . . . . . . . . . . . . . . . . . . . 548
Common ODBC database formats . . . . . . . . . . . . . . . . . . . . . . . . . . 549
JDBC data sources . . . . . . . . . . . . . . . . . . . . . . . . . . . . . . . . . . . . . . . . . 552
JNDI . . . . . . . . . . . . . . . . . . . . . . . . . . . . . . . . . . . . . . . . . . . . . . . . . 552
Five layers . . . . . . . . . . . . . . . . . . . . . . . . . . . . . . . . . . . . . . . . . . . . . 552
Supported JDBC database formats . . . . . . . . . . . . . . . . . . . . . . . . . . 553
Configuring the Crystal Reports JDBC driver . . . . . . . . . . . . . . . . . . 554
Business Objects universes . . . . . . . . . . . . . . . . . . . . . . . . . . . . . . . . . . . 554
Crystal Reports User’s Guide 19

Contents
Business Views . . . . . . . . . . . . . . . . . . . . . . . . . . . . . . . . . . . . . . . . . . . . . 555
Crystal SQL Designer files . . . . . . . . . . . . . . . . . . . . . . . . . . . . . . . . . . . . 556
Crystal Dictionary files . . . . . . . . . . . . . . . . . . . . . . . . . . . . . . . . . . . . . . . . 557
Appendix A Report Processing Model 559
Overview . . . . . . . . . . . . . . . . . . . . . . . . . . . . . . . . . . . . . . . . . . . . . . . . . 560
What is a “pass”? . . . . . . . . . . . . . . . . . . . . . . . . . . . . . . . . . . . . . . . . 560
Pre-pass 1 . . . . . . . . . . . . . . . . . . . . . . . . . . . . . . . . . . . . . . . . . . . . . .560
Pass 1 . . . . . . . . . . . . . . . . . . . . . . . . . . . . . . . . . . . . . . . . . . . . . . . . . 560
Pre-pass 2 . . . . . . . . . . . . . . . . . . . . . . . . . . . . . . . . . . . . . . . . . . . . . .561
Pass 2 . . . . . . . . . . . . . . . . . . . . . . . . . . . . . . . . . . . . . . . . . . . . . . . . . 561
Pass 3 . . . . . . . . . . . . . . . . . . . . . . . . . . . . . . . . . . . . . . . . . . . . . . . . . 562
Multi-pass reporting flow chart . . . . . . . . . . . . . . . . . . . . . . . . . . . . . . 562
Appendix B Crystal Reports Error Messages 563
Drive:\filename.extension . . . . . . . . . . . . . . . . . . . . . . . . . . . . . . . . . . . . . 564
Drive:\test.rpt . . . . . . . . . . . . . . . . . . . . . . . . . . . . . . . . . . . . . . . . . . . . . . . 564
Failed to load database connector . . . . . . . . . . . . . . . . . . . . . . . . . . . . . . 564
Failed to open the connection. Details:
[Database Vendor Code: <vendor code number>] . . . . . . . . . . . . . . . . . . 565
Failed to retrieve data from the database. Details:
[Database Vendor Code: <vendor code number>] . . . . . . . . . . . . . . . . . . 566
Appendix C Creating Accessible Reports 567
About accessibility . . . . . . . . . . . . . . . . . . . . . . . . . . . . . . . . . . . . . . . . . .568
Benefits of accessible reports . . . . . . . . . . . . . . . . . . . . . . . . . . . . . . . 568
About the accessibility guidelines . . . . . . . . . . . . . . . . . . . . . . . . . . . . 569
Accessibility and Business Objects products . . . . . . . . . . . . . . . . . . . 570
Improving report accessibility . . . . . . . . . . . . . . . . . . . . . . . . . . . . . . . . . . 571
Placing objects in reports . . . . . . . . . . . . . . . . . . . . . . . . . . . . . . . . . . 571
Text . . . . . . . . . . . . . . . . . . . . . . . . . . . . . . . . . . . . . . . . . . . . . . . . . . . 573
Color . . . . . . . . . . . . . . . . . . . . . . . . . . . . . . . . . . . . . . . . . . . . . . . . . . 576
Navigation . . . . . . . . . . . . . . . . . . . . . . . . . . . . . . . . . . . . . . . . . . . . . . 578
Parameter fields . . . . . . . . . . . . . . . . . . . . . . . . . . . . . . . . . . . . . . . . . 579
20 Crystal Reports User’s Guide

Contents
Designing for flexibility . . . . . . . . . . . . . . . . . . . . . . . . . . . . . . . . . . . . . . . 579
Accessibility and conditional formatting . . . . . . . . . . . . . . . . . . . . . . . 580
Accessibility and suppressing sections . . . . . . . . . . . . . . . . . . . . . . . 581
Accessibility and subreports . . . . . . . . . . . . . . . . . . . . . . . . . . . . . . . 582
Improving data table accessibility . . . . . . . . . . . . . . . . . . . . . . . . . . . . . . 583
Text objects and data table values . . . . . . . . . . . . . . . . . . . . . . . . . . 583
Other data table design considerations . . . . . . . . . . . . . . . . . . . . . . . 587
Accessibility and BusinessObjects Enterprise . . . . . . . . . . . . . . . . . . . . . 588
Setting accessible preferences for BusinessObjects Enterprise . . . . 589
Accessibility and customization . . . . . . . . . . . . . . . . . . . . . . . . . . . . . . . . 589
Resources . . . . . . . . . . . . . . . . . . . . . . . . . . . . . . . . . . . . . . . . . . . . . . . . 591
Appendix D Business Objects Information Resources 593
Documentation and information services . . . . . . . . . . . . . . . . . . . . . . . . . 594
Documentation . . . . . . . . . . . . . . . . . . . . . . . . . . . . . . . . . . . . . . . . . . . . . 594
What’s in the documentation set? . . . . . . . . . . . . . . . . . . . . . . . . . . . 594
Where is the documentation? . . . . . . . . . . . . . . . . . . . . . . . . . . . . . . 594
Send us your feedback . . . . . . . . . . . . . . . . . . . . . . . . . . . . . . . . . . . 595
Customer support, consulting and training . . . . . . . . . . . . . . . . . . . . . . . . 595
How can we support you? . . . . . . . . . . . . . . . . . . . . . . . . . . . . . . . . . 595
Looking for the best deployment solution for your company? . . . . . . 596
Looking for training options? . . . . . . . . . . . . . . . . . . . . . . . . . . . . . . . 596
Useful addresses at a glance . . . . . . . . . . . . . . . . . . . . . . . . . . . . . . . . . . 596
Index 597
Crystal Reports User’s Guide 21

Contents
22 Crystal Reports User’s Guide
Introduction to Crystal Reports XI R2
chapter

Introduction to Crystal Reports XI R2
1
About Crystal Reports
About Crystal Reports
Crystal Reports is designed to work with your database to help you analyze
and interpret important information. Crystal Reports makes it easy to create
simple reports, and, it also has the comprehensive tools you need to produce
complex or specialized reports.
Create any report you can imagine
Crystal Reports is designed to produce the report you want from virtually any
data source. Built-in report experts guide you step by step through building
reports and completing common reporting tasks. Formulas, cross-tabs,
subreports, and conditional formatting help make sense of data and uncover
important relationships that might otherwise be hidden. Geographic maps and
graphs communicate information visually when words and numbers are
simply not enough.
Extend reporting to the Web
The flexibility of Crystal Reports doesn’t end with creating reports — your
reports can be published in a variety of formats including Microsoft Word and
Excel, E-mail and even over the Web. Advanced Web reporting lets other
members of your workgroup view and update shared reports inside their web
browser.
Incorporate reports into applications
Application and web developers can save time and meet their users needs by
integrating the report processing power of Crystal Reports into their database
applications. Support for most popular development languages makes it easy
to add reporting to any application.
Whether it’s the web master in IT, the promotion manager in marketing, the
database administrator in finance or the CEO, Crystal Reports is a powerful
tool designed to help everyone analyze and interpret the information that’s
important to them.
24 Crystal Reports User’s Guide

About this guide
This guide includes procedures for typical reporting tasks such as placing
fields, formatting reports, and sorting records. It also contains information on
more specific areas of interest such as advanced formula creation and
accessing different types of data. Use this guide as a reference for your basic
reporting needs as well as an introduction to new concepts in report creation.
Online help
Crystal Reports online help includes all topics within the user’s guide. It also
provides additional reference material ranging from specific information on
the function of a button to general information on how to create a report
formula based on a sample business scenario.
Locate information quickly
Access online help from the Crystal Reports help menu.
Use the Contents tab to view all major sections in the online help and drill
down to specific headings within each section, the Index tab to view topics in
alphabetical order, and the Search tab to enter a keyword to view all the
sections that relate to the keyword.
Introduction to Crystal Reports XI R2
About this guide
1
Sample Reports
Many topics in the Crystal Reports online help include a list of related sample
reports. Use these reports to illustrate concepts the topic describes. The
sample reports can be adapted to your own needs.
Sample reports are located in the Crystal Reports directory under
\Samples\En\Reports.
Business Objects information resources
For more information and assistance, see Appendix D: Business Objects
Information Resources. This appendix describes the Business Objects
documentation, customer support, training, and consulting services, with links
to online resources.
Crystal Reports User’s Guide 25

Introduction to Crystal Reports XI R2
1
About this guide
26 Crystal Reports User’s Guide

What’s New in Crystal Reports XI R2
chapter

What’s New in Crystal Reports XI R2
2
Introduction
Introduction
This section provides a high-level overview of the components, features, and
benefits that are provided by the latest release of Crystal Reports:
• “Crystal Reports XI R2” on page 28.
• “Application development” on page 32.
• “Future deprecation notices” on page 33.
You can find new features and enhancements within all of the major areas.
Crystal Reports XI R2
Crosstabs
Drag and drop crosstab enhancement
Dragging fields from a crosstab now discards the field when you drop it in an
area that cannot accept the field (the field is inserted when you drop it in an
appropriate area).
You can also drag supported fields from the designer into a crosstab.
Note: Dragging a crosstab summary field is not supported.
Enterprise connectivity
After you log in to BusinessObjects Enterprise and navigate through the
folders to the desired location, the program retains the folder that you last
visited. After closing the Enterprise Open or Save As dialog boxes, the last
visited folder is displayed when you reopen them.
Exporting
PDF
A new option, called “Create bookmarks from group tree,” uses the group tree
from the source Crystal report to create bookmarks in the exported PDF
output, making the PDF export easier to navigate.
Excel - Data Only
A new option, “Show group outlines,” includes grouping information from the
source Crystal report for use with Excel outline symbols information in the
exported Excel spreadsheet, making the Excel export easier to navigate.
28 Crystal Reports User’s Guide

Formatting
What’s New in Crystal Reports XI R2
Crystal Reports XI R2
Separated Values (CSV)
• Several important changes have been made to this feature:
• There are new options to control how report/page/group sections
appear in the CSV export.
• The feature now respects conditional suppression in your report.
• The output is now in UTF-8 format.
• An option, called “Legacy Mode,” has been provided to ease the
migration of existing reports. All customers are encouraged to move to
“Standard Mode” as soon as possible.
For more information, go to http://support.crystaldecisions.com and
search for
Custom colors
You can now save custom colors in Crystal Reports. Custom colors are
automatically stored when you exit the program.
Format Painter and Status bar
Formatting multiple objects with the Format Painter has been enhanced to be
more intuitive. The status bar at the bottom of the designer is now used to
display a message that tells you the requirements needed to accomplish the
task.
You can format multiple objects by double-clicking the Format Painter button,
or by holding down the ALT key while painting objects. When you double-click
the buttons for lines, boxes, and text objects, you can create multiple items.
boe_xi2_csv_export.pdf.
2
Formulas
Add summaries for all group levels
Use this option to add summaries to all levels of a group at once.
Autocomplete in the Formula Editor
In the Formula Editor, the auto-completion list appears when you type an
open brace “{“ to signify a field. The auto-completion list contains the fields
available in the report. This feature works for other report objects, such as
parameter fields, formula fields, and SQL Expressions.
Tip: A related feature that is available in the Formula Editor is the ability to
use Ctrl+Space to see a list of the available functions.
Crystal Reports User’s Guide 29

What’s New in Crystal Reports XI R2
2
Crystal Reports XI R2
Double-clicking formulas, Running Totals, SQL Expressions, or
parameter fields in the Field Explorer
Double-clicking a formula in the Field Explorer opens that formula in the
Formula Editor.
• Double-clicking a Running Total opens the Running Total Field dialog box.
• Double-clicking a parameter field opens the Parameter dialog box.
• Double-clicking a SQL Expression opens the SQL Expression Editor.
Duplicate formulas, parameters, and Running Totals
An option called Duplicate is available when you right-click a formula, an SQL
Expression, or a Running Total field in the Field Explorer For formulas, you
can also see this option in the Formula Editor.
“Find in Formulas” and “Find in Field Explorer”
• You can now search for fields in formulas and in the Field Explorer.
To use the “Find in Formula” option, right-click any type of field in the
Field Explorer, Report Explorer, or Design area of Crystal Reports and
select “Find in Formula.” The Formula Workshop displays all relevant
references for this field in any formula.
• To use the “Find in Field Explorer” option on a report field, right-click any
type of field in your report’s Design area and select “Find in Field
Explorer.” The program highlights the selected field in the Field Explorer.
In general, the Find functionality for formulas in the Formula Workshop has
been greatly enhanced to support searching across all formulas.
Formula field remains highlighted after exiting the Formula Editor
After you edit a formula and close the Formula Editor, the selected formula
remains highlighted in the Field Explorer.
General report functionality
Conditional width
You can now use a formula to specify a conditional width (y position) for a
report object. This functionality is similar to the current option to conditionally
adjust the x position of the report object.
Find dialog box
The Find dialog box has been modified to allow it to remain in the foreground
while you work on your report.
30 Crystal Reports User’s Guide

Online help
The online help dialog box has been modified to allow it to remain in the
background while you work on your report.
Sort field lists in the Field Explorer
By right-clicking a table under Database Fields, you now have the option to
sort the database fields alphabetically. You can also right-click “Database
Fields” in the Field Explorer to sort the tables alphabetically.
Swap fields
By holding down the Shift key and dragging fields from the Field Explorer, you
can now replace other fields in your document (that is, swap one for another).
The size, placement, and formatting of the old object is kept, and the new
object replaces it.
HTML Preview tab
The search capability of the HTML Preview tab has been enhanced. The
program now returns all occurrences of the search criteria it encounters on a
page—not just the first occurrence on a page. Also, when the search reaches the
last page of the report, it will continue searching from the first page of the report.
Note: This enhanced search capability is also available in the DHTML viewer.
What’s New in Crystal Reports XI R2
Crystal Reports XI R2
2
Repository Explorer
Delete/Move Enterprise objects
In the Repository Explorer, you can now move reports and folders under the
Enterprise Items folder.
Categories
You can now create, move, and rename categories in the Repository
Explorer. Options for reports in categories are Assign and Remove. You also
have the ability to move reports to and between categories. Use drag a drop
from other categories or Enterprise folders to assign categories.
Note: Reports cannot be dragged from a category to a folder because
categories are, essentially, shortcuts.
Expand icon
Empty folders no longer show the expand (+) icon in the Repository Explorer.
Shortcut support
Shortcut support has been added to the Repository Explorer.
Crystal Reports User’s Guide 31

What’s New in Crystal Reports XI R2
2
Application development
Workbench
Add Current Report
A new feature in the Workbench is “Add current report.” This feature lets you
add the currently open report to the Workbench.
Application development
Report Application Server (RAS)
The Report Application Server contains several new features. For more
information on these features, see the Crystal Reports Developer’s Help.
• New ModifyUserPaperSize API.
• New ReplaceConnection API.
• Export format enums match new Crystal Reports options.
• Saved-report export options have been added.
• Support for sessionless RAS has been added.
Java Reporting Component (JRC)
The Java Reporting Component contains many new features. For more
information on these features, see the Java Reporting Component API
Reference.
• The JRC now supports dynamic locations for graphics.
• The JRC now supports exporting to editable RTF and CSV formats.
• The JRC now supports XML data sets as a run-time data source.
• The JRC now includes APIs for new server-side functionality:
• Saving reports to the file system (using ReportClientDocument).
• Printing and exporting (using the print output controller).
• Setting parameters (using the parameter field controller).
• Setting database logon (using the database controller).
• The JRC now has updated Locale support with setLocale.
• The JRC now provides a sample that demonstrates how to use Plain Old
Java Objects (POJO) as a data source for reports.
32 Crystal Reports User’s Guide

Crystal Reports .NET
Crystal Reports .NET contains many new features. For more information on
these features, see the Crystal Reports .NET Online Help.
• Crystal Reports fully supports the new ClickOnce deployment of
Windows applications introduced in Visual Studio 2005.
• Code snippets for Crystal Reports are available when building Web Sites
or Windows projects using Visual Basic.
• Several improvements have been made to the CrystalReportViewer control.
• Accessibility has been improved in Crystal Reports .NET.
• Crystal Reports .NET supports international characters through Unicode
and GB18030-2000, the Chinese character encoding standard.
• In Crystal Reports .NET, the Preview tab has been added to the
embedded Crystal Reports Designer to enable you to preview reports at
design time.
• Project templates can be selected when creating a new web site or
Windows project.
Future deprecation notices
What’s New in Crystal Reports XI R2
Future deprecation notices
2
General description
As technologies change, the use of these technologies at Business Objects also
changes. Most of the time this evolution is managed transparently without
impact to you. Occasionally, support for certain technologies or features must be
modified in such a way that you are affected. If a feature becomes unsupported,
advance notice will be provided. The goal at Business Objects is to provide
notice at least two releases before that feature becomes unsupported.
Occasionally technology changes so quickly that such notice cannot be
provided. In these instances, the case will be noted as an exception to our
policy and notice of one release will be provided.
Sample reports and sample application code can be deprecated,
unsupported, and removed from the product with no notice.
The time between announcing deprecation of a feature, and the end of
support for a feature is known as the deprecation period. During the
deprecation period, deprecated features are fully supported within the
product, and technical support is available for these features for as long as
that version of the suite is supported.
Crystal Reports User’s Guide 33

What’s New in Crystal Reports XI R2
2
Future deprecation notices
Due to rapid changes in third-party platforms, modifications to the supported
platforms list will occur shortly before each released version of the product.
These changes are not subject to the release-notice policy because Business
Objects does not control them.
Note: Deprecation announcements within this document are subject to
change based on customer feedback and other factors.
Crystal Reports
• COM DHTML Page Viewer, COM DHTML Advanced Viewer, COM
DHTML Parts Viewer, COM DHTML Grid Viewer, Java Grid Viewer, and
Java Advanced Viewer.
The Page and Parts viewers have equivalent replacements in .NET in XI
currently, and the Advanced Viewer and Grid Viewer features will be
considered for addition to the .NET Webform viewer in the Future
Release. The ActiveX viewer is not being deprecated.
• RDC (Report Design Component).
This deprecation includes both the RDC SDK and the embedded Visual
Basic designer.
• The .NET, Java, and COM Mobile Parts Viewers.
Trends in mobile technology indicate that more mobile devices are able
to consume plain HTML, making mobile specific viewers unnecessary. In
BusinessObjects XI Release 2, support will be added for the Blackberry
Enterprise Server as a supported consumer of PDF files generated by
Crystal Reports.
Report Application Server
• RAS COM SDK.
• Connection Directory Manager.
The capability provided by this feature will be replaced with repositorybased connection objects.
COM SDKs
This document announces the deprecation of most public COM (Component
Object Model) SDKs in Crystal Reports and BusinessObjects Enterprise.
34 Crystal Reports User’s Guide
What’s New in Crystal Reports XI R2
Future deprecation notices
COM is a Microsoft technology and Business Objects will follow the trends
setby Microsoft for support of this technology. At the time of writing, Microsoft
has announced that COM-based development tools, such as Visual Basic 6
and Visual C++ 6, will become unsupported over the next few years. Visual
Basic 6 will be unsupported in March 2008 and Visual C++ 6 will be
unsupported in September 2005.
COM SDKs from Business Objects will be supported in BusinessObjects XI
Release 2 for a period of 3-5 years after the release of that version. This
means that a supported COM SDK solution will be available until support for
BusinessObjects XI Release 2 is retracted in the 2008-2010 time frame.
The migration path for these technologies is described below.
XI COM Based Technology Replacement Technology available in
BusinessObjects XI
BusinessObjects Enterprise CSP pages
BusinessObjects Enterprise ASP pages
BusinessObjects Enterprise COM SDK BusinessObjects Enterprise Java SDK
Viewrpt.cwr for URL reporting Viewrpt (Java servlet)
Crystal Reports Report Application Server
(RAS) COM SDK
Crystal Reports Report Design Component
(RDC)
Crystal Reports COM DHTML Viewer Crystal Reports Java DHTML Viewer
JSP
ASPX
BusinessObjects Enterprise.NET SDK
BusinessObjects Enterprise Server
Controls
BusinessObjects web services
JSF Control
Viewrpt.aspx
Opendocument (Java servlet)
Opendocument.aspx
Crystal Reports Java SDK
Crystal Reports .NET SDK
RAS Java SDK
RAS .NET SDK
Crystal Reports Java SDK
Crystal Reports.NET SDK
Crystal Reports.NET DHTML Viewer
2
Crystal Reports User’s Guide 35

What’s New in Crystal Reports XI R2
2
Future deprecation notices
OLAP Intelligence
• Saved views.
This feature will be replaced with Save As functionality.
• Reporting experts.
• Pivot control within the Dimension Explorer.
• Hyperion Essbase Legacy driver.
This driver will be replaced with a new, enhanced driver.
• IBM DB2 OLAP Legacy driver.
This driver will be replaced with a new, enhanced driver.
Data Integrator
• MQ Series Technology Interface.
This functionality will be replaced by the JMS Technology Interface.
BusinessObjects Enterprise
• Crystal Server Pages (CSP) and Web Component Adapter (WCA).
With BusinessObjects XI, JAVA and .NET are the primary application
server technologies supported.
• Enterprise COM SDK.
• Processing extensions on both the Windows and UNIX platforms.
In the Future Release Business Objects plans to introduce a public
semantic layer SDK that will support current processing extension use
cases.
• SOCKS proxy servers.
If you are using SOCKS proxy servers now, it is recommended that you
switch to a different firewall method. See the BusinessObjects Enterprise
Administrator’s Guide for more information on firewall support.
36 Crystal Reports User’s Guide
Crystal Reports User’s Guide
Installing Crystal Reports XI R2
chapter

Installing Crystal Reports XI R2
3
Installing Crystal Reports XI R2
Installing Crystal Reports XI R2
The Crystal Reports Installation Wizard works with Microsoft Windows
Installer to guide you through the installation process. The Installation Wizard
automatically recognizes your computer’s operating system and updates files
as required.
This chapter provides step-by-step instructions for installing Crystal Reports
and shows how to customize your installation. The main topics are:
• “Installation requirements” on page 38
• “Installing Crystal Reports on a local machine” on page 39
• “Creating an installation point and installing from a network server” on
page 40
• “Customizing your installation” on page 42
• “Running a silent installation” on page 44
• “Upgrading Crystal Reports components” on page 48
As one of the final steps in the installation process, you’ll be asked if you want
to register the product. Follow the on-screen instructions to complete this
process.
Installation requirements
Minimum installation requirements
Operating Systems Windows 2000
Windows XP Professional
Windows 2003 Server
Computer/Processor 450 MHz or higher Pentium-compatible CPU
Memory At least 128 megabytes (MB) of RAM. 256 MB
recommended. 4 gigabytes (GB) maximum
Disk space 1.0 gigabyte minimum. 1.5 gigabytes
recommended
Drive CD-ROM or DVD drive
Note:
• The .NET components require the .NET 1.0 or .NET 1.1 runtime.
• The Java components require a J2EE 1.3.x or J2EE 1.4.x compatible
runtime.
38 Crystal Reports User’s Guide
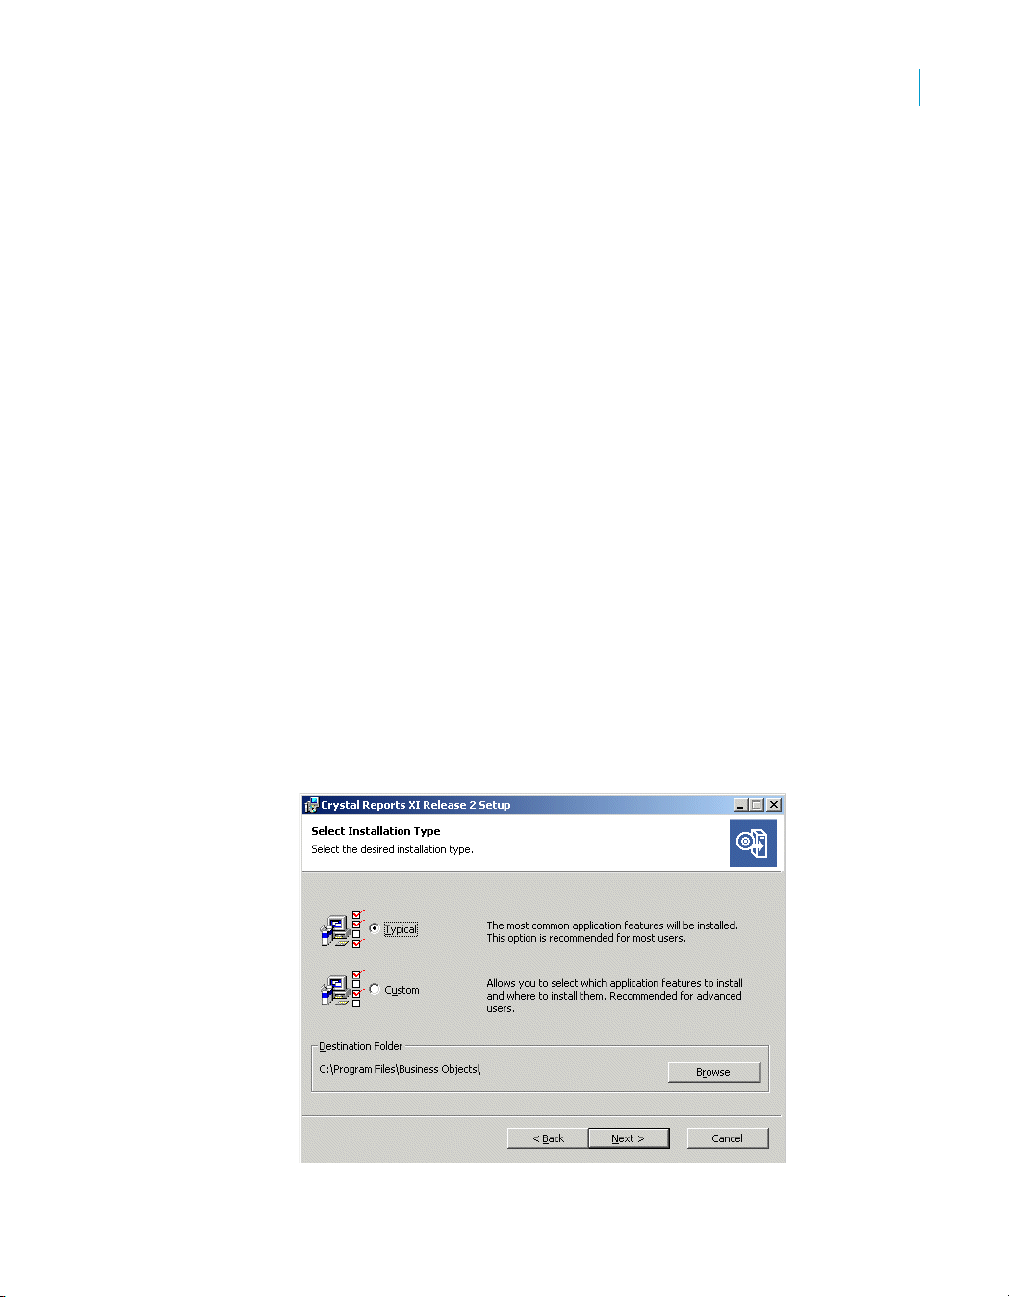
Installing Crystal Reports XI R2
Installing Crystal Reports on a local machine
Installing Crystal Reports on a local machine
If you are installing Crystal Reports on a computer running any of the supported
operating systems (see Minimum installation requirements above), you must
have Administrator privileges. The installation process creates registry entries
and may update some system files that require Administrator rights.
Close all currently running programs and stop as many services as possible
when installing Crystal Reports.
If you want to limit the features you install, see “Customizing your installation”
on page 42.
To install on a local machine
1. Unless Autoplay is enabled for your CD-ROM drive, run Setup.exe from
win32_x86 directory of your product distribution.
the
Note: Depending on the configuration of your current system, you may
receive a dialog box informing you to update existing files. If this
happens, click Yes and restart your machine. The Installation Wizard
updates the required files.
2. Choose the language in which you want to install Crystal Reports.
3. Read and accept the License Agreement to proceed with the installation.
4. In the User Information dialog box, type your name, organization, and the
product activation keycode.
5. Click Next.
The Select Installation Type dialog box appears.
3
Crystal Reports User’s Guide 39

Installing Crystal Reports XI R2
3
Creating an installation point and installing from a network server
6. Choose the type of installation that you want to perform:
• Typical installs the most common application features.
• Custom enables you to choose the features that you want installed,
to specify where they will be installed, and to check the disk space
required by each feature. For details, see “Customizing your
installation” on page 42.
7. Click Browse if you want to install Crystal Reports to a directory different
from the default location.
The default location for Crystal Reports is
Files\Business Objects\
8. Click Next.
The Start Installation dialog box appears.
Note: If you install Crystal Reports on a machine with an Internet
connection, you can choose to disable the automatic Web Update
Service feature. This features lets you check for updates and service
packs each time you open Crystal Reports; if you disable it, you cannot
activate it later.
9. Click Next to begin copying files to your local drive.
C:\Program
Creating an installation point and installing
from a network server
Installing Crystal Reports from a central network location involves two steps:
1. Make a copy of your Crystal Reports product distribution on a server
machine on the network (this copy becomes your installation point). See
“Creating an installation point for Crystal Reports” on page 40.
2. Access the server machine from a workstation, and run Setup.exe to
install Crystal Reports on the workstation. See “Installing Crystal Reports
from a network” on page 41.
Creating an installation point for Crystal Reports
This procedure must be performed by a network administrator who has write
access and network privileges. When this procedure is complete, end users
will be able to access Setup.exe from the network to install Crystal Reports
onto their local machines.
40 Crystal Reports User’s Guide

Creating an installation point and installing from a network server
Note: If users do not have the Microsoft Windows Installer configured on
their machines, the setup process detects the workstation’s operating system
and installs the appropriate Microsoft Windows Installer package.
To create an installation point
1. Create a folder on your network, and share this folder for the users who
need to run the Setup.exe.
2. Copy the entire contents of your Crystal Reports product distribution to
the folder that you created in step 1.
3. Assign rights to the users who need to install Crystal Reports from this
folder.
Note: Restricting access to this folder lets you stay within your license limit.
Installing Crystal Reports from a network
If your network administrator has copied Crystal Reports to the network,
make sure you have read privileges to that network before beginning this
process.
If you are installing Crystal Reports on a computer running any of the
supported operating systems (see “Minimum installation requirements” on
page 38), you must have Administrator privileges on the computer. The
installation process creates registry entries and may update some system
files that require Administrator rights.
Close all currently running programs and stop as many services as possible
when installing Crystal Reports.
Installing Crystal Reports XI R2
3
To install Crystal Reports from a network
1. Access the folder on the network that contains the Crystal Reports
installation files.
2. Double-click Setup.exe.
Note: Depending on the configuration of your current system, you may
receive a dialog box informing you to update existing files. Click Yes and
restart your machine. The Installation Wizard updates the required files.
3. Choose the language in which you want to install Crystal Reports.
4. Read and accept the License Agreement to proceed with the installation.
5. In the User Information dialog box, type your name, organization, and the
product activation keycode.
Tip: You may need to contact your Administrator for the product
activation keycode.
Crystal Reports User’s Guide 41

Installing Crystal Reports XI R2
3
Customizing your installation
6. Click Next.
7. Choose the type of installation that you want to perform:
8. Click Browse if you want to install Crystal Reports to a directory different
9. Click Next.
10. Click Next to begin copying files to your local drive.
The Select Installation Type dialog box appears.
• Typical installs the most common application features.
• Custom enables you to choose the features that you want installed,
to specify where they will be installed, and to check the disk space
required by each feature. For details, see “Customizing your
installation” on page 42.
from the default location.
The default location for Crystal Reports is
Files\Business Objects\
The Start Install dialog box appears.
Note: If you install Crystal Reports on a machine with an Internet
connection, you can choose to disable the automatic Web Update
Service feature. This features lets you check for updates and service
packs each time you open Crystal Reports; if you disable it, you cannot
activate it later.
C:\Program
Customizing your installation
Selecting the Custom installation option invokes the Select Features dialog
box, which allows you to install specific features, to change the default
location of various features, and to check the amount of disk space required
by each feature.
42 Crystal Reports User’s Guide

Installing Crystal Reports XI R2
Customizing your installation
The icons in the feature tree indicate whether the feature and its subfeatures
will be installed or not:
• A white icon means that the feature and all its subfeatures will be
installed.
• A shaded icon means that the feature and some of its subfeatures will be
installed.
• A yellow 1 means that the feature will be installed when required
(installed on demand).
• A red X means that the feature or subfeature is either unavailable or will
not be installed.
Crystal Reports uses an “install on-demand” technology for some of its
features. As a result, the very first time a particular feature is used after being
installed, there may be an extra wait for the “install on-demand” to complete.
This behavior will affect new installations only once and will not occur when
features are restarted.
To select the configuration and location of a feature or subfeature, click its icon.
Note: Each feature or subfeature can have its own configuration and location.
3
Crystal Reports User’s Guide 43

Installing Crystal Reports XI R2
3
Running a silent installation
Use the following table to determine your installation options for each feature
or subfeature:
Type of feature
installation
Will be installed on local
hard drive
Entire feature will be
installed on local hard drive
Feature will be installed
when required
Entire feature will be
unavailable
Note: Subfeatures are listed below each feature. A subfeature can have a
different type of installation than its parent feature.
Description of what is installed
• Installs the feature on the local hard drive.
• Uses the Typical install settings to install
some of the feature’s subfeatures to the
local hard drive.
• Installs the feature and all of its
subfeatures on the local hard drive.
• Installs the feature or subfeature from the
product distribution/network when first
used.
• Neither the feature nor its subfeatures are
installed.
Running a silent installation
A silent installation is one that you run from the command line to automatically
install Crystal Reports on any machine in your system, without the installation
program prompting for information during the installation. The command you
run must include a series of parameters that provide information for
installation settings and directory paths.
The silent Crystal Reports installation is particularly useful when you need to
perform multiple installations and do not want to interrupt people who are
working on machines in your system. You can also use the silent installation
command in your own scripts. For example, if your organization uses scripts
to install software on machines, you can add the silent Crystal Reports
installation command to your scripts.
44 Crystal Reports User’s Guide

Installing Crystal Reports XI R2
Running a silent installation
Note:
• The silent installation is not available from the Crystal Reports Setup
program and is intended only for experienced administrators of Crystal
Reports.
• When you perform a silent installation, you accept the Crystal Reports
end-user license agreement by default. You can find a copy of the license
agreement in the
Docs folder of your product distribution.
• Silent installations are intended for new installations; do not use them for
upgrades.
The silent installation command consists of the command
followed by a number of parameters that provide information about the
installation. The following example installs Crystal Reports:
setup.exe ADDLOCAL=ALL CLIENTLANGUAGE=<
REBOOT=ReallySuppress PIDKEY=<
INSTALLDIR="C:\Program Files\Business Objects\Crystal
Reports 11.5" /qn
Note:
•
<%langcode%>
the following table.
•
<%keycode%>
keycode.
The example uses the most common parameters. You can choose any
number of valid parameters, but it is good practice to keep the silent installation
as simple as possible.
The following table lists the most common parameters used in a silent
installation. To use a parameter, place it on the command line after the
setup.exe command.
Note: Parameters that are not listed in this table may be available, but they
have not been tested. Untested parameters are not supported.
Replace this variable with a valid language code from
Replace this variable with a valid product activation
%keycode%
%langcode%
setup.exe,
>
>
3
Crystal Reports User’s Guide 45

Installing Crystal Reports XI R2
3
Running a silent installation
Installation parameter Description
CLIENTLANGUAGE=
Use this to specify the language version code
for the install.
• For English, enter EN.
• For French, enter FR.
• For German, enter DE.
• For Spanish, enter ES.
• For Japanese enter JP.
• For Simplified Chinese, enter CHS
• For Traditional Chinese, enter CHT.
• For Korean, enter KO.
• For Dutch, enter NL.
Note: If you don’t enter this parameter, the
regular language-selection screen appears at
the beginning of your install, even if you
specified the parameters for a no-prompt
installation.
INSTALLDIR="filepath" Specifies the machine and directory where
you want to install Crystal Reports. Replace
filepath with the full path for the installation
directory. For example, "C:\Program
Files\Business Objects\Crystal Reports 11.5".
PIDKEY=00000-00000000000000-0000
REBOOT=ReallySuppress Prevents Crystal Reports from prompting the
/qn+ Performs the installation silently, but prompts
/qn Performs the installation silently, without
Specifies your product activation keycode.
user to reboot the machine.
the user when the installation is complete.
prompting the user.
46 Crystal Reports User’s Guide

Installing Crystal Reports XI R2
Running a silent installation
Installation parameter Description
ADDLOCAL Specifies a list of features, delimited by
commas, that you want to install.
For example, ADDLOCAL=ALL
Note: When using any of the EXCLUDE
parameters in this table, you must also use
ADDLOCAL.
For example, ADDLOCAL=ALL
EXCLUDERDCFILES=1
EXCLUDEDOTNETFILES Specifies whether the .NET developer
components should be installed.
For example, EXCLUDEDOTNETFILES=1
The default value is 0, which indicates that
the .NET developer components should be
installed. The value 1 indicates these
components should not be installed.
EXCLUDEJAVAFILES Specifies whether the Java developer
components should be installed.
For example, EXCLUDEJAVAFILES=1
The default value is 0, which indicates that
the Java developer components should be
installed. The value 1 indicates these
components should not be installed.
EXCLUDERDCFILES Specifies whether the RDC developer
components should be installed.
For example, EXCLUDERDCFILES=1
The default value is 0, which indicates that
the RDC developer components should be
installed. The value 1 indicates these
components should not be installed.
3
Note: You can use the silent installation to add only features that you have
purchased licences for (controlled by your license key). If you add a feature
that you do not have a license for, that feature is ignored by the silent
installer.
Crystal Reports User’s Guide 47

Installing Crystal Reports XI R2
3
Upgrading Crystal Reports components
Upgrading Crystal Reports components
If you have purchased an upgrade product activation keycode, you will find
that the installation program does not remove your previous version of Crystal
Reports. In general, upgrading Crystal Reports components provides you
with a side-by-side installation (that is, an installation in which you can run
either your old or new version of Crystal Reports).
Note: Crystal Reports XI R2 side-by-side installation is supported when
upgrading from Crystal Reports XI, Crystal Reports 10, Crystal Reports 9, or
Crystal Reports 8.5.
This side-by-side behavior applies to Crystal Reports and the various
Software Development Kits (SDKs). Crystal Reports XI R2 for Visual Studio
.NET can be used in side-by-side mode at runtime (that is, applications
written using Crystal Reports 10 for Visual Studio .NET will continue to run
with Crystal Reports 10 for Visual Studio .NET assemblies). However, Visual
Studio integration is not side by side; only one version of Crystal Reports can
be integrated into the Visual Studio .NET IDE at any given time. The same
thing applies to the Report Designer Component (RDC): the RDC can be
used in side-by-side mode at runtime, but IDE integration is not side by side.
Note: For further information that may pertain to your reporting environment,
consult the Release Notes included with your product distribution
release_en.pdf).
(
48 Crystal Reports User’s Guide
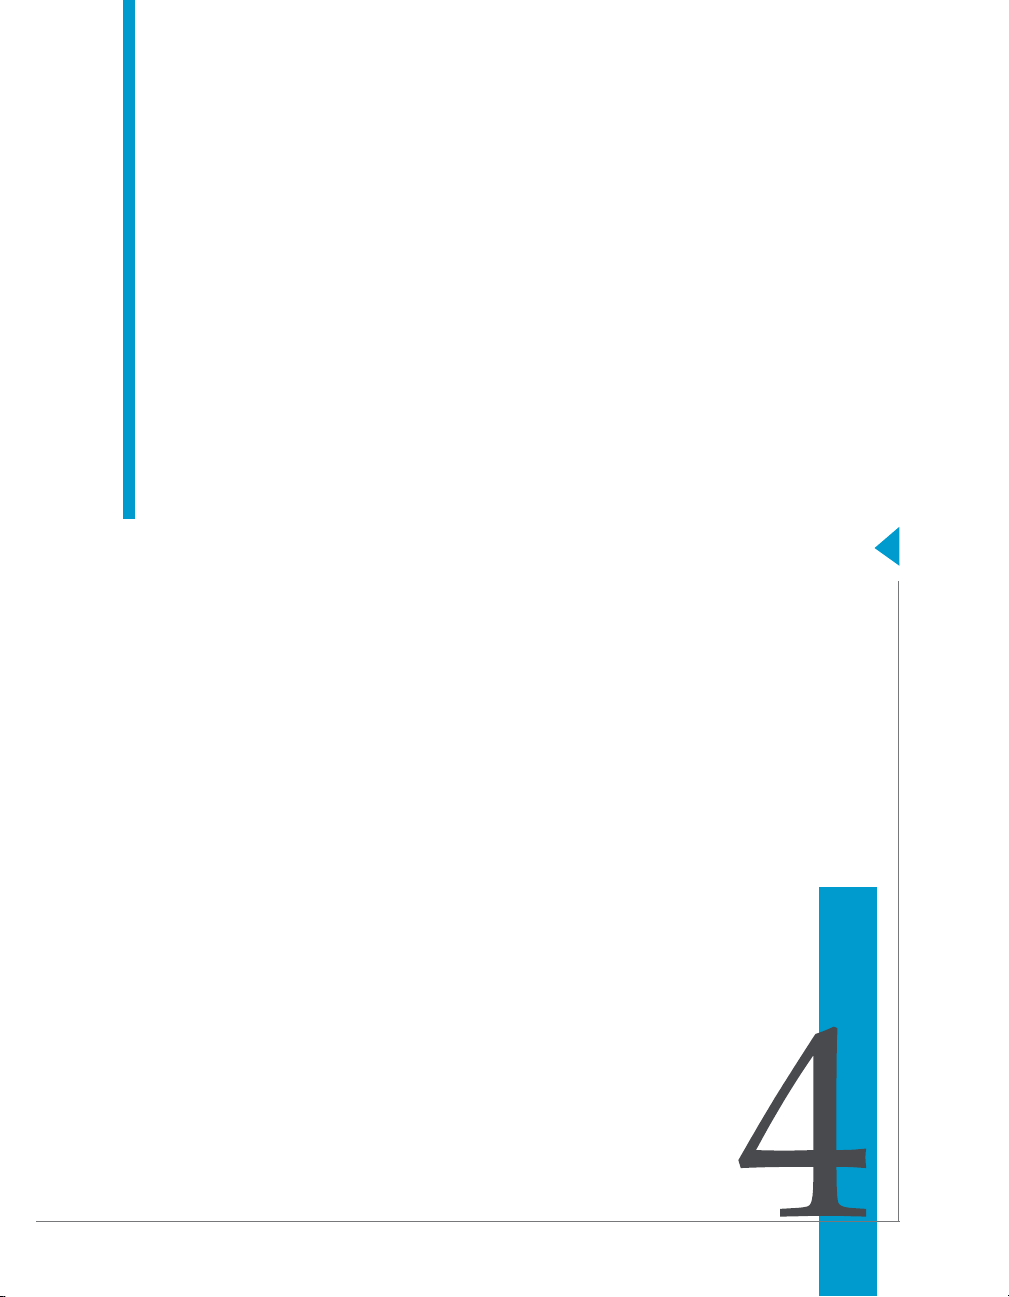
Quick Start
chapter

Quick Start
4
Learning how to use Crystal Reports
Learning how to use Crystal Reports
You can teach yourself how to use Crystal Reports by choosing from the
methods available in this chapter:
• You can study the sample reports and sample database included with
Crystal Reports.
• You can use the detailed descriptions and instructions in the “Quick start
for new users” on page 52.
• You can use the summaries and topic cross-references in the “Quick
start for advanced users” on page 72—especially useful if you’re already
familiar with reporting concepts.
Each method is a helpful way to learn and understand Crystal Reports and,
although any one might be enough to get you up and running, you can always
come back to this chapter and consult the other methods as you need them.
Sample data - Xtreme.mdb
Crystal Reports comes with Xtreme.mdb, a sample database you can use
when learning the program. Xtreme.mdb is a Microsoft Access database and
all of the necessary drivers are included. You should be able to open the
database directly and begin designing reports. Virtually all of the examples in
this manual are based on Xtreme.mdb data.
Xtreme.mdb is a database that contains data for Xtreme Mountain Bikes, a
fictitious manufacturer of mountain bikes and accessories.
Note: The sample data has been designed to illustrate various reporting
concepts in a training environment, not to teach database design. While there
are alternative ways of designing a database, this design was selected to keep
the tutorials and examples focused on reporting, not on data manipulation.
Report Creation Wizards
The tutorials in this chapter show you how to build a report from scratch. As a
complement or an alternative, however, you may want to use the Report
Creation Wizards available on the Start Page. There are four Report Creation
Wizards:
• Standard
• Cross-Tab
• Mailing Label
• OLAP
50 Crystal Reports User’s Guide

Standard
Cross-Tab
Quick Start
Report Creation Wizards
Each wizard guides you through the creation of a report by providing a series
of screens. Many of the wizards have screens unique to a specific type of
report. For example, the Mailing Labels Report Creation Wizard has a screen
that allows you to specify the type of mailing label you want to use.
Note: After you’ve clicked the Finish button in a Report Creation Wizard, you
can click the Stop button on the Navigation Tools toolbar if you don’t want the
program to gather all the data from your data source. This is useful if you want
to make adjustments to the report layout that the wizard created.
The Standard Report Creation Wizard is the most generic of the wizards. It
guides you through choosing a data source and linking database tables. It
also helps you add fields and specify the grouping, summarization (totals),
and sorting criteria you want to use. Finally, the Standard Report Creation
Wizard leads you through chart creation and record selection.
The Templates screen contains predefined layouts for you to apply to your
report to give it more impact.
4
The Cross-Tab Report Creation Wizard guides you through the creation of a
report in which your data is displayed as a cross-tab object. Two special screens
(Cross-Tab and Grid Style) help you create and format the cross-tab itself.
Mailing Label
The Mailing Labels Report Creation Wizard lets you create a report that is
formatted to print on any size mailing label. You can use the Label screen to
select a commercial label type, or you can define your own layout of rows and
columns for any multi-column style report.
OLAP
The OLAP Report Creation Wizard lets you create a report in which your
OLAP data is displayed as a grid object. Although similar to the Cross-Tab
Report Creation Wizard in several ways, the OLAP Report Creation Wizard
appears to be different due to the requirements of working with OLAP data
sources. You first specify the location of your OLAP data, and then you choose
Crystal Reports User’s Guide 51

Quick Start
4
Quick start for new users
the dimensions you want to include in the grid. Next you filter the report data
and choose the style of the grid object, which you can also customize. Finally,
you can define labels for your grid and insert a chart, if you wish.
This is only a brief overview of the four Report Creation Wizards available in
Crystal Reports.
Quick start for new users
The following tutorial has been designed to give you confidence when
creating your first report.
In this tutorial, you will get an introduction to the program as you create a
Customer List report. The Customer List is one of the most basic business
reports and typically has information such as Customer Name, City, Region,
and Contact Name.
You begin by learning the basic concepts: selecting a database, placing some
fields on the report, and then selecting specific records to be included. You
will then learn how to:
• Insert and move database fields.
• Add and format a title.
• Display a report in the Preview tab so you can fine-tune your work.
• Use the Select Expert to ensure the report includes only the data you
need.
• Move objects.
• Group and sort data.
• Insert pictures.
• Print a report.
Before you begin
This tutorial assumes you are familiar with Microsoft Windows and uses
conventional terms and procedures common to the Windows environment. If
you are not familiar with Windows, please refer to the documentation that
came with Microsoft Windows for further explanation.
The default font for all report sections in the program is set to Arial, 10 point. If
you have changed the default font, or if your printer does not support this font,
the field size, field spacing, and screen shots will look different than those
included in this tutorial.
52 Crystal Reports User’s Guide

This tutorial has been designed using Microsoft Windows 2000. Screen shots
may vary slightly if you are using a different platform.
If you are not familiar with the Crystal Reports environment, review
“Formatting” on page 235, which describes working with the grid, using
guidelines, and formatting activities.
Creating the report
1. Click the Start Page tab if the Start Page is not already visible in Crystal
Reports.
The New Reports area of the Start Page contains a number of wizards to
guide you through the creation of specific types of reports. Since you will
be learning reporting concepts here, you can skip the wizards and build
your report from scratch. After you have completed this tutorial, you may
want to build some reports using the wizards to decide which method of
report construction you are most comfortable with.
2. In the New Reports area, click Blank Report.
The Database Expert dialog box appears.
Note: You can create reports based on database files, SQL/ODBC data
sources, Business Views, and a variety of other data sources.
Quick Start
Quick start for new users
4
Selecting a database to use
The next step in creating a report is to select a database. Select the
Xtreme.mdb sample database for this tutorial.
To select a database
1. In the Database Expert dialog box, expand the Create New Connection
folder and then expand the Database Files folder; then search for the
Xtreme.mdb sample database.
By default, this file was installed in the
Objects\Common\3.5\Samples\En\Databases directory.
\Program Files\Business
Crystal Reports User’s Guide 53
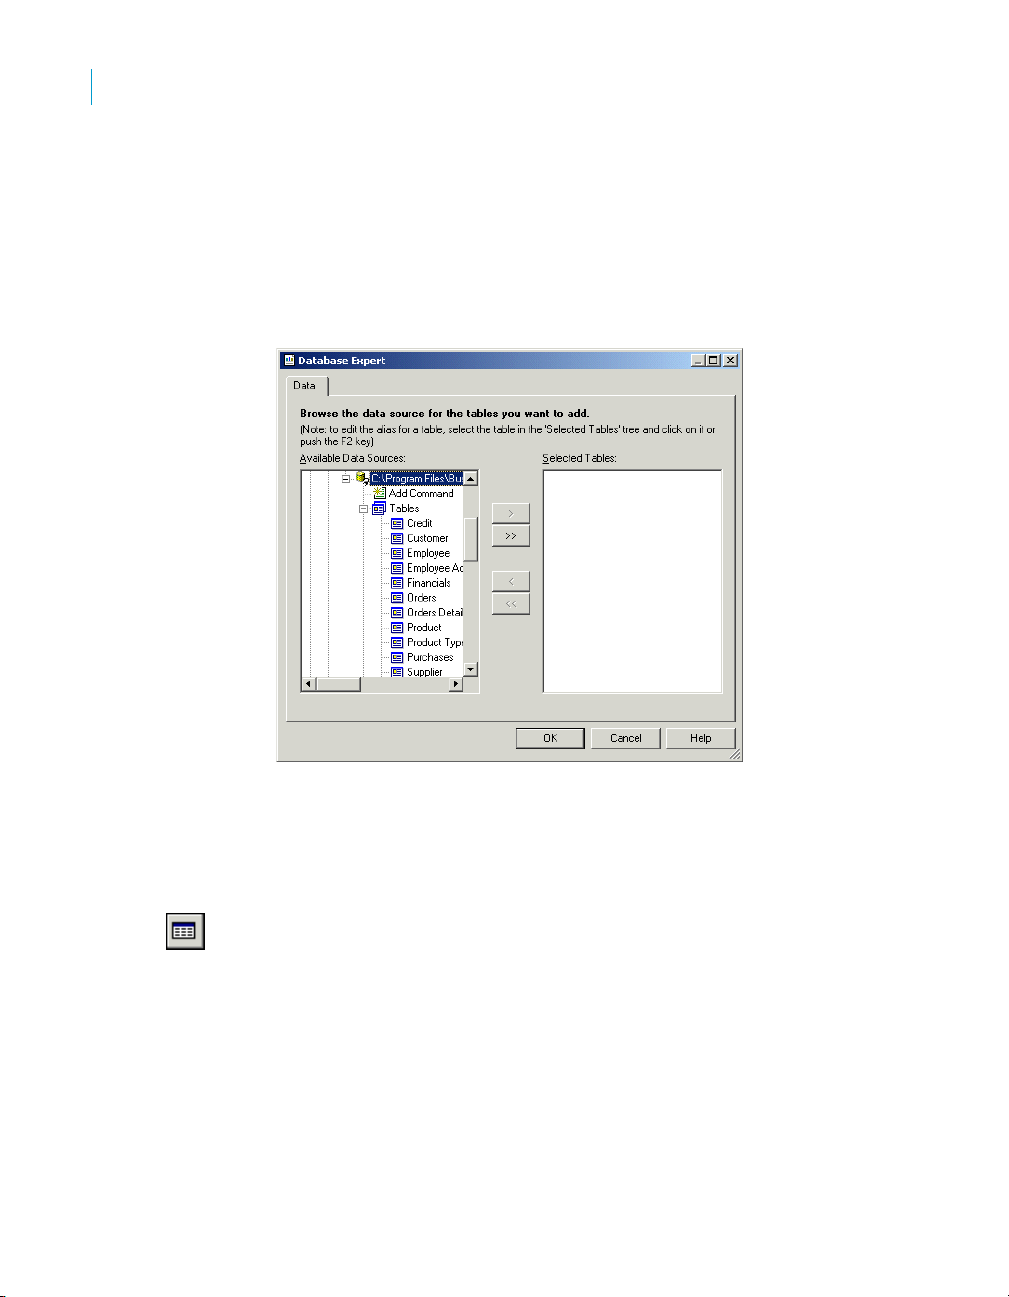
Quick Start
4
Quick start for new users
Note:
• You have to use the Open dialog box to find the Xtreme database.
• If you wish to see database and server properties after you have
selected a database, right-click the database node in the Database
Expert and select Properties from the shortcut menu.
2. Expand the Tab le s node of the Xtreme.mdb connection to see a list of
tables.
Because you are dealing only with customers in this tutorial, you will
select the Customer table.
3. Select Customer and click the > arrow to add it to the Selected Tables list,
and then click OK.
The Design tab of the Report Designer appears.
4. Click Field Explorer on the Standard toolbar.
The Field Explorer dialog box appears.
Note: Depending on how it appeared when you last used Crystal
Reports, the Field Explorer dialog box might be docked or in floating
54 Crystal Reports User’s Guide
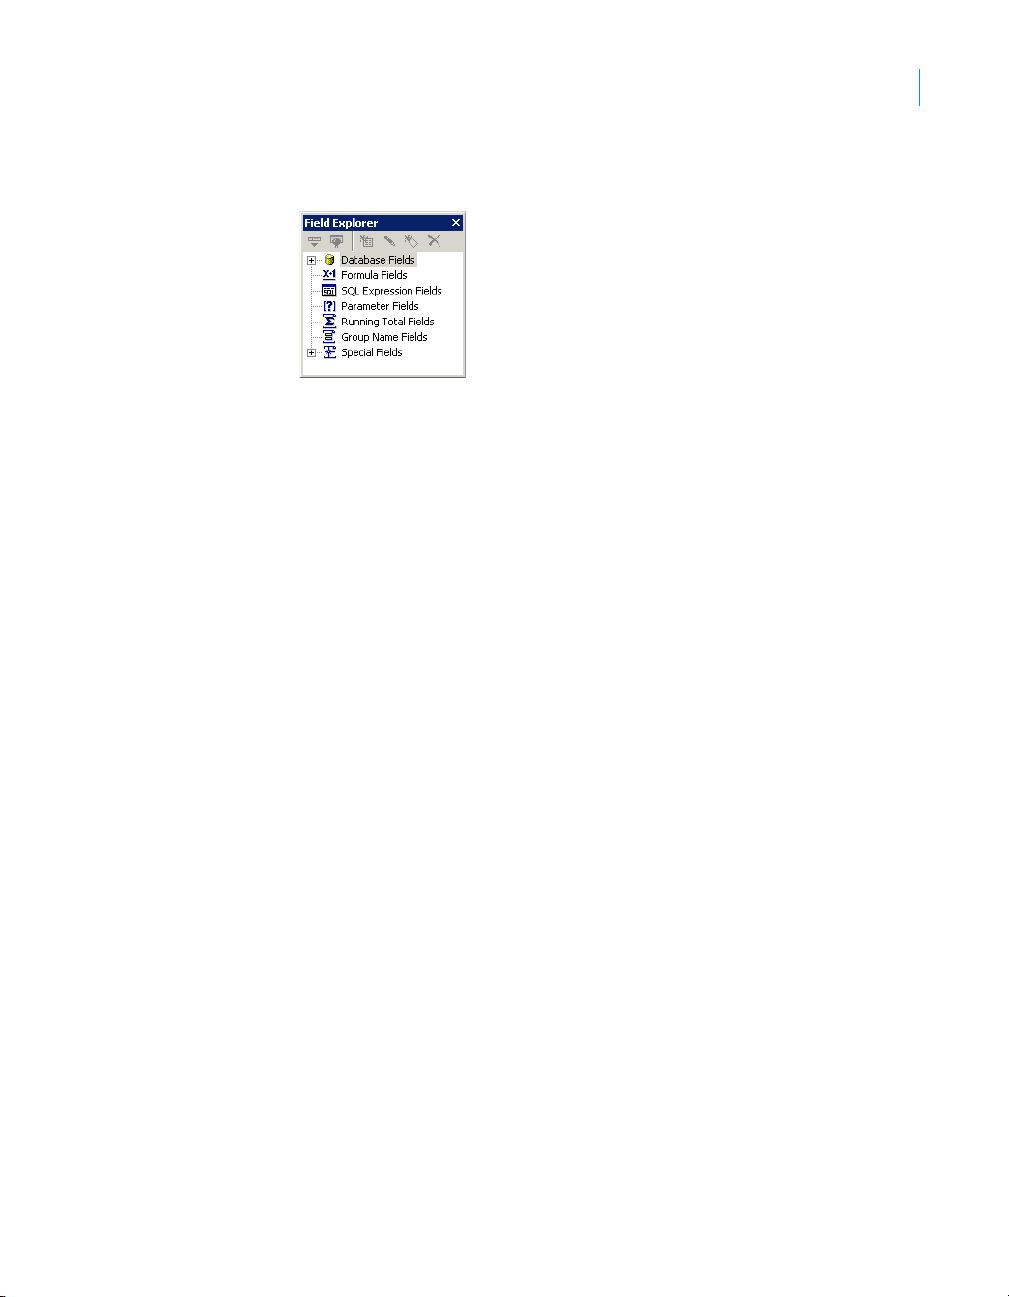
Report sections
The Design tab is divided into five sections: Report Header (RH), Page Header
(PH), Details (D), Report Footer (RF), and Page Footer (PF). If at any time you
are unsure of the report section in which you are working, simply look at the
shaded area to the left of the report which always displays either the section
names or the initials that designate the names. See “Design tab” on page 91.
If the Short Section Names check box is selected in the Design View area of
the Options dialog box, then the Report Header, Page Header, Details,
Report Footer and Page Footer section names will appear as RH, PH, D, RF
and PF respectively. If this check box is not selected, follow these steps:
Quick Start
Quick start for new users
mode. For more information about docking explorers, see “Opening and
docking explorers” on page 118.
4
1. On the File menu, click Options.
2. In the Design View area, select the Short Section Names check box.
3. Click OK to return to the report.
Inserting a field
You’ll use the Field Explorer dialog box to insert database fields when you
create a new report.
This dialog box is set to remain on-screen until you close it. All the tables
available for use are listed in this box.
You will now start placing objects on the report by inserting the Customer
Name field.
To show short section names
The Options dialog box appears with the Layout tab active.
Crystal Reports User’s Guide 55
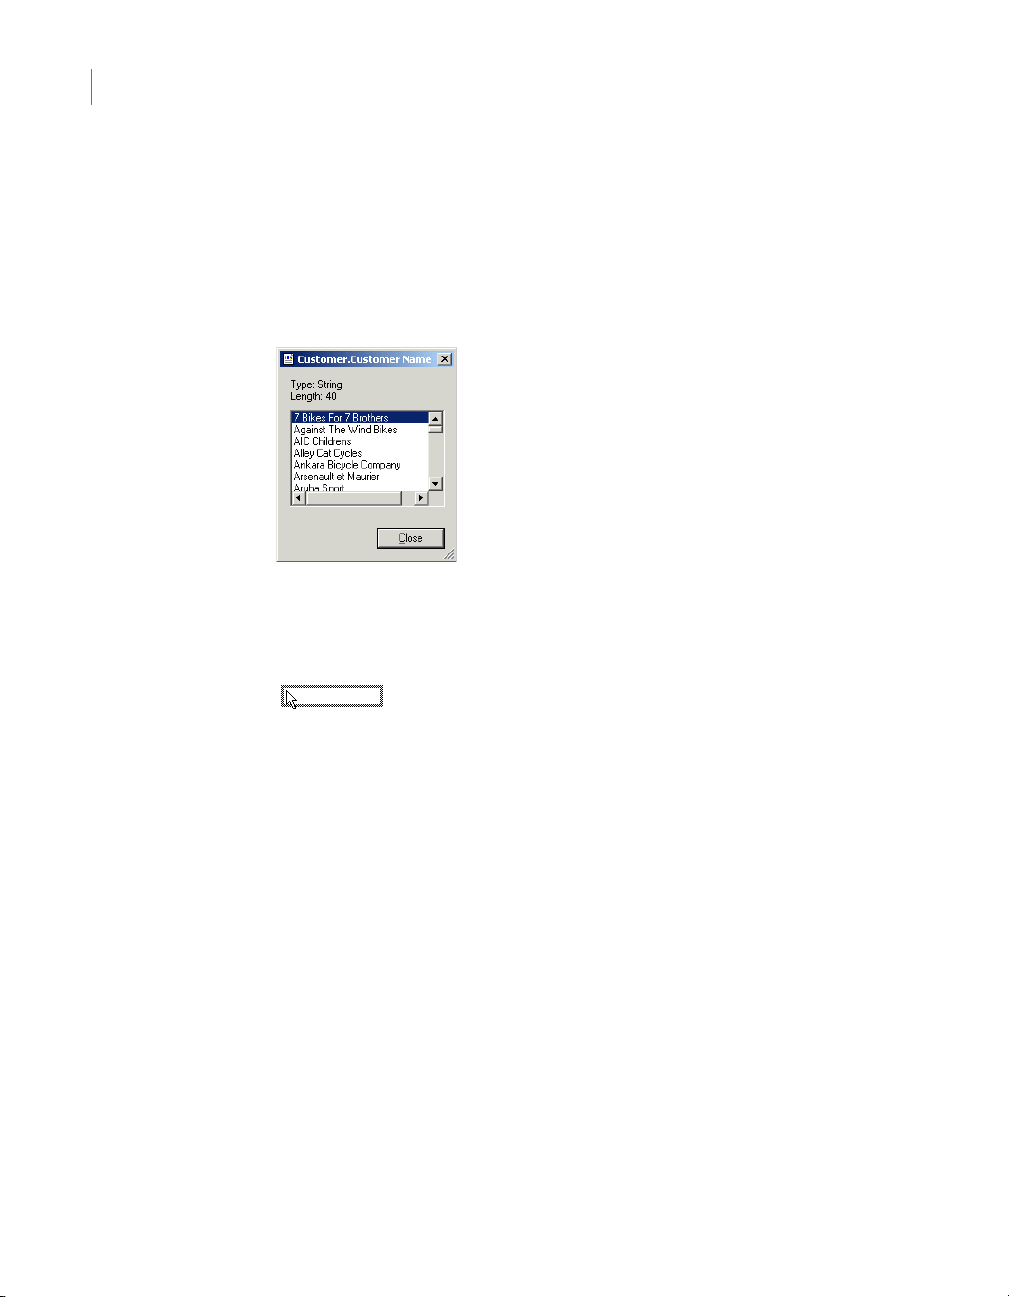
Quick Start
4
Quick start for new users
To insert a field
1. Expand the Database Fields node in the Field Explorer dialog box and
expand a table.
2. Highlight a field name by clicking the name once.
When you highlight a field name, you can review a subset of the values
for that field as well as the field type and size by right-clicking the field
and selecting Browse Data from the shortcut menu.
3. Click the Customer Name field and drag it into the Details section of the
report.
An object frame appears with the Arrow cursor as you drag the field onto
the report:
• The object frame represents the object you have just selected for
placement.
• The size of the object frame approximates the size of the data in the
field selected.
4. Move the object frame as far to the left as you can in the Details section.
If you move the field too far to the left, the Arrow cursor turns into a Stop
cursor, indicating that you cannot drag the field that far. Keep in mind that
you cannot place any objects outside the page margin.
56 Crystal Reports User’s Guide
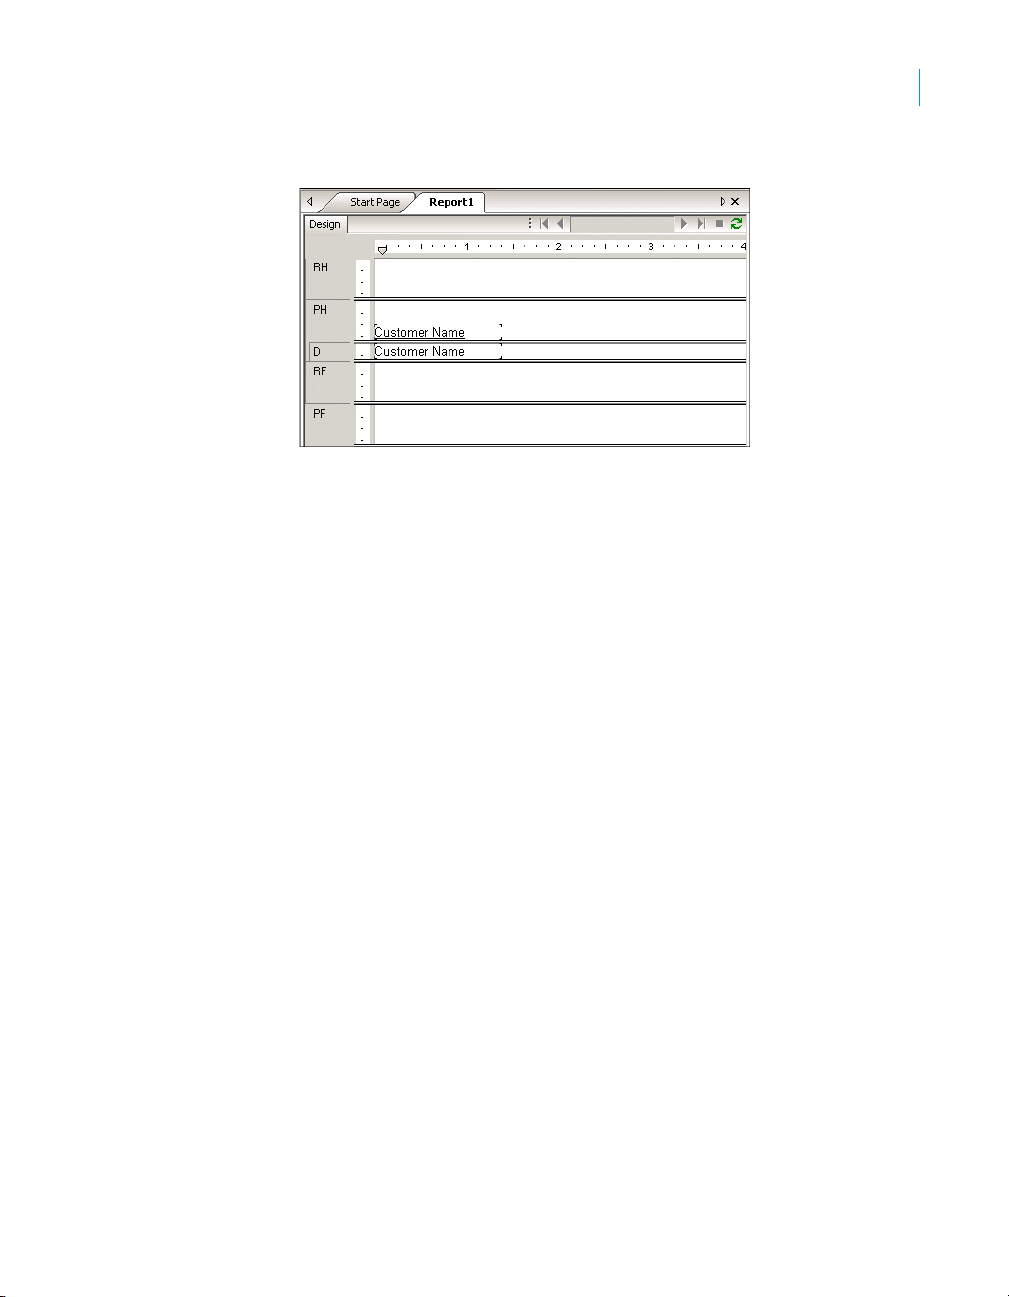
The Design tab should look similar to this:
Understanding fields
Before going any further, take a look at the field you just placed in the Details
section:
• First of all, the object frame indicates that when the report is printed, a
field value will appear where the box is positioned.
• If you haven’t selected the Show Field Names check box on the Layout
tab of the Options dialog box, the object frame contains Xs to indicate
that the database field contains a text string. Other data types have
different character representations. For example, a currency data type is
represented by $55,555.56.
• If your report is not showing field names, the number of Xs in the object
frame is the data width, the maximum number of characters in the field as
defined by the database. Whether or not your report shows field names,
the width of the object frame is the field width (the amount of space
allocated to the field for printing). Initially it is set to the width needed to
display the maximum number of characters in the field (using the font
selected for the field). You can change this width by resizing the field.
• The size of the characters or Xs indicates the point size selected for the
characters in the field.
• The font and style (Bold, Underline, and so on) used in displaying the
characters or Xs indicate the font and style selected for the characters in
the field. Later in this tutorial you will learn how to make changes to these
properties.
• The line spacing is adjusted to the point size selected for the characters
in the field.
Quick Start
Quick start for new users
4
Crystal Reports User’s Guide 57

Quick Start
4
Quick start for new users
Adding additional fields
Next, you will insert two additional fields in the report. This time, however, you
will use the Ctrl-click combination to add them at the same time.
1. Highlight the City field in the Field Explorer dialog box, press the Ctrl key on
2. Drag the fields to place them.
3. Place the fields to the right of the Customer Name field.
To add additional fields
your keyboard, and then highlight the Country field. Release the Ctrl key.
If you scroll through the field list, you will notice that both fields remain
selected.
Note: Using the Ctrl-click combination allows you to select a non-
continuous range of fields. The Shift-click combination can be used to
select several fields from the list that are contiguous.
As the cursor is moved over the report, an object frame appears along
with the Arrow cursor.
Both fields appear in the Details section of the report in the same order in
which they are listed in the Field Explorer dialog box.
Selecting fields
When a field is selected, the object frame appears with a handle (box) on its
right, left, top, and bottom edge. These handles indicate that the field is
selected, and therefore active. To do anything with a field (change the font,
move it, and so on), you first have to select it:
• Position the cursor inside the object frame and click once. The handles
appear, indicating the object is selected.
• Move the cursor away from the object frame and click in an empty part of
the window. The handles disappear.
That’s all it takes to select and deselect objects.
Resizing fields
To resize the field, follow these steps:
1. Click the Customer Name field in the Details section to select it.
2. Press the Ctrl key and click the field heading to select both objects.
3. Move the cursor over the resizing handle on the right edge of the fields
until the cursor turns into a Resizing cursor.
4. Resize the fields to the right until they are approximately two inches in length.
58 Crystal Reports User’s Guide
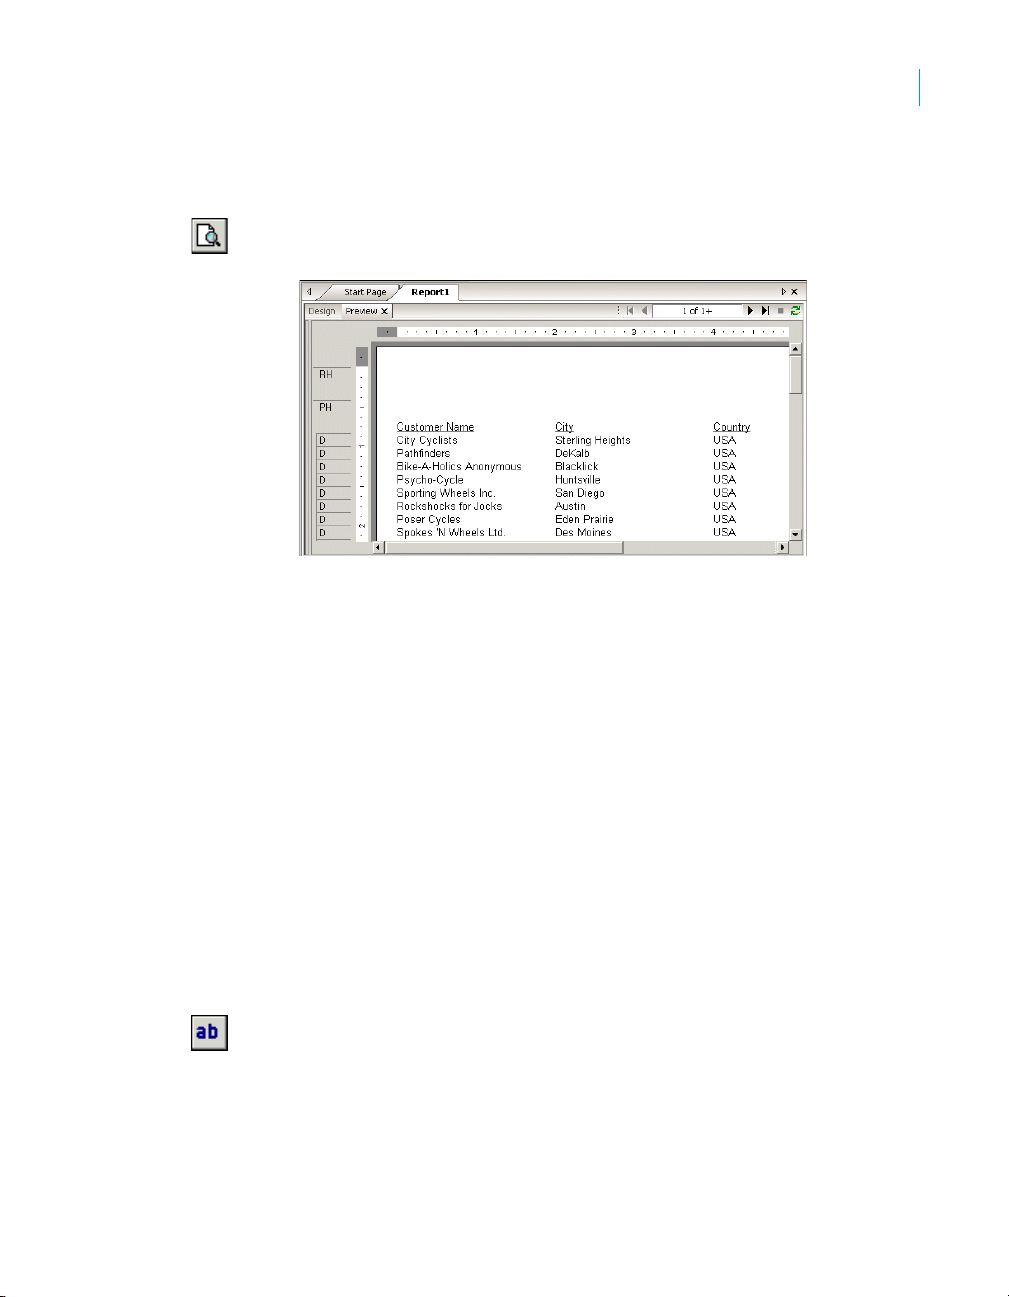
Reviewing your work
Now let’s see how the report looks with three fields placed and positioned.
1. Click Print Preview on the Standard toolbar to activate the Preview tab.
The screen should look similar to this:
Note: The first time you preview a report, you must click Print Preview
on the Standard toolbar to activate the Preview tab. The Preview tab
appears to the right of the Design tab. You can then switch between
designing and previewing the report by clicking the corresponding tab.
You have the beginnings of a customer list report, but you still have
several fields to add.
2. When you are finished reviewing the report, return to the Design tab by
clicking it.
Quick Start
Quick start for new users
4
Combining database fields in a text object
Instead of adding the Contact First Name and Contact Last Name fields as
separate objects, you can insert both fields in a text object. This allows you to
control the formatting of both fields by making changes to only one object.
When you insert fields in a text object, the fields are automatically trimmed
(they do not have any extra white space on either side). This is important
because a field is a fixed size but the data in the fields can vary in size,
leaving various amounts of unwanted white space.
To combine fields in a text object
1. Click Insert Text Object on the Insert Tools toolbar. As you move the
cursor over the report, an object frame appears next to it.
2. Insert the field to the right of the fields in the Details section.
As you drag the field, the Design tab automatically scrolls to the right, if
necessary. When you click to place the object, a text object appears and
the horizontal ruler of the Design tab changes to a ruler/tab selector that
Crystal Reports User’s Guide 59

Quick Start
4
Quick start for new users
is used for editing the text object. If you click an empty area of the report
or a field object, the standard Design tab ruler appears.
3. Click once on the border of the text object to select it for resizing. Handles
appear on all sides of the object.
4. Move the cursor over the right sizing handle of the text object and
increase the width by about 1 inch. You may need to scroll to the right
and continue resizing.
5. Double-click inside the text object to select it for editing. Notice the
insertion point is now flashing within the text object.
6. Select the Contact Last Name field in the Field Explorer dialog box.
Remember, you can move the Field Explorer dialog box by dragging and
dropping it by its title bar.
7. Drag the field to the text object.
8. Move the cursor over the text object until the cursor becomes a Drag and
Drop cursor.
9. Release the mouse button to place the field in the text object. The cursor
now appears after the Contact Last Name field, within the text object.
10. Type a comma and a space after Contact Last Name.
11. In the Field Explorer dialog box, highlight the Contact First Name field.
12. Drag the field to the text object.
13. Move the cursor over the text object until the cursor becomes a Drag and
Drop cursor. Move the cursor to the right of the comma and space you
just typed, and release the mouse button. The field will be inserted to the
right of the comma and space.
14. Click the Preview tab to look at the fields you just placed.
The report should now look similar to this:
60 Crystal Reports User’s Guide

Adding summary information
The next step is to add summary information to your report. Adding summary
information allows you to specify the author, title, and subject of the report, as
well as any keywords or comments related to the report. When you add
summary information, users can find information related to the report quickly.
To add summary information
1. On the File menu, click Summary Info.
The Document Properties dialog box appears with the Summary tab
active.
Quick Start
Quick start for new users
4
Adding a title
2. Enter information about your report in the text boxes provided. Be sure to
enter the title “Customer List” in the Title text box. This information will be
used in the next section of the tutorial.
3. Click OK when finished.
As you can see, the report looks incomplete without a title. Although you can add
a title using a text object, you can also tell the program to take the title information
directly from the Title text box in the Document Properties dialog box.
To add a title
1. Click the Design tab.
2. In the Field Explorer, scroll down to Special Fields and expand it.
3. Choose Report Title.
4. Drag the cursor over the report. An object frame appears.
Crystal Reports User’s Guide 61

Quick Start
4
Quick start for new users
Formatting objects
5. Position the object frame in the upper left-hand corner of the Page
Header (PH) section of the report and release the mouse button to place
the object.
6. Click the Preview tab or Refresh to review your changes.
The report title object now displays the title that you entered in the Title text
box of the Document Properties dialog box.
Now you can format the report title. This time, however, you will remain in the
Preview tab to do the work. This will make it easier to see your work while you
are formatting the title.
To format an object
1. To center the title, you will first need to expand the Title field so that it’s
about the same width as the data in your report. To do this, select the
object by clicking it.
2. Position the cursor on the right edge of the object until the cursor turns
into a Resizing cursor. Drag the right edge of the field box until it is even
with the right edge of the data in the Contact Name field object.
You have created a large field that extends from the left edge to the right
edge of the report.
3. With the report title object still selected, click Align Center on the
Formatting toolbar. The title is centered within the object.
4. Right-click the object and choose Format Field from the shortcut menu.
5. When the Format Editor appears, click the Font tab.
6. Set the report title to a larger, bolder version of the active font by selecting
Bold from the Style list and 16 (or a point size suitable to the font you are
using) from the Size list.
7. Change the color of the text by selecting Maroon from the Color palette.
Notice that the Sample box shows an example of how the text will look.
8. Click OK when finished.
9. Resize the report title object vertically to accommodate the increased
size of the title.
The title is now formatted to stand out on the report.
62 Crystal Reports User’s Guide

Adding a field heading
As you can see, the Contact Name field is the only field without a heading. In
this section you will create a heading.
To add a field heading
1. Click Insert Text Object on the Insert Tools toolbar.
2. Insert the text object in the Page Header section directly above the
Contact Name field.
3. Click Underline on the Formatting toolbar, and then type
into the text object.
4. Click your cursor outside the text object.
The Contact Name field now has a heading that looks just like the other field
titles.
Quick Start
Quick start for new users
Contact Name
4
Saving the report
1. Click Save on the Standard toolbar to save your work.
2. Type Custlist.rpt in the File name box and click Save.
3. Click the Preview tab to view the report.
Since this is the first time you are saving the report, the Save As dialog
box appears displaying the default directory where the file will be saved.
Notice that a default file name, based on the report title you defined
earlier, is also displayed.
Your report is saved to the default directory or another directory you chose.
Crystal Reports User’s Guide 63
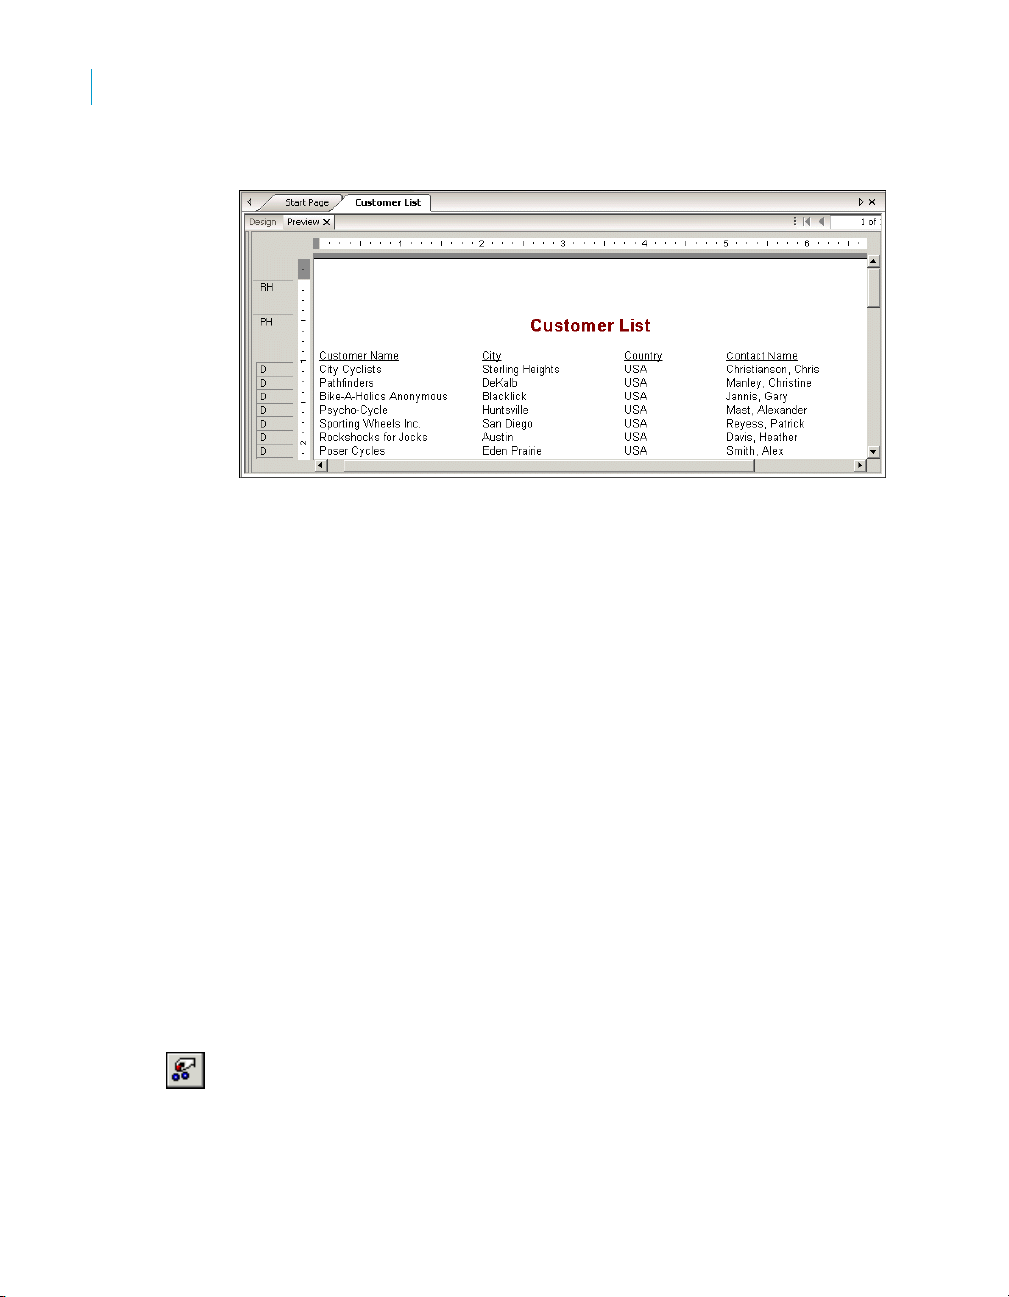
Quick Start
4
Quick start for new users
Record Selection
The report should now look similar to the following:
Congratulations! You have just created a basic listing report. You will continue
to refine this report throughout the rest of this tutorial.
Crystal Reports allows you to limit or restrict the records that are to be
included in a report. In this section you will learn how to:
• Select the records you want included in the report.
• Save a report, including the selection criteria.
For example, it may be useful to have a customer list that only lists customers
from the USA. The sample data contains records from the United States and
International customers. It is easy to restrict lists like this using the Select
Expert.
Entering the selection criteria
When you scroll through the report, you will see that it contains information for
customers from many different countries. In this step, you will limit the number
of countries displayed to the USA.
To enter selection criteria
1. To begin, click the Design tab to return to design mode.
2. Click an empty area of the report to make sure all fields are deselected.
3. Click Select Expert on the Expert Tools toolbar.
64 Crystal Reports User’s Guide

Quick Start
Quick start for new users
The Choose Field dialog box appears.
This dialog box lists all the fields currently in the report in the Report
Fields section and then lists all fields that are available from each table in
the database fields section.
4. Since you are going to base record selection on the country field, select
Country in the Fields list and click OK.
The Select Expert appears.
4
Imagine that you are completing the following sentence:
Select all records where a customer’s country is
You complete the sentence with the condition you want the program to
use when selecting records for your report. Right now the condition is any
value, which implies there is no restriction on the record selection.
5. Click the arrow on the operators box to see what other options you have.
Since you want only those records where the Country is USA, select the
is equal to condition.
A new box appears on the right. The dialog box sentence now reads:
Select all records where a customer’s country is equal to
All that you need to complete the sentence is the value USA.
Crystal Reports User’s Guide 65
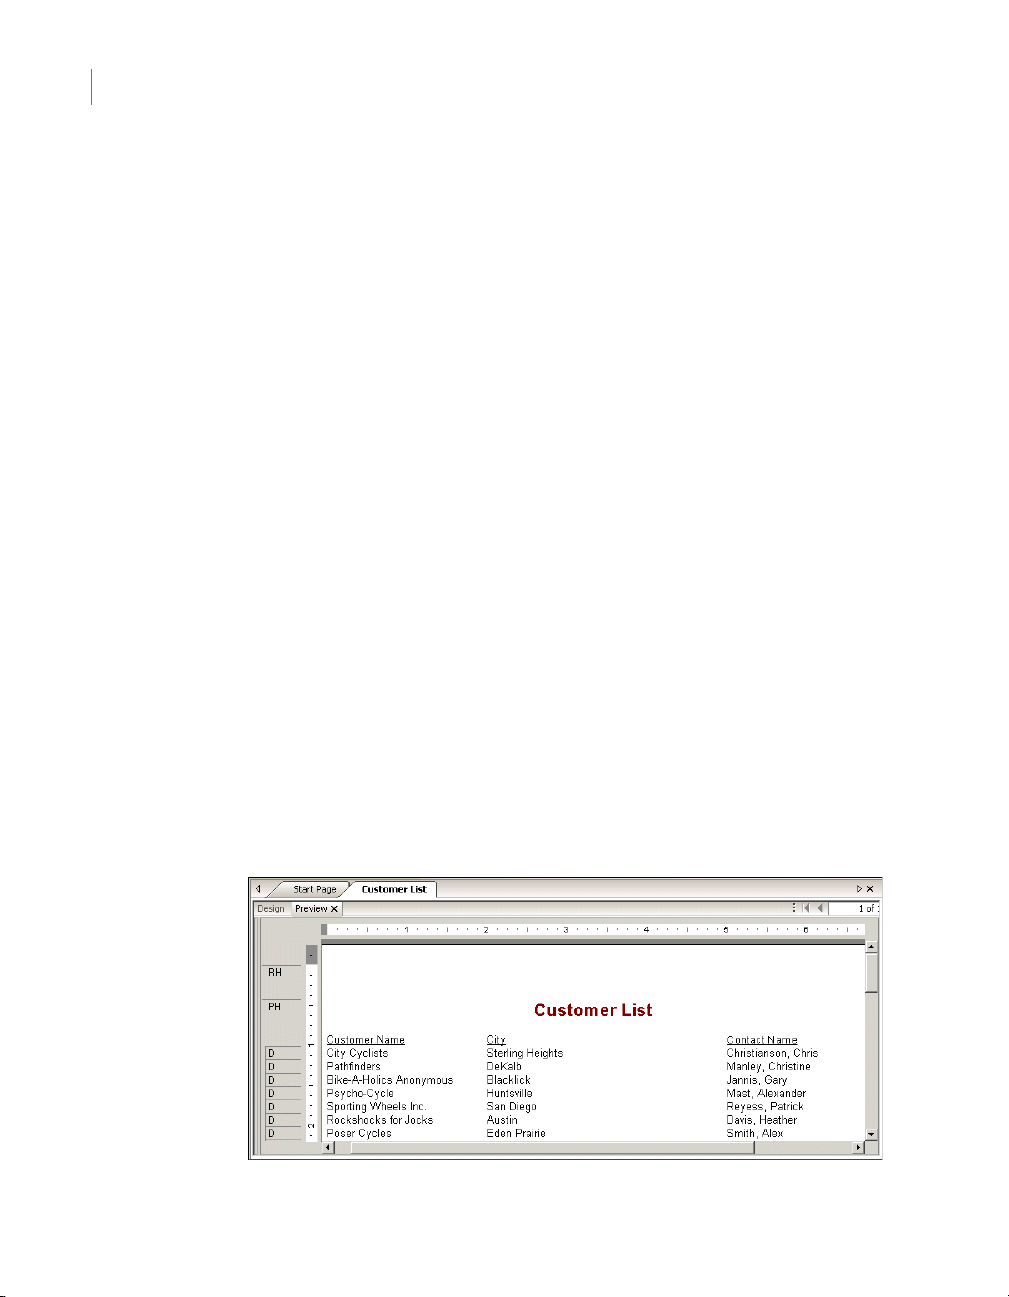
Quick Start
4
Quick start for new users
Deleting a field
6. Click the arrow on the empty list. A list of all the country values appears.
Select USA from the list.
The sentence now reads:
Select all records where a customer’s country is equal to USA
7. Click OK to return to the Design tab.
8. Click the Preview tab to review the results of your work.
The Change In Record Selection Formula dialog box appears.
9. Click Refresh Data.
10. Save this version of the report without overwriting the original report by
choosing Save As from the File menu and giving the new report the
name USA.rpt.
Congratulations! You have started formatting your report and have added
selection criteria to it. More than that, you have learned how to manipulate
your data. By now, you have a good idea of the powerful kinds of reports you
can prepare.
Now that the report contains only records from the USA, displaying the
Country field in the body of the report is not necessary. You can delete this
field before continuing.
To delete a field
1. Select the Country field and the Country column heading using the Ctrl-
click combination.
2. Press Delete on your keyboard.
That is all it takes to delete fields from the report.
The report should now look similar to this:
66 Crystal Reports User’s Guide
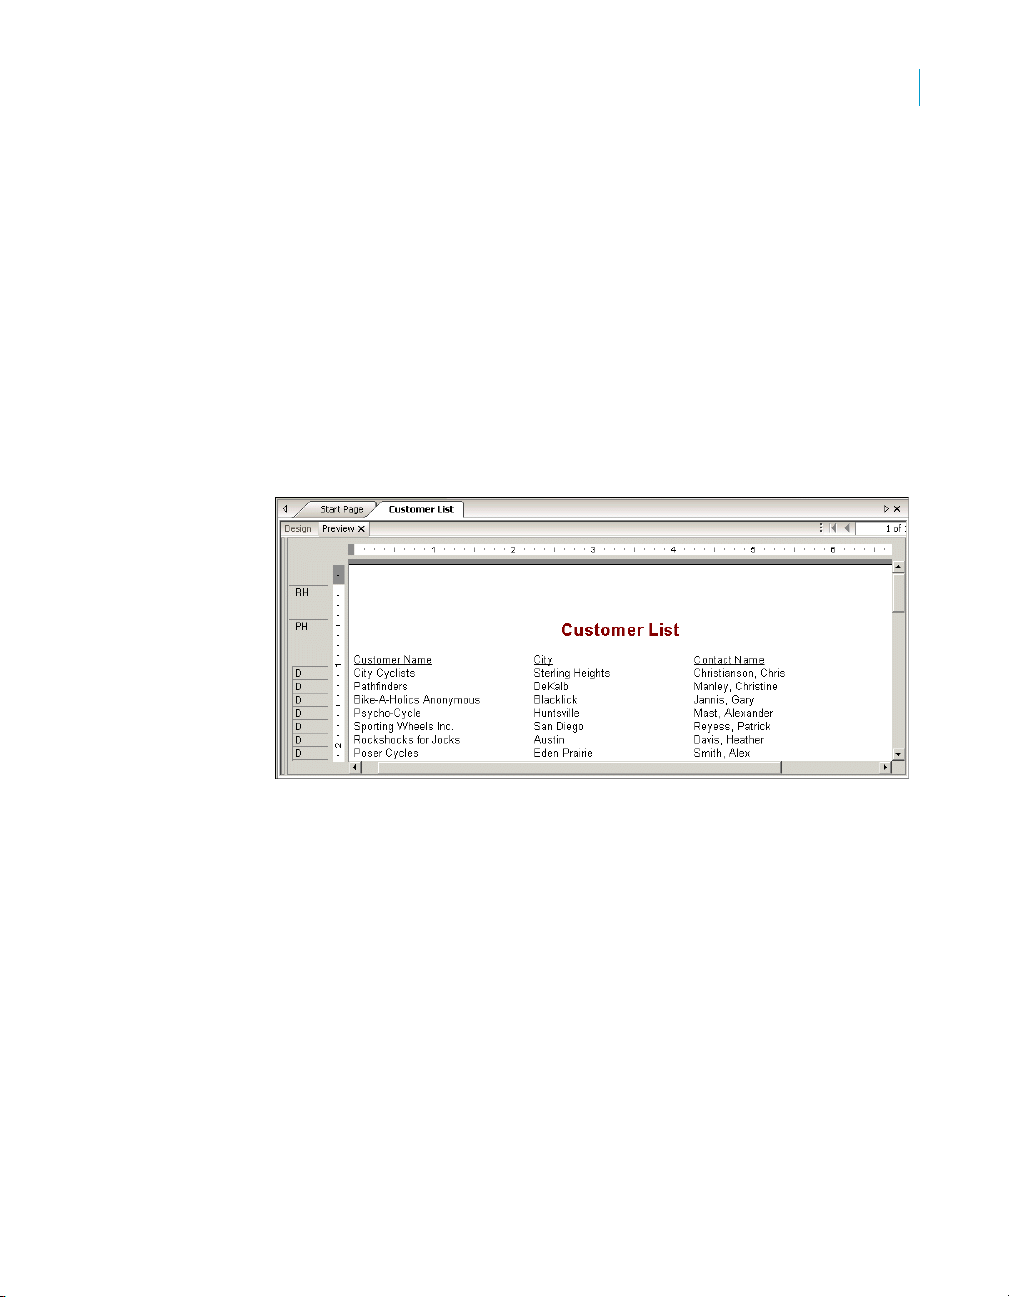
Balancing field spacing
Now that the Country field has been deleted, there is a large amount of white
space between the City and Contact Name fields. You might be satisfied with
the spacing as it stands, but it might be more readable if the columns were
better balanced across the page.
To balance field spacing
1. Return to the Design tab. Select the Contact Name field and its field
heading by using the Ctrl-click combination.
2. Place the cursor over one of the two highlighted text objects and drag
them to the left, closer to the City field.
3. Click the Preview tab and review your work again.
The report should look similar to this:
Quick Start
Quick start for new users
4
The spacing between the fields is much better, but it looks as if the report
title is off-center.
4. Click the report title object to select it.
5. Position the cursor on the right handle of the object until the cursor turns
into a Resizing cursor. Drag the right edge of the object frame until it is
even with the right edge of the data in the Contact Name field object.
The report title automatically centers itself based on the size of the object.
Crystal Reports User’s Guide 67
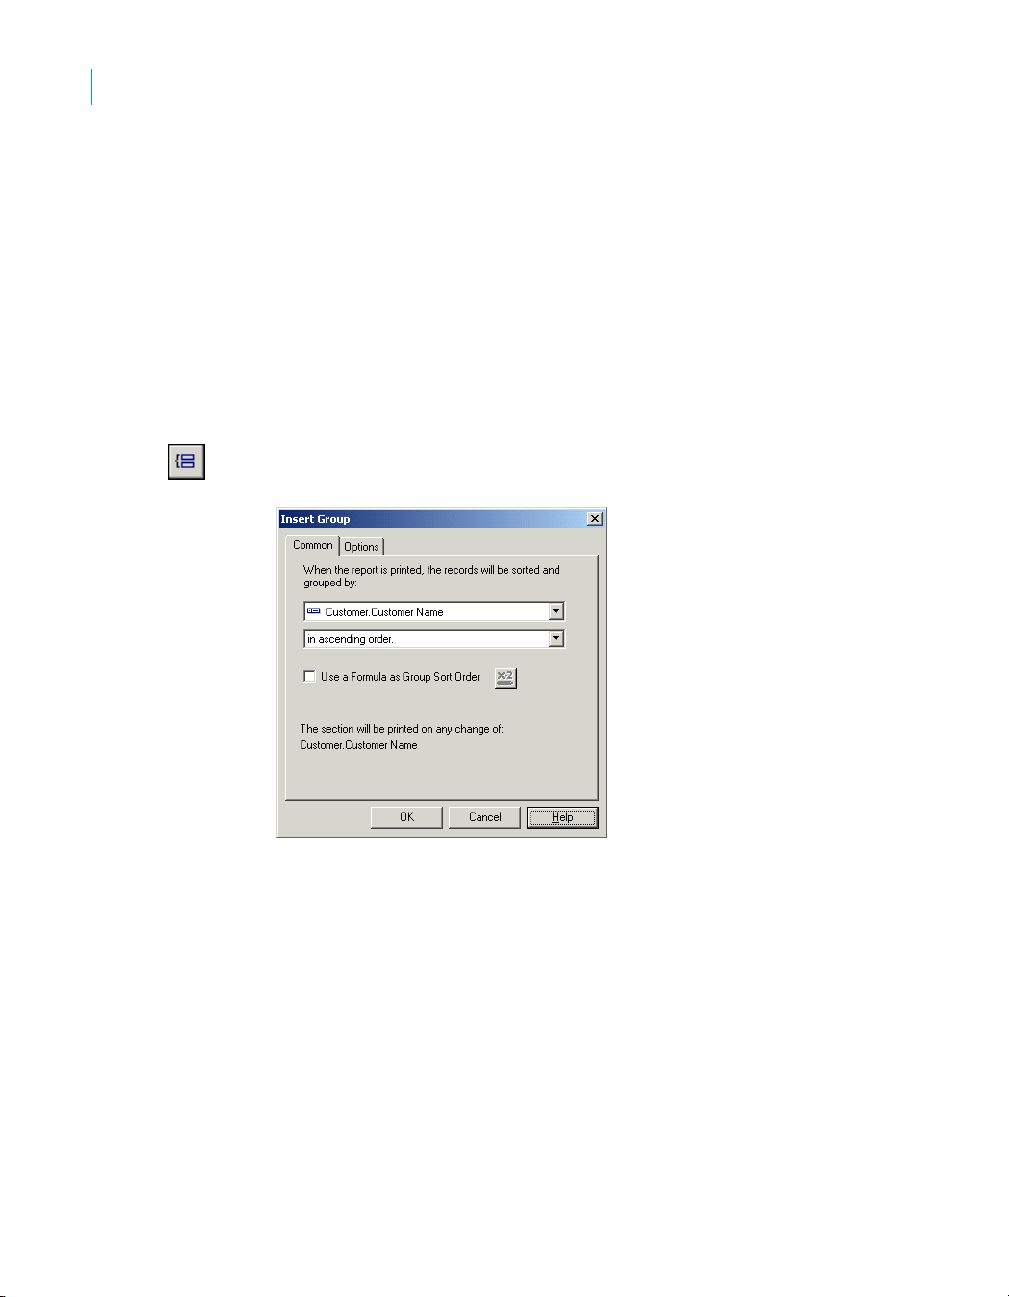
Quick Start
4
Quick start for new users
Grouping and sorting
Data in reports can be grouped and sorted in a variety of ways. Sorting and
grouping tools provide a great deal of flexibility for customizing reports.
Grouping the report
In many reports you need to break the data into groups in order to make it
easier to read and to understand. Crystal Reports lets you do this easily. For
this customer list, you will group the customers by region and then sort the
customers alphabetically within each group.
To group a report
1. While on the Design tab, click Insert Group on the Insert Tools toolbar.
The Insert Group dialog box appears.
2. Select Region from the Customer table in the first drop-down list.
The program takes all records with the same value in the region field and
places them together in a group on the report.
3. Select in ascending order from the second drop-down list.
The region grouping will be displayed on the report in alphabetic
ascending order.
4. Click OK.
Notice that two new sections now appear in the Design tab: GH1 (Group
Header #1) and GF1 (Group Footer #1). This is how the program shows
that the report has been grouped.
5. Click the Preview tab to see what the report looks like.
68 Crystal Reports User’s Guide
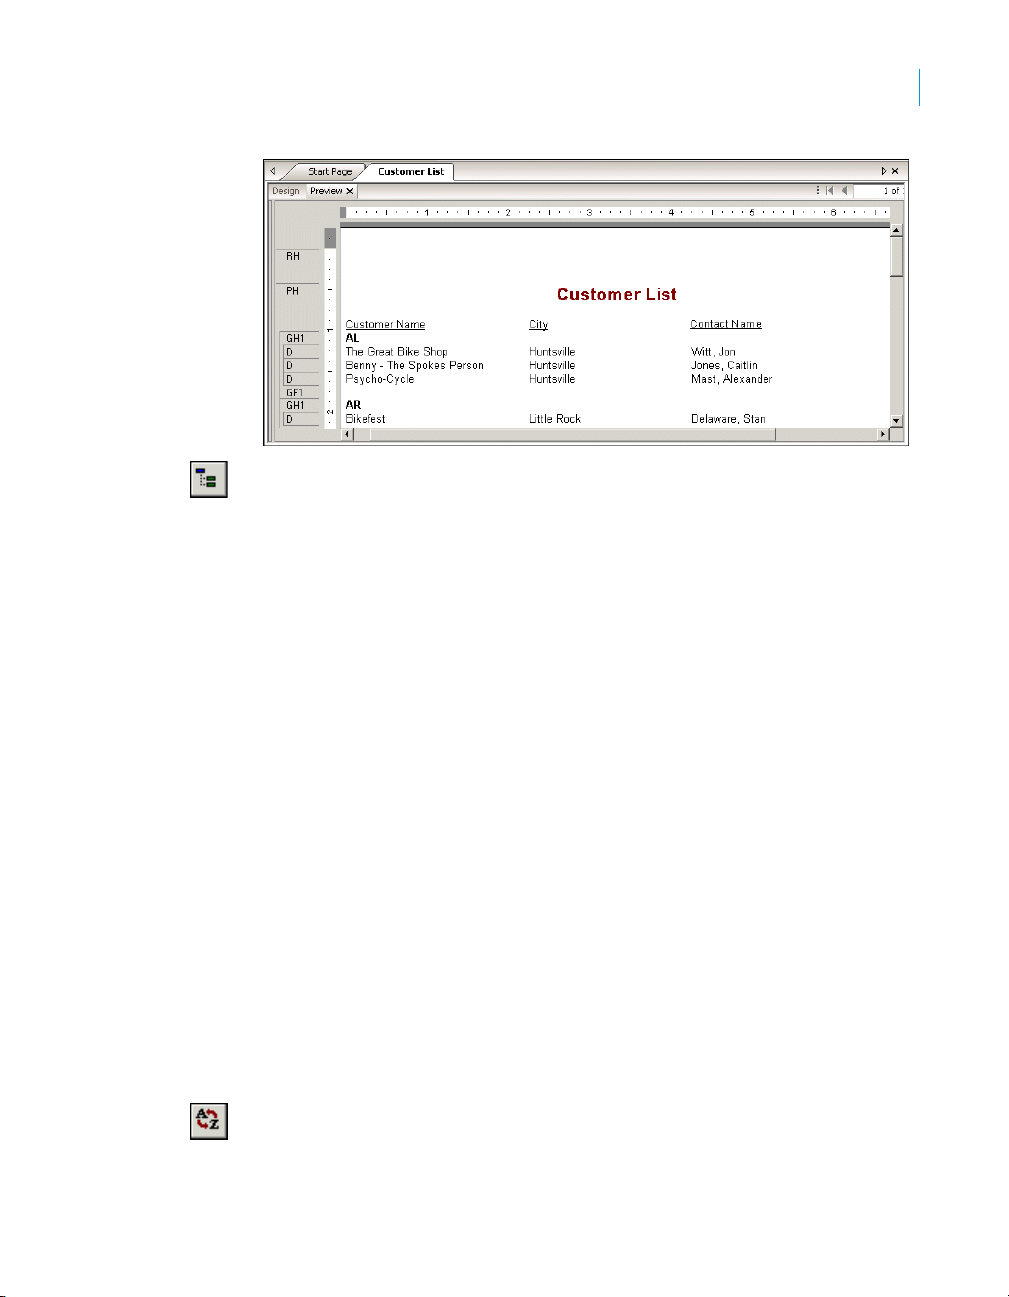
Quick Start
Quick start for new users
6. If the group tree is not visible, select Toggle Group Tree on the Standard
toolbar to see the groups included in the report.
You can view the group of interest by clicking on the group name in the Group
Tree. For example, to see the Texas customer group, click TX in the Group
Tree. The program jumps to the Texas group, displaying that group in the
Preview tab. The Group Tree allows you to quickly jump to a specific group of
interest instead of scrolling through the report looking for the group. For more
information on the group tree, see “Group Tree view” on page 96.
Note: For many reports, you will want to insert summaries, subtotals and
grand totals. For example, when creating a sales report rather than a
customer list, you would want to calculate the total sales amount for each
region. See “Sorting, Grouping, and Totaling” on page 171.
4
Understanding “live” group headers
When a group is inserted, a group name field is automatically inserted in the
Group Header section of the report. The group name field displays the current
group’s name. For example, if you group by region, and preview the report,
the group header for the CA (California) group shows “CA.”
The group field name is automatically formatted to stand out from the records
in the group.
Sorting records
In a typical customer list report, customer names are listed alphabetically. In this
example, you will sort the customer names alphabetically within each region.
To sort records
1. While on the Preview tab, click Record Sort Expert on the Expert Tools
toolbar.
Crystal Reports User’s Guide 69
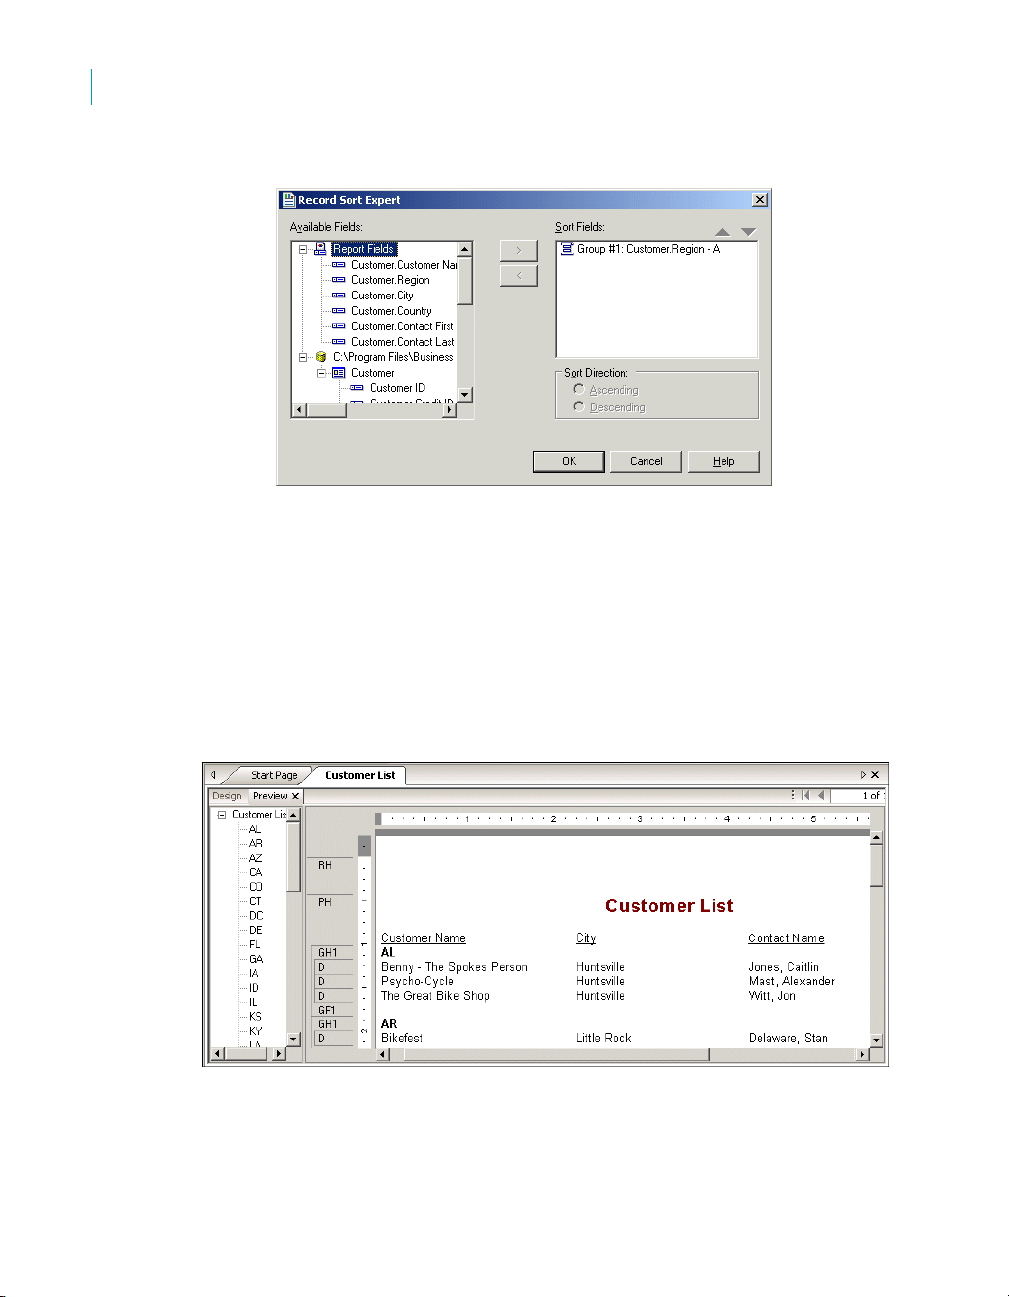
Quick Start
4
Quick start for new users
The Record Sort Expert appears.
The Available Fields list box displays all fields currently on your report
and all the fields in the data source. You can choose to sort based on any
of these fields.
The Sort Fields list box displays the fields that are already sorted in the
report. Since the region field has already been sorted, the sorting you are
about to do will be within each region, and not for the entire report.
2. Highlight the Customer Name field and click the > arrow button to add it
to the Sort Fields list.
3. Select Ascending for the Sort Direction and click OK. The report should
now look similar to the following:
Notice that the records within each group are in alphabetic order.
70 Crystal Reports User’s Guide
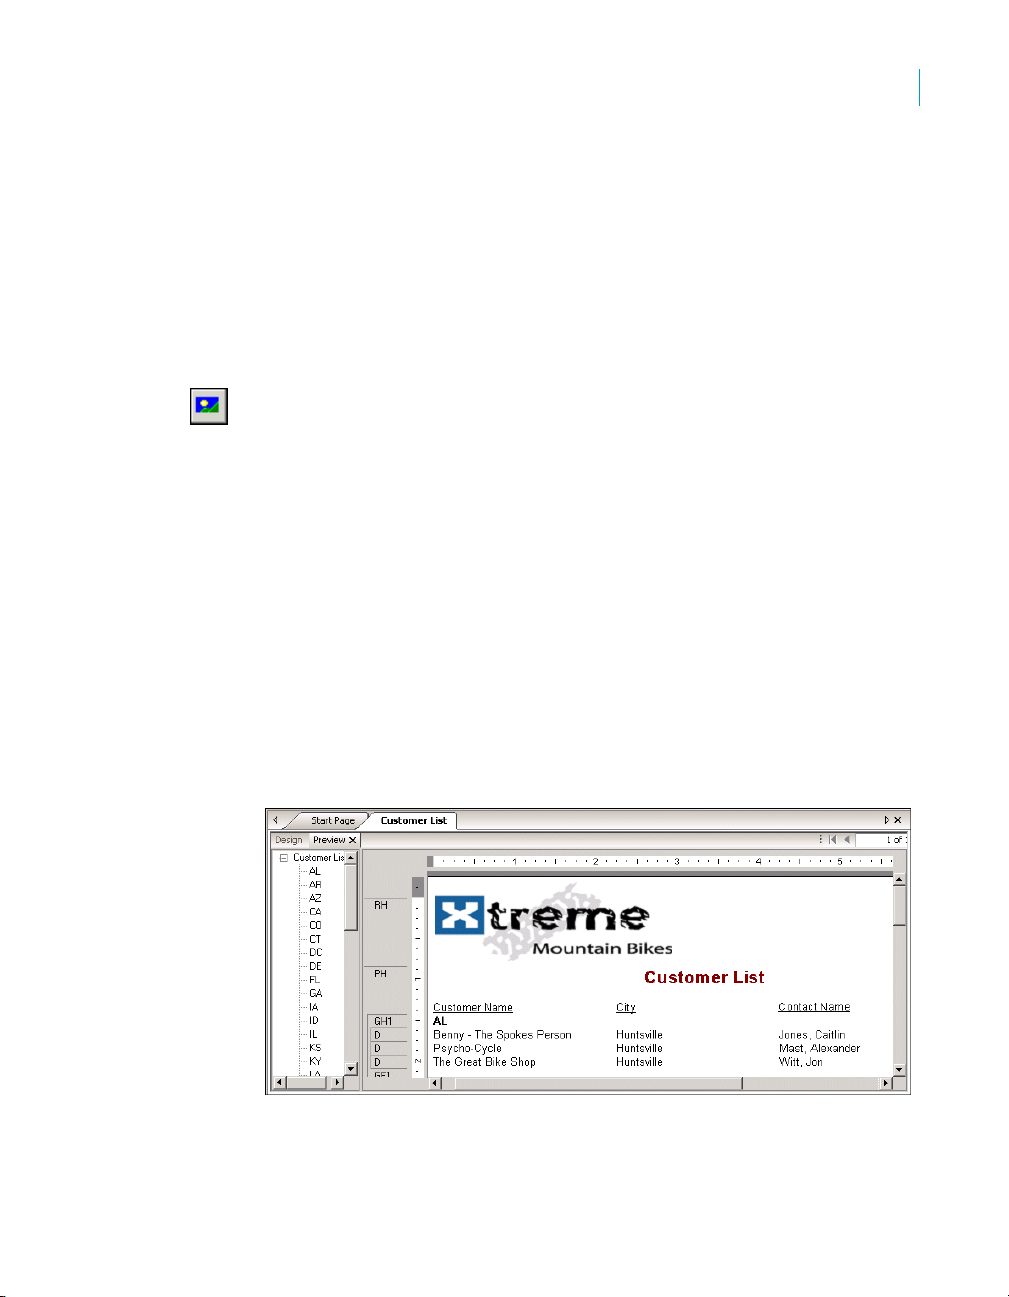
Completing the report
You have just one step left to complete the report. A company logo needs to
be added to the first page of the report.
Inserting a company logo
In this section, you will place a company logo at the top of the first page of the
report.
To insert a company logo
1. While on the Design tab, click Insert Picture on the Insert Tools toolbar.
The Open dialog box appears.
2. Choose a bitmap logo (.bmp) file and click Open.
An object frame appears as you move the cursor over the report. The
object frame represents the logo you will place.
3. Position the object frame in the upper left-hand corner of the Report
Header (RH) section of the report and click once to place it.
Placing the logo in the Report Header (RH) section ensures that the logo
is printed only on the first page of the report.
Note: Although there does not appear to be enough room in the Report
Header (RH) section when you place the graphic, the section will
automatically expand to accommodate the picture.
4. Click the Preview tab to view the report.
The final report should look something like this (with the logo that you
chose in step 2):
Quick Start
Quick start for new users
4
5. Save the report by clicking Save on the Standard toolbar.
You have just completed your first report.
Crystal Reports User’s Guide 71

Quick Start
4
Quick start for advanced users
Related topics:
• For information about distributing reports (printing, exporting, and so on)
see the printing topics in “Formatting” on page 235 and “Printing,
Exporting, and Viewing Reports” on page 385.
Quick start for advanced users
If you are an experienced Windows user who wants to get right into the
program, follow these steps to set up a report for the first time.
If you’re not an experienced user, check the “Quick start for new users” on
page 52.
To choose a report type and data source
1. In Windows, click Start > Programs > BusinessObjects XI Release 2 >
Crystal Reports, and then select Crystal Reports XI Release 2.
2. Click Blank Report to open the Database Expert dialog box.
As an alternative to creating a blank report, you can choose one of four
Report Creation Wizards.
After choosing a wizard, you can build your report on a variety of data
sources.
3. Browse through the contents of the Database Expert to find the data
source you want to use for your report.
4. Select a table you want to use in your report and click the > arrow to add
it to the Selected Tables list.
5. After you have added all the tables you want to work with, click OK on the
Database Expert.
Note: If you select more than one table in the Database Expert dialog
box, the Links tab appears. For more information on linking, see “Linking
multiple tables” on page 100.
The Design tab appears with Report Header, Page Header, Details,
Page Footer, and Report Footer areas. A report is created by inserting
and formatting items in each of these areas.
Note: To use additional database tables for a report and match them up on a
record-by-record basis, click Database Expert on the Expert Tools toolbar,
select the table(s), and then set up the links on the Links tab when it appears.
72 Crystal Reports User’s Guide
Quick Start
Quick start for advanced users
To work with report elements on the Design tab
1. Each of the default report areas contains a single section. To add
additional sections, click Section Expert on the Expert Tools toolbar and
use the Section Expert to add the desired sections.
Once you have added sections to an area, you can move, merge, and
delete them in the Section Expert. See “Designing with guidelines” on
page 251.
2. To turn the grid on or off, choose the Options command from the File
menu and select or clear the Grid check box in the Design View area of
the Layout tab when the Options dialog box appears. See “Using the grid”
on page 249.
3. If you are working with the grid off and you want to use snap-to guidelines
for positioning objects, click the top or left ruler wherever you want
guidelines to appear.
Some further ways you can use guidelines:
• Drag a field to a guideline until it snaps to the guideline.
• Drag the guideline arrow to move the guideline (and any objects that
are snapped to it).
• Drag the guideline arrow away from the ruler to remove the
guideline. See “Designing with guidelines” on page 251.
4. If the Field Explorer dialog box is not visible, click Field Explorer on the
Standard toolbar.
Expand the Database Fields node to display a list of fields. To speed the
entry of multiple fields, this box will remain on-screen until you close it.
This dialog box can be moved to a new location or resized, if you wish.
See “Placing data on the report” on page 102.
5. Select the field(s) you want to appear on the report.
You can select and place them one at a time, or use the Shift-click
combination to select a number of contiguous fields, or the Ctrl-click
combination to select fields from the list at random. Drag and drop is also
active. Place the fields in the Details section where you want them to appear.
When you place multiple fields, they appear in the same order that they
appear in the Field Explorer dialog box. The program marks the position of
each field with a rectangular frame. The characters in the frame indicate
whether the field is text (XXX...), number (555...), currency ($555...), date
(12/31/99), time (00:00:00), DateTime (12/31/99 00:00:00), or Boolean (T/F).
4
Crystal Reports User’s Guide 73

Quick Start
4
Quick start for advanced users
Note:
• The field names and field types can be viewed by selecting the Show
Field Names check box on in the Options dialog box (Layout tab).
• The program automatically places field titles in the Page Header
section unless the Insert Detail Field Headings check box is not
selected in the Options dialog box (Layout tab).
• If additional Details sections are added to the report, field titles will
only be placed in the Page Header section for fields in the Details A
(the original) section of your report.
6. Once the objects are in place, you may want to adjust the report sections.
To do this, right-click the shaded area to the left of the section ruler and
use the shortcut menu that appears:
• To expand a section to accommodate an additional line, choose the
Insert Line command.
• To have the program automatically align the objects in the section
horizontally, choose the Arrange Lines command.
• To reduce the size of a section to eliminate unnecessary white space
above and below objects, choose the Fit Section command. See
“Using white space between rows” on page 271.
7. To generate a report title, you must first enter the title in the Document
Properties dialog box. On the File menu, click Summary Info. Enter a
title in the Title text box of the Document Properties dialog box. Click OK.
8. Choose Report Title from the Special Fields list in the Field Explorer. A
rectangular placement frame appears when you move the cursor over
your report. Click once in the Report Header (RH) section to place the
report title. The report title field contains the text that you typed in the
Title text box of the Document Properties dialog box. See “Adding a title
page to the report” on page 112.
9. To see how the results will print, click Print Preview on the Standard
toolbar.
To speed processing time while building a report, you can preview the
report using only a small subset of the available data. To do this, go to the
File menu, point to Print and then click Preview Sample. See “Preview
tab” on page 94.
In either case, the program takes you to the Preview tab. You can finetune a report in the Preview tab while viewing the results as actual report
data. You can also close the Preview tab and continue working on the
report in the Design tab.
74 Crystal Reports User’s Guide
Quick Start
Quick start for advanced users
To use other reporting features
1. If you want to format a field, change the placement or width of a field, or
insert a summary, click the field to select it. Handles appear on the top,
bottom, and sides of each selected field:
• To change the placement of the field(s), use the mouse to drag the
field placement frame to its new position.
• To change the width of the field, use the mouse to drag the right or
left handle.
• Right-click the field to format or to summarize it. A shortcut menu
appears listing commands for formatting and summarizing the field.
Tip: Many font and formatting options are available on the formatting
toolbar.
Note: To apply formatting only under certain conditions, click Conditional
Formula next to the formatting property in the Format Editor, and create a
formula that defines those conditions. See “Working with conditional
formatting” on page 273.
2. To create a formula that makes data calculations or comparisons, select
Formula Fields in the Field Explorer.
Note: You can also click Formula Workshop on the Expert Tools toolbar
to work with formulas, custom functions, SQL expressions, and so on.
3. Click New. The Formula Name dialog box appears. Enter a name for the
formula and click OK. The Formula Workshop appears with the Formula
Editor active.
4. Enter the formula in the Formula Editor. Enter fields, operators, and
functions by selecting them from their respective lists or by typing them
in. You can check the formula syntax by clicking Check.
5. When you are finished editing, click Save and close to return to the Field
Explorer dialog box.
6. Click Insert to Report to place the formula just like you would a database
field. See “Using Formulas” on page 419.
7. To insert a subreport (a report within a report), click Insert Subreport on
the Insert Tools toolbar and choose an existing report to import as a
subreport or use the Report Creation Wizard to create a new subreport.
See “Inserting subreports” on page 477.
If you want the records in a subreport to match up with the records in a
primary report, click the Link tab of the Insert Subreport dialog box and
specify the link when the tab appears. See “To link a subreport to the
data in the primary report” on page 480.
4
Crystal Reports User’s Guide 75

Quick Start
4
Quick start for advanced users
8. To insert a cross-tab object in a report, click Insert Cross-Tab on the
Insert Tools toolbar and set up the cross-tab in the Cross-Tab Expert
when it appears. See “Cross-Tab Objects” on page 331.
9. To create a parameter field (a field that prompts you for a value whenever
you retrieve data for a report), click Field Explorer on the Standard
toolbar, then select Parameter Fields in the Field Explorer dialog box
when it appears. Click New to set up a parameter field. Once created,
you can insert the parameter field in a report like a database field or
select it from the Fields list in the Formula Workshop.
Parameter fields can be used in reports (as title or label prompts), in
selection formulas (as selection criteria prompts), and in formulas (for a
variety of purposes including specifying sort fields). See “Parameter
Fields and Prompts” on page 441.
10. To add a chart, click Insert Chart on the Insert Tools toolbar. See
“Charting” on page 283.
11. To add a map, click Insert Map on the Insert Tools toolbar. See
“Mapping” on page 301.
12. To insert a spreadsheet, picture, or other OLE object that you can edit
from within the Report Designer using the tools from the object’s native
application, choose OLE Object from the Insert menu. See “OLE” on
page 319, and “Working with static OLE objects” on page 324.
13. To change the record sort order, click Record Sort Expert on the Expert
Tools toolbar. The Record Sort Expert appears. Highlight the field(s) you
want to use for sorting the report data and the sort direction. See “Sorting
single and multiple fields” on page 173.
14. To limit the report to specific records (for example, the records of
California customers who have year-to-date sales greater than $10,000),
click the first field on which you want your selection to be based and then
click Select Expert on the Expert Tools toolbar. When the Select Expert
appears, set up the record selection criteria.
15. To print the report, click Print on the Standard toolbar.
That’s it! It is that easy to build a report.
76 Crystal Reports User’s Guide

Report Design Concepts
chapter

Report Design Concepts
5
Basic report design
Basic report design
The purpose of this chapter is to suggest a structured approach to preparing
a Crystal report. This approach includes the following elements:
• Deciding on the content of the report.
• Developing a prototype on paper.
This section has been designed to provide a conceptual understanding of the
reporting process.
Deciding on the content of the report
Before you do anything else, you should outline the information you want the
report to provide. The following sections provide a guide to making that
outline.
Stating the purpose
What is the overall purpose of the report?
Reports are management tools. Their purpose is to help you quickly grasp the
essential elements and relationships found in raw data, to help you make
effective decisions. For a report to be effective, it has to present the correct
data in a logical way. If it presents the wrong data, or if it presents the right
data in a haphazard manner, the report may slow the decision-making
process or may even encourage incorrect decisions.
A good starting place in the development of a report is to write out the purpose
of the report in a sentence or two. The purpose statement helps you focus on
your primary needs, and it gives the report both a starting point and a goal.
Here are some examples of purpose statements.
• The purpose of this report is to show monthly and year-to-date sales by
sales representatives, compare this year’s numbers to last year’s, and
flag representatives whose sales figures do not meet company
standards.
• The purpose of this report is to show sales activity for each item in
inventory, and to suggest reorder quantities based on that activity.
• The purpose of this report is to calculate bowling averages and
handicaps for each member of the bowling league.
Defining the purpose of the report before you start is a critical step in the
overall process.
78 Crystal Reports User’s Guide

Who is going to read the report?
A single report is often used by many individuals. A detailed, company-wide sales
report, for example, may be used by sales representatives, the regional sales
manager, the national sales manager, and the Chief Operating Officer (COO).
These individuals will be interested in different aspects of the report:
• A sales representative will use the report to evaluate individual sales
performance and compare this performance to that of other
representatives in the region.
• The regional sales manager will use the report to evaluate regional
representatives and compare the region’s performance to that of other
regions.
• The national sales manager will use the report to evaluate the
performance of regional managers and compare overall sales to the
current sales forecasts.
• The COO will use the report to evaluate the performance of the Vice-
President of Marketing and the sales department as a whole, and to
project such things as manufacturing needs and warehouse locations.
Since each user of the report has different interests, it is important to plan the
report so it includes the information each user is looking for.
Report Design Concepts
Deciding on the content of the report
5
Determining the layout of the report
What is the report title going to be?
Write out a working title for the report. You may decide to change it later, but
at least you will have a title to use when creating the prototype report.
What identifying information is needed in the header and footer?
You may wish to include the print date, information on who prepared the
report, a block of text to describe the purpose of the report, the range of data
covered, or something similar. If you are going to include such information,
write it down so you can use it in preparing your prototype.
The information can come from a variety of sources, depending on the kind of
information you plan to use.
• Information on who prepared the report might be drawn from individual
data fields in the database table(s) used. If it is to be drawn from a
database table, what table? Or, what combination of tables?
• A block of text can be created as a text object and placed anywhere on
the report.
Crystal Reports User’s Guide 79

Report Design Concepts
5
Deciding on the content of the report
• Crystal Reports can generate information such as the print date or page
numbers.
Finding the data
What data do you want to use in the report?
Do you know the type of database you are reporting from? Will you be
reporting off a data file, SQL/ODBC, or another data source?
If you do not know, ask the database administrator in your organization for
help in setting up the database type and location of the data. For more
information, see Accessing Data Sources in the Crystal Reports Online Help.
Are you familiar enough with the data to find the necessary information?
When looking for a Customer Contact name, can the field be found in a
database table?
If not, your MIS professional, database administrator, or co-workers will have
to help you become familiar with the data.
What specific data should appear in the body of the report?
The body should contain all the data needed to fulfill the statement of purpose
you wrote for the report. It should also contain all of the data needed by the
various users that you have identified.
This step requires you to look at the available database table(s). Crystal
Reports allows you to combine data from different databases when you
create reports, so you have a great deal of flexibility in your work.
• Much of the data in a typical report is taken directly from data fields.
Which data fields will be used, and where are they located?
• Other data will be calculated based on data fields. Which data fields will
be used in the calculations?
• Still other data will be placed directly into the report using text objects
(headings, notes, labels, and so on).
Does the data exist or does it need to be calculated?
Some report information can be drawn directly from data fields (sales
information, for example); other information will have to be calculated based
on data field values (for example, sales commission, based on the
relationship of sales to quota). In your planning, it can be helpful to segregate
or flag data that needs to be calculated from that which can be used directly.
See “Specifying formulas” on page 423.
80 Crystal Reports User’s Guide

Report Design Concepts
Deciding on the content of the report
What types of fields contain data?
You should take the time to get to know the data type for data fields that will
be used in your calculations. Since formula functions and operators work with
specific kinds of data, it is important to recognize the data type you are
working with, before you start any calculations. For example, some functions
require numeric data, while others work with only string fields.
Manipulating the data
Do you want the data organized into groups?
How? By customer? By date? By hierarchy? Or by other criteria? Crystal
Reports provides several options for grouping data in a report. See “Grouping
data” on page 175.
Do you want the data sorted based on record or group values?
Crystal Reports gives you both alternatives. See “Understanding sort options”
on page 172.
Do you want the report to contain only specific records or groups?
Crystal Reports gives you the opportunity to base a report on all records in a
given database, or on a limited set of records from the database. Crystal
Reports can be used to select records based on simple date ranges or
comparisons, or to create complex formulas to identify the records to be
included. Take a few minutes to determine the records needed for the report
and list the criteria to be used for selecting those records. See “Selecting
records” on page 160.
5
Do you want to summarize the data?
Do you want to total, average, count, or determine the maximum or minimum
value included in all the values in any column on the report?
Crystal Reports allows you to do this, and it also allows the grand total (or the
grand total average, grand total count, and so on) to be placed at the bottom
of the selected column. See “Calculating a percentage” on page 201 and
“Selecting top or bottom N groups or percentages” on page 195.
What information should be flagged on the report?
You may want to call attention to some data by flagging it on the report. For
example, non-moving inventory items are often flagged on inventory reports
so they can be given special attention. You might want to flag each item that
Crystal Reports User’s Guide 81

Report Design Concepts
5
Deciding on the content of the report
has shown no activity during the last month, during the last three months, or
during some other defined period. To flag information, identify it and any
conditions that will trigger the flagging.
How do you want information flagged?
You may want to flag items with an asterisk or some other symbol, or you may
want a word to appear as a flag. In any case, you should write out flagging
instructions so they are handy.
Crystal Reports gives you the opportunity to underline report elements, and
change the font type, size, or color used for specific report items. It allows you
to put borders around items and to draw lines and boxes (to break the report
into sections), set off headings, and so on. All of these formatting tools can be
used to highlight key data on a report. See “Formatting” on page 235.
Determining printing area characteristics
Each report area has its own printing characteristics. It is important to
understand these characteristics because they affect when and how often
different report objects get printed.
In what order will the areas print on the report?
Areas print in the order they appear on the Design tab (top to bottom). If there
is more than one section in an area, the sections print in the order they
appear. For example, if you have three Report Header sections, all three of
those sections will print, in order, before the section(s) in the Page Header
area begin to print.
How often do report objects print?
The way objects print will determine how you design your report. This will help
you decide where to place charts, Cross-Tabs, and formulas to get specific
results.
Report Header
Objects placed in the Report Header area print once, at the beginning of the report.
• Charts and Cross-Tabs placed in this area contain data for the entire report.
Note: Both charts and Cross-Tabs can filter report data by using a Group
Sort; in such cases, the data shown in the chart or Cross-Tab is a subset
of the data for the entire report.
• Formulas placed in this area are evaluated once, at the beginning of the
report.
82 Crystal Reports User’s Guide

Report Design Concepts
Deciding on the content of the report
Page Header
Objects placed in the Page Header area print at the beginning of each new
page.
• Charts or Cross-Tabs cannot be placed in this section.
• Formulas placed in this area are evaluated once per page, at the
beginning of each new page.
Group Header
Objects placed in the Group Header area print at the beginning of each new
group.
• Charts and Cross-Tabs placed in this area contain data just for the group.
• Formulas placed in this area are evaluated once for each group, at the
beginning of the group.
Details area
Objects placed in the Details area print with each new record.
• Charts or Cross-Tabs cannot be placed in this area.
• Formulas placed in this area are evaluated once for each record.
Group Footer
Objects placed in the Group Footer area print at the end of each group.
• Charts and Cross-Tabs placed in this area contain data just for the group.
• Formulas placed in this area are evaluated once for each group, at the
end of the group.
5
Report Footer
Objects placed in the Report Footer area print once at the end of the report.
• Charts and Cross-Tabs placed in this area contain data for the entire
report.
Note: Both charts and Cross-Tabs can filter report data by using a Group
Sort; in such cases, the data shown in the chart or Cross-Tab is a subset
of the data for the entire report.
• Formulas placed in this area are evaluated once, at the end of the report.
Page Footer
Objects placed in the Page Footer area print at the bottom of each page.
• Charts and Cross-Tabs cannot be placed in this area.
• Formulas placed in this area are evaluated once per page, at the end of
each new page.
Crystal Reports User’s Guide 83

Report Design Concepts
5
Developing a prototype on paper
Developing a prototype on paper
While a paper prototype is useful regardless of your level of expertise with
Crystal Reports, it is particularly valuable when you are first learning the
program. With the paper prototype in hand, you can put your full effort into
learning and using the commands, rather than into trying to design and learn
at the same time.
To design a paper prototype
1. Get the same size paper you will be using for the finished report.
2. Position the title and other descriptive header information, using boxes or
lines to represent report elements.
3. Position the footer information.
4. Review the page layout for balance.
5. Look at the information you intend to include in the body of the report:
• Count the number of fields being used and estimate the appropriate
spacing between fields.
• Use rectangles to pencil in the fields within the estimated spacing.
• Change the spacing if you need to.
• Decide on a logical sequence for presenting the data in the body of
the report.
• Label the fields to indicate that sequence.
6. Use small boxes to indicate group values and totals.
7. Place random flags in the column where you want flags to appear.
8. Darken any elements you want highlighted to make them stand out from
the rest of the prototype.
9. Review the finished product for layout and balance, and make changes
as needed.
84 Crystal Reports User’s Guide
Introduction to Reporting
chapter

Introduction to Reporting
6
Report creation options
Report creation options
Each time you create a new report, you have three options:
• Use a Report Creation Wizard.
• Use another report as a model.
• Create a report from scratch.
You will probably use each option at some time.
Report Creation Wizards
The Report Creation Wizards help create reports as quickly as possible and
many new users and developers alike prefer to create the majority of their
reports using them. All you have to do is choose the wizard that most closely
matches your report type. The wizard walks you through the process of
creating reports step-by-step.
Another report
To build a new report based on one that already exists, another report can be
used as a model. Open the report you want to use in this way by selecting the
Open File option and save it to a new file using Save As (found on the File
menu). This method is useful to:
• Create a new report with a different grouping or different record selection
than that of an existing report.
• Reconstruct a report based on an earlier time period using the same
report structure used today.
• Create an entirely new report based on a set of databases that are linked
in another report. You can create a report and delete the fields without
disturbing the underlying links. Then, without relinking, you can build all
your new reports based on this report.
Crystal Reports also lets you format a report by applying a template. See
“Using a template” on page 236 for more information.
New report
The Blank Report option is used to create a report from scratch. This is useful
when you want the full flexibility and control of building a report from the
ground up, or when a report type is different from the many report types
available in the wizards.
86 Crystal Reports User’s Guide

Introduction to Reporting
Choosing data sources and database fields
The Blank Report option was chosen for the “Quick start for new users” on
page 52, because the process of creating a report from scratch most fully
illustrates the basics of reporting.
Choosing data sources and database fields
Crystal Reports makes it simple to select data sources and database fields by
providing easy-to-use functionality in the Database Expert dialog box and the
Field Explorer dialog box. Each of these dialog boxes uses the familiar
Windows tree structure to allow you to navigate through the possible choices.
The Database Expert
The Database Expert provides an integrated tree view of all data sources you
can use with Crystal Reports. In the Database Expert, you can select from the
following as a data source for your report:
• A currently connected data source.
• An SQL command that has been saved to the BusinessObjects
Enterprise Repository.
• A data source that has been added to your Favorites folder.
• A recently accessed data source (the Database Expert automatically
maintains a list of such data sources for you).
• An existing data source (for example, a data file residing locally, or an
ODBC data source that has already been set up).
In the Database Expert, you can also specify links between database tables
when you have selected more than one table for your report.
6
Data tab
Tree View
The Data tab of the Database Expert shows a tree view of possible data
sources you can select when creating a report. The tree—in the Available
Data Sources list—is made up of folders for:
• Current Connections
• Favorites
• History
• Create New Connection
• Repository
Crystal Reports User’s Guide 87

Introduction to Reporting
6
Choosing data sources and database fields
The Create New Connections folder contains subfolders for many popular
data sources. Among these, you’ll find:
• Access/Excel (DAO)
• Database Files
• ODBC (RDO)
• OLAP
• OLE DB (ADO)
Note: The data source options available in the Create New Connections
folder depend on the data access components selected during installation.
For a brief description of each of these folders and subfolders, see “Selecting
the data source” on page 98.
Shortcut Menu
You can right-click any item in the Available Data Sources list of the Database
Expert to see a shortcut menu with the following options:
• Add to Report
Use this option to add a table or stored procedure to your new report. This
option is also available by clicking the > arrow on the Database Expert.
• Add to Favorites
Use this option to add a selected data source to the Favorites folder.
• Remove from Report
Use this option to remove a table or stored procedure from your report. This
option is also available by clicking the < arrow on the Database Expert.
• Properties
Use this option to obtain detailed information on the selected item.
• Rename Favorite
Use this option to rename a data source in the Favorites folder.
• Delete Favorite
Use this option to remove a data source from the Favorites folder.
• Remove from repository
Use this option to delete an existing SQL command from the
BusinessObjects Enterprise Repository.
• Rename repository object
Use this option to rename an existing SQL command in the BusinessObjects
Enterprise Repository.
• Options
Use this option to set the global options that appear on the Database tab
of the Options dialog box.
88 Crystal Reports User’s Guide

• Refresh
Use this option to refresh the list of available data sources in the
Database Expert.
Links tab
Database tables are linked so records from one database match related
records from another. For example, if you activate a Suppliers table and a
Product table, the databases are linked so that each product (from the
Product table) can be matched up with the supplier (from the Supplier table)
that made the product.
The majority of reports will probably require data from two or more tables, so
linking will be necessary. The process of linking is made easy by using the
Links tab of the Database Expert. See “Linking tables” on page 493.
The Field Explorer
Use the Field Explorer dialog box to insert, modify or delete fields on the
Design and Preview tabs of Crystal Reports. To see the Field Explorer, select
the Field Explorer command from the View menu.
Tree View
The Field Explorer shows a tree view of database fields and special fields that
you can add to your report. It also shows formula fields, SQL expression
fields, parameter fields, running total fields, and group name fields that you
have defined for use in your report.
Fields that have already been added to the report, or fields that have been
used by other fields (such as formula fields, groups, running total fields,
summaries, and so on) have a green check mark next to them.
Introduction to Reporting
Choosing data sources and database fields
6
Toolbar and Shortcut Menu
The Field Explorer’s toolbar provides buttons with tool tips and hot-key
combinations. You can right-click any item in the tree view to bring up a
shortcut menu.
The toolbar offers these functions:
• Insert to Report
Use this option to add a field to the report. You can insert more than one
field at a time by selecting multiple fields, right-clicking, and choosing
Insert to Report.
Alternatively, to insert a field, you can drag and drop it in the Design or
Preview tabs.
Crystal Reports User’s Guide 89

Introduction to Reporting
6
Choosing data sources and database fields
• Browse
Use this option to browse data for a database field, formula field or SQL
expression field.
Note: On the shortcut menu, this option is called Browse Data.
• New
Use this option to create a formula field, SQL expression field, parameter
field or running total field.
• Edit
Use this option to modify an existing formula field, SQL expression field,
parameter field or running total field.
• Duplicate
Use this option to make a copy of the formula that you have selected in the
Field Explorer. When the copy is created, you can rename it and edit it.
• Rename
Use this option to modify the name of an existing formula field, SQL
expression field, parameter field or running total field.
• Delete
Use this option to remove a formula field, SQL expression field,
parameter field or running total field. You can also select multiple fields,
right-click, and choose Delete to remove them all at once.
The shortcut menus for the fields in the Field Explorer offer additional
functions that are not on the toolbar, including the following options:
• Find in Formulas
Use this option to find occurrences of the selected item throughout all of
the formulas in your report.
• Set Prompt Order
Use this option to open the Set Prompt Order dialog box, in which you
can change the prompt order of your parameter fields.
• Show Field Type
Use this option to see the field type (string, number, and so on) when
you’re looking at a list of database fields. The length of string fields is
included in brackets at the end of their names.
• Sort Fields Alphabetically
Use this option to display table fields in alphabetical order (instead of the
order they appear in the table).
90 Crystal Reports User’s Guide
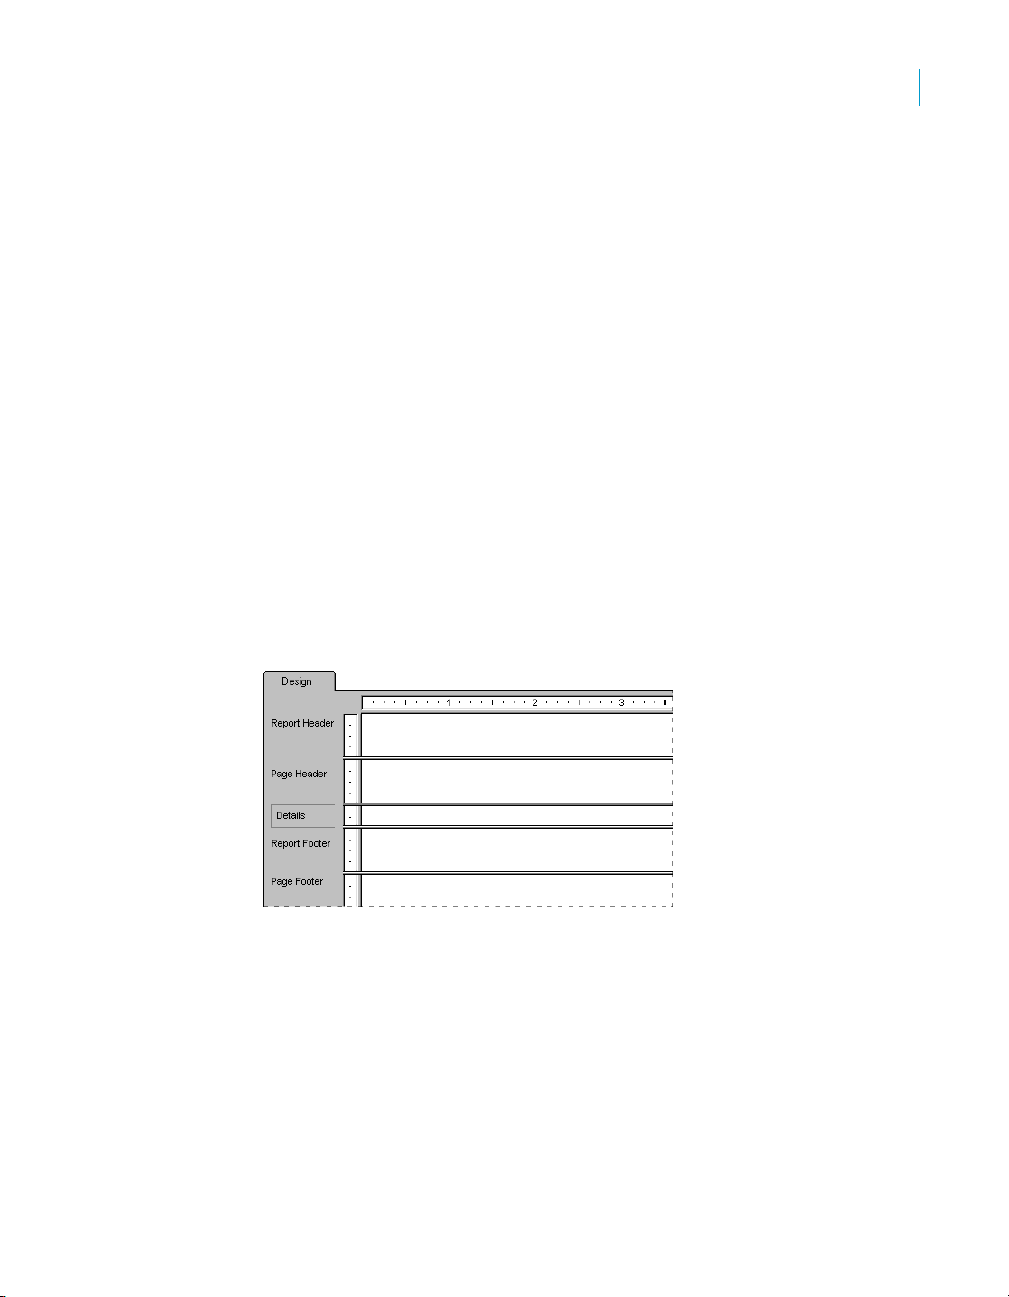
About the report design environment
• Sort Tables Alphabetically
Use this option to display database tables in alphabetical order (instead
of the order they appear in the database).
• Refresh
Use this option to refresh the list of available fields in the Field Explorer.
Group Name Fields
You can insert an existing Group Name field shown in the Field Explorer by
right-clicking it and selecting Insert to Report. Unlike a formula field,
parameter field or running total field, however, you cannot create a Group
Name field through the Field Explorer. (A Group Name field is created when
you insert a group.)
About the report design environment
Design tab
When working with Crystal Reports, you will probably use the Design tab
more than any other part of the program.
Introduction to Reporting
6
The Design tab is the place you do most of the initial work when creating a
report. It designates and labels the various sections of the report. You can do
the initial formatting, place objects in the sections where you want them to
appear, specify sorting, grouping, and totaling needs, and so forth.
The Design tab provides a very efficient environment for designing a report
because you work in the tab with data representations, not with data itself. When
a field is placed on the report, the program uses a frame to identify the field on
the tab; it does not retrieve the data. Thus, you can add and delete fields and
other objects, move them around, set up complex formulas, and more, without
tying up the computer or network resources needed to gather the data.
Crystal Reports User’s Guide 91

Introduction to Reporting
6
About the report design environment
The report created in the Design tab is a kind of virtual report; it has the structure
and instructions for creating the final report, but it is not the report itself. To turn
the Design tab report into a final report or into a report that you can fine-tune,
you “just add data.” You do this whenever you preview the report, print it, or
output it in any other way. The actual data will now appear in the report.
Design tab areas
When you first begin creating a report, Crystal Reports automatically creates
five areas in the Design tab.
• Report Header
This section is generally used for the report title and other information
you want to appear at the beginning of the report. It can also be used for
charts and cross-tabs that include data for the entire report.
• Page Header
This section is generally used for information that you want to appear at
the top of each page. This can include such things as chapter names, the
name of the document, and other similar information. This section can
also be used to display field titles above the fields on a report.
• Details
This section is used for the body of the report, and is printed once per
record. The bulk of the report data generally appears in this section.
• Report Footer
This section is used for information you want to appear only once at the
end of the report (such as grand totals) and for charts and cross-tabs that
include data for the entire report.
• Page Footer
This section usually contains the page number and any other information
you want to appear on the bottom of each page.
If a group, summary, or subtotal is added to the report, the program creates
two additional sections:
• Group Header
This section typically holds the group name field, and can be used to
display charts or cross-tabs that include data specific to the group. It is
printed once at the beginning of a group.
• Group Footer
This section generally holds the summary value, if any, and can be used
to display charts or cross-tabs. It is printed once at the end of a group.
92 Crystal Reports User’s Guide

Introduction to Reporting
About the report design environment
When a group, summary, or subtotal is added, the Group Header area
appears directly above the Details area and the Group Footer area appears
directly below the Details area.
If you set up additional groups, the program creates new group areas between
the Details area and the existing Group Header and Group Footer area(s).
6
Like the original areas, each of these newly added areas can contain one or
more sections. By default, they each contain a single section.
Identifying and working with areas and sections
By default, each area contains only a single section. The name for that
section appears directly to the left of the section. If you have multiple sections
in an area, the sections are designated as a, b, c, and so forth.
Note:
• Initials, such as RH, PH, D, PF, RF, and so on, are used to identify each
section if you have selected the Short Section Names check box in the
Design View area of the Options dialog box.
• If you right-click the shaded area containing a section name, a shortcut
menu appears with section-specific options.
Crystal Reports User’s Guide 93
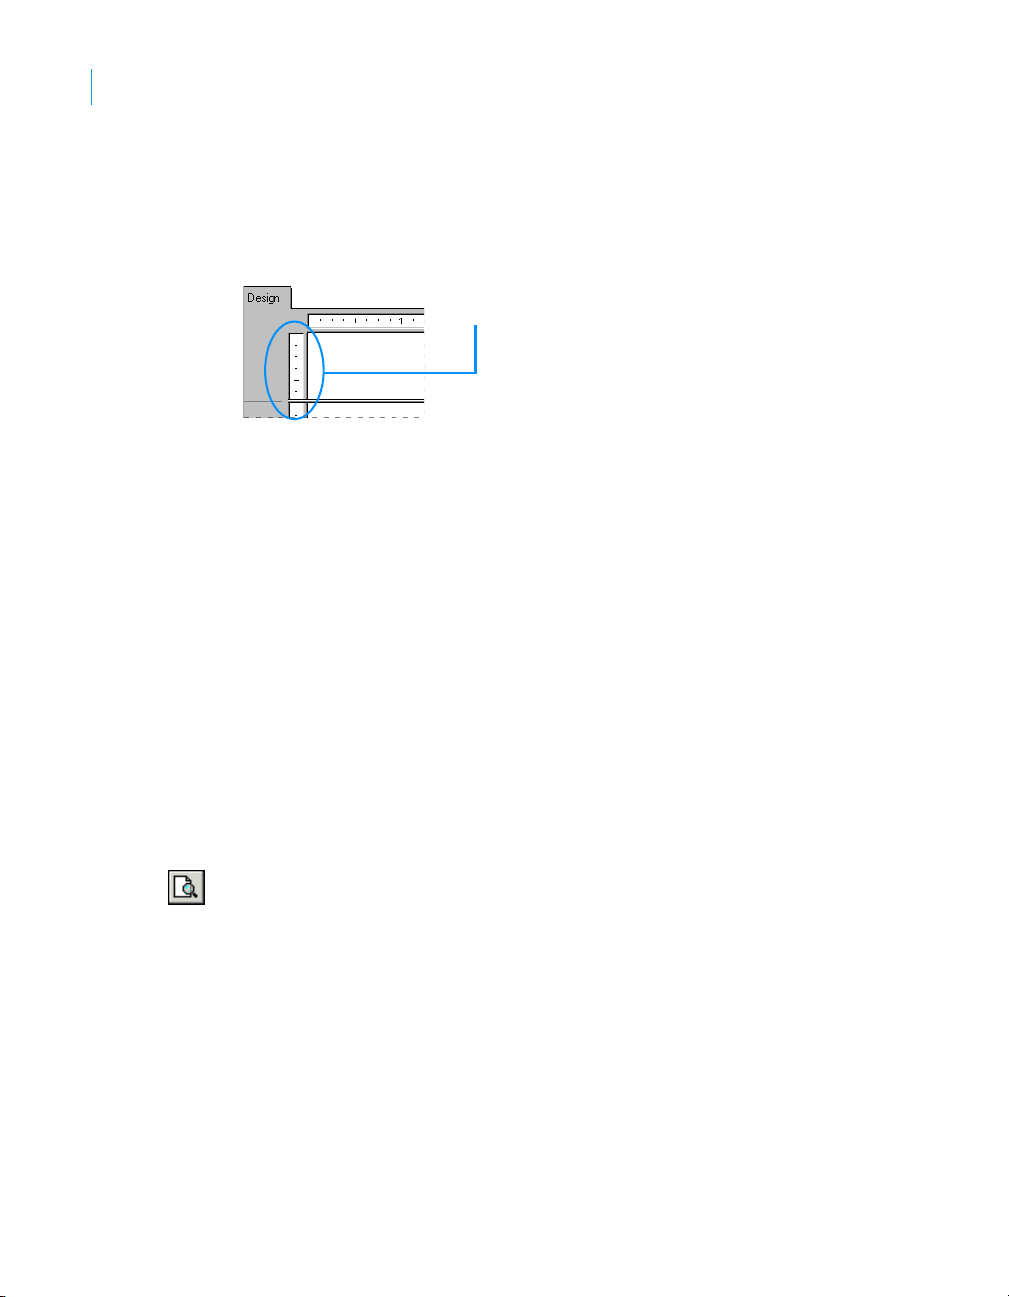
Introduction to Reporting
6
About the report design environment
If you have selected the Show Rulers options on the Layout tab of the Options
dialog box, the program displays a section ruler immediately to the left of
each section. The section ruler is used to add, remove, and move guidelines,
and to provide a visual reference when you are placing objects. See
“Designing with guidelines” on page 251.
Whenever a new section is added, the program creates a ruler for that
section. See “Using multiple sections in reports” on page 222.
Other Design tab capabilities
There are several other capabilities built into the Design tab. With the Design
tab, you can:
• Resize a section by dragging its boundary. See “Resizing a section” on
page 221.
• Split a section (create two sections from one) by clicking its left boundary.
See “Splitting a section” on page 221.
• Add horizontal and vertical guidelines by clicking the rulers. See
“Designing with guidelines” on page 251.
• Zoom in and out on a report at any magnification from 25% to 400% of
the original size. See “Using the zoom feature” on page 110.
Section ruler.
Preview tab
To preview a report before printing it, click Print Preview on the Standard toolbar.
The program gathers the data, makes the necessary calculations, and
displays the report in the Preview tab. With the data in place, you can review
the spacing and formatting of your report and see the actual results of all your
summaries, formula calculations, and record and group selections.
In true WYSIWYG (What You See Is What You Get) fashion, you can work
directly on this live data, fine-tuning it until the report has the exact look you
want.
94 Crystal Reports User’s Guide

Standard view
Introduction to Reporting
About the report design environment
The program works with data in the following manner:
• The first time the Preview tab is used, it retrieves data from your
underlying data source(s) and saves it with the report (unless you have
set up the program not to save data).
• From that point on, the program uses the saved data whenever you
preview the report unless you specifically refresh it or add a field that
requires the program to retrieve new data.
Crystal Reports provides two views for previewing a report:
• Standard view
• Group Tree view
6
In standard view, the report is displayed a page at a time. Using the
navigation buttons in the Preview tab, you can move to the beginning or end
of the report, or you can move backward and forward through the report one
page at a time. For shorter reports or reports in which you’re primarily
interested in seeing the “bottom line” totals, the standard view provides all of
the functionality you need.
The Data Age indicator
The Data Age indicator indicates the date the data was last refreshed or
initially retrieved, whichever is the most recent. If the data was initially
retrieved or refreshed today, it indicates the time it happened.
Crystal Reports User’s Guide 95
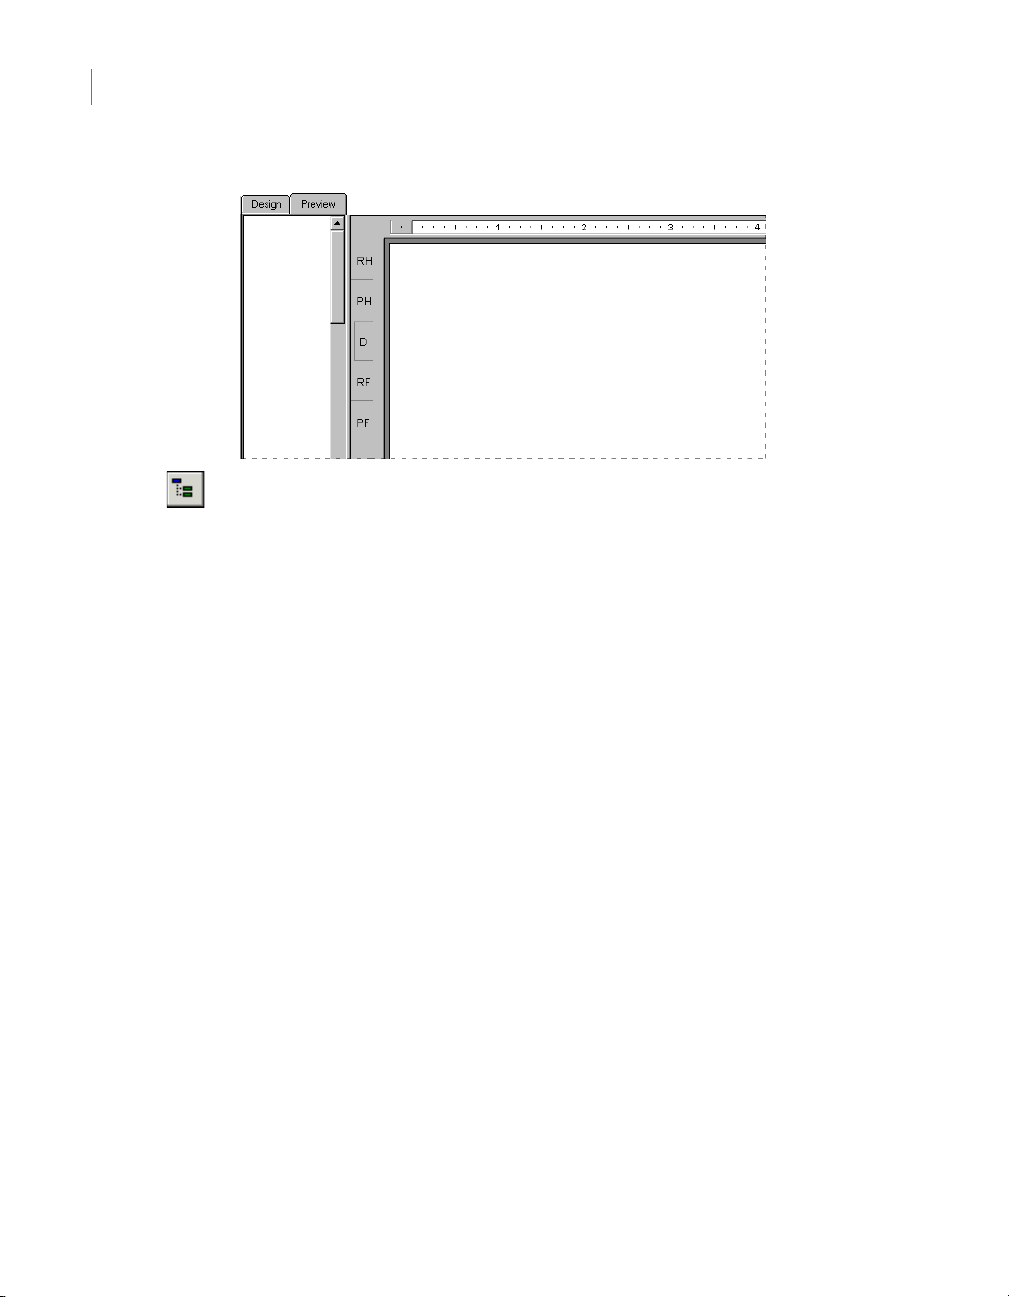
Introduction to Reporting
6
About the report design environment
Group Tree view
The Group Tree view can be shown or hidden using Toggle Group Tree on
the Standard toolbar.
The Group Tree view presents a split screen:
• The right pane displays the report.
• The left pane displays a high level outline of the report, showing the
hierarchy of groups and subgroups in a familiar tree format.
The Group Tree normally displays the names of the groups and subgroups
you created in your report. You can, however, customize these names using
the Options tab of the Insert Group or Change Group Options dialog box. For
more information on customizing Group Names in the Group Tree view, see
“Grouping data” on page 175.
When you click the tree node for the group that interests you, the program
jumps immediately to the part of the report that contains the information for
that group. For longer reports or reports in which you wish to jump back and
forth between different groups, the Smart Navigation features of the Group
Tree view make your work extremely efficient.
Comparisons with the Design tab
You have the same formatting capabilities in the Preview tab as you do in the
Design tab. Menus (both menu bar and shortcut menus) and toolbars remain
active, providing essentially the same functionality you have when working
with a report in the Design tab. However, when you are making numerous
changes, it is quicker to make the changes in the Design tab. Some additional
things to consider are:
96 Crystal Reports User’s Guide

Introduction to Reporting
About the report design environment
• The Design tab and Preview tab are tied together internally. Any changes
made in one are reflected in the other.
• The Preview tab has a single vertical ruler at the left of the tab rather than
the individual section rulers seen in the Design tab. The functionality of
the ruler is the same.
• The Preview tab identifies report sections in the shaded area to the left of
the data. With a quick look you can tell which report section the data is
printing from. While section names appear only once in the Design tab,
they print each time a section prints in the Preview tab.
• The Record counter, the Data Age indicator (see “The Data Age
indicator” on page 95), and the Page Forward/Page Back controls (see
“Preview tab” on page 94), are all active in the Preview tab.
• The Preview tab highlights every value when you select a field; whereas,
only the field frame is highlighted in the Design tab.
Working in the Preview tab has a different feel from working in the Design tab.
Each field in a database contains dozens, hundreds, or even thousands of
values, depending on the number of records in the database. When you place
a field in the Design tab, a single field frame represents all those values.
When you highlight the field, sizing handles appear on the frame and the
frame changes color.
In the Preview tab, however, you are working with the actual data. Instead of
a field frame representing many field values, the values themselves appear.
Some additional things to consider are:
• When you highlight a field or formula field value, you are actually
selecting every value in the field:
• The program places a sizing frame around the specific value you
select.
• It highlights every other value in the field.
• Likewise, when you select a summary value, you are actually selecting all
the related summary values:
• The program places a sizing frame around the specific value you
select.
• It highlights all the related summary values.
Aside from the differences in appearance, the process of building and
modifying a report is the same in both the Design tab and the Preview tab.
You should find it easy to work with your reports in both places.
6
Crystal Reports User’s Guide 97

Introduction to Reporting
6
Creating a new report
HTML Preview tab
To see an HTML rendering of your Crystal report as it will appear when
published to the web, click HTML Preview on the Standard toolbar.
When you need to make sure that your report design is appropriate and
correct over the web in a zero-client environment, the HTML Preview option
lets you see an instant rendering of your report to HTML without leaving the
Crystal Reports design environment. Unlike the Preview tab, which shows the
true report format, the HTML Preview tab shows a converted format. By
switching between the two tabs, you can make adjustments in your report
design to yield the best results on the web.
In the case of reports that are published to BusinessObjects Enterprise
(managed reports), you don’t have do any special configuration to make the
HTML Preview feature work.
For stand-alone reports (unmanaged reports), the program must use the
Report Application Sever (RAS) to generate the preview. In this case, you
need to configure the HTML Preview feature. Do this in the Smart Tag &
HTML Preview tab of the Options dialog box in Crystal Reports.
For information about how to configure the HTML Preview Options, search
the Crystal Reports online help for “Smart Tag & HTML Preview tab (Options
dialog box).”
Creating a new report
Selecting the data source
After deciding which option you want to use for creating your report (see “Report
creation options” on page 86), the next step is to select a data source to use.
Most data sources can be chosen through the Database Expert dialog box. The
Database Expert appears when you create a report from scratch using Blank
Report, or when you choose Database Expert from the Database menu.
Note: You also select a data source in the Report Creation Wizards. The
Data screen in all of the Report Creation Wizards, except the OLAP Report
Creation Wizard, is much like the Database Expert dialog box.
To select a data source
1. Choose Database Expert from the Database menu.
The Database Expert dialog box appears.
98 Crystal Reports User’s Guide

Introduction to Reporting
Creating a new report
2. Use the tree view in the Available Data Sources list of the Data screen to
select your data source:
• Current Connections
This folder shows a list of data sources you are currently connected to.
• Favorites
This folder shows a list of data sources you commonly use and have
maintained in your Favorites list.
• History
This folder shows a list of data sources you have used recently. The
last five data sources used are displayed.
• Create New Connection
This folder shows subfolders for various data sources you can
connect to.
• Repository
This folder shows you the contents of your repository through the
BusinessObjects Enterprise Explorer. Click Make New Connection to
open the BusinessObjects Enterprise Explorer; from this dialog box,
you can select an existing SQL command or Business View.
Some popular choices in the Create New Connection folder are described
here:
• Access/Excel (DAO)
This option lets you connect to a supported database type (Access,
dBASE, Excel, Lotus, and so on). You can create a new connection
using the Make New Connection option.
• Database Files
This option shows a list of standard PC databases that reside locally.
You can use Find Database File to browse for a PC database using
the Open dialog box.
• ODBC (RDO)
This option shows a list of ODBC data sources you have already
configured for use.
• OLAP
This option opens the OLAP Connection Browser so you can choose
an OLAP cube as a data source.
6
Crystal Reports User’s Guide 99

Introduction to Reporting
6
Creating a new report
Adding tables
• OLE DB (ADO)
This option shows a list of OLE DB providers you have already
configured for use. You can also specify a Microsoft Data Link file to
use.
Note: The data source options available in the Create New Connections
folder depend on the data access components selected during installation.
Related topics:
• “Accessing Data Sources” on page 531
After selecting the data source, you can add one or more tables to base your
report on.
To add a table
1. Choose Database Expert from the Database menu.
The Database Expert dialog box appears.
2. On the Data tab, search for the database you want to use in your report.
See “Selecting the data source” on page 98.
3. In the Available Data Sources list, select the table you want to add to your
report and click the > arrow to add it to the Selected Tables list.
You can insert more than one table at a time by selecting multiple tables,
right-clicking, and choosing Add to Report. You can also drag and drop
tables to the Selected Tables list.
Linking multiple tables
If the report contains data from two or more database tables, they need to be
linked at this point when creating reports.
Note: It isn’t necessary to link tables in reports created from a query or
command because any links required by the data have already been processed.
To add and link multiple tables
1. Choose Database Expert from the Database menu.
The Database Expert dialog box appears.
2. On the Data tab, select the tables you want to add to your report. See
“Adding tables” on page 100.
The Links tab appears in the Database Expert.
100 Crystal Reports User’s Guide
 Loading...