

Page 1

NMR Thermometer
Variable Temperature Control Using the 2H Lock
●
System of AVANCE III HD Spectrometers
User Manual
Version 002
Innovation with Integrity
NMR
Page 2

Copyright © by Bruker Corporation
All rights reserved. No part of this publication may be reproduced, stored in a retrieval
system, or transmitted, in any form, or by any means without the prior consent of the
publisher. Product names used are trademarks or registered trademarks of their
respective holders.
This manual was written by
Application & Electronics Departments
© July 11, 2014 Bruker Corporation
P/N: Z33085
DWG: Z4D12031
For further technical assistance for this product, please do not hesitate to contact your
nearest BRUKER dealer or contact us directly at:
Bruker Corporation
Industriestrasse 26
8117 Fällanden
Switzerland
Phone: + 41 44 825 91 11
FAX:+ 41 44 825 9696
E-mail: [email protected]
Internet: www.bruker.com
Page 3

Contents
Contents
1 Introduction......................................................................................................................................... 5
2 Principle of NMR Thermometer......................................................................................................... 7
3 Requirements...................................................................................................................................... 9
4 Getting Started.................................................................................................................................. 11
4.1 The edlock Menu............................................................................................................... 11
4.2 Setting up the NMR System for the NMR Thermometer ................................................... 13
4.3 Examples........................................................................................................................... 15
4.3.1 Monitoring Mode................................................................................................................ 16
4.3.2 Regulation Mode ............................................................................................................... 17
5 Advanced Operation ........................................................................................................................ 19
5.1 Define a New Solvent........................................................................................................ 19
5.2 Selection of NMR Thermometer Compounds ................................................................... 21
5.2.1 Predefined Solvents for the NMR Thermometer ............................................................... 22
5.2.2 Technical Considerations .................................................................................................. 23
5.2.3 Considerations for Shimming with Topshim ...................................................................... 24
6 Applications ...................................................................................................................................... 27
6.1 Identical Chemical Shifts at Different Spectrometers ........................................................ 27
6.2 Identical Chemical Shifts for Experiments with Different Heating due to Experimental
Conditions (Temperature Compensation) ......................................................................... 28
6.2.1 RF Heating ........................................................................................................................ 28
6.2.2 Heating caused by Spinning Speed (HR-MAS)................................................................. 29
7 Frequently Asked Questions (FAQ)................................................................................................ 31
8 Contact .............................................................................................................................................. 33
List of Figures................................................................................................................................... 35
Index .................................................................................................................................................. 37
Z33085_2_002 3
Page 4

Contents
4 Z33085_2_002
Page 5

Introduction
1
Introduction
This manual is planned as a user manual with limited technical detail. The main focus is on
usability, whereas a few easy examples are provided showing how to get started with this
new tool. Through use of this manual the user should get an idea for what the NMR
Thermometer™ might be used for.
The comparability of data (chemical shifts) and results derived from NMR data (diffusion data,
relaxation measurements), as well as the quality of the NMR spectra, depend on an accurate
and precise temperature measurement. That is the reason why the temperature
measurement should ideally take place inside the NMR tube and not outside of it. In general
the temperature sensor of the probe is not reflecting the real situation inside the NMR tube.
The NMR Thermometer not only monitors the temperature, but also compensates for
different heating effects (e.g. RF heating) that occur during an NMR experiment.
Z33085_2_002 5
Page 6

Introduction
6 Z33085_2_002
Page 7
Principle of NMR Thermometer
2
Principle of NMR Thermometer
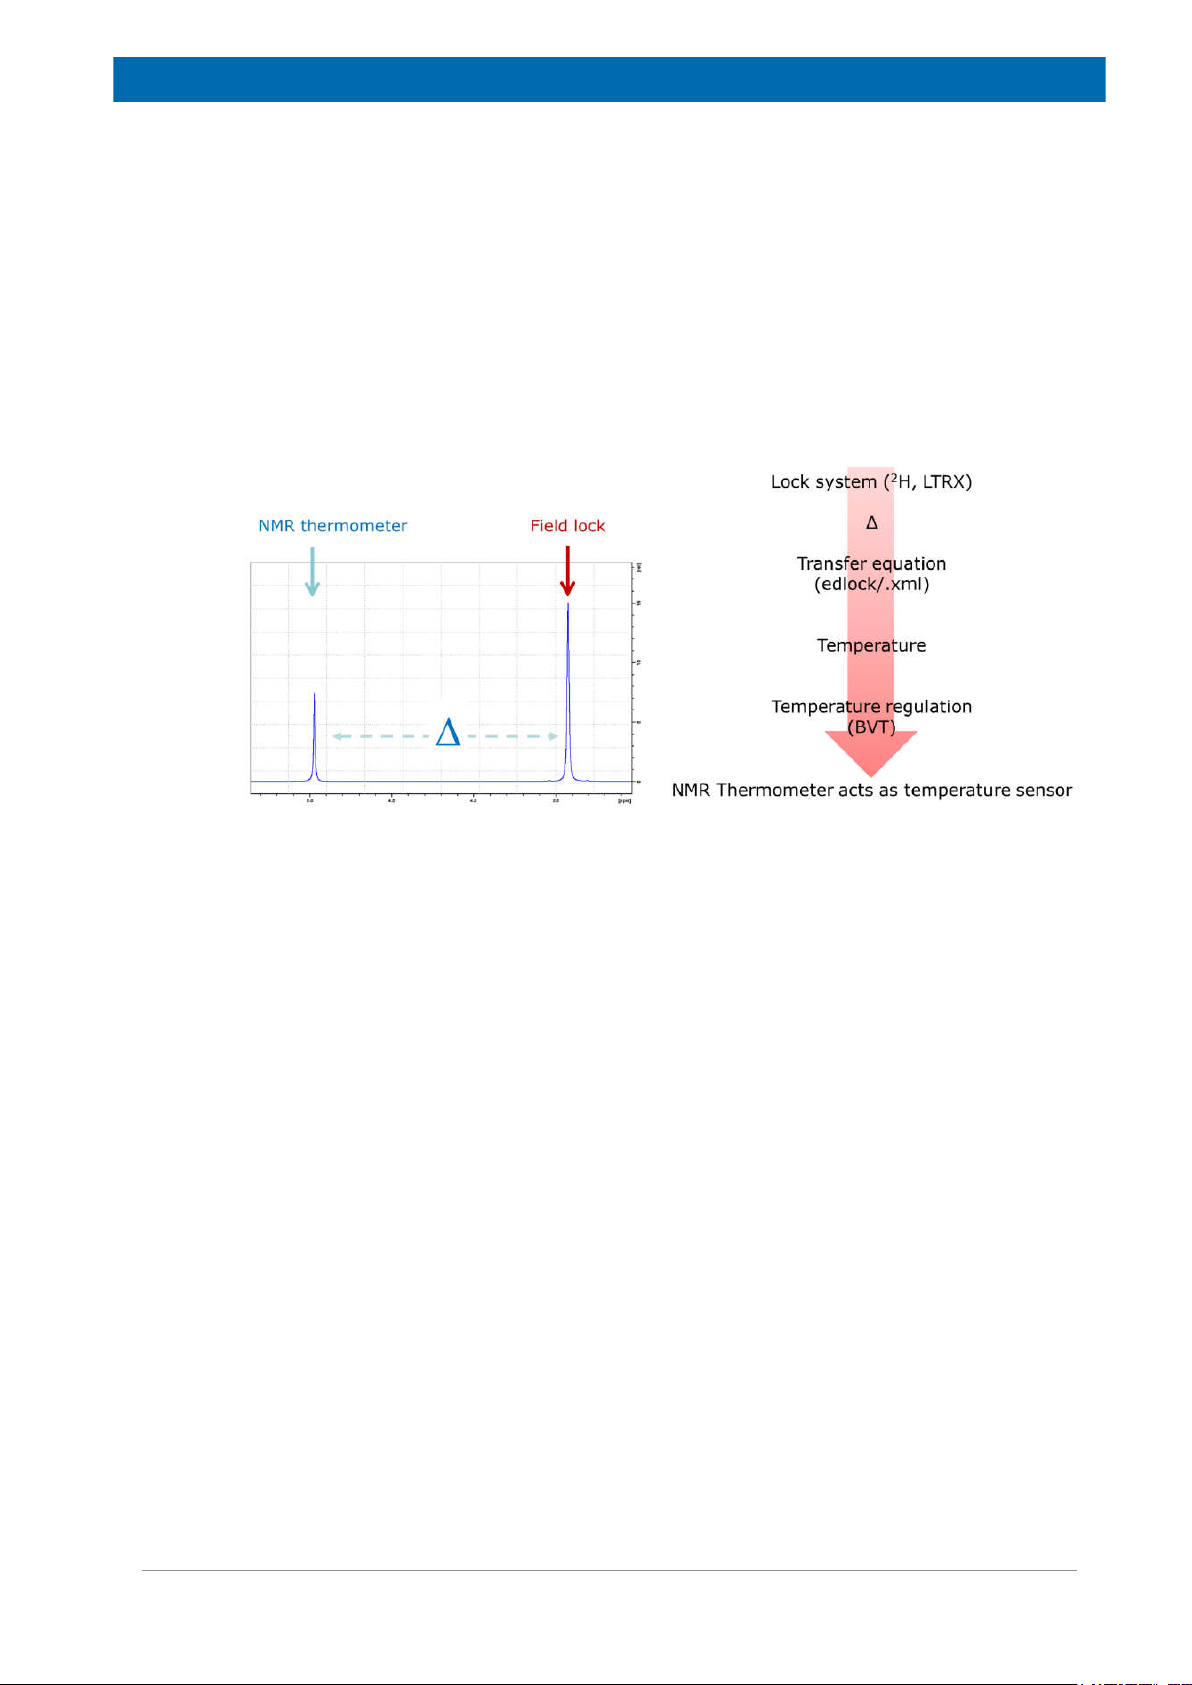
The NMR Thermometer measures the temperature inside the sample by observing the
chemical shifts of two 2H signals using the lock channel (LTRX board) of the NMR system.
The distance between the two signals is transferred into a temperature and directly used by
the temperature control unit (BVT) for regulation. Thus, the NMR Thermometer acts as a
temperature sensor (see figure below).
To obtain the second lock signal, a thermometer substance needs to be added. One of the
signals should also be temperature dependent.
Figure 2.1: Principle of the NMR Thermometer.
Z33085_2_002 7
Page 8

Principle of NMR Thermometer
8 Z33085_2_002
Page 9

Requirements
3
Requirements
Hardware: Avance III HD. A hardware upgrade is required for Avance III, whereas an update
to SmartVT™ and Digilock 2G is required.
Software: TopSpin version 3.2 or higher.
Firmware: Versions for Avance III HD.
Z33085_2_002 9
Page 10

Requirements
10 Z33085_2_002
Page 11
Getting Started
4
4.1
Getting Started
This chapter provides a short and straightforward introduction on how the NMR Thermometer
works and guides you through the first steps using the NMR Thermometer. As an overview,
the steps include:
• Preparation of the edlock table if not yet done.
• Locking on the corresponding solvent used for the NMR Thermometer.
• Optimizing the shim and lock phase.
• Activating the NMR Thermometer in the variable temperature control.
• Performing self-tuning of the variable temperature unit. This will optimize the regulation
parameters for both the VT control with the sensor and the NMR Thermometer.
• Calibration of the spectrometer for measurements of real samples after the setup of the
NMR Thermometer is finished.
The edlock Menu
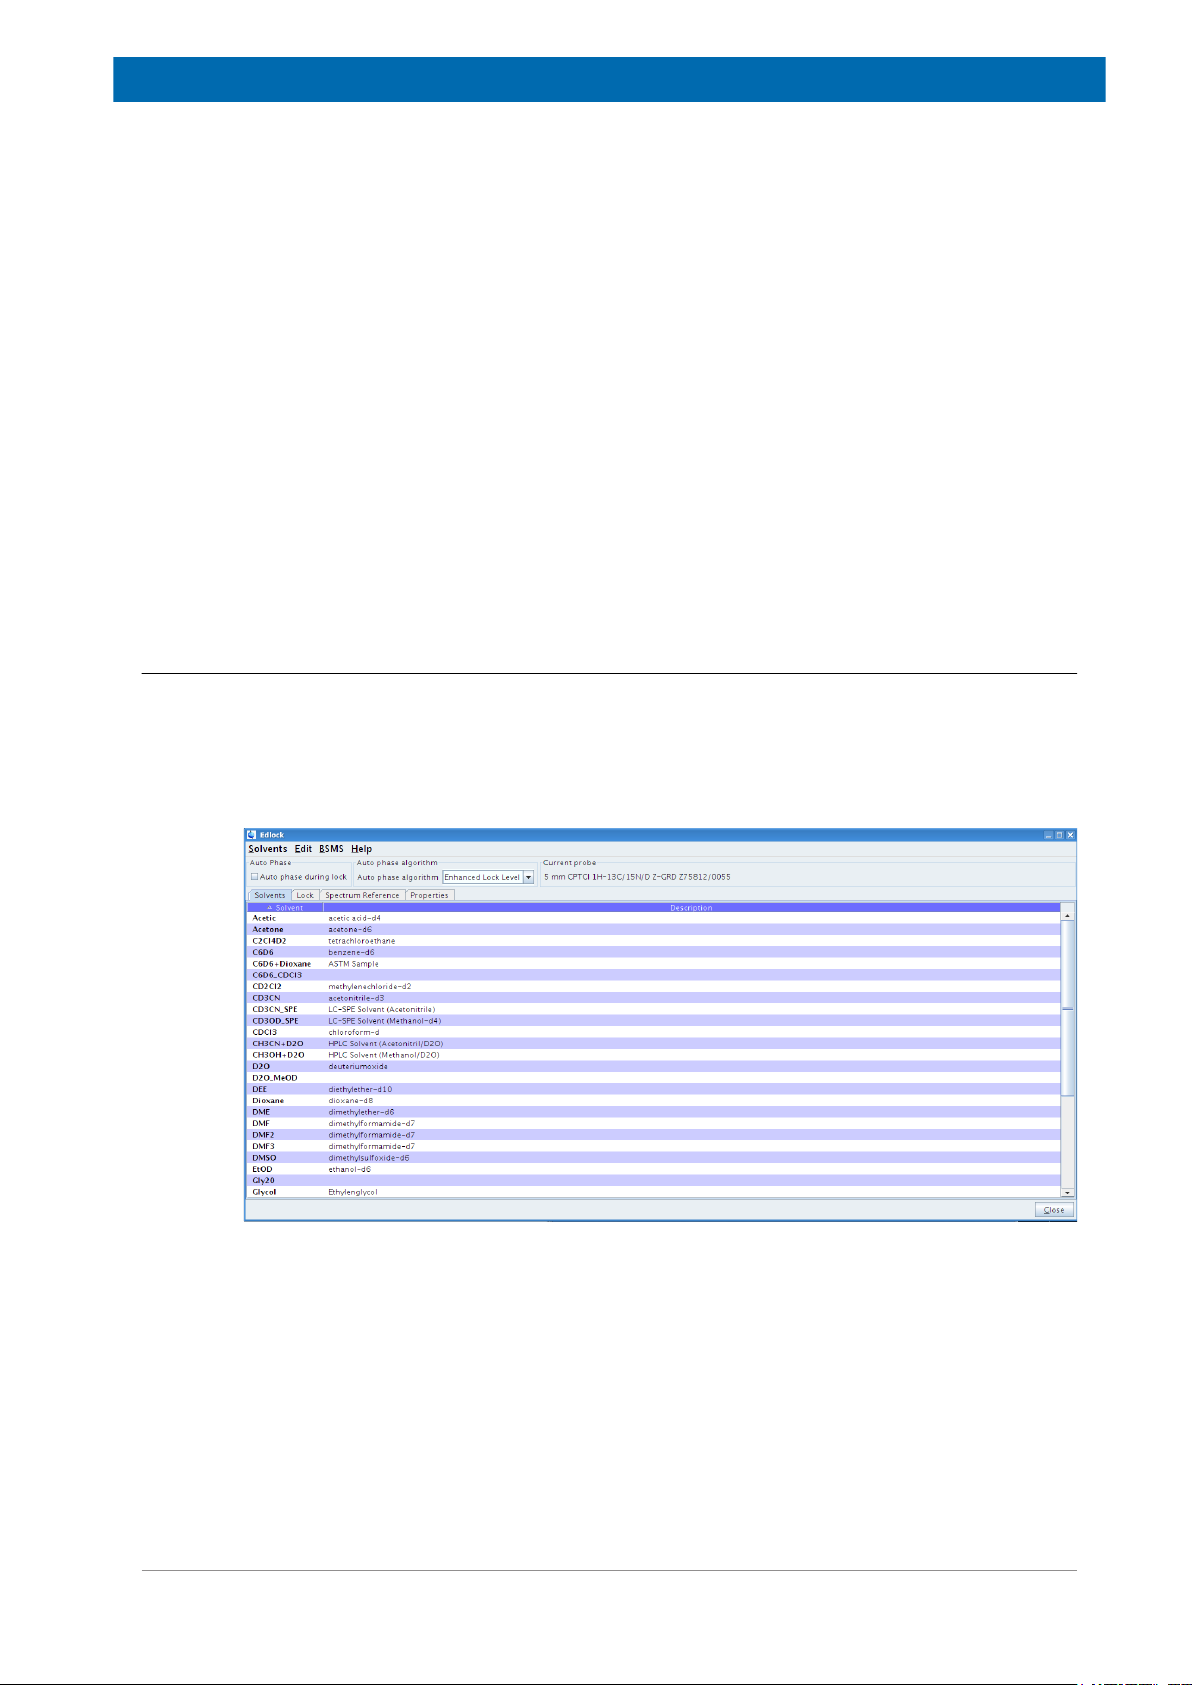
First we will provide a short introduction to the software implementation (edlock, edte).
Start edlock by typing edlock on the TopSpin command line. The edlock window opens up.
The new edlock (starting for TopSpin 3.0 and higher) contains both the solvent list (formerly
edsolv in the Edit Solvent Parameters figure below) and the lock parameters for every solvent
(see the The Submenu Lock figure below).
Figure 4.1: The Submenu Bar: Solvent.
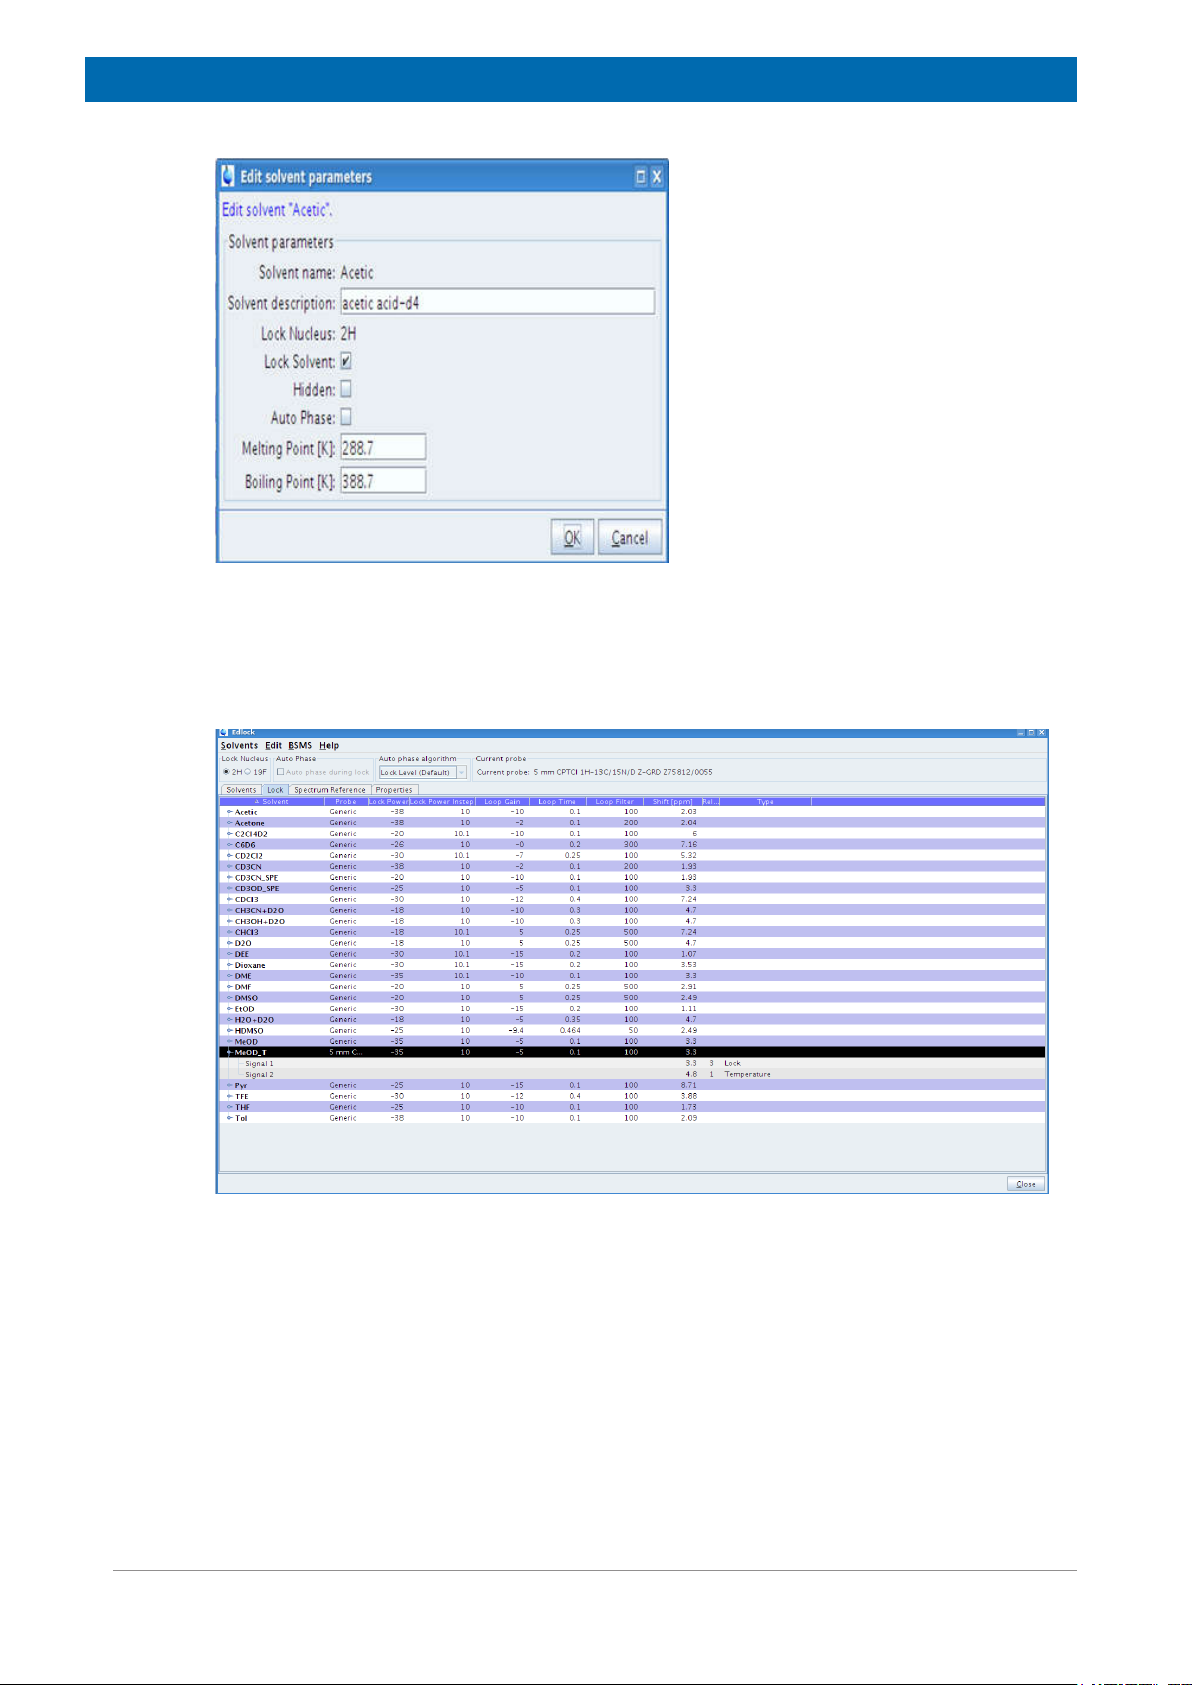
The Edit Solvent Parameters window allows you to enter several parameters for the solvent,
the melting point setting, and the boiling point of the solvent:
Z33085_2_002 11
Page 12
Getting Started
Figure 4.2: Edit Solvent Parameters.
In the submenu Lock window the solvents are listed, along with the probe for which the
definition is valid (generic or specific probe), as well as other lock parameters (lock power,
lock regulation triplet etc.).
Figure 4.3: The Submenu Lock.
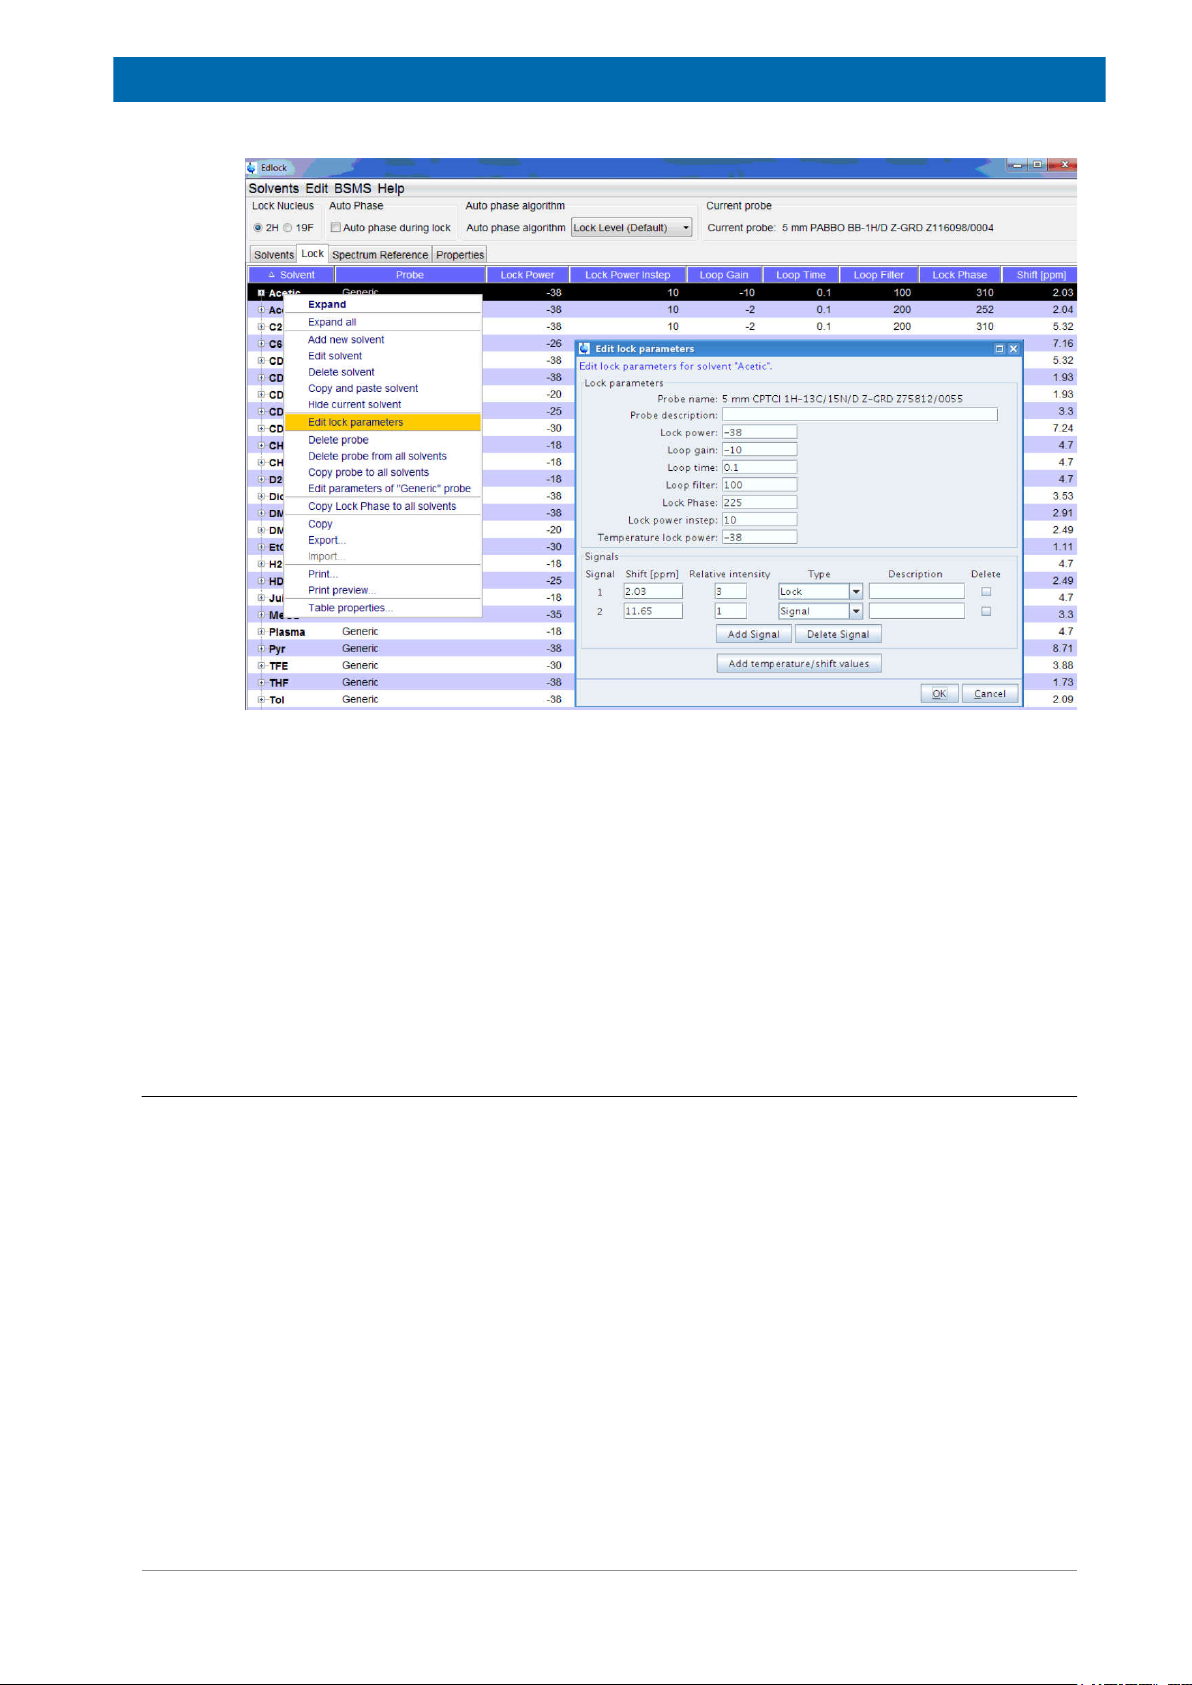
By executing a right mouse click on a solvent entry, a pull-down menu opens with the option
for editing the lock parameters:
12 Z33085_2_002
Page 13
Getting Started
4.2
Figure 4.4: Edit Lock Parameters.
Every solvent entry contains information about every 2H signal for that compound.
It is possible to define all the signals for solvents with more than one 2H signal either as
Signal, as Lock (signal used for field lock) or as Temperature (signal used for the NMR
Thermometer).
For any NMR Thermometer substance, temperature and shift values can be added or
imported (see below). The NMR Thermometer has its own lock power (figure above). For
methanol (NMR Thermometer, standard sample: 99.8% deuterated methanol) a default
solvent with corresponding lock parameters and temperature-shift value has already been
defined.
Setting up the NMR System for the NMR Thermometer
Since the NMR Thermometer is observing a 2H signal, the system has to be properly set up
(lock, shimming, optimal lock parameters for the field lock and NMR Thermometer), similar to
any other NMR measurement. This means that you should perform an automatic tuning and
matching (atma), lock-in, and shimming. The lock-in procedure works as usual (type lock on
the command line and select the solvent). If you lock directly on a solvent dedicated for the
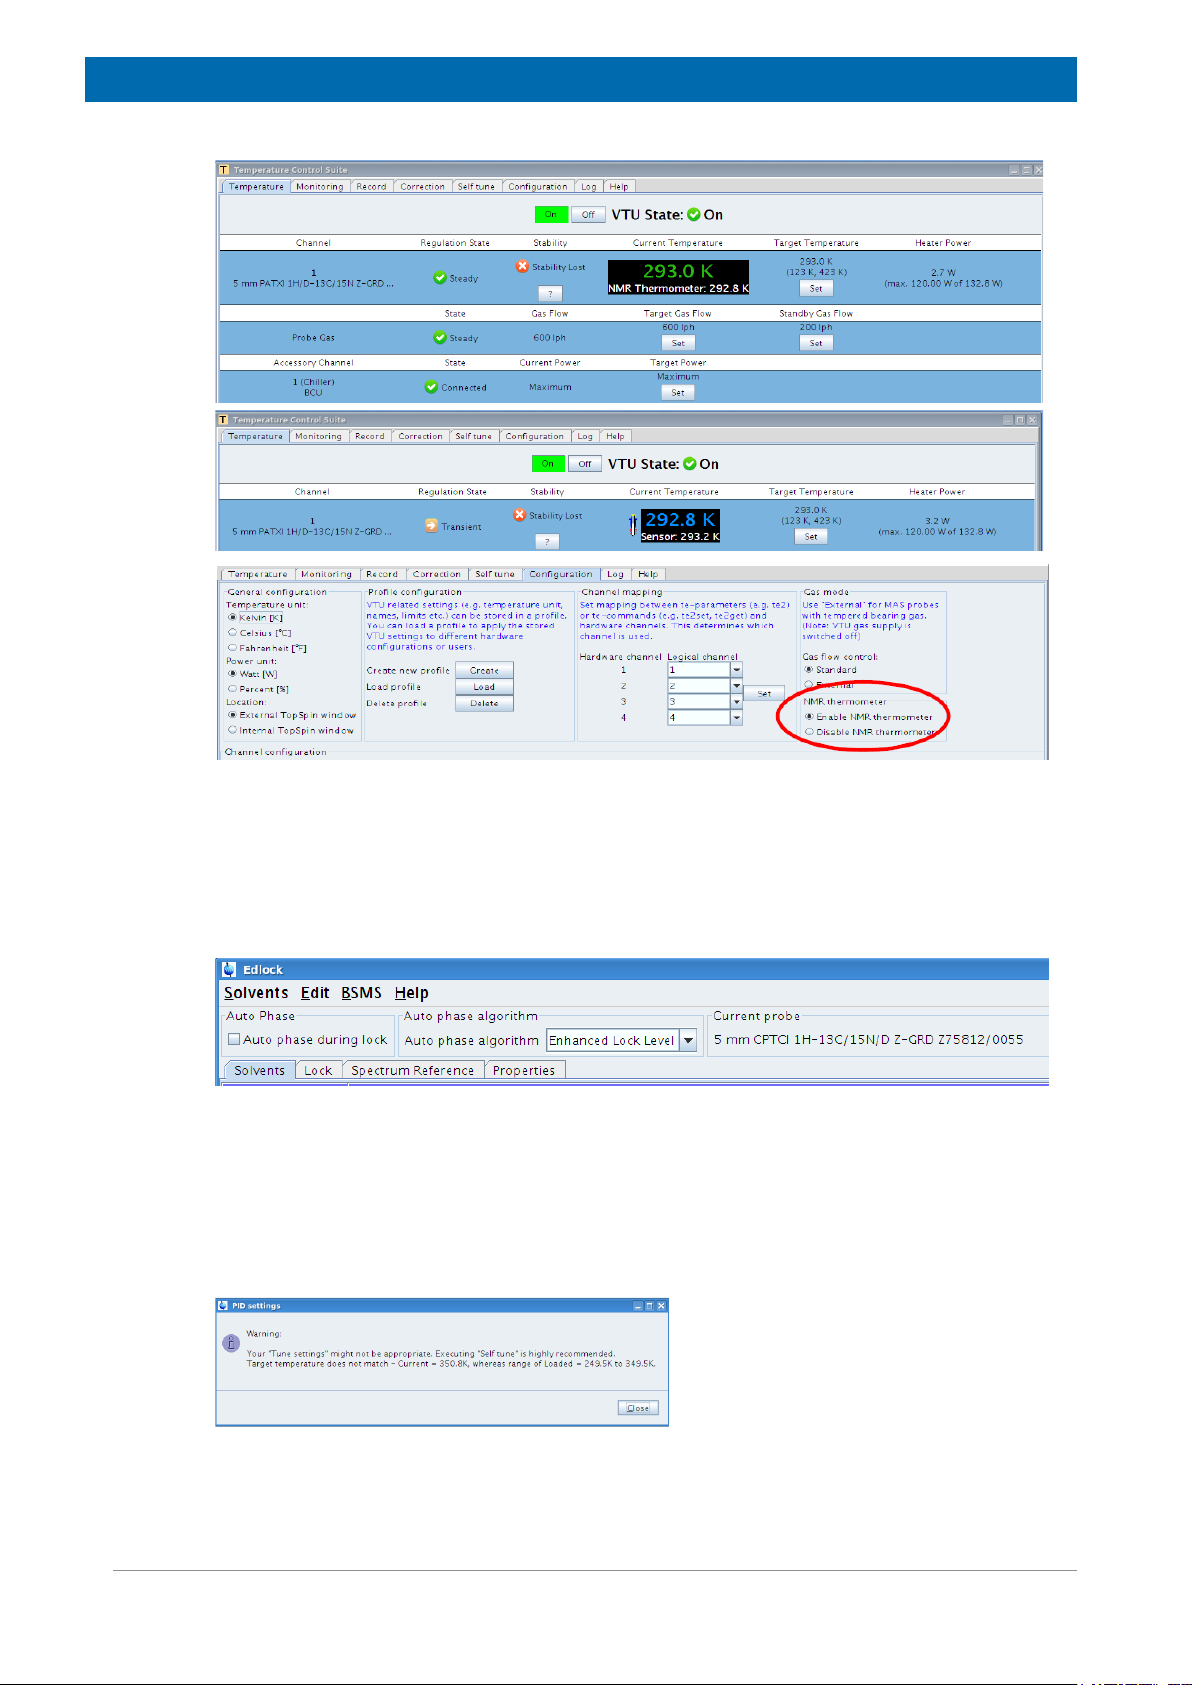
NMR Thermometer (methanol or another solvent), a temperature value is immediately
shown, either in the monitoring mode or regulation mode (figure below). After that you can
perform topshim. A decent line shape (no unusual line splitting) is mandatory for an exact
temperature measurement inside the sample.
Z33085_2_002 13
Page 14
Getting Started
Figure 4.5: Edte Window: NMR Thermometer monitoring mode (disabled, top), regulation mode
(enabled, middle) and the selection of both modes in the Configuration menu of the edte window
(bottom).
Another important parameter is the lockphase, which can be optimized automatically by
starting autophase (BSMS display). The procedure used for autophase is selected in the
edlock window (Lock Level Default, Spectrum, and Enhanced Lock Level in the figure below).
Figure 4.6: Selection of the Auto Phase Algorithm.
To prevent saturation, the Lockpower and lockgain for both lock channels should be
optimized as well.
Since the NMR Thermometer contains both the lock and the temperature regulation
components, the PID values for the temperature regulation need to be adjusted for each by
using selftune. You will be notified by the system if a selftune is recommended:
Figure 4.7: Selftune warning about PID parameters misfit.
14 Z33085_2_002
Page 15
Getting Started
4.3
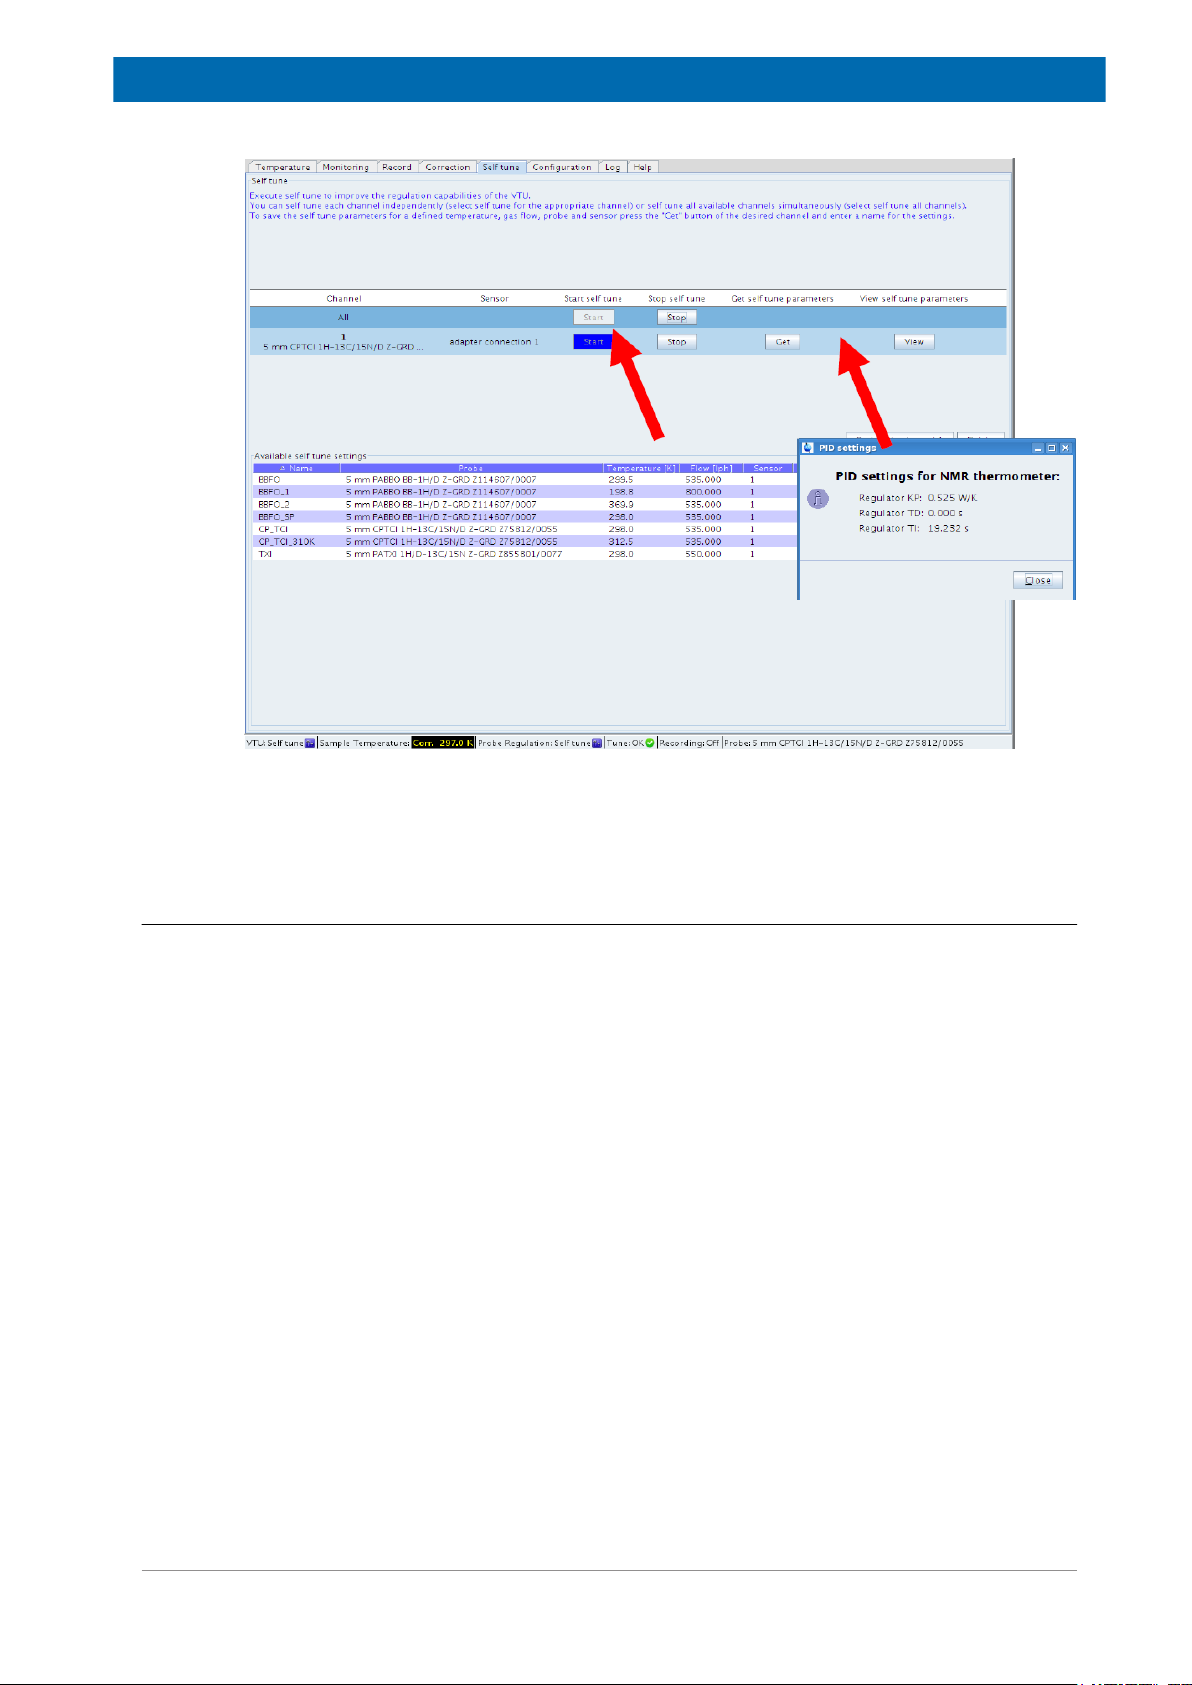
Figure 4.8: Starting the selftune procedure from the edte window.
The selftune should be carried out on both temperature channels (All).
Examples
An easy example to begin with is to use the methanol sample (standard sample: 99.8%
deuterated).
Since this sample is the reference for the NMR Thermometer, the solvent entry in edlock
containing the temperature and shift values is already predefined.
As mentioned, the NMR Thermometer is running in two different modes: monitoring and
regulation mode (see above).
Assume that the lock parameters are already optimized.
Z33085_2_002 15
Page 16
Getting Started
4.3.1
Monitoring Mode
The following steps need to be performed:
• Insert sample.
• Tune and match by using the atma command.
• Lock-in – temperature appears.
• Topshim.
• Selftune.
Figure 4.9: Selftune in Progess.
• Edte – disable NMR Thermometer (if not already done).
• Change target temperature (edte for instance, a 10K temperature jump).
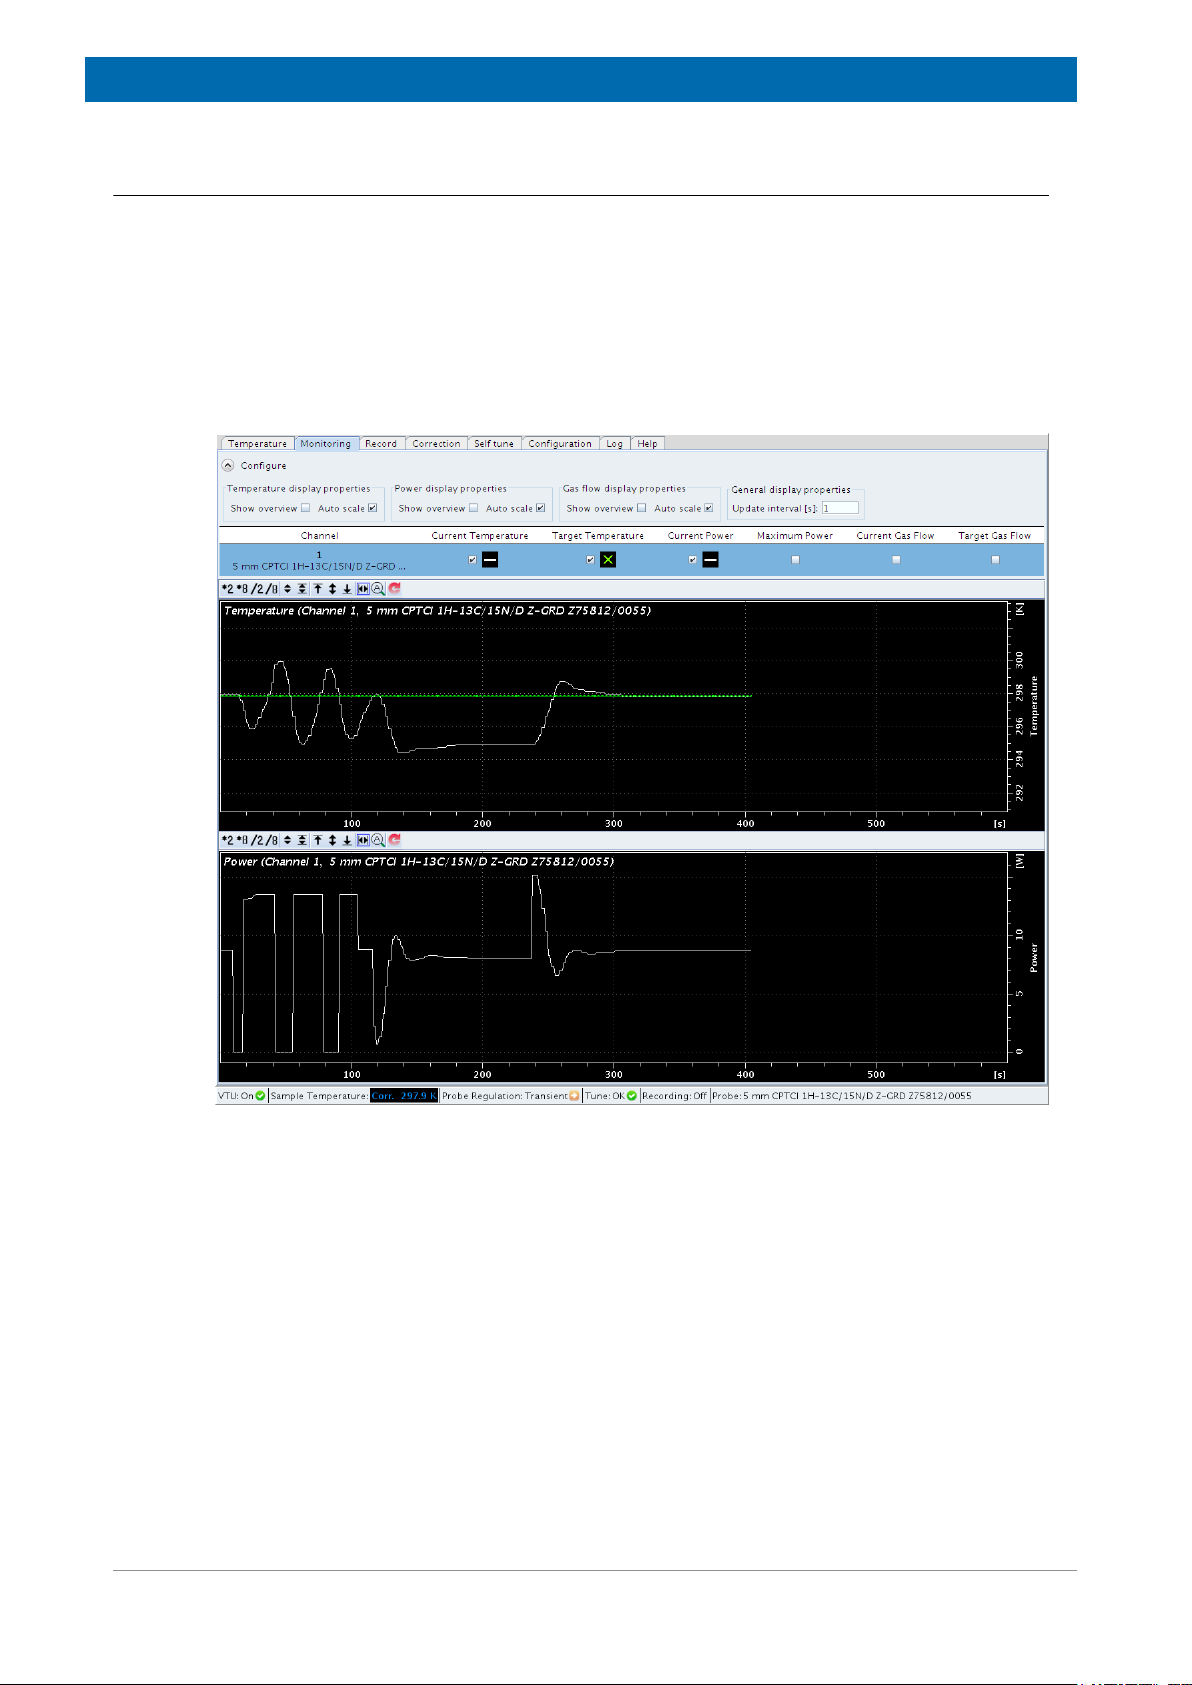
As an exercise we will perform a temperature jump (e.g. 10K) and follow the different
temperature and other BSMS values (flow/heater) in the monitoring window (edte -
Monitoring, as well as, activate NMR Sensor Temperature, NMR Thermometer, Target
Temperature, Current Power etc.).
16 Z33085_2_002
Page 17
Getting Started
4.3.2
Figure 4.10: Monitoring several BSMS values during a temperature jump.
Regulation Mode
The following steps need to be performed:
• Insert sample.
• Tune and match – atma.
• Lock-in – temperature value appears.
• Topshim.
• Selftune (maybe already done in example 1).
• Edte – enable NMR Thermometer.
• Perform an experiment with internal RF heating (e.g. TOCSY).
After setting up the system (lock, shim) and enabling the NMR Thermometer (edte) the
sample temperature is used for temperature regulation, which is visible on the status bar:
Figure 4.11: TopSpin status bar with NMR Thermometer enabled.
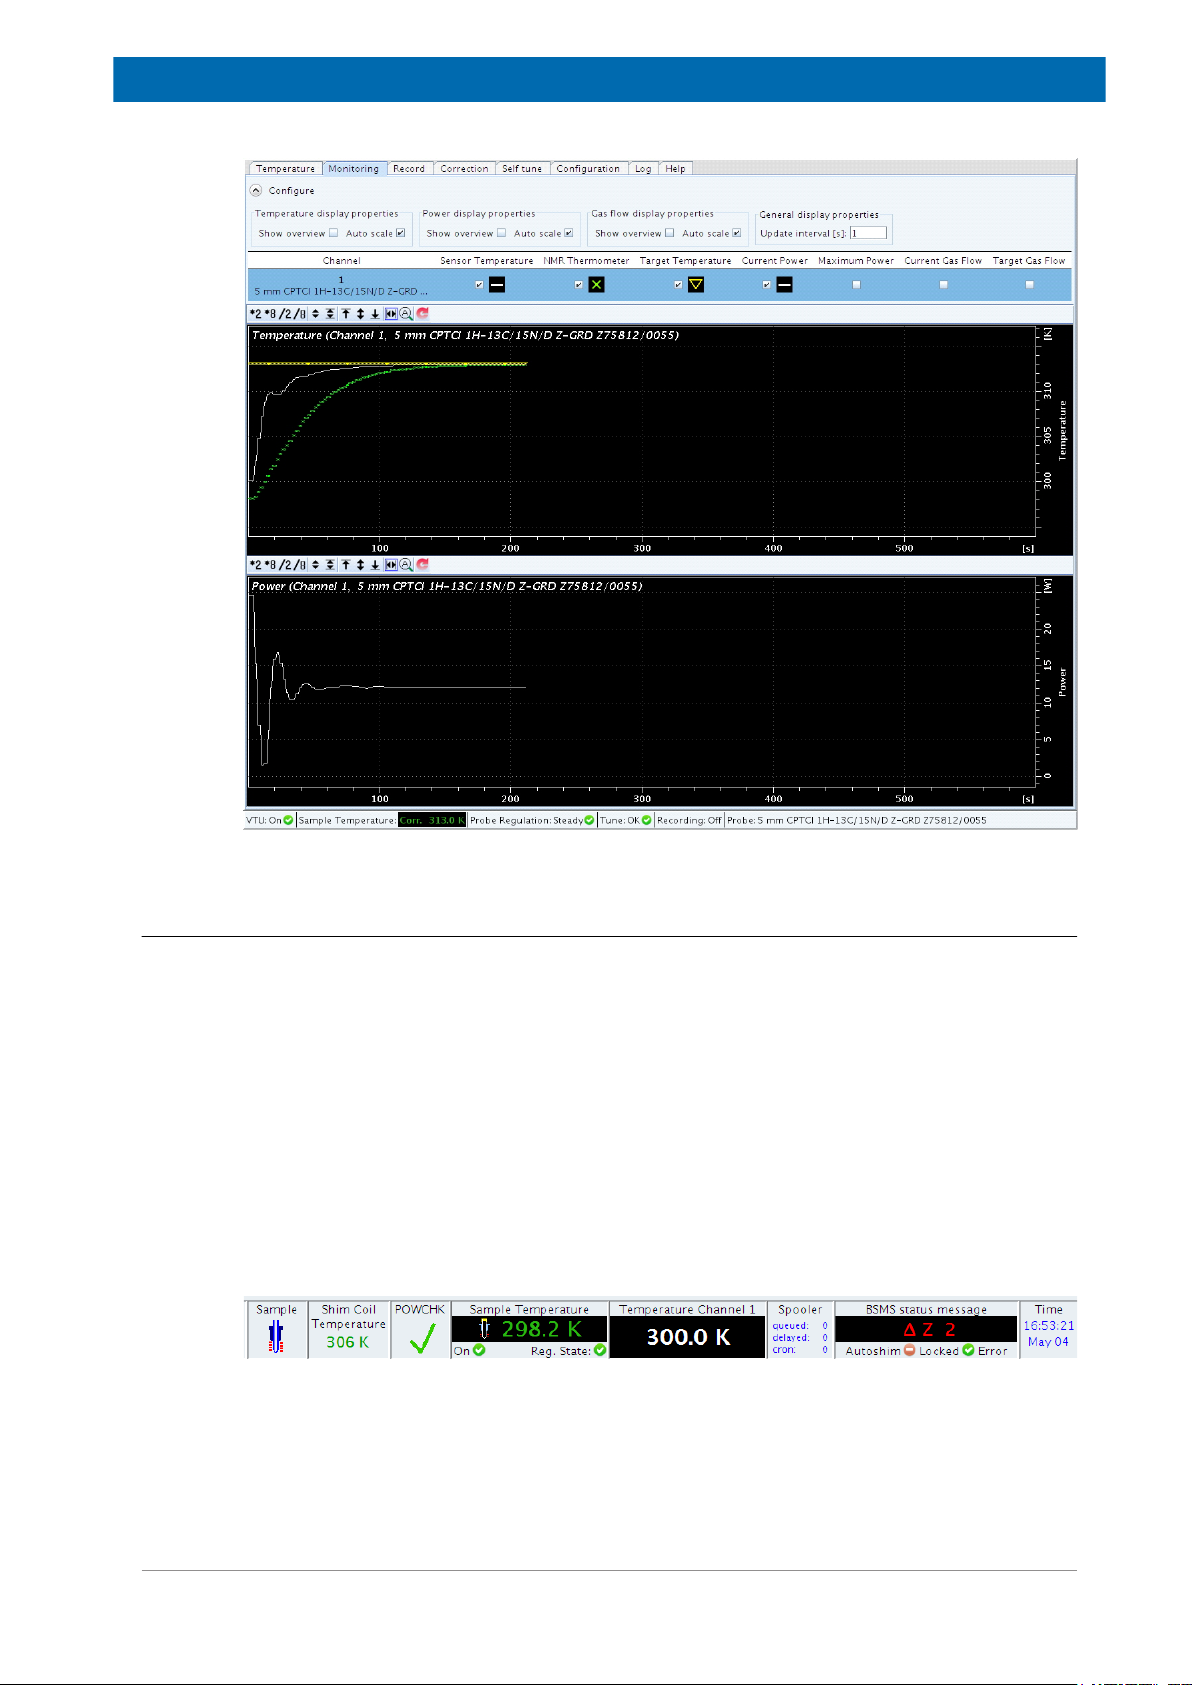
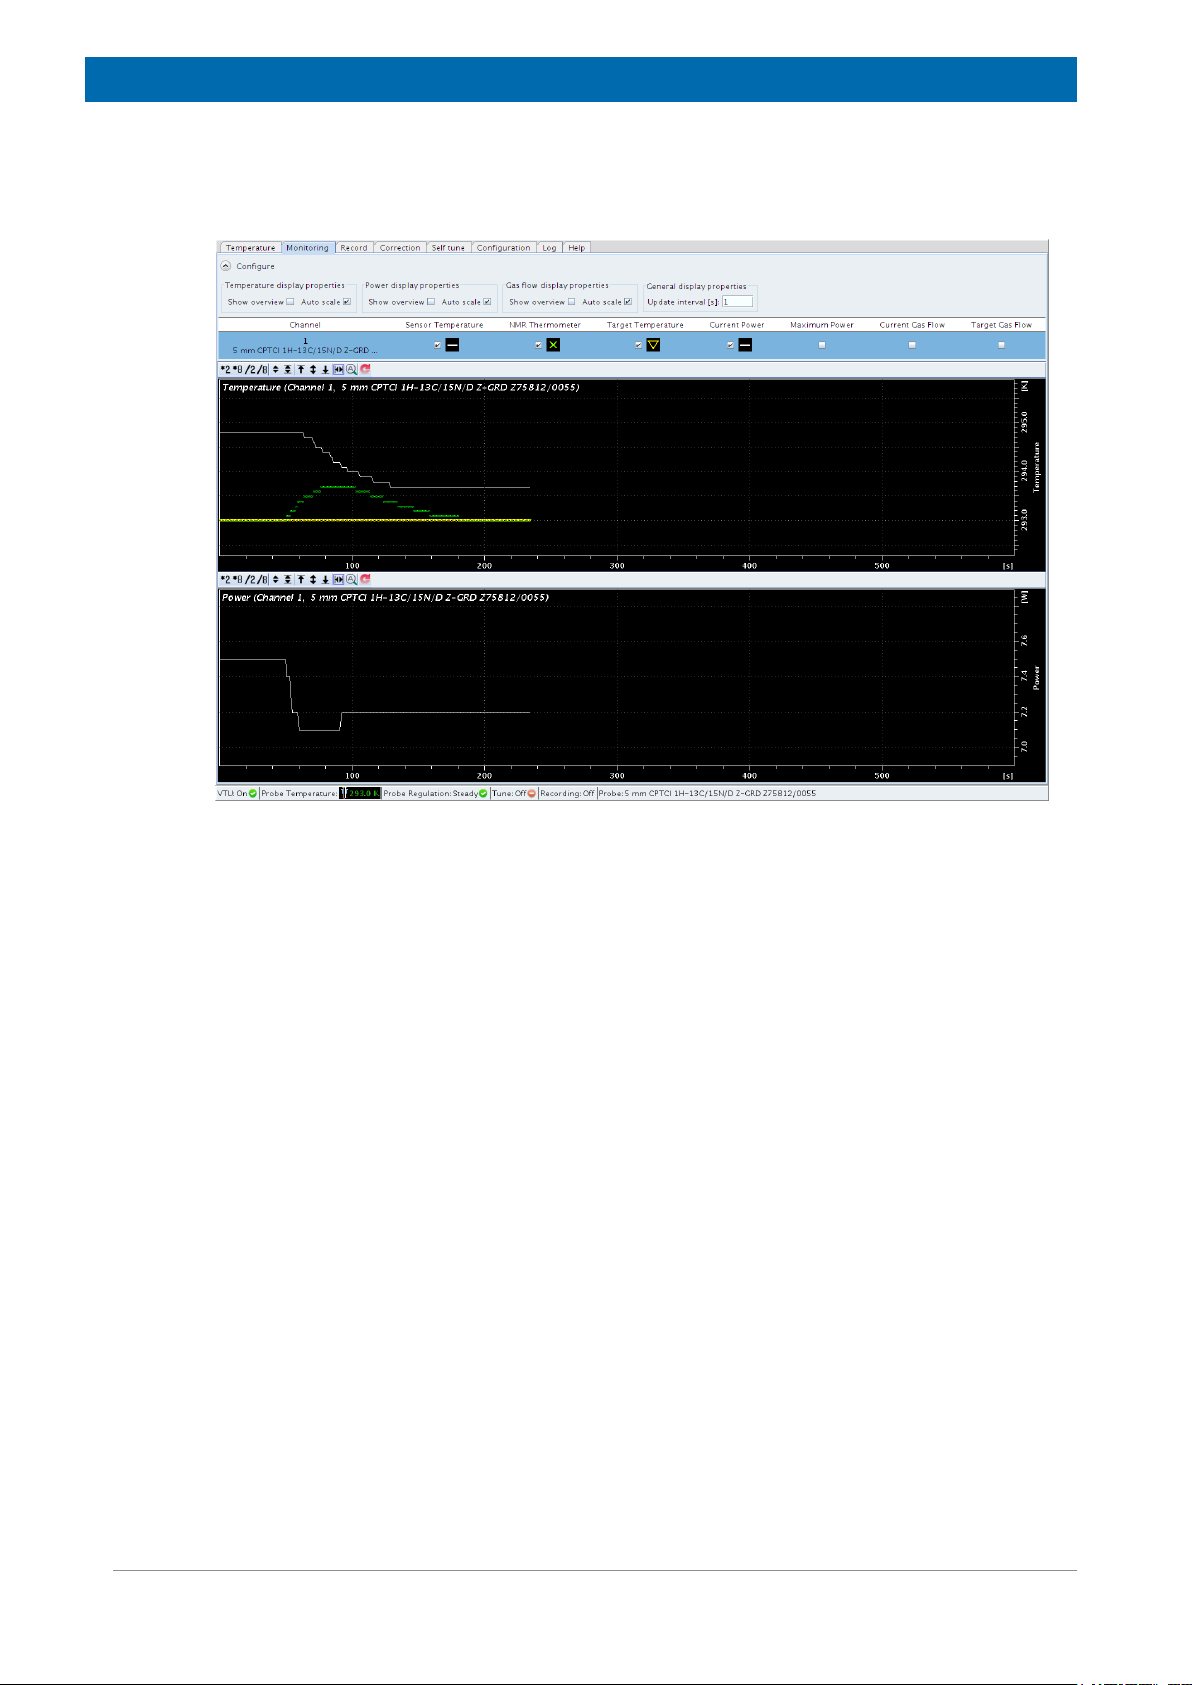
To test the performance of the NMR Thermometer start a TOCSY experiment and follow the
temperature values (sensor, NMR Thermometer) in the monitoring window of the VTU display
(edte). One can nicely see that the temperature inside the sample increases over a certain
Z33085_2_002 17
Page 18
Getting Started
period of time and that the system immediately reacts to that by reducing the heater power
(figure below - lower part), and hence the sensor temperature (figure below - upper part,
white line).
Figure 4.12: Monitoring of the sensor and the sample temperature in edte during a TOCSY experiment
In the figure above, the upper part shows the temperature of the sensor and the NMR
Thermometers; the lower part shows the heater power.
18 Z33085_2_002
Page 19
Advanced Operation
5
5.1
Advanced Operation
Define a New Solvent
To work with your own NMR Thermometer substances, you first have to define a new solvent
in the edlock table.
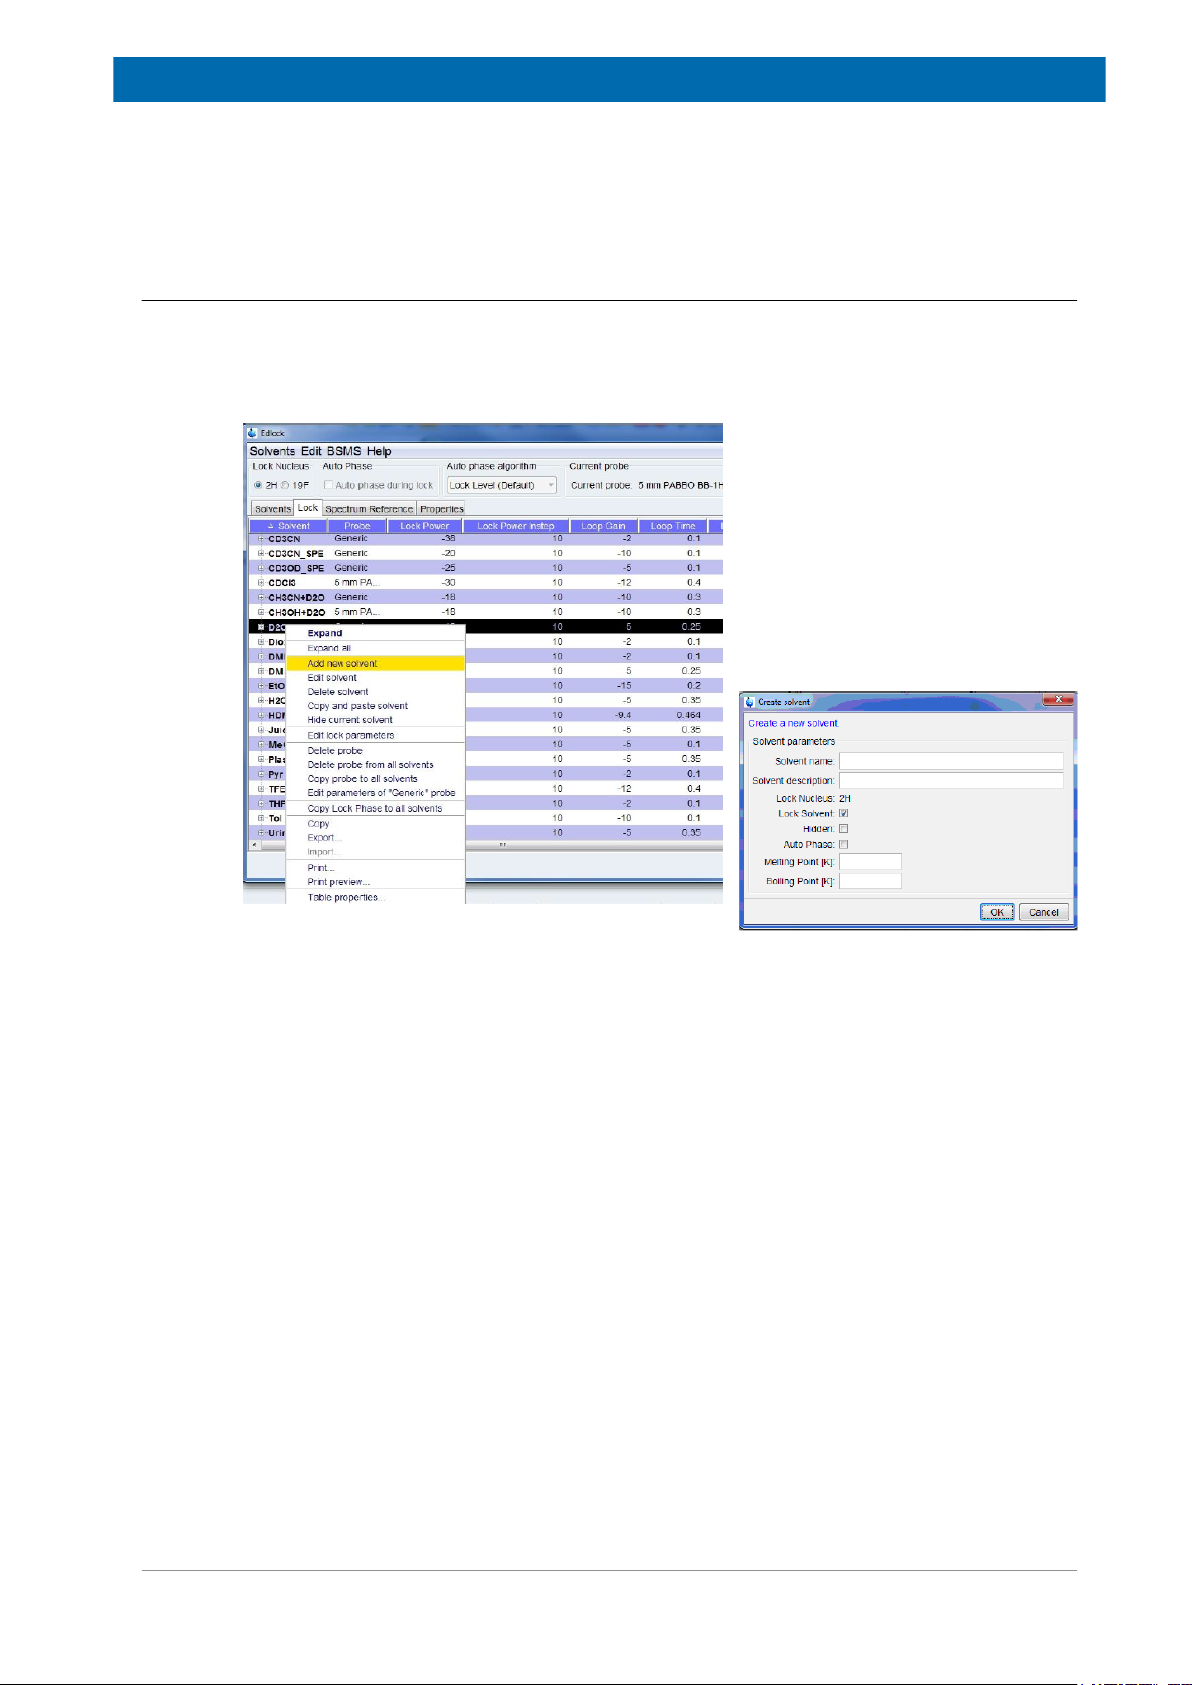
Select a solvent which is similar to your mixture (similar lock parameters) and click the right
mouse button. In the resulting pull-down menu you can add the new solvent:
Figure 5.1: Adding New Solvents.
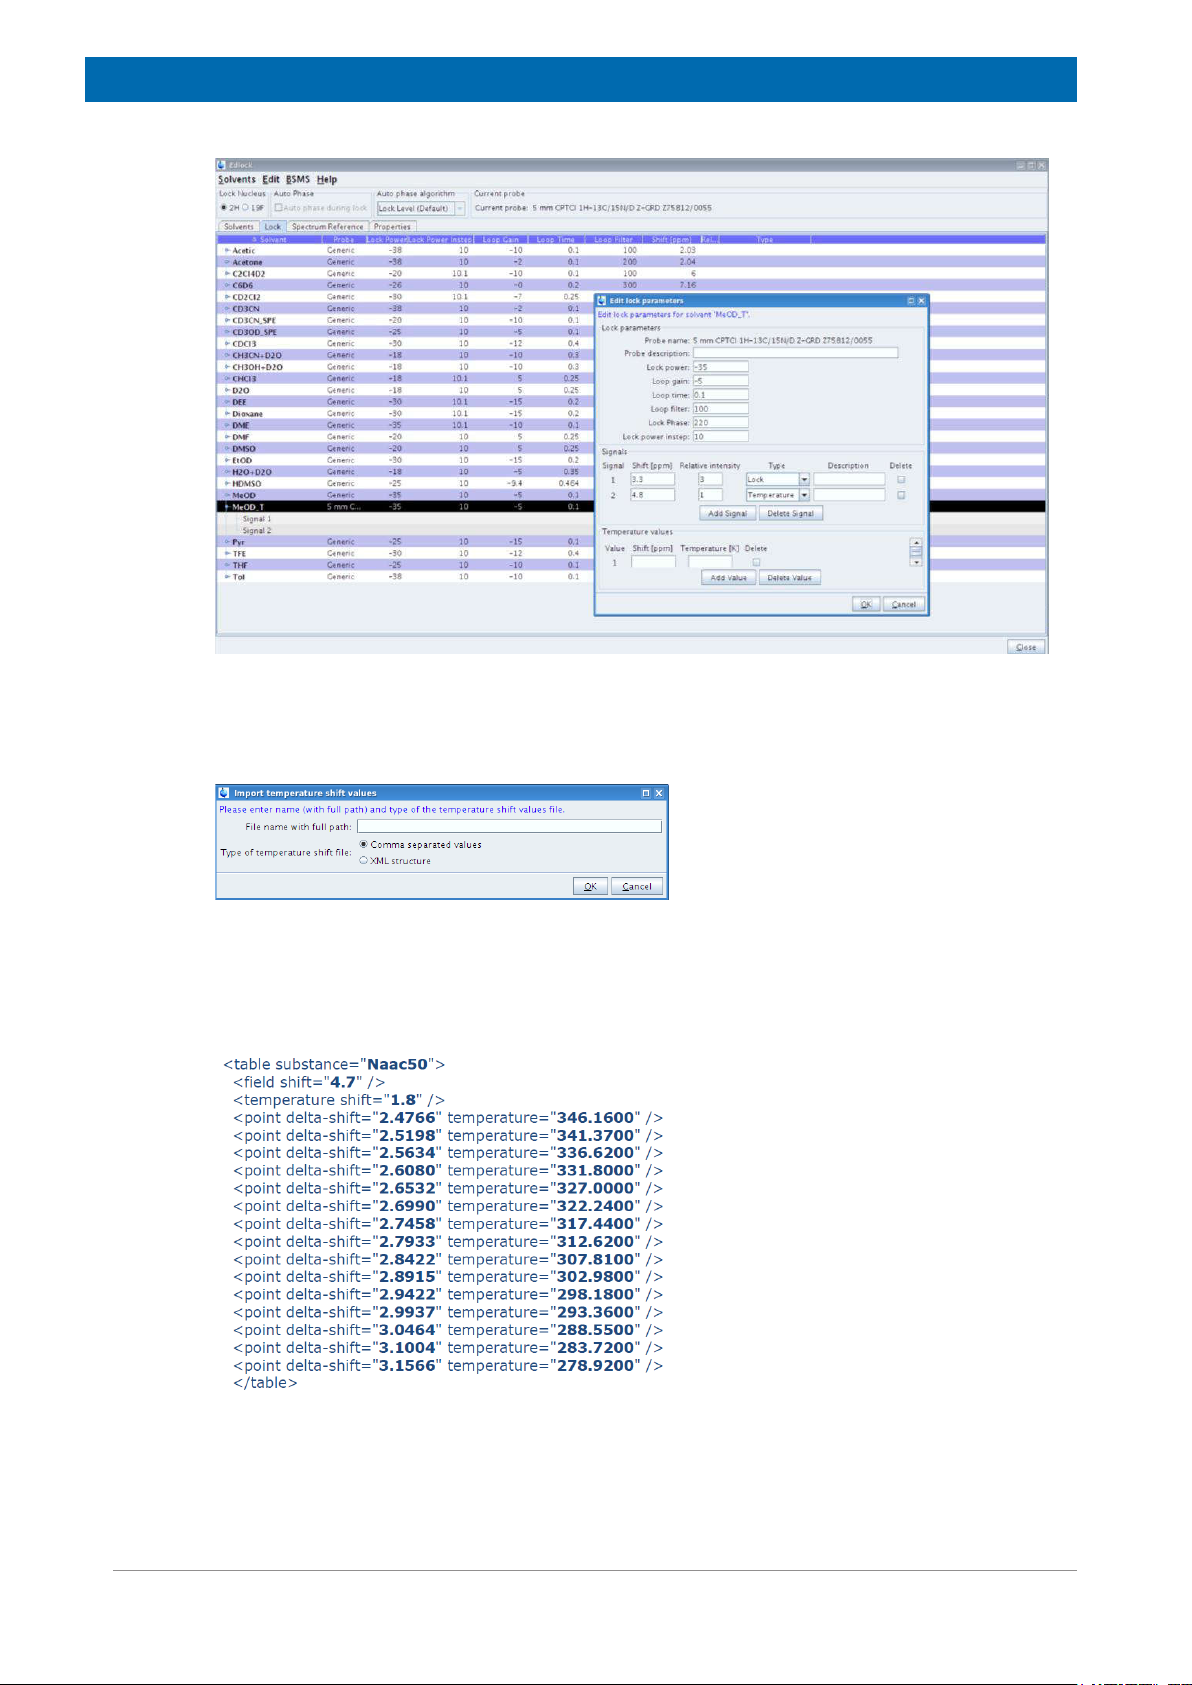
In the edit lock parameters window the signals can be defined (Shift) and assigned (Type) as
Lock, Signal or Temperature:
Z33085_2_002 19
Page 20
Advanced Operation
Figure 5.2: Assign Signals to Type of Signal (Signal, Lock, Temperature).
In the next step you should import the shift-temperature values (.csv or .xml format) or fill in
the values manually. You can also create your own .xml (see below).
Figure 5.3: Dialog for importing temperature shift value files.
The .xml file (figure below) contains the name of the solvent (identical with the solvent name)
and two shift values, one for the field shift and one for the temperature shift. The values have
to be identical with the values defined for the particular solvent in edlock.
Figure 5.4: Example of a shift-temperature file in .xml format.
After the import the shift and temperature value are filled in the edlock table for the selected
solvent and used afterwards for the lock-in process Create a new XML file:
20 Z33085_2_002
Page 21
Advanced Operation
Figure 5.5: Temperature shift values filled in.
For many NMR applications (for instance, Bio-NMR in aqueous solutions) an estimate of the
slope (be aware of the fact that the slope can have negative or positive sign!) of the
temperature dependency and the knowledge of the offset (absolute temperature correction)
are sufficient (the necessary temperature range might be rather small) to create an .xml file. It
is off course also possible to determine the correct slope automatically.
5.2
Selection of NMR Thermometer Compounds
The simplest compound for the NMR Thermometer is fully deuterated methanol used as a
NMR solvent. While the deuterium signal of the methyl group is used for the field lock, the
deuterium signal of the hydroxyl group is used for the NMR Thermometer. The deuterium
chemical shifts of commonly used organic NMR solvents like CDCl3, acetone-d6 and DMSOd6 are virtually independent on the sample temperature. In that case, deuterated methanol
could be placed in a capillary or mixed with the solvent.
The chemical shift of water strongly depends on the temperature. For samples in aqueous
solutions, a deuterated organic small molecule can be added as a thermometer compound.
Details will be described in the following section.
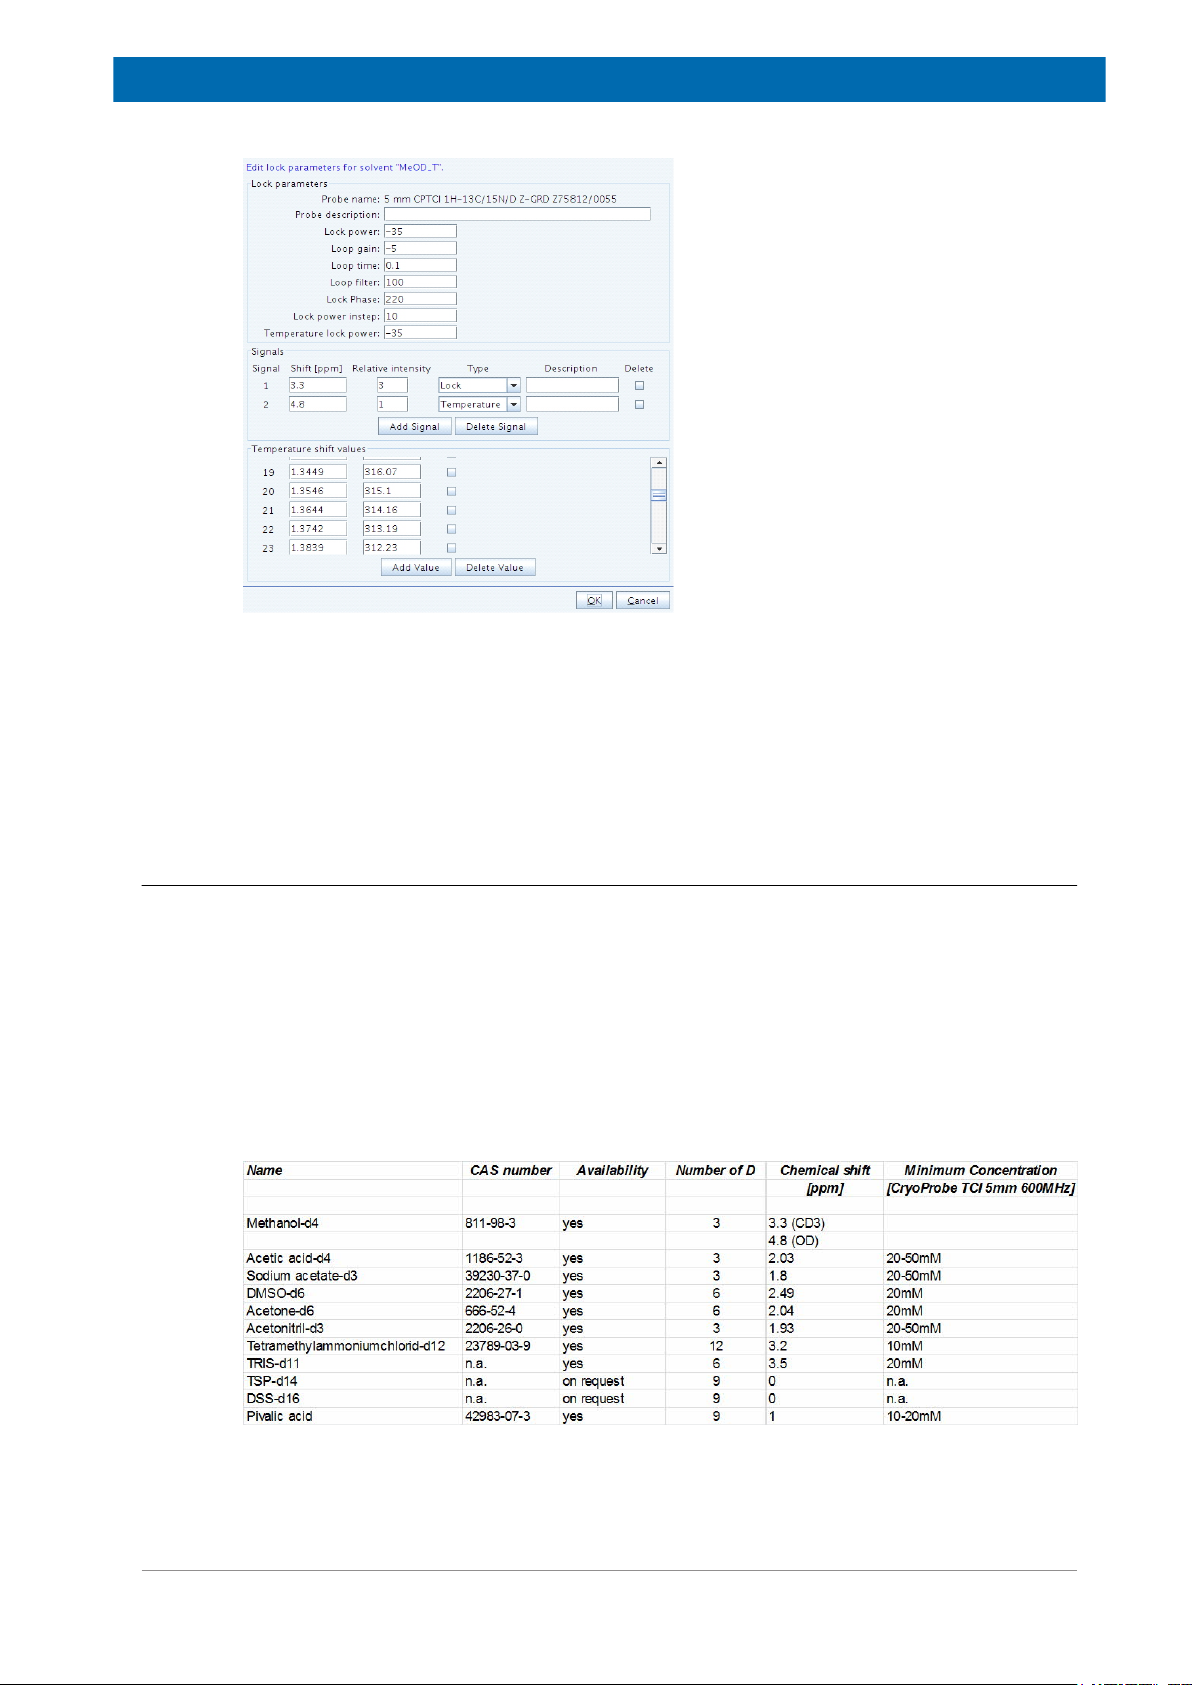
The compounds listed in the table below have been tested and can be considered.
Figure 5.6: Suggested compounds for the NMR Thermometer and samples in aqueous solution (D2O 5
– 100%), their properties and estimated concentration. Fully deuterated DSS and TSP are currently not
available but will be synthesized on Bruker’s request at small amounts only for internal tests.
Z33085_2_002 21
Page 22

Advanced Operation
For the selection of a suitable compound the following points should be considered:
• Large number of deuterons: The larger the number of chemically equivalent deuterons,
the lower the required concentration. Tetramethylammonium chloride-d12 is in this respect,
the preferred compound, whereas sodium acetate is less favorable.
• Possibly one additional 2H signal.
• Moderate or no salt effect: Salts and acids in aqueous solution will increase the
conductivity of the sample, which might cause a loss of sensitivity and an increase of the
pulse length.
• The compound should not interact with the sample or change essential structural
properties of the sample.
• Acceptance. Difference compounds are commonly added to protein solutions. These can
be buffers like TRIS or stabilizers like EDTA. These compounds can be used if deuterated
and available at a sufficiently high concentration.
• Price and availability.
5.2.1
Predefined Solvents for the NMR Thermometer
The lock table contains solvents which are setup for usage with the NMR Thermometer. For
these solvents a temperature calibration of the chemical shift difference of the two 2H signals
has been performed and is included. These are the following solvents:
T_MeOD: methanol-d
T_H2O+D2O+NaAc: sodiumacetate-d3 in 90% H2O, 10% D2O
T_H2O+D2O+Me4NCl: tetramethylammoniumchlorid-d12 in 90%, H2O, 10% D2O
T_H2O+D2O+Pivalate: pivalic acid-d9 sodium salt in 90%, H2O, 10% D2O
Depending on the probe, the lock power may need to be adjusted.
4
22 Z33085_2_002
Page 23
Advanced Operation
5.2.2
Technical Considerations
When adding a thermometer substance to the sample, there are a few technical points to
consider.
Depending on your NMR system (room temperature or cryogenically cooled probe,
spectrometer frequency etc.) you need to add a sufficient amount of the compound in order to
obtain a decent lock signal. Another concern is the distance from the 2H signal which is used
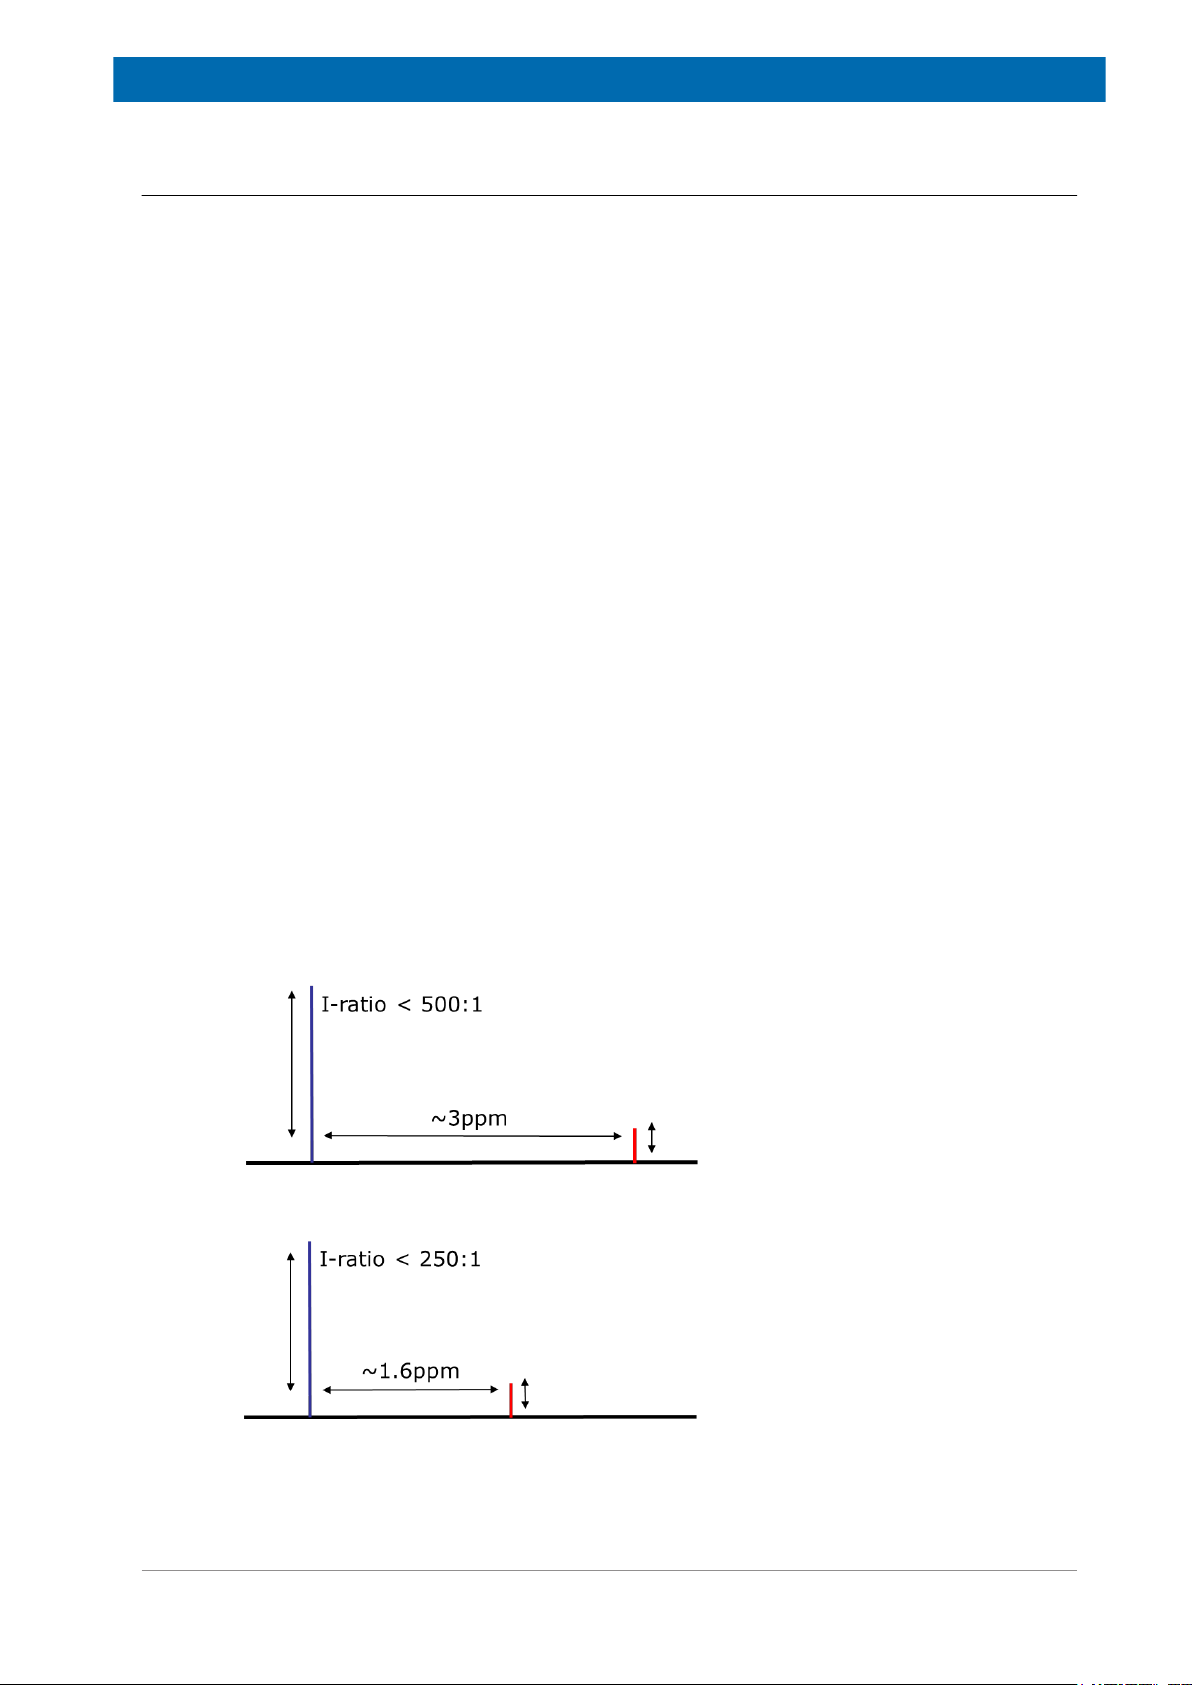
for the field lock (figure below). In addition, the dynamic range, which is the intensity ratio of
the 2H signal used for frequency lock and the NMR Thermometer, plays an important role
when a highly or fully deuterated solvent (e.g. D2O) is used as a field lock solvent.
The requirements for obtaining reliable lock-in and lock regulation performance include:
• S/N (2H) > about 200:1 (signal > ~3 ppm distant from the main signal)
• Intensity ratio < 500:1 (field lock signal: frequency lock signal; ∆ ~3 ppm)
The smaller the distance to the second signal, the higher the concentration of the compound
used for the NMR Thermometer should be. As a rule of thumb: reducing the distance of the
two lock signals by a factor of 2 increases the necessary concentration (decreases the
possible intensity ratio of the two signals) of the NMR Thermometer compound by the same
factor. Examples:
• The D of the NMR Thermometer signal to the field lock signals is about 3 ppm. The
required signal to noise ratio of the NMR Thermometer compound has to be at least 200:1
(I-ratio <500:1).
• The D of the NMR Thermometer signal to the field lock signals is about 1.5 ppm. The
required signal to noise ratio of the NMR Thermometer compound has to be at least
400:1(I-ratio <250:1).
• If the field lock signal in very large (for example using pure D2O) the concentration of the
NMR Thermometer compound has to be adjusted accordingly (see figure below).
Thermometer substances with a signal closer than 1 ppm to the field lock signal are critical
and should not be selected as NMR Thermometer signals.
Figure 5.7: Approximate dynamic range of field lock (blue) vs. the NMR Thermometer signal (red) if the
S/N of the frequency lock signal is sufficient (> 200:1).
Z33085_2_002 23
Page 24
Advanced Operation
The best performance (with low concentrations of the thermometer substance) can be
expected using cryogenically cooled probes at high magnetic field strengths (600 MHz and
higher), because the 2H sensitivity will be the highest. Therefore, check the 2H sensitivity of
your system beforehand. Nevertheless, the NMR Thermometer also works at lower fields
(e.g. 400 MHz) with room temperature probes.
The 2H sensitivity of a room temperature probe, such as an inverse or broad band observe
probe, is about a factor 5-10 times lower compared to a cryogenically cooled probe. The
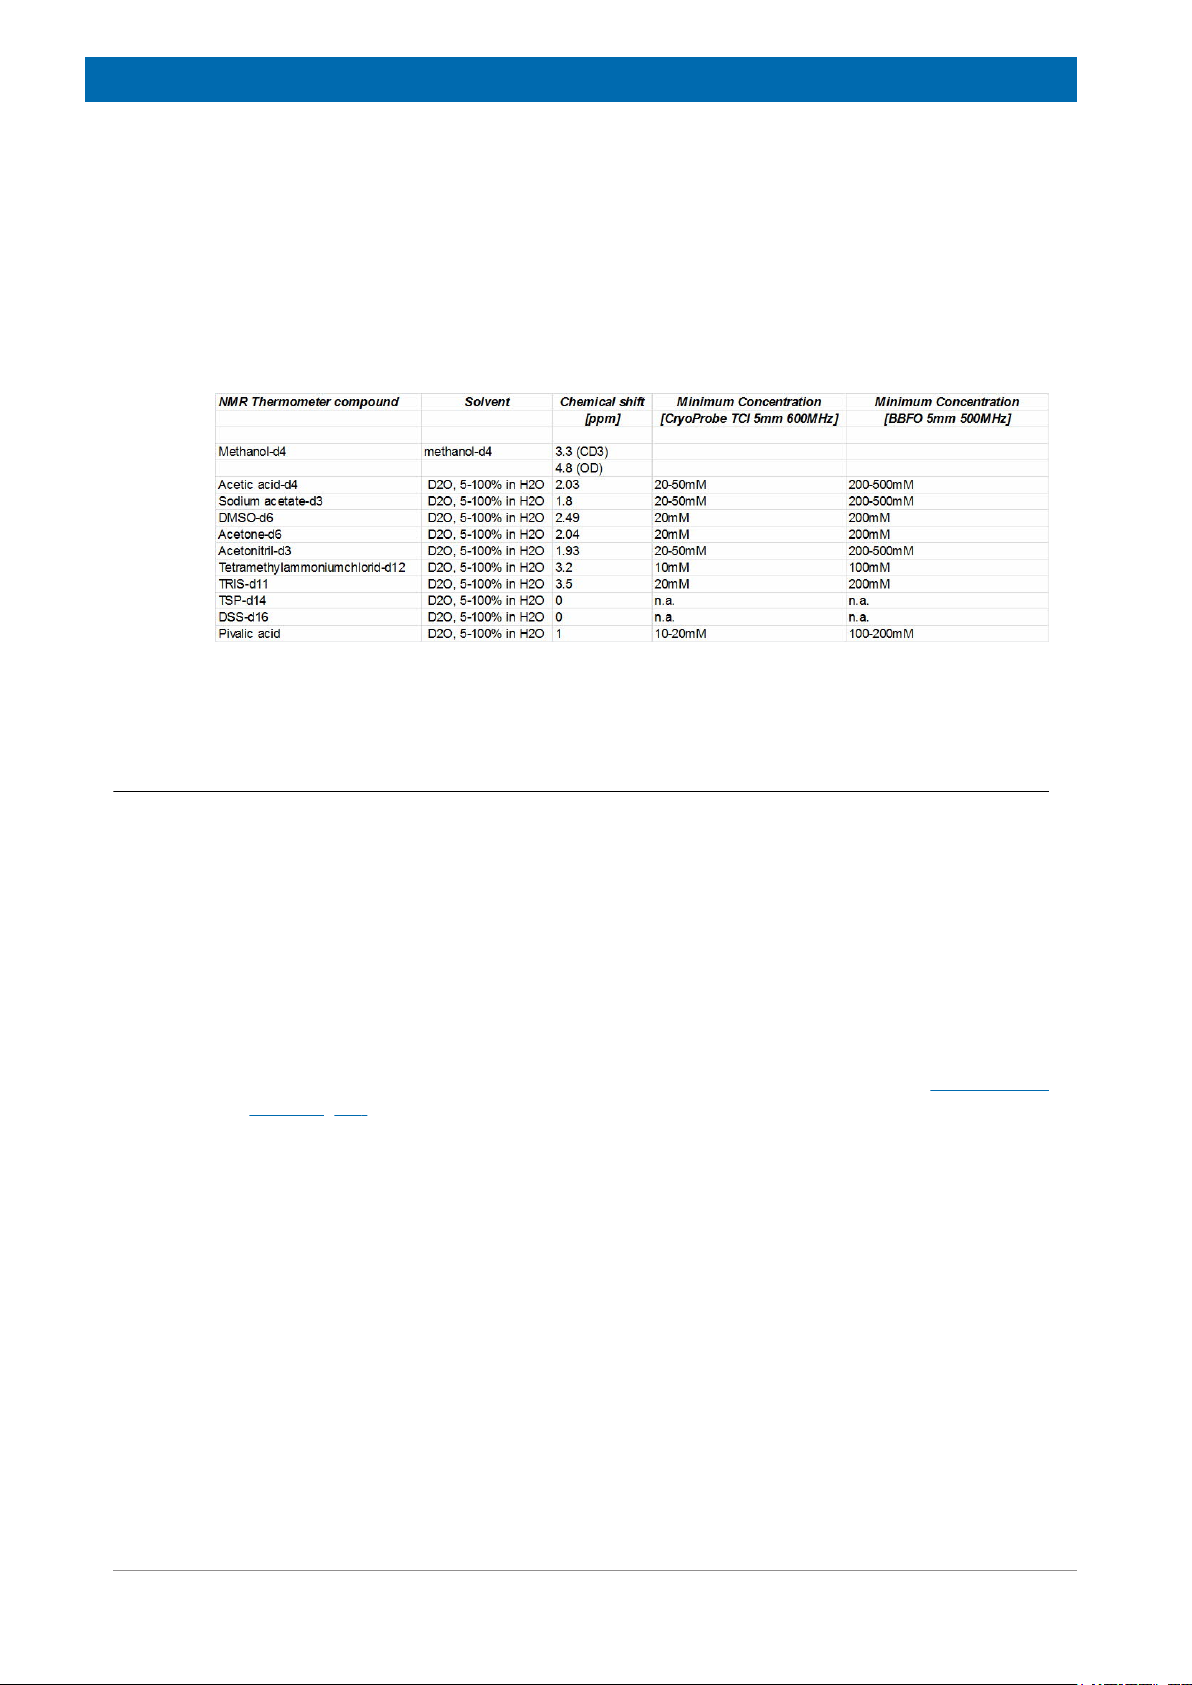
concentration of the NMR Thermometer compound therefore needs to be higher, as listed in
the following table:
5.2.3
Figure 5.8: Typical concentrations required for the NMR Thermometer compound. If the NMR
Thermometer compound is used with pure D2O as solvent, the higher concentration of the thermometer
compound is required due to the high dynamic range of the intensity of both lock compounds.
Considerations for Shimming with Topshim
Depending on the solvent, topshim will use 1H or 2H as a shim nucleus. For aqueous
solutions, e.g. 5% D2O in H2O, 1H is the shim nucleus, therefore the shim routine for Topshim
does not need to be changed. For deuterated organic solvents 2H is used as the shim
nucleus. If the solvent contains more than one 2H signal, like methanol-d4 and pyridine-d5,
Topshim will use a selective 2H pulse in order not to excite additional signals.
In the case where the thermometer compound is used together with an organic solvent, either
in a mixture with the solvent or as an external capillary, the shim routine has to be adapted. In
the following the procedure for the setup of the shimming routine for a new solvent is
described.
Two steps should be performed:
• Define a new solvent with edlock. The procedure is described in the section Define a New
Solvent [} 19] of this manual.
• Define the shimming routine for Topshim.
The command for defining the Topshim shim parameters is:
topshim solvcal solvent= <new solvent name as in edlock> where <new solvent name as
in edlock> is exactly the name of the solvent as defined in the lock/solvent table.
The following example will show the setup for a solvent called New.
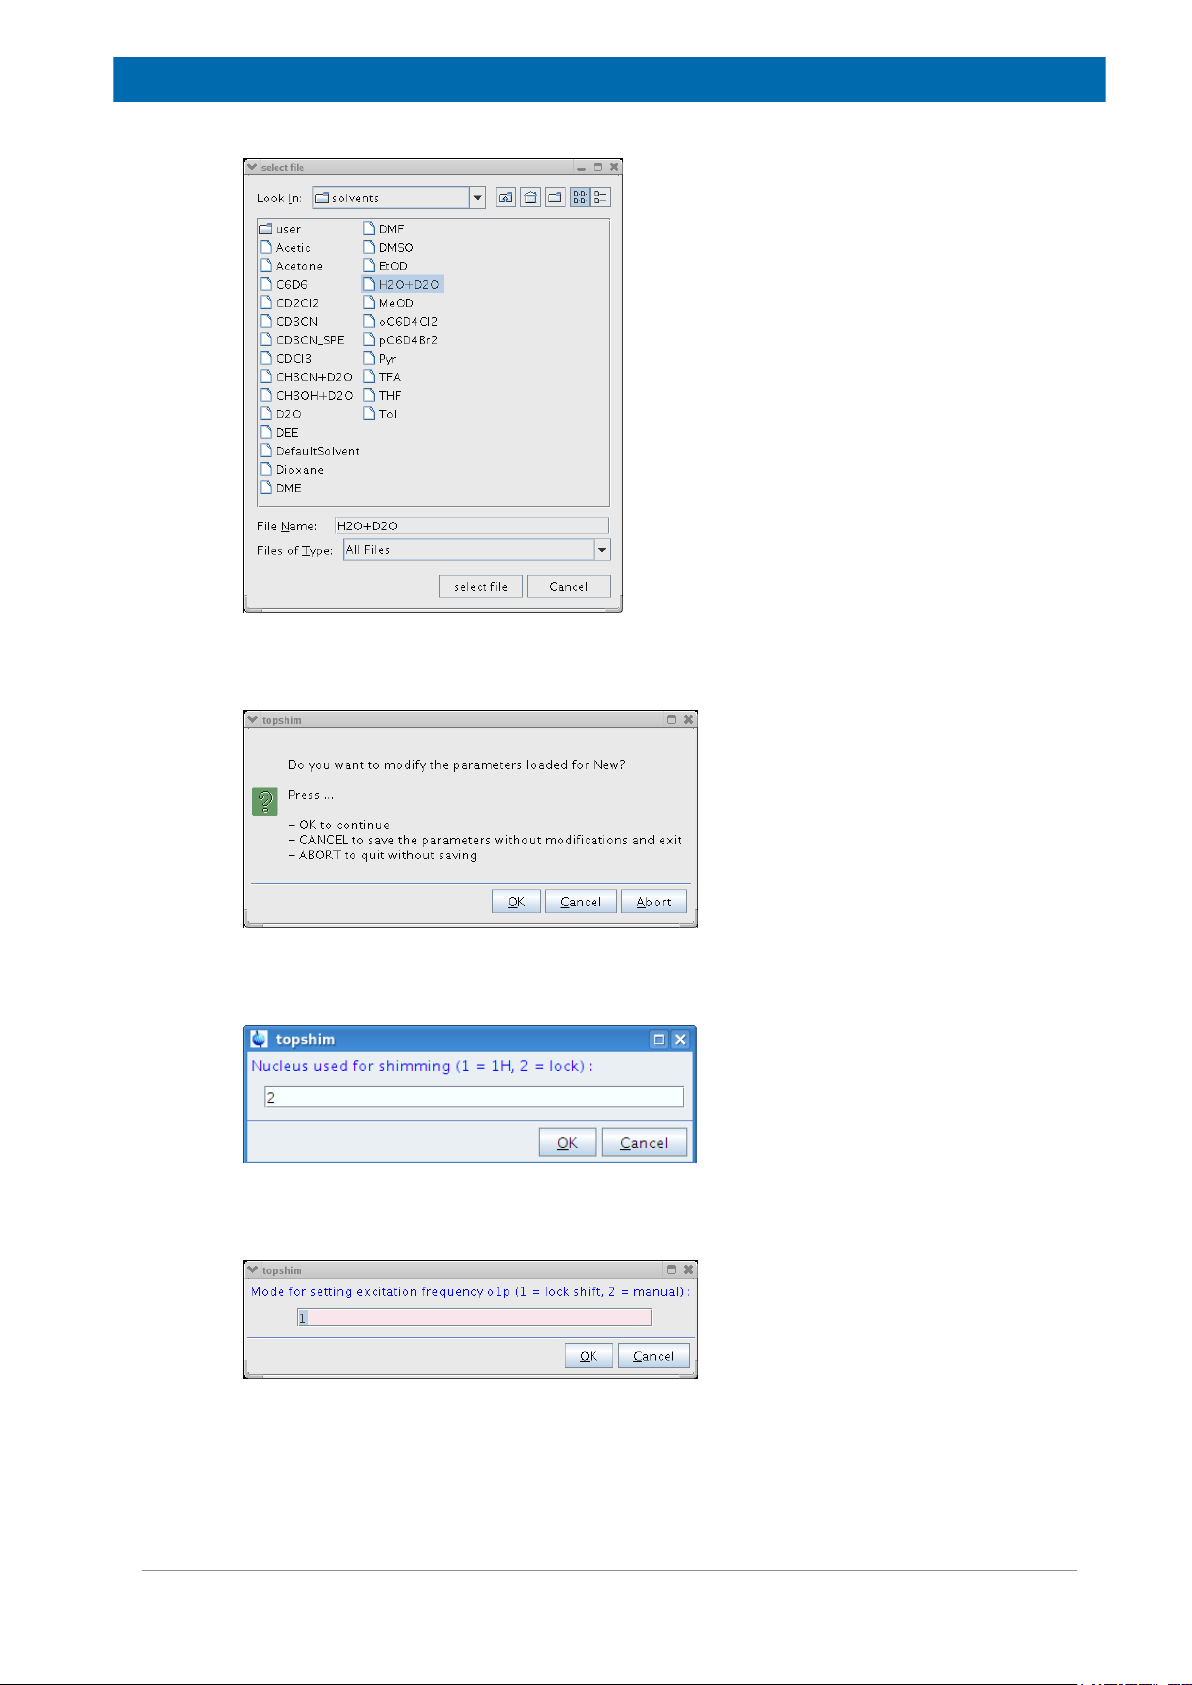
1. Enter the command topshim solvcal solvent=New. A window pops up allowing the
selection of a solvent. Here it is of no importance which solvent is selected:
24 Z33085_2_002
Page 25
Advanced Operation
2. Select the solvent of your choice and press the select file button. A new window will open,
select the OK button to modify the shim parameters:
3. A new window will open and allow the selection of the shim nucleus. Enter 2 for 2H as the
shim nucleus:
4. Now the frequency of the signal has to be defined. As default, the frequency of the field
lock solvent, which is the so-called lockshift, will be selected. Enter 1:
5. Enter 2 to activate the selective excitation:
Z33085_2_002 25
Page 26
Advanced Operation
6. The definition of the selectivity for selective excitation is entered next. This depends on the
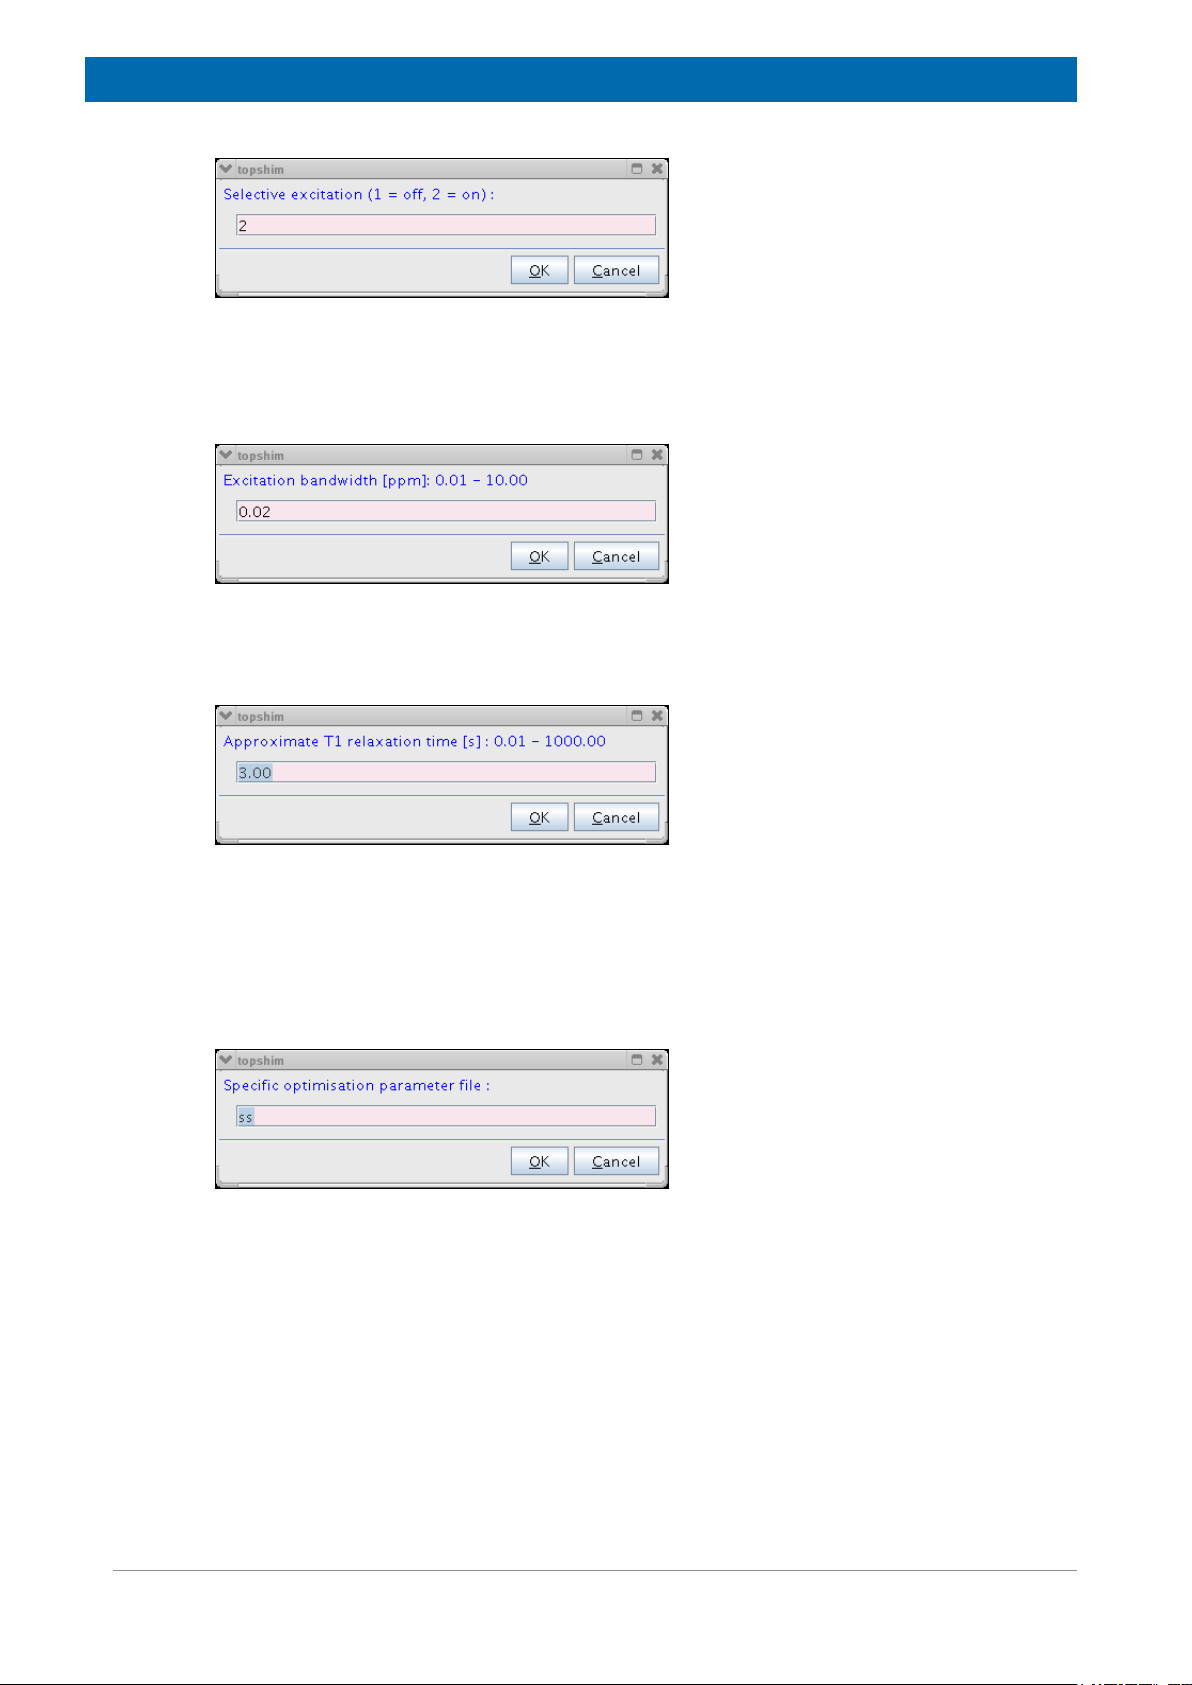
difference of the chemical shift of the field lock solvent to the next closest signal of the
thermometer compound. As an example, a selectivity of 0.5 ppm is sufficient for chemical
shift difference of 1ppm. For larger shift differences a selectivity of 1 ppm shall be used:
7. The T1 relaxation time of the shim nucleus is used to define the repetition time for the shim
procedure. Typical values for the T1 relaxation time are about 1 sec. for D2O, 3 sec for C6D
and 5 sec. for acetone-d6.
6
8. In a final step the optimization parameter has to be defined. There are three options:
• ss: Shims will be optimized for solvent suppression
• ls: Shims will be optimized for the line shape
• lshump: Shims will be optimized for narrow hump.
In the example shown here, solvents suppression has been selected:
Further details of the setup of a new solvent for shimming can be found in the Topshim
reference manual which can be accessed with the command help topshim in TopSpin.
26 Z33085_2_002
Page 27
Applications
6
6.1
Applications
Identical Chemical Shifts at Different Spectrometers
One of the most important applications of the NMR Thermometer is to use it as internal
temperature reference and correct the temperature offset between sample and the
temperature sensor of the probe. This is in general comparable to the conventional
temperature correction (described elsewhere) using the methanol sample (or other
temperature calibration samples) derived from two 1H spectra measured at two different
temperatures.
In the case of the NMR Thermometer you just insert the methanol sample (99.8% deuterated)
and after setting up the system (tuning/matching/shimming) the sample temperature is
displayed immediately. After enabling the NMR Thermometer the sample temperature can be
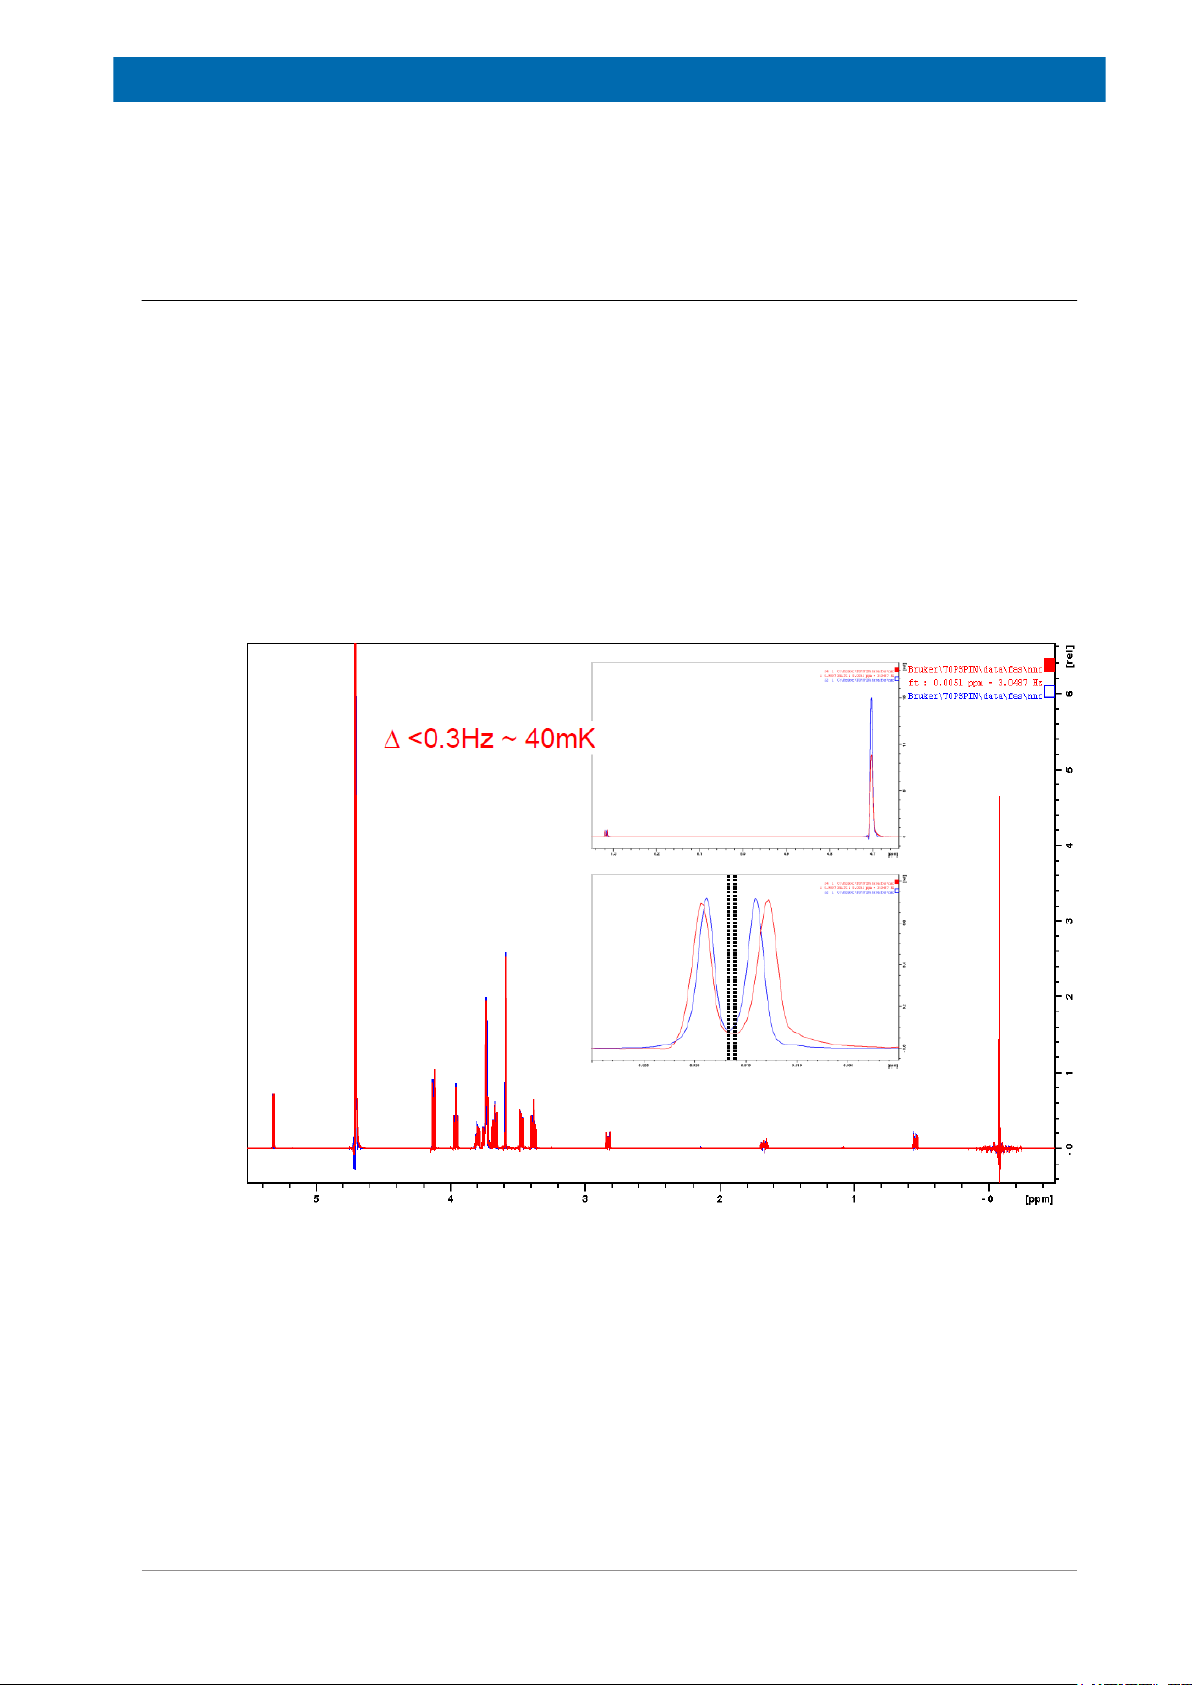
used as target temperature (edte). If the temperature is stable the sample is replaced by, for
example, 2 mM sucrose sample in 9:1 H2O/D2O and a 1H spectrum is acquired. Repeating
the same procedure at a second spectrometer leads to a very small shift difference
corresponding to a temperature difference of about 40 mK:
Figure 6.1: Overlay of a 1H spectrum of 2 mM sucrose (standard sample) measured at 600 MHz (TXI
probe) and 800 MHz (TCI CryoProbe).
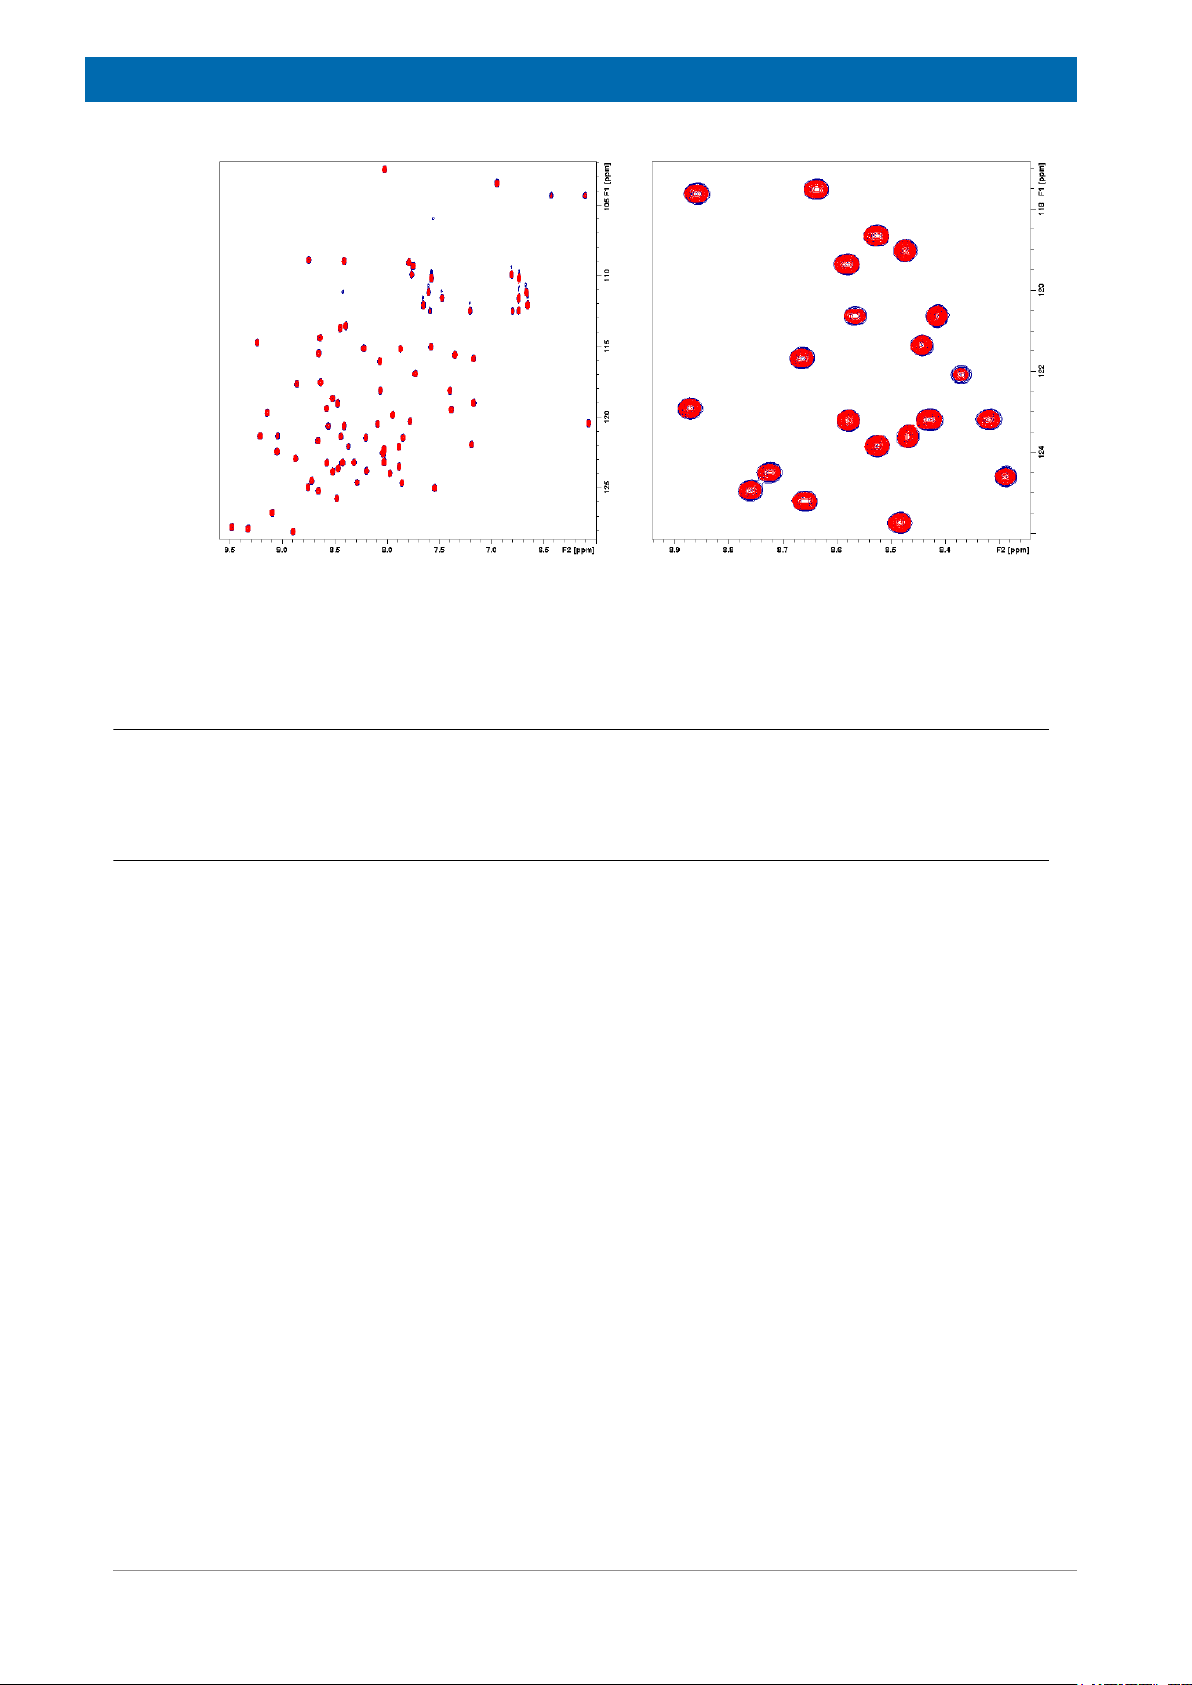
Changing the sample to a 0.5 mM ubiquitin sample in 9:1 H2O/D2O (figure below) nicely
shows the precision of the temperature correction obtained by the NMR Thermometer using
the methanol sample (99.8% deuterated) as temperature reference.
Z33085_2_002 27
Page 28
Applications
Figure 6.2: Overlay of 15N HSQC spectra (overview: left part) of 0.5 mM ubiquitin 9:1 H2O/D2O.
6.2
6.2.1
Identical Chemical Shifts for Experiments with Different Heating due to Experimental Conditions (Temperature Compensation)
The superior feature of the NMR Thermometer is the ability to compensate for sample
heating inside the sample due to different sources (RF heating, spinning speed, HR MAS).
RF Heating
RF heating inside the sample is caused by, for instance, a spinlock sequence as used in
TOCSY-type of pulse sequences, or decoupling as well as CPMG sequences. Such
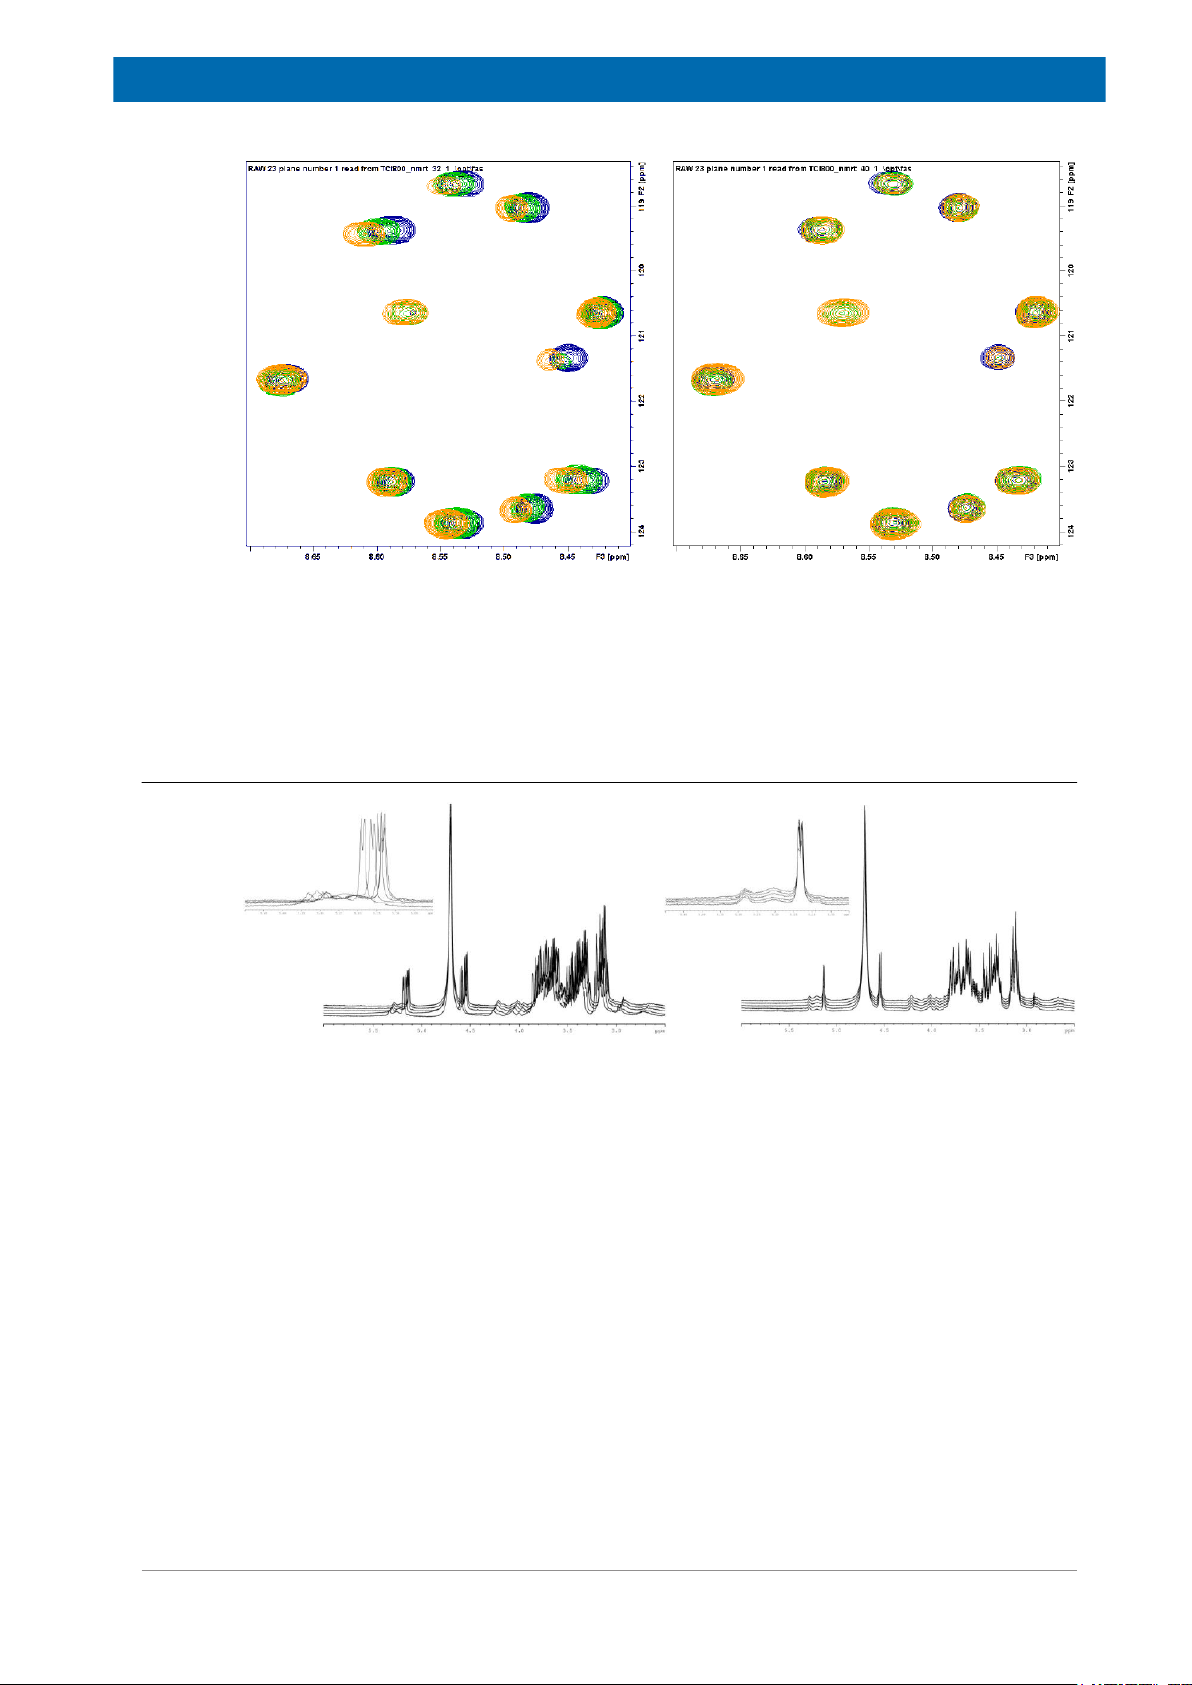
experiments are widely used in biomolecular NMR. As an example we show a 0.5 mM 13Cand 15N-labeled ubiquitin in H2O/D2O with sodium acetate-d3 added as NMR Thermometer
substance. In the example the 2D HSQC-planes of 3D NOESY-HSQC, TOCSY-HSQC and
CPMG-HSQC experiments are compared. Reference planes were measured without
temperature compensation (figure below, left part) and the others with NMR Thermometer in
the regulation mode (figure below, right part).
28 Z33085_2_002
Page 29
Applications
Figure 6.3: Overlay of NOESY-HSQC (blue), TOCSY-HSQC (orange) and CPMG-HSQC (green) spectra
of 0.5mM ubiquitin in 95:5% H2O/D2O measured at 800MHz TCI CP.
In the figure above the left side shows the NMR Thermometer disabled (monitoring mode)
and the right side the NMR Thermometer enabled (regulation mode).
6.2.2
Heating caused by Spinning Speed (HR-MAS)
Figure 6.4: 1H NMR spectra on a liver sample with sodium acetate added.
In the figure above, different spinning speeds were used (1, 2, 4, 6 and 8 kHz). Left part:
NMR Thermometer disabled (monitoring mode); Right part: NMR Thermometer enabled
(regulation mode).
An interesting application of the NMR Thermometer is high resolution MAS on biological
material. Depending on the spinning speed used in HR-MAS (1 to 8 kHz) the frictional
heating in the rotor is different and hence the temperature varies. To compensate for the
heating is not only of interest for the comparability of the spectra, but it is also important in
order to preserve sensitive sample material (like tissue material). The temperature difference
between sample and probe sensor can be as much as 5K in the case of 8 kHz spinning
speed.
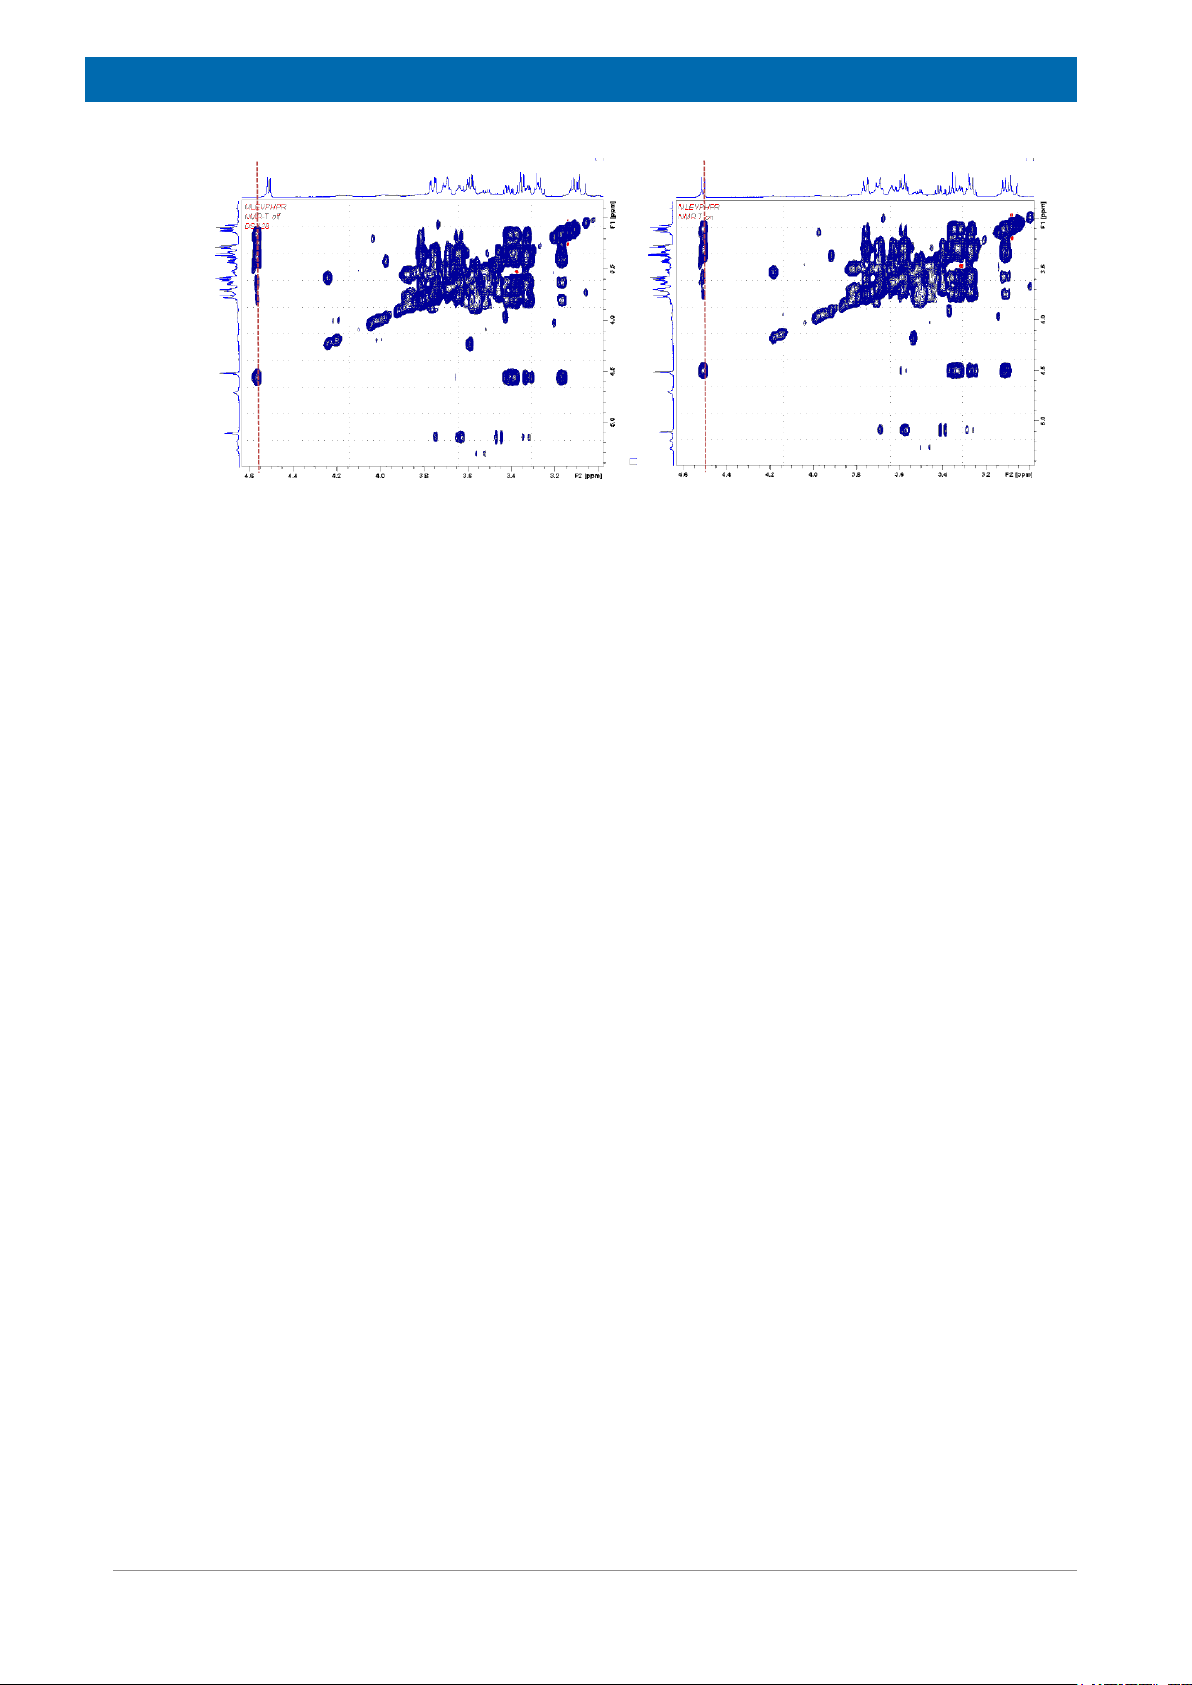
Applying a spin lock sequence (TOCSY) on top of that could increase the temperature even
further. Both heating effects can be compensated for by the NMR Thermometer:
Z33085_2_002 29
Page 30
Applications
Figure 6.5: Comparison of TOCSY experiments of a liver sample with sodium acetate added measured
with HR-MAS at 4 kHz spinning speed.
In the figure above is a comparison of TOCSY experiments of a liver sample with sodium
acetate added measured with HR-MAS at 4 kHz spinning speed. The reference 1H spectrum
is plotted as projection. Left part: NMR Thermometer disabled (monitoring mode); Right part:
NMR Thermometer enabled (regulation mode).
30 Z33085_2_002
Page 31

Frequently Asked Questions (FAQ)
7
Frequently Asked Questions
(FAQ)
The lock procedure works well with the solvent, but not with the frequency lock.
1. The wrong solvent has been selected and thus the frequency of the compound used for
the NMR Thermometer is out of range.
2. The concentration of the compound used for the NMR Thermometer is too low. Please
check table 1 and 2 which give typical concentrations required.
3. The lock power for the thermometer compound is too high or too low. Change the value
“Temperature Lock power” in the edlock table and repeat the lock procedure. The value of
the temperature lock power typically is a few dB lower than for the field lock power.
4. The chemical shift of the compound used for the NMR Thermometer is too closed to the
chemical shift of the solvent. Here it can happen that the lock procedure for both, the field
and the frequency lock, is working fine on a 700 MHz spectrometer, while it fails on a
lower field spectrometer due to the reduced shift difference (in Hz) at a lower field. In that
case a different thermometer compound has to be used.
The lock procedure worked well for field and frequency lock, but the temperature regulation of
the NMR Thermometer is instable.
• The lock power for the thermometer compound is too high. Reduce the value
“Temperature Lock power” in the edlock table and repeat the lock procedure. The value
for the temperature power typically is a few dB lower than for the field lock power.
Does the NMR Thermometer work when experiments with pulsed field gradients are
performed?
• Yes, like the field lock the NMR Thermometer can be used together with pulsed field
gradients. Both, the field and the frequency lock regulation are triggered with lock hold
commands of the pulse program. Lock hold commands are standard in all standard pulse
programs using pulsed field gradients.
After enabling the NMR Thermometer the temperature starts to increase/decrease or during
an experiment with RF heating (see above) temperature is decreasing?
• The chemical shift – temperature values in the edlock table for the particular solvent are
probably wrong for instance after creating an .xml file and using a positive sign for the
slope instead of a negative one.
Z33085_2_002 31
Page 32

Frequently Asked Questions (FAQ)
32 Z33085_2_002
Page 33

Contact
8
Manufacturer:
NMR Hotlines
Contact
Bruker BioSpin NMR
Silberstreifen
D-76287 Rheinstetten
Germany
Phone: +49 721-5161-6155
http://www.bruker.com
WEEE DE43181702
Contact our NMR service centers.
Bruker BioSpin NMR provide dedicated hotlines and service centers, so that our specialists
can respond as quickly as possible to all your service requests, applications questions,
software or technical needs.
Please select the NMR service center or hotline you wish to contact from our list available at:
http://www.bruker.com/service/information-communication/helpdesk.html
Z33085_2_002 33
Page 34

Contact
34 Z33085_2_002
Page 35

List of Figures
List of Figures
Figure 2.1 Principle of the NMR Thermometer............................................................................... 7
Figure 4.1 The Submenu Bar: Solvent........................................................................................... 11
Figure 4.2 Edit Solvent Parameters. .............................................................................................. 12
Figure 4.3 The Submenu Lock. ...................................................................................................... 12
Figure 4.4 Edit Lock Parameters.................................................................................................... 13
Figure 4.5 Edte Window: NMR Thermometer monitoring mode (disabled, top), regulation mode
(enabled, middle) and the selection of both modes in the Configuration menu of the
edte window (bottom)....................................................................................................
Figure 4.6 Selection of the Auto Phase Algorithm.......................................................................... 14
Figure 4.7 Selftune warning about PID parameters misfit.............................................................. 14
Figure 4.8 Starting the selftune procedure from the edte window.................................................. 15
Figure 4.9 Selftune in Progess. ...................................................................................................... 16
Figure 4.10 Monitoring several BSMS values during a temperature jump. ...................................... 17
Figure 4.11 TopSpin status bar with NMR Thermometer enabled. .................................................. 17
Figure 4.12 Monitoring of the sensor and the sample temperature in edte during a TOCSY
experiment .................................................................................................................... 18
Figure 5.1 Adding New Solvents. ................................................................................................... 19
Figure 5.2 Assign Signals to Type of Signal (Signal, Lock, Temperature)..................................... 20
Figure 5.3 Dialog for importing temperature shift value files. ......................................................... 20
Figure 5.4 Example of a shift-temperature file in .xml format......................................................... 20
Figure 5.5 Temperature shift values filled in. ................................................................................. 21
Figure 5.6 Suggested compounds for the NMR Thermometer and samples in aqueous solution
(D2O 5 – 100%), their properties and estimated concentration. Fully deuterated DSS
and TSP are currently not available but will be synthesized on Bruker’s request at
small amounts only for internal tests.............................................................................
Figure 5.7 Approximate dynamic range of field lock (blue) vs. the NMR Thermometer signal
(red) if the S/N of the frequency lock signal is sufficient (> 200:1)................................ 23
Figure 5.8 Typical concentrations required for the NMR Thermometer compound. If the NMR
Thermometer compound is used with pure D2O as solvent, the higher concentration
of the thermometer compound is required due to the high dynamic range of the
intensity of both lock compounds. .................................................................................
Figure 6.1 Overlay of a 1H spectrum of 2 mM sucrose (standard sample) measured at 600
MHz (TXI probe) and 800 MHz (TCI CryoProbe).......................................................... 27
Figure 6.2 Overlay of 15N HSQC spectra (overview: left part) of 0.5 mM ubiquitin 9:1 H2O/
D2O............................................................................................................................... 28
Figure 6.3 Overlay of NOESY-HSQC (blue), TOCSY-HSQC (orange) and CPMG-HSQC
(green) spectra of 0.5mM ubiquitin in 95:5% H2O/D2O measured at 800MHz TCI
CP. ................................................................................................................................
Figure 6.4 1H NMR spectra on a liver sample with sodium acetate added.................................... 29
Figure 6.5 Comparison of TOCSY experiments of a liver sample with sodium acetate added
measured with HR-MAS at 4 kHz spinning speed. ....................................................... 30
14
21
24
29
Z33085_2_002 35
Page 36

List of Figures
36 Z33085_2_002
Page 37

Index
Index
A
Absolute temperature correction ...................... 21
Aqueous solutions ............................................ 21
autophase......................................................... 14
B
Bio-NMR ........................................................... 21
Buffers .............................................................. 22
C
Chemical shift distance..................................... 23
Chemical shift of water ..................................... 21
Chemical shifts ................................................... 5
Compounds ...................................................... 22
D
Digilock 2G ......................................................... 9
Dynamic range ................................................. 23
O
Overview........................................................... 11
P
PID values ........................................................ 14
Predefined Solvents ......................................... 22
Principle.............................................................. 7
pulsed field gradients........................................ 31
R
RF heating .......................................................... 5
S
Salt effect.......................................................... 22
Selecting a suitable compound......................... 22
selftune ....................................................... 14, 15
Slope estimation ............................................... 21
SmartVT ............................................................. 9
Stabilizers ......................................................... 22
T
E
edlock ......................................................... 11, 20
edsolv ............................................................... 11
exercise ............................................................ 16
I
import shift and temperature values ................. 20
L
Lock parameters............................................... 12
lock phase ........................................................ 14
LTRX .................................................................. 7
M
Monitoring......................................................... 16
N
Thermometer substance..................................... 7
Topshim...................................................... 13, 24
V
VT control ......................................................... 11
X
xml files............................................................. 20
New solvent ...................................................... 19
NMR Thermometer compounds ....................... 21
Z33085_2_002 37
Page 38

Index
38 Z33085_2_002
Page 39

Z33085_2_002 39
Page 40

 Loading...