

Page 1

CONTENTS
Warranty .............................................................................................................................................1
Safety Information .............................................................................................................................2
Electrostatic Discharge Sensitive (ESDS) Device Handling ....................................................... 2
Specifications.................................................................................................................................... 3
Part List Notes ..................................................................................................................................3
Packaging Part List ...........................................................................................................................4
Figure 1. Packaging Exploded View ..................................................................................................4
Main Part List ....................................................................................................................................5
Figure 2. Panaray
Electrical Part Lists .................................................................................................................... 7-23
Main PCB Assembly .................................................................................................................... 7-21
Display PCB Assembly .............................................................................................................. 22-23
Disassembly Procedures ...............................................................................................................24
Test Procedures ....................................................................................................................... 25-29
Appendix .................................................................................................................................... 30-59
®
Bose
Bose Professional Loudspeaker EQ Preset Lists ................................................................ 42-55
Theory of Operation ................................................................................................................. 56-59
Main PCB Overview .......................................................................................................................56
Front Panel PCB Overview ...........................................................................................................56
Power Supply .................................................................................................................................. 57
DSP Circuit ......................................................................................................................................57
Analog/Digital Audio Routing ......................................................................................................... 58
Front Panel AVR Microprocessor ..................................................................................................58
Service Manual Revision History .................................................................................................60
Professional Loudspeaker Frequency Response Curves ....................................... 30-41
Figure 3. Panaray Platform Diagram .............................................................................................. 56
Figure 4. Block Diagram ................................................................................................................. 59
®
Digital Controller Exploded View ........................................................................ 6
CAUTION: The Bose Panaray Digital Controller
contains no user-serviceable parts. To prevent warranty infractions,
refer servicing to warranty service stations or factory service.
PROPRIETARY INFORMATION
THIS DOCUMENT CONTAINS PROPRIETARY INFORMATION OF
BOSE CORPORATION WHICH IS BEING FURNISHED ONLY FOR
THE PURPOSE OF SERVICING THE IDENTIFIED BOSE PRODUCT
BY AN AUTHORIZED BOSE SERVICE CENTER OR OWNER OF
THE BOSE PRODUCT, AND SHALL NOT BE REPRODUCED OR
USED FOR ANY OTHER PURPOSE.
WARRANTY
The Bose Panaray Digital Controller is covered by a limited 1-year transferable warranty.
1
Page 2

SAFETY INFORMATION
1. Parts that have special safety characteristics are identified by the symbol on schematics
or by special notes on the parts list. Use only replacement parts that have critical characteristics
recommended by the manufacturer.
2. Make leakage current or resistance measurements to determine that exposed parts are
acceptably insulated from the supply circuit before returning the unit to the customer.
Use the following checks to perform these measurements:
A. Leakage Current Hot Check-With the unit completely reassembled, plug the AC line cord
directly into a 120V AC outlet. (Do not use an isolation transformer during this test.) Use a leakage current tester or a metering system that complies with American National Standards Institute
(ANSI) C101.1 "Leakage Current for Appliances" and Underwriters Laboratories (UL) UL6500 /
UL60065 / IEC 60065 paragraph 9.1.1. With the unit AC switch first in the ON position and then in
OFF position, measure from a known earth ground (metal waterpipe, conduit, etc.) to all exposed metal parts of the unit (antennas, handle bracket, metal cabinet, screwheads, metallic
overlays, control shafts, etc.), especially any exposed metal parts that offer an electrical return
path to the chassis. Any current measured must not exceed 0.5 milliamp. Reverse the unit
power cord plug in the outlet and repeat test. ANY MEASUREMENTS NOT WITHIN THE LIMITS
SPECIFIED HEREIN INDICATE A POTENTIAL SHOCK HAZARD THAT MUST BE ELIMINATED
BEFORE RETURNING THE UNIT TO THE CUSTOMER.
B. Insulation Resistance Test Cold Check-(1) Unplug the power supply and connect a jumper
wire between the two prongs of the plug. (2) Turn on the power switch of the unit. (3) Measure
the resistance with an ohmmeter between the jumpered AC plug and each exposed metallic
cabinet part on the unit. When testing 3 wire products, the resistance measured to the product
enclosure should be between 2 and infinite MOhms. Also, the resistance measured to exposed
input/output connectors should be between 4 and infinite MOhms. When testing 2 wire products,
the resistance measured to exposed input/output connectors should be between 4 and infinite
MOhms. If it is not within the limits specified, there is the possibility of a shock hazard, and the
unit must be repaired and rechecked before it is returned to the customer.
ELECTROSTATIC DISCHARGE SENSITIVE (ESDS)
DEVICE HANDLING
This unit contains ESDS devices. We recommend the following precautions when repairing,
replacing, or transporting ESDS devices:
• Perform work at an electrically grounded work station.
• Wear wrist straps that connect to the station or heel straps that connect to conductive floor
mats.
• Avoid touching the leads or contacts of ESDS devices or PC boards even if properly
grounded. Handle boards by the edges only.
• Transport or store ESDS devices in ESD protective bags, bins, or totes. Do not insert unprotected devices into materials such as plastic, polystyrene foam, clear plastic bags, bubble
wrap or plastic trays.
2
Page 3

SPECIFICATIONS
A
Finish:
Dimensions:
Weight:
Impedance balanced:
Input level:
Maximum output level:
Input sensitivity:
D to A conversion:
D to A delay:
Dynamic range:
THD:
nodized aluminum front
plated and painted steel chassis
19" x 1.75" x 8.2" (483 x 44 x 195 mm)
4.1 lb (1.85 kg)
21 K Ohms
Minimum:
Maximum:
@9 dB headroom: -12 dBu to +9 dBu
0 dBu
+18 dBu
+18 dBu (balanced)
24 bit, 128 x oversampling bitstream
0.63 ms @ 44.1 kHz
100 dB typically, 20 Hz to 20 kHz
<94 dB (0.002%) @ 1 kHz +20 dBu output
Frequency response:
Crosstalk:
Mains voltage:
Power consumption:
20 Hz to 20 kHz: +0/-0.5 dB
-95 dB, 20 Hz to 20 kHz
100 to 240 VAC, 50 Hz to 60 Hz
(auto switching)
15W
PART LIST NOTES
1. This part is not normally available from Customer Service. Approval from the Field Service
Manager is required before ordering.
2. The individual parts located on the PCBs are listed in the Electrical Part List.
3. This part is critical for safety purposes. Failure to use a substitute replacement with the
same safety characteristics as the recommended replacement part might create shock, fire
and/or other hazards.
4. This part is referenced for informational purposes only. It is not stocked as a repair part. Refer
to the next higher assembly for a replacement part.
3
Page 4
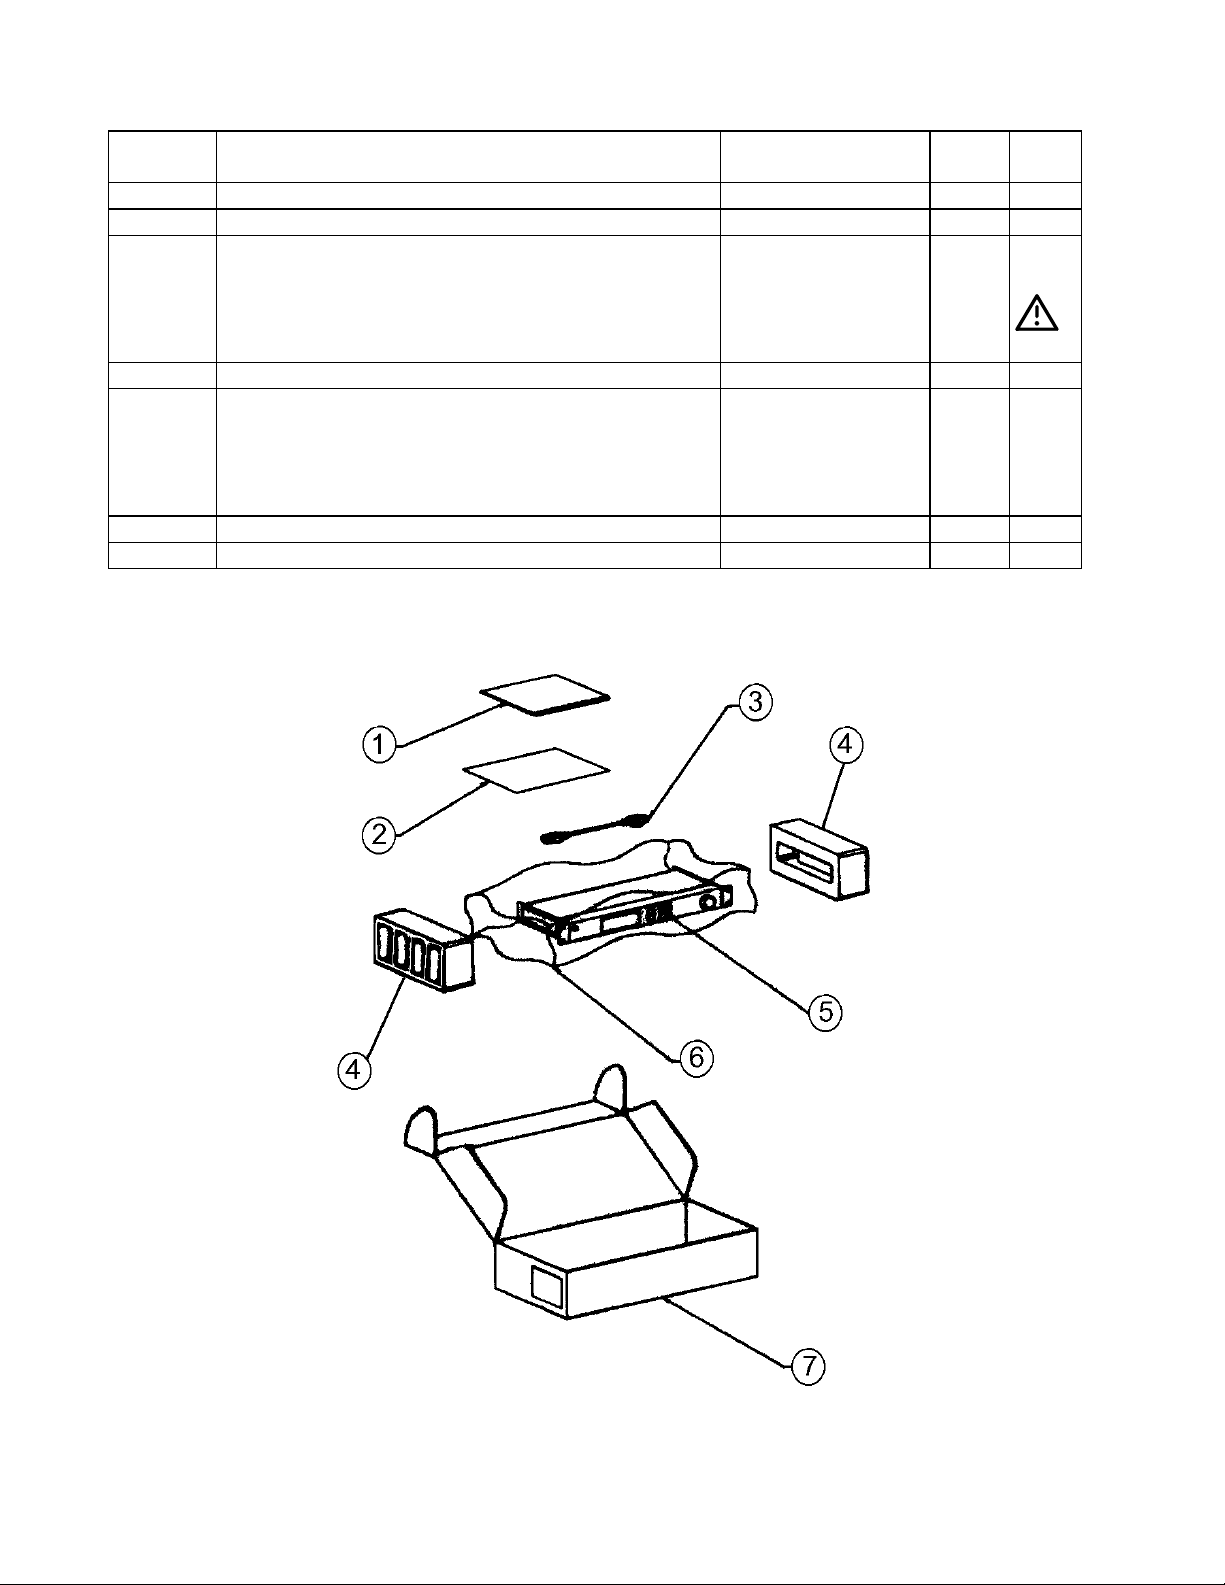
PACKAGING PART LIST
Item
Number
1 OWNER’S MANUAL 262330 1
2 SHEET, DECLARATION OF CONFORMITY 263578 1
3 POWER CORD, 120V (US/CANADA)
POWER CORD, 220V (EURO)
POWER CORD, 230V (UK/SING)
POWER CORD, 240V (AUS)
POWER CORD, 100V (JAPAN)
4 END CAP, PACKING 263651 2
5 PANARAY SYSTEM CONT, 120V (US/CAN)
PANARAY SYSTEM CONT, 220V (EURO)
PANARAY SYSTEM CONT, 230V (UK/SING)
PANARAY SYSTEM CONT, 240V (AUS)
PANARAY SYSTEM CONT, 100V (JAPAN)
6 POLYBAG 263652 1
7 CARTON 263653 1
Description Part
Number
263453-006
173352
173351
284241-006
173353
028021
028022
028023
028024
028025
Qty. Note
1 3
1
Figure 1. Packaging Exploded View
4
Page 5
MAIN PART LIST
Refer to Figure 2
Item
Number
1 SIDE PANEL SCREWS E56200101 268902 4
2 SIDE PANEL (RACK EARS) E58100301 268901 2
3 KNOB, ROTARY SWITCH E33800402 268903 1
4 FRONT PANEL E58201001 268904 1
5 TOP COVER E58100242 268905 1
6 FRONT PANEL PCB ASSY.
(INCLUDES DISPLAY PCB ASSY)
7 ROTARY SWITCH, ENCODER E34000301 268907 1
8 KNOB, POWER SWITCH E33800501 268908 1
9 SCREWS, TOP COVER (TOP) N/A --- 2 4
10 SCREW, TOP COVER (REAR) E56300201 268909 4
11 SCREW, CONNECTOR E56300201 268910 12
12 SCREW, DISPLAY PCB N/A --- 3 4
13 BUTTON ASSY., ARROWS E33901202 268911 1
14 CONSOLE, BUTTON ASSEMBLY E33800602 268912 1
15A BUTTON ASSY., PRESET E33904062 268913 1
15B BUTTON ASSY., UNITY E33900402 268914 1
15C BUTTON ASSY., LIMITER E33904072 268915 1
15D BUTTON ASSY., DELAY E33903202 268916 1
16 HARNESS, DISPLAY PCB N/A --- 1 4
17 POWER SUPPLY PCB ASSY E50000101 268917 1
18 SCREW, AC JACK E56300401 268918 2
18A SCREW, POWER SUPPLY PCB E56300101 268919 4
19 SCREW, MAIN PCB E56300101 268920 5
20 MAIN PCB ASSY B80110050 268921 1 2
21 DIN CONNECTOR E52200101 268922 1
22 XLR CONNECTOR, MALE E52200701 268923 4
23 XLR CONNECTOR, FEMALE E52200601 268924 2
- DISPLAY PCB ASSY. (THIS IS THE
DISPLAY PCB SECTION OF THE
FRONT PANEL PCB ASSY ONLY)
Description Vendor
Part
Number
B80721001 294111 1 2
B8072001 268906 1
Number
Bose
Part
Qty. Note
5
Page 6
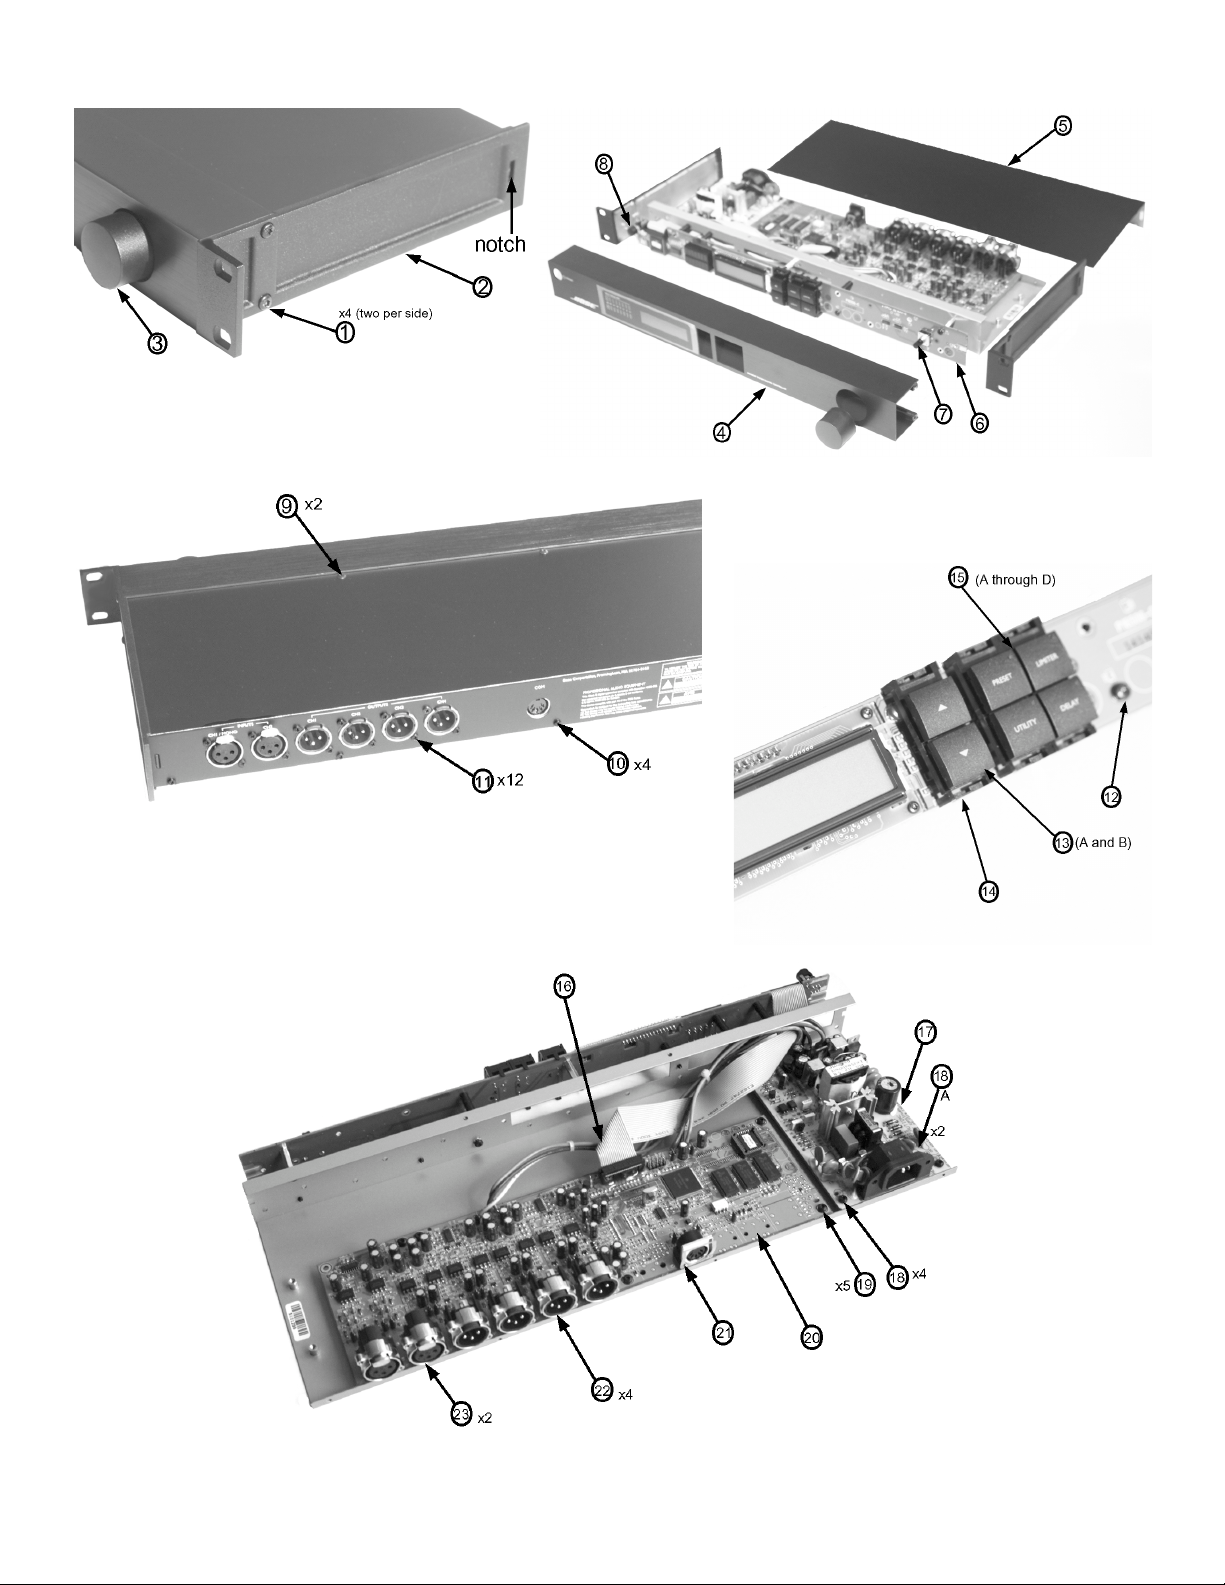
Figure 2. Panaray® Digital Controller Exploded View
6
Page 7

ELECTRICAL PART LIST
Main PCB Assembly
Resistors
Reference
Designator
R6 10K, 0805, 1/10W, 5% E15100201 133626-1035 4
R7 220 OHM, 0805, 1/10W, 5% E15100801 133626-2215 4
R8 220 OHM, 0805, 1/10W, 5% E15100801 133626-2215 4
R9 10K, 0805, 1/10W, 5% E15100201 133626-1035 4
R10 100 OHM, 0805, 1/10W, 5% E15100101 133625-1000 4
R11 820 OHM, 0805, 1/10W, 5% E15103601 133626-8215 4
R12 1.0K, 0805, 1/10W, 5% E15100701 133626-1025 4
R13 1.0K, 0805, 1/10W, 5% E15100701 133626-1025 4
R14 1.0K, 0805, 1/10W, 5% E15100701 133626-1025 4
R15 8.25K, 0805, 1/10W, 1% E15401301 133625-8251 4
R16 10K, 0805, 1/10W, 5% E15100201 133626-1035 4
R17 10K, 0805, 1/10W, 5% E15100201 133626-1035 4
R18 2.49K, 0805, 1/10W, 1% E15400501 133625-2491 4
R19 10K, 0805, 1/10W, 5% E15100201 133626-1035 4
R20 10K, 0805, 1/10W, 5% E15100201 133626-1035 4
R21 0 OHM, 0805, 1/10W, 5% E15103701 133627 4
R22 10K, 0805, 1/10W, 5% E15100201 133626-1035 4
R23 10K, 0805, 1/10W, 5% E15100201 133626-1035 4
R24 5.11K, 0805, 1/10W, 1% E15401101 133625-5111 4
R25 8.25K, 0805, 1/10W, 1% E15401301 133625-8251 4
R26 340 OHM, 0805, 1/10W, 1% E15400701 133625-3400 4
R27 340 OHM, 0805, 1/10W, 1% E15400701 133625-3400 4
R28 5.11K, 0805, 1/10W, 1% E15401101 133625-5111 4
R29 506 OHM, 0805, 1/10W, 5% E15103501 - 4
R30 10K, 0805, 1/10W, 5% E15100201 133626-1035 4
R31 2.49K, 1206, 1/4W, 5% E15500201 124894-2491 4
R32 10K, 0805, 1/10W, 5% E15100201 133626-1035 4
R33 2.49K, 1206, 1/4W, 5% E15500201 124894-2491 4
R34 2.49K, 1206, 5% E15500201 124894-2491 4
R35 1.50K, 0805, 1/10W, 1% E15400401 133625-1501 4
R36 909 OHM, MET FILM, 1/4W, 1% E10400101 - 4
R37 909K, METAL FILM, 1/4W, 1% E10400201 - 4
R38 3.32K, 0805, 1/10W, 1% E15401801 133625-3321 4
R39 3.32K, 0805, 1/10W, 1% E15401801 133625-3321 4
R40 909K, METAL FILM, 1/4W, 1% E10400201 - 4
R41 220 OHM, 0805, 1/10W, 5% E15100801 133626-2215 4
R42 499 OHM, 0805, 1/10W, 1% E15400901 133625-4990 4
R43 1.0K, 0805, 1/10W, 5% E15100701 133626-1025 4
R44 100 OHM, 0805, 1/10W, 5% E15100101 133625-1000 4
R45 100 OHM, 0805, 1/10W, 5% E15100101 133625-1000 4
R46 1.0K, 0805, 1/10W, 5% E15100701 133626-1025 4
R47 220 OHM, 0805, 1/10W, 5% E15100801 133625-2210 4
R48 499 OHM, 0805, 1/10W, 1% E15400901 133625-4990 4
R49 1.50K, 0805, 1/10W, 1% E15400401 133625-1501 4
Description Vendor
Part Number
Part Number
Bose
Note
7
Page 8

ELECTRICAL PART LIST
Main PCB Assembly
Resistors (continued)
Reference
Designator
R50 909K, METAL FILM, 1/4W, 1% E10400201 - 4
R51 3.32K, 0805, 1/10W, 1% E15401801 133625-3321 4
R52 909K, METAL FILM, 1/4W, 1% E10400201 - 4
R53 3.32K, 0805, 1/10W, 1% E15401801 133625-3321 4
R54 909 OHM, MET FILM, 1/4W, 1% E10400101 - 4
R55 10.0K, 0805, 1/10W, 1% E15400101 133625-1002 4
R56 100 OHM, 0805, 1/10W, 5% E15100101 133625-1000 4
R57 2.80K, 0805, 1/10W, 1% E15400601 133625-2801 4
R58 39K, 0805, 1/10W, 5% E15102801 - 4
R59 10K, 0805, 1/10W, 5% E15100201 133626-1035 4
R60 1.0K, 0805, 1/10W, 5% E15100701 133626-1025 4
R61 909 OHM, MET FILM, 1/4W, 1% E10400101 - 4
R62 909 OHM, MET FILM, 1/4W, 1% E10400101 - 4
R63 2.49K, 1206, 1/4W, 5% E15500201 124894-2491 4
R64 0 OHM, 0805, 1/10W, 5% E15103701 133627 4
R66 3.74K, 0805, 1% E15400801 133625-3741 4
R67 5.11K, 0805, 1% E15401101 133625-5111 4
R68 5.11K, 0805, 1% E15401101 133625-5111 4
R69 340 OHM, 0805, 1% E15400701 133625-3400 4
R70 8.25K, 0805, 1/10W, 1% E15401301 133625-8251 4
R71 340 OHM, 0805, 1/10W, 1% E15400701 133625-3400 4
R72 8.25K, 0805, 1/10W, 1% E15401301 133625-8251 4
R73 4.99K, 0805, 1/10W, 1% E15401001 133625-4991 4
R74 220 OHM, 0805, 1/10W, 5% E15100801 133626-2215 4
R75 3.74K, 0805, 1/10W, 1% E15400801 133625-3741 4
R76 0 OHM, 0805, 1/10W, 5% E15103701 133627 4
R78 2.49K, 1206, 1/4W, 5% E15500201 124894-2491 4
R79 4.99K, 0805, 1/10W, 5% E15500301 133625-4991 4
R80 2.49K, 1206, 1/4W, 5% E15500201 124894-2491 4
R81 38.3K, 1206, 1/10W, 1% E15500101 133625-3832 4
R82 1.50K, 0805, 1/10W, 1% E15400401 133625-1501 4
R83 1.50K, 0805, 1/10W, 1% E15400401 133625-1501 4
R84 38.3K, 1206, 1/10W, 1% E15500101 133625-3832 4
R85 4.99K, 0805, 1/10W, 5% E15500301 133625-4991 4
R86 2.49K, 1206, 1/4W, 5% E15500201 124894-2491 4
R87 2.49K, 1206, 1/4W, 5% E15500201 124894-2491 4
R88 2.49K, 1206, 1/4W, 5% E15500201 124894-2491 4
R89 2.49K, 1206, 1/4W, 5% E15500201 124894-2491 4
R90 2.49K, 1206, 1/4W, 5% E15500201 124894-2491 4
R91 2.49K, 1206, 1/4W, 5% E15500201 124894-2491 4
R92 2.49K, 1206, 1/4W, 5% E15500201 124894-2491 4
R93 1.50K, 0805, 1/10W, 1% E15400401 133625-1501 4
R94 220 OHM, 0805, 1/10W, 5% E15100801 133626-2215 4
R95 4.99K, 0805, 1/10W, 5% E15500301 133625-4991 4
R96 1.0K, 0805, 1/10W, 5% E15100701 133626-1025 4
R97 38.3K, 0805, 1/10W, 1% E15500101 133625-3832 4
Description Vendor
Part Number
Part Number
Bose
Note
8
Page 9

ELECTRICAL PART LIST
Main PCB Assembly
Resistors (continued)
Reference
Designator
R98 2.49K, 1206, 1/4W, 5% E15500201 124894-2491 4
R99 2.49K, 1206, 1/4W, 5% E15500201 124894-2491 4
R100 4.99K, 0805, 1/10W, 1% E15401001 133625-4991 4
R101 3.74K, 0805, 1/10W, 1% E15400801 133625-3741 4
R102 1.0K, 0805, 1/10W, 5% E15100701 133626-1025 4
R103 4.99K, 0805, 1/10W, 5% E15500301 133625-4991 4
R104 38.3K, 1206, 1/10W, 1% E15500101 133625-3832 4
R105 2.49K, 0805, 1/10W, 1% E15400501 133625-2491 4
R106 1.24K, 0805, 1/10W, 1% E15400201 133625-1211 4
R107 634 OHM, 0805, 1/10W, 1% E15401201 133625-6340 4
R108 634 OHM, 0805, 1/10W, 1% E15401201 133625-6340 4
R109 2.49K, 0805, 1/10W, 1% E15400501 133625-2491 4
R110 1.24K, 0805, 1/10W, 1% E15400201 133625-1211 4
R111 634 OHM, 0805, 1/10W, 1% E15401201 133625-6340 4
R112 634 OHM, 0805, 1/10W, 1% E15401201 133625-6340 4
R113 1.0K, 0805, 1/10W, 5% E15100701 133626-1025 4
R114 4.7 OHM, 0805, 1/10W, 5% E15102501 133626-4R75 4
R115 62 OHM, 1/2W, 5%, LEADED E10000101 - 4
R116 220 OHM, 0805, 1/10W, 5% E15100801 133626-2215 4
R117 1.0K, 0805, 1/10W, 5% E15100701 133626-1025 4
R118 1.0K, 0805, 1/10W, 5% E15100701 133626-1025 4
R119 1.0K, 0805, 1/10W, 5% E15100701 133626-1025 4
R120 1.0K, 0805, 1/10W, 5% E15100701 133626-1025 4
R121 1.0K, 0805, 1/10W, 5% E15100701 133626-1025 4
R122 10K, 0805, 1/10W, 5% E15100201 133625-1035 4
R123 220 OHM, 0805, 1/10W, 5% E15100801 133626-2215 4
R124 2.80K, 0805, 1/10W, 1% E15400601 133625-2801 4
R125 2.80K, 0805, 1/10W, 1% E15400601 133625-2801 4
R126 2.80K, 0805, 1/10W, 1% E15400601 133625-2801 4
R127 2.80K, 0805, 1/10W, 1% E15400601 133625-2801 4
R128 1.50K, 0805, 1/10W, 1% E15400401 133625-1501 4
R129 412K, 0805, 1/10W, 1% E15401701 - 4
R130 221K, 0805, 1/10W, 1% E15401501 133625-2213 4
R131 221K, 0805, 1/10W, 1% E15401501 133625-2213 4
R132 604K, 0805, 1/10W, 1% E15401601 133625-6043 4
R133 604K, 0805, 1/10W, 1% E15401601 133625-6043 4
R134 6.8K, 0805, 1/10W, 5% E15101701 133626-6825 4
R135 6.8K, 0805, 1/10W, 5% E15101701 133626-6825 4
R136 2.2K, 0805, 1/10W, 5% E15101101 133626-2225 4
R137 2.2K, 0805, 1/10W, 5% E15101101 133626-2225 4
R138 2.2K, 0805, 1/10W, 5% E15101101 133626-2225 4
R139 2.2K, 0805, 1/10W, 5% E15101101 133626-2225 4
R140 2.80K, 0805, 1/10W, 1% E15400601 133625-2801 4
R141 2.80K, 0805, 1/10W, 1% E15400601 133625-2801 4
R142 2.80K, 0805, 1/10W, 1% E15400601 133625-2801 4
R143 2.80K, 0805, 1/10W, 1% E15400601 133625-2801 4
Description Vendor
Part Number
Part Number
Bose
Note
9
Page 10

ELECTRICAL PART LIST
Main PCB Assembly
Resistors (continued)
Reference
Designator
R144 1.50K, 0805, 1/10W, 1% E15400401 133625-1501 4
R145 4.7 OHM, 0805, 1/10W, 5% E15102501 133626-4R75 4
R146 10K, 0805, 1/10W, 5% E15100201 133625-1035 4
R147 340 OHM, 0805, 1/10W, 1% E15400701 133625-3400 4
R148 10K, 0805, 1/10W, 5% E15100201 133626-1035 4
R151 10M, 0805, 1/10W, 5% E15102601 133626-1065 4
R152 82 OHM, 0805, 1/10W, 5% E15102301 - 4
R154 100 OHM, 0805, 1/10W, 5% E15100101 133625-1000 4
R155 412K, 0805, 1/10W, 1% E15401701 - 4
R156 2.2K, 0805, 1/10W, 5% E15101101 133626-2225 4
R165 2.2K, 0805, 1/10W, 5% E15101101 133626-2225 4
R166 0 OHM, 0805, 1/10W, 5% E15103701 133627 4
R167 0 OHM, 0805, 1/10W, 5% E15103701 133627 4
R170 62 OHM, 1/2W, 5%, LEADED E10000101 - 4
R171 412K, 0805, 1/10W, 1% E15401701 - 4
R172 221K, 0805, 1/10W, 1% E15401501 133625-2213 4
R173 412K, 0805, 1/10W, 1% E15401701 - 4
R174 221K, 0805, 1/10W, 1% E15401501 133625-2213 4
R175 82 OHM, 0805, 1/10W, 5% E15102301 - 4
R176 82 OHM, 0805, 1/10W, 5% E15102301 - 4
R177 0 OHM, 0805, 1/10W, 5% E15103701 133627 4
R178 10K, 0805, 1/10W, 5% E15100201 133626-1035 4
R179 10K, 0805, 1/10W, 5% E15100201 133626-1035 4
R180 10K, 0805, 1/10W, 5% E15100201 133626-1035 4
R182 33 OHM, 0805, 1/10W, 5% E15103401 133626-3305 4
R184 2.49K, 1206, 5% E15500201 124894-2491 4
R185 604K, 0805, 1/10W, 1% E15401601 133625-6043 4
R186 604K, 0805, 1/10W, 1% E15401601 133625-6043 4
R187 82 OHM, 0805, 1/10W, 5% E15102301 - 4
R191 10K, 0805, 1/10W, 5% E15100201 133626-1035 4
R192 10K, 0805, 1/10W, 5% E15100201 133626-1035 4
R193 10K, 0805, 1/10W, 5% E15100201 133626-1035 4
R195 6.8K, 0805, 1/10W, 5% E15101701 133626-6825 4
R196 6.8K, 0805, 1/10W, 5% E15101701 133626-6825 4
R197 100 OHM, 0805, 1/10W, 5% E15100101 133625-1000 4
R198 10K, 0805, 51/10W, % E15100201 133626-1035 4
R202 82 OHM, 0805, 1/10W, 5% E15102301 - 4
R203 2.2K, 0805, 1/10W, 5% E15101101 133626-2225 4
R205 2.49K, 1206, 1/4W, 5% E15500201 124894-2491 4
R207 2.2K, 0805, 1/10W, 5% E15101101 133626-2225 4
R208 2.2K, 0805, 1/10W, 5% E15101101 133626-2225 4
R209 10K, 0805, 1/10W, 5% E15100201 133626-1035 4
R210 100K, 0805, 1/10W, 5% E15102001 133626-1045 4
R211 100K, 0805, 1/10W, 5% E15102001 133626-1045 4
R212 10M, 0805, 1/10W, 5% E15102601 133626-1065 4
R213 10M, 0805, 1/10W, 5% E15102601 133626-1065 4
Description Vendor
Part Number
Part Number
Bose
Note
10
Page 11

ELECTRICAL PART LIST
Main PCB Assembly
Resistors (continued)
Reference
Designator
R214 2.49K, 1206, 1/4W, 5% E15500201 124894-2491 4
R219 2.49K, 1206, 1/4W, 5% E15500201 124894-2491 4
R220 2.2K, 0805, 1/10W, 5% E15101101 133626-2225 4
R221 2.2K, 0805, 1/10W, 5% E15101101 133626-2225 4
R222 2.2K, 0805, 1/10W, 5% E15101101 133626-2225 4
R223 2.2K, 0805, 1/10W, 5% E15101101 133626-2225 4
R224 8.25K, 0805, 1/10W, 1% E15401301 133625-8251 4
R225 5.11K, 0805, 1/10W, 1% E15401101 133625-5111 4
R226 8.25K, 0805, 1/10W, 1% E15401301 133625-8251 4
R227 340 OHM, 0805, 1/10W, 1% E15400701 133625-3400 4
R228 340 OHM, 0805, 1/10W, 1% E15400701 133625-3400 4
R229 5.11K, 0805, 1/10W, 1% E15401101 133625-5111 4
R230 5.11K, 0805, 1/10W, 1% E15401101 133625-5111 4
R231 5.11K, 0805, 1/10W, 1% E15401101 133625-5111 4
R232 340 OHM, 0805, 1/10W, 1% E15400701 133625-3400 4
R233 8.25K, 0805, 1/10W, 1% E15401301 133625-8251 4
R234 340 OHM, 0805, 1/10W, 1% E15400701 133625-3400 4
R235 8.25K, 0805, 1/10W, 1% E15401301 133625-8251 4
R236 4.99K, 0805, 1/10W, 1% E15401001 133625-4991 4
R237 3.74K, 0805, 1/10W, 1% E15400801 133625-3741 4
R238 2.49K, 1206, 1/4W, 5% E15500201 124894-2491 4
R239 2.49K, 1206, 1/4W, 5% E15500201 124894-2491 4
R240 4.99K, 0805, 1/10W, 5% E15500301 133625-4991 4
R241 2.49K, 1206, 1/4W, 5% E15500201 124894-2491 4
R242 38.3K, 0805, 1/10W, 1% E15500101 133625-3832 4
R243 1.50K, 0805, 1/10W, 1% E15400401 133625-1501 4
R244 1.50K, 0805, 1/10W, 1% E15400401 133625-1501 4
R245 38.3K, 0805, 1/10W, 1% E15500101 133625-3832 4
R246 4.99K, 0805, 1/10W, 5% E15500301 133625-4991 4
R247 2.49K, 1206, 1/4W, 5% E15500201 124894-2491 4
R248 2.49K, 1206, 1/4W, 5% E15500201 124894-2491 4
R249 2.49K, 1206, 1/4W, 5% E15500201 124894-2491 4
R250 2.49K, 1206, 1/4W, 5% E15500201 124894-2491 4
R251 2.49K, 1206, 1/4W, 5% E15500201 124894-2491 4
R252 2.49K, 1206, 1/4W, 5% E15500201 124894-2491 4
R253 2.49K, 1206, 1/4W, 5% E15500201 124894-2491 4
R254 1.50K, 0805, 1/10W, 1% E15400401 133625-1501 4
R255 4.99K, 0805, 1/10W, 5% E15500301 133625-4991 4
R256 38.3K, 0805, 1/10W, 1% E15500101 133625-3832 4
R257 2.49K, 1206, 1/4W, 5% E15500201 124894-2491 4
R258 2.49K, 1206, 1/4W, 5% E15500201 124894-2491 4
R259 4.99K, 0805, 1/10W, 1% E15401001 133625-4991 4
R260 3.74K, 0805, 1/10W, 1% E15400801 133625-3741 4
R261 4.99K, 1206, 1/10W, 5% E15500301 133625-4991 4
R262 38.3K, 1206, 1/10W, 1% E15500101 133625-3832 4
R263 2.49K, 0805, 1/10W, 1% E15400501 133625-2491 4
Description Vendor
Part Number
Part Number
Bose
Note
11
Page 12
ELECTRICAL PART LIST
Main PCB Assembly
Resistors (continued)
Reference
Designator
R264 1.24K, 0805, 1/10W, 1% E15400201 133625-1211 4
R265 634 OHM, 0805, 1/10W, 1% E15401201 133625-6340 4
R266 634 OHM, 0805, 1/10W, 1% E15401201 133625-6340 4
R267 2.49K, 0805, 1/10W, 1% E15400501 133625-2491 4
R268 1.24K, 0805, 1/10W, 1% E15400201 133625-1211 4
R269 634 OHM, 0805, 1/10W, 1% E15401201 133625-6340 4
R270 634 OHM, 0805, 1/10W, 1% E15401201 133625-6340 4
R271 10K, 0805, 1/10W, 5% E15100201 133626-1035 4
R272 10K, 0805, 1/10W, 5% E15100201 133626-1035 4
R273 10K, 0805, 1/10W, 5% E15100201 133626-1035 4
R274 10K, 0805, 1/10W, 5% E15100201 133626-1035 4
R275 0 OHM, 0805, 1/10W, 5% E15103701 133627 4
R276 0 OHM, 0805, 1/10W, 5% E15103701 133627 4
R277 0 OHM, 0805, 1/10W, 5% E15103701 133627 4
W1 33 OHM, 0805, 1/10W, 5% E15103401 133626-3305 4
Description Vendor
Part Number
Capacitors
Part Number
Bose
Note
Reference
Designator
C1 100nF, 0805, 10% E25301801 - 4
C2 100nF, 0805, 10% E25301801 - 4
C3 100nF, 0805, 10% E25301801 - 4
C4 100nF, 0805, 10% E25301801 - 4
C7 2.2nF, 0805, 5% E25200201 - 4
C8 470pF, 0805, 5% E25200101 133622-471 4
C8 470pF, 0805, 5% E25200101 133622-471 4
C10 470pF, 0805, 5% E25200101 133622-471 4
C11 39pF, 0805, 5% E25301601 133622-390 4
C12 39pF, 0805, 5% E25301601 133622-390 4
C14 100nF, 1206, +80/-20% E25500301 - 4
C15 10uF, EL, 85OC, 25V, 20% E22000101 149948-100E 4
C16 100nF, 0805, 10% E25301801 - 4
C20 220pF, 1206, % E25500201 133622-221 4
C21 220pF, 1206, % E25500201 133622-221 4
C22 470pF, 0805, 5% E25200101 133622-471 4
C23 470pF, 0805, 5% E25200101 133622-471 4
C24 47pF, 0805, 5% E25300501 133622-470 4
C25 47pF, 0805, 5% E25300501 133622-470 4
C26 2.2nF, 0805, 5% E25200201 - 4
C27 4.7nF, 0805, 5% E25301301 - 4
C28 2.2nF, 0805, 5% E25200201 - 4
C29 100nF, 1206, +80/-20% E25500301 - 4
C30 100nF, 1206, +80/-20% E25500301 - 4
C31 220pF, 1206, 5% E25500201 133622-221 4
C32 470pF, 0805, 5% E25200101 133622-471 4
Description Vendor
Part Number
Bose
Part Number
Note
12
Page 13

ELECTRICAL PART LIST
Main PCB Assembly
Capacitors (continued)
Reference
Designator
C33 47pF, 0805, 5% E25300501 133622-470 4
C34 2.2nF, 0805, 5% E25200201 - 4
C35 47pF, 0805, 5% E25300501 133622-470 4
C36 220pF, 1206, % E25500201 133622-221 4
C37 470pF, 0805, 5% E25200101 133622-471 4
C38 4.7nF, 0805, 5% E25301301 - 4
C39 2.2nF, 0805, 5% E25200201 - 4
C41 100nF, 0805, +80/-20% E25301001 - 4
C42 100nF, 0805, +80/-20% E25301001 - 4
C43 100nF, 0805, +80/-20% E25301001 - 4
C44 100nF, 0805, +80/-20% E25301001 - 4
C45 100nF, 0805, +80/-20% E25301001 - 4
C46 100nF, 0805, +80/-20% E25301001 - 4
C47 100nF, 0805, +80/-20% E25301001 - 4
C48 100nF, 0805, +80/-20% E25301001 - 4
C49 100nF, 0805, +80/-20% E25301001 - 4
C50 100nF, 0805, +80/-20% E25301001 - 4
C51 100nF, 0805, +80/-20% E25301001 - 4
C52 100nF, 0805, +80/-20% E25301001 - 4
C53 100nF, 0805, +80/-20% E25301001 - 4
C54 470pF, 0805, 5% E25200101 133622-471 4
C55 2.2nF, 0805, 5% E25200201 - 4
C56 47pF, 0805, 5% E25300501 133622-470 4
C57 27pF, 0805, 5% E25300801 133622-270 4
C58 100nF, 0805, +80/-20% E25301001 - 4
C59 100uF, EL, 85OC, 25V, 20% E22000201 149948-101E 4
C60 100uF, EL, 85OC, 25V, 20% E22000201 149948-101E 4
C61 10uF, EL, 85OC, 25V, 20% E22000101 149948-100E 4
C62 10uF, EL, 85OC, 25V, 20% E22000101 149948-100E 4
C63 27pF, 0805, 5% E25300801 133622-270 4
C64 47pF, 0805, 5% E25300501 133622-470 4
C65 27pF, 0805, 5% E25300801 133622-270 4
C66 27pF, 0805, 5% E25300801 133622-270 4
C67 100nF, 1206, +80/-20% E25500301 - 4
C68 100nF, 1206, +80/-20% E25500301 - 4
C69 100nF, 0805, 10% E25300701 - 4
C70 100nF, 0805, 10% E25300701 - 4
C71 100nF, 0805, 10% E25300701 - 4
C72 100nF, 0805, 10% E25300701 - 4
C73 100nF, 0805, +80/-20% E25301001 - 4
C74 100nF, 0805, 10% E25301801 - 4
C75 10nF, 0805, 5% E25300301 - 4
C76 100nF, 0805, +80/-20% E25301001 - 4
C77 100nF, 0805, +80/-20% E25301001 - 4
C78 100nF, 0805, +80/-20% E25301001 - 4
Description Vendor
Part Number
Part Number
Bose
Note
13
Page 14

ELECTRICAL PART LIST
Main PCB Assembly
Capacitors (continued)
Reference
Designator
C79 100nF, 0805, +80/-20% E25301001 - 4
C85 47pF, 1206, 5% E25500101 133622-470 4
C87 47pF, 0805, 5% E25300501 133622-470 4
C88 100nF, 1206, +80/-20% E25500301 - 4
C89 100nF, 1206, +80/-20% E25500301 - 4
C90 100nF, 1206, +80/-20% E25500301 - 4
C91 100nF, 0805, 10% E25301801 - 4
C92 100nF, 0805, +80/-20% E25301001 - 4
C93 100nF, 0805, +80/-20% E25301001 - 4
C94 100nF, 0805, +80/-20% E25301001 - 4
C95 100nF, 0805, +80/-20% E25301001 - 4
C96 100nF, 0805, +80/-20% E25301001 - 4
C97 100nF, 0805, +80/-20% E25301001 - 4
C98 100nF, 0805, +80/-20% E25301001 - 4
C99 100nF, 0805, 10% E25301801 - 4
C100 100uF, EL, 85OC, 25V, 20% E22000201 149948-101E 4
C101 100nF, 0805, +80/-20% E25301001 - 4
C102 100nF, 0805, +80/-20% E25301001 - 4
C103 100nF, 0805, +80/-20% E25301001 - 4
C104 100nF, 0805, +80/-20% E25301001 - 4
C105 100nF, 0805, +80/-20% E25301001 - 4
C106 330nF, 0805, +80/-20% E25301101 - 4
C107 100nF, 0805, +80/-20% E25301001 - 4
C108 100nF, 0805, +80/-20% E25301001 -- 4
C109 100nF, 0805, +80/-20% E25301001 - 4
C110 100nF, 0805, +80/-20% E25301001 - 4
C111 100uF, EL, 85OC, 25V, 20% E22000201 149948-101E 4
C112 47pF, 0805, 5% E25300501 133622-470 4
C113 47pF, 0805, 5% E25300501 133622-470 4
C114 100nF, 0805, +80/-20% E25301001 - 4
C115 47pF, 0805, 5% E25300501 133622-470 4
C116 47pF, 0805, 5% E25300501 133622-470 4
C117 47pF, 0805, 5% E25300501 133622-470 4
C118 47pF, 0805, 5% E25300501 133622-470 4
C119 47pF, 0805, 5% E25300501 133622-470 4
C120 47pF, 0805, 5% E25300501 133622-470 4
C121 100uF, EL, 85OC, 25V, 20% E22000201 149948-101E 4
C122 1nF, 0805, 5% E25300601 - 4
C123 220uF, EL, 85OC, 25V, 20% E22000301 149948-221E 4
C124 220uF, EL, 85OC, 25V, 20% E22000301 149948-221E 4
C125 220uF, EL, 85OC, 25V, 20% E22000301 149948-221E 4
C126 1nF, 0805, 5% E25300601 - 4
C127 100uF, EL, 85OC, 25V, 20% E22000201 149948-101E 4
C128 220uF, EL, 85OC, 25V, 20% E22000301 149948-221E 4
C129 47pF, 1206, 5% E25500101 133622-470 4
Description Vendor
Part Number
Part Number
Bose
Note
14
Page 15

ELECTRICAL PART LIST
Main PCB Assembly
Capacitors (continued)
Reference
Designator
C130 47pF, 1206, 5% E25500101 133622-470 4
C131 47pF, 1206, 5% E25500101 133622-470 4
C135 100nF, 0805, +80/-20% E25301001 - 4
C138 1nF, 0805, 5% E25300601 - 4
C139 1nF, 0805, 5% E25300601 - 4
C140 220pF, 1206, 5% E25500201 133622-221 4
C141 220pF, 1206, 5% E25500201 133622-221 4
C142 47pF, 0805, 5% E25300501 133622-470 4
C143 47pF, 0805, 5% E25300501 133622-470 4
C144 47pF, 0805, 5% E25300501 133622-470 4
C145 220pF, 1206, 5% E25500201 133622-221 4
C146 47pF, 0805, 5% E25300501 133622-470 4
C147 220pF, 1206, 5% E25500201 133622-221 4
C148 100pF, 0805, 5% E25300401 133622-102 4
C149 100pF, 0805, 5% E25300401 133622-102 4
C150 47pF, 0805, 5% E25300501 133622-470 4
C151 47pF, 0805, 5% E25300501 133622-470 4
C154 100nF, 0805, +80/-20% E25301001 - 4
C155 100nF, 0805, +80/-20% E25301001 - 4
C156 100nF, 0805, +80/-20% E25301001 - 4
C157 220pF, 1206, 5% E25500201 133622-221 4
C158 100nF, 0805, +80/-20% E25301001 - 4
C159 100nF, 0805, +80/-20% E25301001 - 4
C160 100nF, 0805, +80/-20% E25301001 - 4
C161 100uF, EL, 85OC, 25V, 20% E22000201 149948-101E 4
C162 100uF, EL, 85OC, 25V, 20% E22000201 149948-101E 4
C163 100uF, EL, 85OC, 25V, 20% E22000201 149948-101E 4
C164 100uF, EL, 85OC, 25V, 20% E22000201 149948-101E 4
C165 100nF, 0805, +80/-20% E25301001 - 4
C166 220pF, 1206, 5% E25500201 133622-221 4
C167 47pF, 0805, 5% E25300501 133622-470 4
C168 47pF, 0805, 5% E25300501 133622-470 4
C169 47pF, 0805, 5% E25300501 133622-470 4
C170 47pF, 0805, 5% E25300501 133622-470 4
C171 47pF, 0805, 5% E25300501 133622-470 4
C172 330nF, 0805, +80/-20% E25301101 - 4
C179 100nF, 0805, +80/-20% E25301001 - 4
C180 100nF, 0805, +80/-20% E25301001 - 4
C181 2.2uF, EL, 85OC, 25V, 20% E22000401 149948-2R2H 4
C182 100uF, EL, 85OC, 25V, 20% E22000201 149948-101E 4
C183 100uF, EL, 85OC, 25V, 20% E22000201 149948-101E 4
C187 100nF, 0805, +80/-20% E25301001 - 4
C188 100nF, 0805, +80/-20% E25301001 - 4
C189 100nF, 0805, +80/-20% E25301001 - 4
C190 100nF, 0805, +80/-20% E25301001 - 4
C191 10uF, EL, 85OC, 25V, 20% E22000101 149948-100E 4
Description Vendor
Part Number
Part Number
Bose
Note
15
Page 16

ELECTRICAL PART LIST
Main PCB Assembly
Capacitors (continued)
Reference
Designator
C192 100uF, EL, 85OC, 25V, 20% E22000201 149948-101E 4
C193 100uF, EL, 85OC, 25V, 20% E22000201 149948-101E 4
C194 47pF, 0805, 5% E25300501 133622-470 4
C195 47pF, 0805, 5% E25300501 133622-470 4
C196 47pF, 0805, 5% E25300501 133622-470 4
C197 47pF, 0805, 5% E25300501 133622-470 4
C198 100pF, 0805, 5% E25300401 133622-102 4
C199 100pF, 0805, 5% E25300401 133622-102 4
C200 100nF, 0805, +80/-20% E25301001 - 4
C201 100nF, 0805, +80/-20% E25301001 - 4
C202 220pF, 1206, 5% E25500201 133622-221 4
C203 220pF, 1206, 5% E25500201 133622-221 4
C204 100nF, 0805, +80/-20% E25301001 - 4
C205 100nF, 0805, +80/-20% E25301001 - 4
C206 100nF, 0805, +80/-20% E25301001 - 4
C207 100nF, 0805, +80/-20% E25301001 - 4
C208 100nF, 0805, +80/-20% E25301001 - 4
C209 100nF, 0805, +80/-20% E25301001 - 4
C210 100nF, 0805, +80/-20% E25301001 - 4
C211 100nF, 0805, +80/-20% E25301001 - 4
C212 2.2nF, 0805, 5% E25200201 - 4
C213 470pF, 0805, 5% E25200101 133622-471 4
C214 470pF, 0805, 5% E25200101 133622-471 4
C215 470pF, 0805, 5% E25200101 133622-471 4
C216 470pF, 0805, 5% E25200101 133622-471 4
C217 2.2nF, 0805, 5% E25200201 - 4
C218 47pF, 0805, 5% E25300501 133622-470 4
C219 27pF, 0805, 5% E25300801 133622-270 4
C220 27pF, 0805, 5% E25300801 133622-270 4
C221 47pF, 0805, 5% E25300501 133622-470 4
C222 27pF, 0805, 5% E25300801 133622-270 4
C223 27pF, 0805, 5% E25300801 133622-270 4
C224 100nF, 1206, +80/-20% E25500301 - 4
C225 100nF, 1206, +80/-20% E25500301 - 4
C226 10uF, EL, 85OC, 25V, 20% E22000101 149948-100E 4
C227 10uF, EL, 85OC, 25V, 20% E22000101 149948-100E 4
C228 100uF, EL, 85OC, 25V, 20% E22000201 149948-101E 4
C229 100uF, EL, 85OC, 25V, 20% E22000201 149948-101E 4
C230 100uF, EL, 85OC, 25V, 20% E22000201 149948-101E 4
C231 100uF, EL, 85OC, 25V, 20% E22000201 149948-101E 4
C232 100uF, EL, 85OC, 25V, 20% E22000201 149948-101E 4
C233 100uF, EL, 85OC, 25V, 20% E22000201 149948-101E 4
C234 100uF, EL, 85OC, 25V, 20% E22000201 149948-101E 4
C235 220uF, EL, 85OC, 25V, 20% E22000301 149948-221E 4
Description Vendor
Part Number
Part Number
Bose
Note
16
Page 17
ELECTRICAL PART LIST
Main PCB Assembly
Capacitors (continued)
Reference
Designator
C236 220uF, EL, 85OC, 25V, 20% E22000301 149948-221E 4
C237 220uF, EL, 85OC, 25V, 20% E22000301 149948-221E 4
C238 100uF, EL, 85OC, 25V, 20% E22000201 149948-101E 4
C239 220uF, EL, 85OC, 25V, 20% E22000301 149948-221E 4
C240 100nF, 0805, +80/-20% E25301001 - 4
Description Vendor
Part Number
Inductors
Part Number
Bose
Note
Reference
Designator
Description Vendor
Part Number
Bose
Part Number
Note
L1 47uH, IND/IMC-1210, SMD E50200101 - 4
L4 FERRITE, CK08 E50300101 - 4
L5 FERRITE, CK08 E50300101 - 4
L6 FERRITE, CK08 E50300101 - 4
L7 FERRITE, CK08 E50300101 - 4
L8 FERRITE, CK08 E50300101 - 4
L12 FERRITE, CK08 E50300101 - 4
L13 FERRITE, CK08 E50300101 - 4
L14 FERRITE, CK08 E50300101 - 4
L15 FERRITE, CK08 E50300101 - 4
L16 FERRITE, CK08 E50300101 - 4
L17 FERRITE, CK08 E50300101 - 4
L19 FERRITE, CK08 E50300101 - 4
L20 FERRITE, CK08 E50300101 - 4
L21 FERRITE, CK08 E50300101 - 4
L22 FERRITE, CK08 E50300101 - 4
L23 FERRITE, CK08 E50300101 - 4
L24 FERRITE, CK08 E50300101 - 4
L25 FERRITE, CK08 E50300101 - 4
L26 FERRITE, CK08 E50300101 - 4
Diodes
Reference
Designator
Description Vendor
Part Number
Bose
Part Number
Note
D1 1N4148, SOD-80, SWITCHING E36000101 - 4
D2 TVS-DIODE, SOT-23 E36600101 - 4
D3 TVS-DIODE, SOT-23 E36600101 - 4
D4 TVS-DIODE, SOT-23 E36600101 - 4
D5 TVS-DIODE, SOT-23 E36600101 - 4
D6 TVS-DIODE, SOT-23 E36600101 - 4
D7 1N4148, SOD-80, SWITCHING E36000101 - 4
D8 1N4148, SOD-80, SWITCHING E36000101 - 4
D9 1N4148, SOD-80, SWITCHING E36000101 - 4
D10 1N4148, SOD-80, SWITCHING E36000101 - 4
D11 1N4148, SOD-80, SWITCHING E36000101 - 4
D12 1N4148, SOD-80, SWITCHING E36000101 - 4
D13 1N4148, SOD-80, SWITCHING E36000101 - 4
D14 1N4148, SOD-80, SWITCHING E36000101 - 4
17
Page 18
ELECTRICAL PART LIST
Main PCB Assembly
Diodes (continued)
Reference
Designator
D15 1N4148, SOD-80, SWITCHING E36000101 - 4
D16 ZENER, 4.7V, SOD-80, 400mW E36400201 135247-5230 4
D22 TVS-DIODE, SOT-23 E36600101 - 4
D23 TVS-DIODE, SOT-23 E36600101 - 4
D24 TVS-DIODE, SOT-23 E36600101 - 4
D26 1N4148, SOD-80, SWITCHING E36000101 - 4
D29 1N4148, SOD-80, SWITCHING E36000101 - 4
D30 1N4148, SOD-80, SWITCHING E36000101 - 4
D33 ZENER, 4.7V, SOD-80, 400mW E36400201 135247-5230 4
D34 ZENER, 3.0V, SOD-80, 500mW E36400101 - 4
D35 ZENER, 4.7V, SOD-80, 400mW E36400201 135247-5230 4
D36 ZENER, 4.7V, SOD-80, 400mW E36400201 135247-5230 4
D37 1N4148, SOD-80, SWITCHING E36000101 - 4
D34 ZENER, 3.0V, SOD-80, 500mW E36400101 - 4
D38 ZENER, 3.9V, SOD-80, 400mW E36400301 - 4
D39 ZENER, 3.0V, SOD-80, 500mW E36400101 - 4
D40 ZENER, 3.0V, SOD-80, 500mW E36400101 - 4
D41 ZENER, 3.0V, SOD-80, 500mW E36400101 - 4
D42 ZENER, 3.0V, SOD-80, 500mW E36400101 - 4
D43 ZENER, 3.0V, SOD-80, 500mW E36400101 - 4
D44 ZENER, 3.0V, SOD-80, 500mW E36400101 - 4
D45 ZENER, 3.0V, SOD-80, 500mW E36400101 - 4
Description Vendor
Part Number
Transistors
Part Number
Bose
Note
Reference
Designator
Q1 BC847, NPN, SOT23-D E35100101 - 4
Q2 2SD2114, NPN, SOT23-D E35100201 - 4
Q3 BC847, NPN, SOT23-D E35100101 - 4
Q4 BC847, NPN, SOT23-D E35100101 - 4
Q5 BC857, PNP, SOT23-D E35100301 - 4
Q6 2SD2114, NPN, SOT23-D E35100201 - 4
Q7 2SD2114, NPN, SOT23-D E35100201 - 4
Q8 2SD2114, NPN, SOT23-D E35100201 - 4
Q9 BC847, NPN, SOT23-D E35100101 - 4
Q10 2SD2114, NPN, SOT23-D E35100201 - 4
Q11 2SD2114, NPN, SOT23-D E35100201 - 4
Q14 BC857, PNP, SOT23-D E35100301 - 4
Q15 BC857, PNP, SOT23-D E35100301 - 4
Q16 BC857, PNP, SOT23-D E35100301 - 4
Q17 BC857, PNP, SOT23-D E35100301 - 4
Q18 BC857, PNP, SOT23-D E35100301 - 4
Q19 BC857, PNP, SOT23-D E35100301 - 4
Q20 BC847, NPN, SOT23-D E35100101 - 4
Q21 BC847, NPN, SOT23-D E35100101 - 4
Description Vendor
Part Number
Bose
Part Number
Note
18
Page 19

ELECTRICAL PART LIST
Main PCB Assembly
Integrated Circuits
Reference
Designator
IC2 AK4524, SSOP28, 24-BIT 96KHZ
CODEC
IC3 DSP-56362, QFP\144P E49000101 - 4
IC5 SN74LV00, SO14, QUAD, 2-
INPUT NAND GATE
IC6 128KX8, SOJ32/400, HIGH
SPEED PROCESSOR
IC7 128KX8, SOJ32/400, HIGH
SPEED PROCESSOR
IC8 128KX8, SOJ32/400, HIGH
SPEED PROCESSOR
IC9 DG441, SO16, QUAD SPST
ANALOG SWITCH
IC10 5532, DIP8, OP-AMP E47000101 - 4
IC11 5532, DIP8, OP-AMP E47000101 - 4
IC12 39VF020, PLCC32R, 24-BIT
96KHZ, CODEC
IC13 5532, DIP8, OP-AMP E47000101 - 4
IC14 6N137, DIP8, HIGH SPEED TTL
LEVEL OPTOCOUPLER
IC15 5532, DIP8, OP-AMP E47000101 - 4
IC16 5532, DIP8, OP-AMP E47000101 - 4
IC18 5532, DIP8, OP-AMP E47000101 - 4
IC19 5532, DIP8, OP-AMP E47000101 - 4
IC20 5532, DIP8, OP-AMP E47000101 - 4
IC21 5532, DIP8, OP-AMP E47000101 - 4
IC24 LM78L05, TO-92, 5V, REG E42100101 - 4
IC25 74HCT4052, SO16, DUAL 4-CH
ANALOG MULTIPLEXER
IC27 5532, DIP8, OP-AMP E47000101 - 4
IC30 74HCT4052, SO16, DUAL 4-CH
ANALOG MULTIPLEXER
IC37 LM78L05, TO-92, 5V, REG E42100101 - 4
IC38 AK4524, SSOP28, 24-BIT 96KHZ
CODEC
Description Vendor
Part Number
E49100301 - 4
E45000101 - 4
E48100102 - 4
E48100102 - 4
E48100102 - 4
E39900101 - 4
E48401001 - 4
E34600101 - 4
E45000201 - 4
E45000201 - 4
E49100301 - 4
Part Number
Bose
Note
19
Page 20

ELECTRICAL PART LIST
Main PCB Assembly
Miscellaneous
Reference
Designator
J3 DIN5F, DIN CONNECTOR E52200101 - 4
J5 HDR2X10, PIN HEADER, 2x10 E52800201 - 4
J6 XLR CONNECTOR, FEMALE E52200401 - 4
J8 HDR2X5, PIN HEADER, 2x5 E52800101 - 4
J9 XLR CONNECTOR, FEMALE E52200401 - 4
J10 XLR CONNECTOR, MALE E52200501 - 4
J11 XLR CONNECTOR, MALE E52200501 - 4
J12 PLCC32_SOCKET E44800101 - 4
J16 XLR CONNECTOR, MALE E52200501 - 4
J17 XLR CONNECTOR, MALE E52200501 - 4
X2 22.5792 MHz, CRYSTAL E33000201 - 4
Description Vendor
Part Number
Part Number
Bose
Note
20
Page 21

ELECTRICAL PART LIST
Display PCB Assembly
Resistors
Reference
Designator
R1 10K, 0805, 1/10W, 5% E15100201 133626-1035 4
R2 10K, 0805, 1/10W, 5% E15100201 133626-1035 4
R3 10K, 0805, 1/10W, 5% E15100201 133626-1035 4
R4 2.2K, 0805, 1/10W, 5% E15101101 133626-2225 4
R5 47K, 0805, 1/10W, 5% E15101401 133626-4735 4
R6 560 OHM, 0805, 1/10W, 5% E15103501 133626-5615 4
R7 120 OHM, 0805, 1/10W, 5% E15102201 133626-1215 4
R8 47K, 0805, 1/10W, 5% E15101401 133626-4735 4
R9 2.2K, 0805, 1/10W, 5% E15101101 133626-2225 4
R10 82 OHM, 0805, 1/10W, 5% E15102301 - 4
R11 2.2K, 0805, 1/10W, 5% E15101101 133626-2225 4
R12 10K, 0805, 1/10W, 5% E15100201 133626-1035 4
R13 3.9K, 0805, 1/10W, 5% E15101301 133626-3925 4
R14 3.9K, 0805, 1/10W, 5% E15101301 133626-3925 4
R15 560 OHM, 0805, 1/10W, 5% E15103501 133626-5615 4
R16 2.2K, 0805, 1/10W, 5% E15101101 133626-2225 4
R17 2.2K, 0805, 1/10W, 5% E15101101 133626-2225 4
R18 2.2K, 0805, 1/10W, 5% E15101101 133626-2225 4
R19 2.2K, 0805, 1/10W, 5% E15101101 133626-2225 4
R20 120 OHM, 0805, 1/10W, 5% E15102201 133626-1215 4
R21 10K, 0805, 1/10W, 5% E15100201 133626-1035 4
R22 220 OHM, 0805, 1/10W, 5% E15100801 133626-2215 4
R23 120 OHM, 0805, 1/10W, 5% E15102201 133626-1215 4
R24 2.2K, 0805, 1/10W, 5% E15101101 133626-2225 4
R25 220 OHM, 0805, 1/10W, 5% E15100801 133626-2215 4
R26 220 OHM, 0805, 1/10W, 5% E15100801 133626-2215 4
R28 1.8K, 0805, 1/10W, 5% E15103901 133626-1825 4
R29 0 OHM, 0805, 1/10W, 5% E15103701 133627 4
R31 3.01K, 0805, 1/10W, 5% E15104001 133625-3011 4
R32 301 OHM, 0805, 1/10W, 5% E15104011 133625-3010 4
R33 2.61K, 0805, 1/10W, 5% E15104021 133625-2611 4
R35 0 OHM, 0805, 1/10W, 5% E15103701 133627 4
R37 49.9K, 0805, 1/10W, 5% E15103801 133625-4992 4
R39 0 OHM, 0805, 1/10W, 5% E15103701 133627 4
R42 10 OHM, 0805, 1/10W, 5% E15100301 133626-1005 4
R45 120 OHM, 0805, 1/10W, 5% E15102201 133626-1215 4
R46 120 OHM, 0805, 1/10W, 5% E15102201 133626-1215 4
R47 220 OHM, 0805, 1/10W, 5% E15100801 133626-2215 4
R57 120 OHM, 0805, 1/10W, 5% E15102201 133626-1215 4
R62 82 OHM, 0805, 1/10W, 5% E15102301 - 4
Description Vendor
Part Number
Bose®
Part Number
Note
21
Page 22

ELECTRICAL PART LIST
Display PCB Assembly
Capacitors
Reference
Designator
C1 100nF, 0805, +80/-20% E25301001 - 4
C2 100nF, 0805, +80/-20% E25301001 - 4
C3 1nF, 0805, 5% E25300601 - 4
C7 100nF, 0805, 10% E25300701 - 4
C8 39pF, 0805, 5% E25301601 133622-390 4
C10 39pF, 0805, 5% E25301601 133622-390 4
C11 100nF, 0805, +80/-20% E25301001 - 4
C15 100nF, 0805, 10% E25300701 - 4
C16 100nF, 0805, 10% E25300701 - 4
C17 100nF, 0805, 10% E25300701 - 4
C18 100nF, 0805, 10% E25300701 - 4
C20 100nF, 0805, 10% E25300701 - 4
C21 100nF, 0805, 10% E25300701 - 4
C22 100nF, 0805, 10% E25300701 - 4
C24 100nF, 0805, 10% E25300701 - 4
C24 100nF, 0805, 10% E25300701 - 4
C26 100nF, 0805, 10% E25300701 - 4
C27 100nF, 0805, 10% E25300701 - 4
C28 100nF, 0805, 10% E25300701 - 4
C33 10uF, EL, 85OC, 25V, 20% E22100201 149948-100E 4
C35 100nF, 0805, 10% E25300701 - 4
Description Vendor
Part Number
Diodes
Bose®
Part Number
Note
Reference
Designator
D1 BAT54, SOT23, SCHOTTKY E36000201 - 4
D2 BAT54, SOT23, SCHOTTKY E36000201 - 4
D3 BAT54, SOT23, SCHOTTKY E36000201 - 4
D4 BAT54, SOT23, SCHOTTKY E36000201 - 4
LD1 LED, 3MM GREEN E31700201 - 4
LD2 LED, 3MM GREEN E31700201 - 4
LD3 LED_BAR 7 SEGMENT E31700401 - 4
LD4 LED_BAR 7 SEGMENT E31700401 - 4
LD9 LED, 3MM GREEN E31700201 - 4
LD10 LED, 3MM GREEN E31700201 - 4
Reference
Designator
Q4 BC857, SOT23-D, PNP E35100301 - 4
Q5 BC857, SOT23-D, PNP E35100301 - 4
Description Vendor
Part Number
Transistors
Description Vendor
Part Number
Bose
Part Number
Bose
Part Number
Note
Note
22
Page 23

ELECTRICAL PART LIST
®
Display PCB Assembly
Integrated Circuits
Reference
Designator
Description Vendor
Part Number
Bose
Part Number
IC1 MAX809, SOT23, S PIN RESET E49100101 - 4
IC2 74HC132, SO14, QUAD 2-INPUT
E45500301 - 4
NAND GATE
IC3 74HCT574, S01420WB, OCTAL
E45500701 - 4
D-TYPE FLIP FLOP
IC4 74HC74, SO14, DUAL D FLIP
E45500201 - 4
FLOP
IC8 AT8535, PLCC-14, 8 BIT, MICRO E49000211 - 4
Miscellaneous
Note
Reference
Designator
Description Vendor
Part Number
Bose®
Part Number
Note
J1 CABLE, HDR2X10 E59700101 - 4
J2 CONNECTOR 16, HDR16 E52800301 - 4
J3 PLCC44_SOCKET E44800201 - 4
S1 SW/TACT2, TACT SWITCH E34000101 - 4
S2 SW/TACT2, TACT SWITCH E34000101 - 4
S3 SW/TACT2, TACT SWITCH E34000101 - 4
S4 SW/TACT2, TACT SWITCH E34000101 - 4
S5 SW/TACT2, TACT SWITCH E34000101 - 4
S6 SW/TACT2, TACT SWITCH E34000101 - 4
S7 ENCODER, ROTARY SWITCH E34000301 - 4
S17 POWER SWITCH E34000201 - 4
X1 4 MHZ CRYSTAL, LOW PROFILE E33000301 - 4
23
Page 24

DISASSEMBLY PROCEDURES
Note: Refer to Figure 2 for the following
procedures.
CAUTION: Before re-assembling the unit,
use compressed air to blow out any metal
shavings that may have fallen into the unit
during disassembly.
1. Side Panel Removal
1.1 Using a TX-15 Torx bit, remove the two
screws (1) located on each side of the unit.
1.2 With the front of the unit facing you, pull
the front of the side panels (2) out until the
tab at the rear of the side panel is free.
2. Front Panel Removal
2.1 Perform procedure 1.
2.2 Pull off the rotary knob (3).
2.3 Pull the front panel (4) forward slightly
and slide it off the toward either end of the
unit.
3. Top Cover Removal
3.1 Perform procedure 1.
3.2 Using a phillips-head screwdriver, re-
move the four screws (10) along the bottom
rear of the unit and the two screws (9) on the
top front of the top cover (5).
4.3 Remove the button assembly (14) with
the arrows on it.
4.4 Using a T-9 Torx bit remove the three
screws (12) that secure the front PCB (6)
to the chassis.
4.5 Gently pull the front panel PCB assembly
off of the black plastic standoffs.
4.6 Gently remove the PCB assembly while
feeding the cable assembly through the front
of the chassis.
5. Main PCB Removal
5.1 Perform procedure 3.
5.2 Remove the front panel PCB assembly’s
cable connector from the main PCB.
5.3 Using a T-9 Torx bit, remove the five
screws (19) that secure the main PCB to
the chassis.
5.4 Lift up the main PCB toward the front of
the unit. Make a note of the wiring configuration and unsolder the wires located at the
front of the PCB.
5.5 Lift out the main PCB assembly.
6. Power Supply PCB Removal
6.1 Perform procedure 3.
3.3 Remove the twelve screws (11) that
secure the XLR connectors to the rear of the
top cover.
3.4 Lift off the top cover.
4. Front Panel PCB Removal
4.1 Perform procedure 2.
4.2 Remove the connector for the front panel
PCB assembly (15) from the main PCB.
6.2 Using a T-9 Torx bit, remove the four
screws (18) that secure the corners of the
power supply PCB (17) and the two screws
(18A) that secure the AC jack to the chassis.
6.3 Lift up the PCB toward the front of the
unit. Make a note of the wiring configuration
and unsolder the wires at the front of the
PCB.
6.4 Lift out the power supply PCB.
24
Page 25

TEST PROCEDURES
Test Setup:
1. The arrow buttons navigate through the
user interface settings; Mono, Stereo, Bass
Array and separate channel operation.
2. The rotary control selects the type of
speaker EQ under test e.g. 402, 802, LT4402
etc.
3. For the following test procedures, set the
unit to Stereo setting and then use the rotary
control to select the EQ to test.
Note: The Panaray® system digital controller
has the equalized frequency responses for
all of the Bose® professional speakers
programmed into a DSP integrated circuit.
Prior to testing for frequency response,
check that the system responds to key pad
entries. Press the arrow keys to navigate
through the EQ selection settings. Rotate the
rotary pot and check that the display
changes from one type of speaker equalization to another. If these functions are working
properly then continue on to the frequency
response tests. If these functions are not
working, the unit may be defective.
Required Test Equipment:
• Audio Signal Generator
• dB Meter
1.5 Measure the frequency response of the
output using the table below.
402 EQ Full Range Frequency Response
Frequency Output Level
60 Hz -3.7 dB ± 1.5 dB
105 Hz +8.5 dB ± 1.5 dB
220 Hz +3.5 dB ± 1.5 dB
850 Hz 0 dB
Reference
4 kHz +5.8 dB ± 1.5 dB
14.5 kHz +13.3 dB ± 1.5 dB
1.6 Select the 402 high frequency setting.
1.7 Apply a 100 mVrms, 850 Hz signal to
the input jack of the controller channel under
test. Reference a dB meter to the output
jack of the controller.
1.8 Measure the frequency response of the
output using the table below.
402 EQ High Frequency Response
Frequency Output Level
60 Hz -16.4 dB ± 1.5 dB
105 Hz -5.2 dB ± 1.5 dB
220 Hz +2.8 dB ± 1.5 dB
850 Hz 0 dB
Reference
4 kHz +5.8 dB ± 1.5 dB
14.5 kHz +13.3 dB ± 1.5 dB
1. 402
®
EQ Frequency Response Test
1.1 Select the 402 stereo setting for the
following tests.
1.2 Apply a 100 mVrms, 850 Hz signal to
the input jack of the controller channel under
test. Reference a dB meter to the input jack
of the controller.
1.3 Measure the gain at the output of the
channel under test. It should be -3.4 +/- 1dB.
1.4 Reference a dB meter to the output of
the controller channel under test.
2. 402 II EQ Frequency Response Test
2.1. Select the 402 II stereo setting for the
following tests.
2.2 Apply a 100 mVrms, 850 Hz signal to
the input jack of the controller channel under
test. Reference a dB meter to the input of
the controller.
2.3 Measure the gain at the output of the
channel under test. It should be -3.4 +/- 1dB.
2.4 Reference a dB meter to the output of
the controller channel under test.
25
Page 26

TEST PROCEDURES
2.5 Measure the frequency response of the
output using the table below.
402 II EQ Full Range Frequency Response
Frequency Output Level
60 Hz +3.2 dB ± 1.5 dB
90 Hz +10.0 dB ± 1.5 dB
220 Hz +7.3 dB ± 1.5 dB
600 Hz -2.4 dB ± 1.5 dB
850 Hz 0 dB
Reference
4 kHz +5.6 dB ± 1.5 dB
13.5 kHz +15.5 dB ± 1.5 dB
2.6 Select the 402 II high frequency setting.
2.7 Apply a 100 mVrms, 850 Hz signal to
the input jack of the controller channel under
test. Reference a dB meter to the output
jack of the controller.
2.8 Measure the frequency response of the
output using the table below.
402 II EQ High Frequency Response
Frequency Output Level
60 Hz -13.0 dB ± 1.5 dB
90 Hz -5.6 dB ± 1.5 dB
220 Hz +6.8 dB ± 1.5 dB
600 Hz -2.4 dB ± 1.5 dB
850 Hz 0 dB
Reference
4 kHz +5.6 dB ± 1.5 dB
13.5 kHz +15.5 dB ± 1.5 dB
3.5 Measure the frequency response using
the table below.
502A EQ Full Range Frequency Response
Frequency Output Level
40 Hz -24.5 dB ± 2.0 dB
140 Hz +4.3 dB ± 1.5 dB
600 Hz 0 dB
Reference
2,2 kHz +3.5 dB ± 1.5 dB
5 kHz +12.5 dB ± 1.5 dB
15 kHz +18.4 dB ± 1.5 dB
3.6 Select the 502 high frequency setting.
3.7 Apply a 100 mVrms, 600 Hz signal to
the input jack of the controller channel under
test. Reference a dB meter to the output
jack of the controller.
3.8 Measure the frequency response of the
output using the table below.
502A EQ High Frequency Response
Frequency Output Level
40 Hz -28.5 dB ± 2.0 dB
140 Hz +2.9 dB ± 1.5 dB
600 Hz 0 dB
Reference
2.2 kHz +3.5 dB ± 1.5 dB
5 kHz +12.5 dB ± 1.5 dB
15 k Hz +19.0 dB ± 1.5 dB
4. 502B EQ Frequency Response Test
3. 502®A EQ Frequency Response Test
3.1 Select the 502A Stereo setting.
3.2 Apply a 100 mVrms, 600 Hz signal to
the input jack of the controller channel under
test. Reference a dB meter to the input of the
channel under test.
3.3 Measure the gain. It should be -4.4 +/- 1
dB.
3.4 Reference a dB meter to the output of the
channel under test.
4.1 Select the 502B setting.
4.2 Apply a 200 mVrms, 80 Hz signal to
the input jack of the controller channel under
test.
4.3 Reference a dB meter to the input of the
channel under test.
4.4 Measure the gain. It should be +13.8 +/1 dB.
4.5 Reference a dB meter to the output of
the channel under test.
26
Page 27

TEST PROCEDURES
4.6 Measure the frequency response using
the table below.
502B EQ Frequency Response
Frequency Output Level
40 Hz -5.8 dB ± 2.0 dB
80 Hz 0 dB
Reference
100 Hz +1.3 dB ± 1.0 dB
300 Hz -17.5 dB ± 2.0 dB
5. 502BEX EQ Frequency Response Test
5.1 Select the 502BEX setting.
5.2 Apply a 200 mVrms, 100 Hz signal to
the input jack of the controller channel under
test.
5.3 Reference a dB meter to the input of the
channel under test.
5.4 Measure the gain. It should be +4.2 +/1 dB.
6.3 Reference a dB meter to the input of the
channel under test.
6.4 Measure the gain. It should be +1.8 +/1 dB.
6.5 Reference a dB meter to the output of
the channel under test.
6.6 Measure the frequency response of the
output using the table below.
802 II EQ Full Range Frequency Response
Frequency Output Level
40 Hz +8.0 dB ± 1.5 dB
55 Hz +13.5 dB ± 1.5 dB
140 Hz +6.6 dB ± 1.5 dB
700 Hz 0 dB
Reference
2.5 kHz +2.1 dB ± 1.5 dB
6 kHz +9.6 dB ± 1.5 dB
14.5 kHz +16.7 dB ± 1.5 dB
6.7 Select the 802 high frequency setting.
5.5 Reference a dB meter to the output of
the channel under test.
5.6 Measure the frequency response using
the table below.
502®BEX EQ Frequency Response
Frequency Output Level
30 Hz -15.2 dB ± 2.0 dB
55 Hz +2.3 dB ± 1.4 dB
100 Hz 0 dB
Reference
160 Hz - 6.8 dB ± 1.0 dB
240 Hz -0.8 dB ± 1.2 dB
500 Hz -11.6 dB ± 2.0 dB
6. 802® II EQ Frequency Response Test
6.1 Select the 802 II stereo setting.
6.2 Apply a 100 mVrms, 700 Hz signal to
the input jack of the controller channel under
test.
6.8 Apply a 100 mVrms, 700 Hz signal to
the input jack of the controller channel under
test. Reference a dB meter to the output of
the channel under test.
6.9 Measure the frequency response of the
output using the table below.
802 II EQ High Frequency Response
Frequency Output Level
40 Hz -21.0 dB ± 1.5 dB
60 Hz -11.5 dB ± 1.5 dB
700 Hz 0 dB
Reference
2.5 kHz +2.1 dB ± 1.5 dB
6 kHz +9.6 dB ± 1.5 dB
14.5 kHz +16.7 dB ± 1.5 dB
27
Page 28

TEST PROCEDURES
7. 802 III EQ Frequency Response Test
7.1 Select the 802 III stereo setting.
7.2 Apply a 100 mVrms, 700 Hz signal to
the input jack of the controller channel under
test. Reference a dB meter to the input of the
channel under test.
7.3 Measure the gain. It should be +1 +/1 dB.
7.4 Reference a dB meter to the output of
the channel under test.
7.5 Measure the frequency response of the
output using the table below.
802 III EQ Full Range Frequency Response
Frequency Output Level
40 Hz +1.9 dB ± 1.5 dB
70 Hz +13.5 dB ± 1.5 dB
140 Hz +7.5 dB ± 1.5 dB
700 Hz 0 dB
Reference
2.5 kHz +1.8 dB ± 1.5 dB
6 kHz +6.9 dB ± 1.5 dB
13 kHz +13.8 dB ± 1.5 dB
7.6 Select the 802® high frequency setting.
7.7 Apply a 100 mVrms, 700 Hz signal to
the input jack of the controller channel under
test. Reference a dB meter to the output jack
of the channel under test.
8. Panaray® LT3202 Series II EQ Frequency
Response Test
8.1 Select the LT3202 stereo setting.
8.2 Apply a 100 mVrms, 700 Hz signal to
the input jack of the controller channel under
test. Reference a dB meter to the input of
the channel under test.
8.3 Measure the gain. It should be +7 +/1 dB.
8.4 Reference a dB meter to the output of
the channel under test.
8.5 Measure the frequency response of the
output using the following table.
LT3202 Series II EQ Frequency Response
Frequency Output Level
50 Hz -27 dB ± 3 dB
100 Hz -6.0 dB ± 1.5 dB
200 Hz 3.0 dB ± 1.5 dB
400 Hz -1.5 dB ± 1 dB
700 Hz 0 dB
Reference
900 Hz 0.5 dB ± 1 dB
3,250 Hz -6.5 dB ± 1.5 dB
6.4 kHz -6.5 dB ± 1.5 dB
13 kHz -4.3 dB ± 1.5 dB
30 kHz -27 dB ± 3 dB
9. Panaray LT4402 EQ Series II Frequency
Response Test
7.8 Measure the frequency response of the
output using the table below.
802 III EQ High Frequency Response
Frequency Output Level
40 Hz -24.9 dB ± 1.5 dB
70 Hz -10.6 dB ± 1.5 dB
140 Hz +5.2 dB ± 1.5 dB
700 Hz 0 dB
Reference
2.5 kHz +1.9 dB ± 1.5 dB
6 kHz +7.0 dB ± 1.5 dB
13 kHz +13.9 dB ± 1.5 dB
9.1 Select the LT4402 stereo setting.
9.2 Apply a 100 mVrms, 700 Hz signal to
the input jack of the controller channel under
test. Reference a dB meter to the input of
the channel under test.
9.3 Measure the gain. It should be +5 +/1 dB.
9.4 Reference a dB meter to the output of
the channel under test.
28
Page 29

TEST PROCEDURES
9.5 Measure the frequency response of the
output using the table below.
LT4402 Series II EQ Frequency Response
Frequency Output Level
50 Hz -27.4 dB ± 3 dB
150 Hz -2.2 dB ± 1.5 dB
250 Hz 1.7 dB ± 1.5 dB
500 Hz -0.9 dB ± 1.5 dB
700 Hz 0 dB
Reference
1 kHz 1.3 dB ± 1.5 dB
2 kHz -0.3 dB ± 1 dB
3 kHz 0.6 dB ± 1 dB
7 kHz -1.5 dB ± 1.5 dB
13 kHz 0 dB ± 1.5 dB
30 kHz -26 dB ± 3 dB
10. Panaray® LT9702 Series II EQ
Frequency Response Test
Frequency Output Level
50 Hz -23 dB ± 3 dB
100 Hz -2.4 dB ± 1.5 dB
180 Hz +5.2 dB ± 2 dB
550 Hz -1.5 dB ± 1 dB
700 Hz 0 dB
Reference
1.1 kHz +2.3 dB ± 1 dB
1.8 kHz +3.8 dB ± 1 dB
3 kHz +4.8 dB ± 1 dB
6.5 kHz +4.5 dB ± 1.5 dB
11.5 kHz +3.8 dB ± 1.5 dB
30 kHz -22 dB ± 3 dB
10.1 Select the LT9702 stereo setting.
10.2 Apply a 100 mVrms, 700 Hz signal to
the input jack of the controller channel under
test. Reference a dB meter to the input of the
channel under test.
10.3 Measure the gain. It should be +2.6 +/1 dB.
10.4 Reference a dB meter to the output of
the channel under test.
10.5 Measure the frequency response of the
output using the following table.
LT9702 Series II EQ Frequency Response
29
Page 30

APPENDIX
402® Series II Full Range Frequency Response Curve
402 Series II Hi Pass Frequency Response Curve
30
Page 31

APPENDIX
502®A Full Range Frequency Response Curve
502A Hi Pass Frequency Response Curve
31
Page 32

APPENDIX
502®B Frequency Response Curve
502BEX Frequency Response Curve
32
Page 33

APPENDIX
802® Series III Full Range Frequency Response Curve
802 Series III Hi Pass Frequency Response Curve
33
Page 34

APPENDIX
802® Series III Stacked Full Range Frequency Response curve
802 Series III Stacked Hi Pass Frequency Response Curve
34
Page 35

APPENDIX
Panaray® LT3202® Series II Frequency Response Curve
Panaray LT4402® Series II Frequency Response Curve
35
Page 36

APPENDIX
Panaray® LT9702® Series II Frequency Response Curve
36
Page 37

APPENDIX
Panaray® MA12 Free Field Frequency Response Curve
Panaray MA12 Hi Pass Frequency Response Curve
37
Page 38

APPENDIX
Panaray® MA12 Wall Mount Frequency Response Curve
Panaray MA12 Stacked Free Field Frequency Response Curve
38
Page 39

APPENDIX
Panaray
®
MA12 Stacked Hi Pass Frequency Response Curve
Panaray MA12 Stacked Wall Mount Frequency Response Curve
39
Page 40

APPENDIX
Panaray® MB4 100 Hz Low Pass Frequency Response Curve
Panaray MB4 160 Hz Low Pass Frequency Response Curve
40
Page 41

APPENDIX
Panaray MB4 200 Hz Low Pass Frequency Response Curve
Panaray MB4 280 Hz Low Pass Frequency Response Curve
41
Page 42

APPENDIX
The following is a list of 180 presets that are available in the Panaray
®
system digital controller.
The presets are separated into three banks: Mono, Stereo and Bass Array. Included in this list is
the name of each preset as it appears on the Panaray controller LCD as well as a description of
the preset and the default settings for each of the four channels.
Bose® Loudspeaker EQ Preset List- Mono Bank
LCD Display Preset Description Output Default Configuration
Mono Presets Channel 1 Channel 2 Channel 3 Channel 4
402
I
402 I+502B
402 I+MB4 402 Series I loudspeaker
402 I+AWCS 402 Series I loudspeaker
402 I HF 402 Series I loudspeaker
LCD Display Preset Description Output Default Configuration
Mono Presets Channel 1 Channel 2 Channel 3 Channel 4
402
II
402 II+502B 402 Series II loudspeaker
402
II
+502BEX
402 II+MB4 402 Series II loudspeaker
402 II+AWCS 402 Series II loudspeaker
402 II HF 402 Series II loudspeaker
402 Series I loudspeaker full
range EQ
402 Series I loudspeaker
bi-amped with 502B
bi-amped with MB4
bi-amped with AWCS
bi-amped at 160 Hz
402 Series II loudspeaker full
range EQ
bi-amped with 502B
402 Series II loudspeaker
bi-amped with 502BEX
bi-amped with MB4
bi-amped with AWCS
bi-amped at 160 Hz
402
Mono
I
Full Range
402
Mono
I
High Freq.
Mono
402
I
High Freq.
402
Mono
I
High Freq.
402
Mono
I
High Freq.
402
II
Mono
Full Range
402
II
Mono
High Freq.
402
II
Mono
High Freq.
402
II
Mono
High Freq.
402
II
Mono
High Freq.
402
II
Mono
High Freq.
402 I Mono
Full Range
402 I Mono
High Freq.
402 I Mono
High Freq.
402 I Mono
High Freq.
402 I Mono
High Freq.
402
II
Mono
Full Range
402
II
Mono
High Freq.
402
II
Mono
High Freq.
402
II
Mono
High Freq.
402
II
Mono
High Freq.
402
II
Mono
High Freq.
402 I Mono
Full Range
502B Mono
Low
MB4 Mono
Low
AWCS
Mono Low
402 I Mono
High Freq.
402
Mono
II
Full Range
502B Mono
Low
502BEX
Mono Low
MB4 Mono
Low
AWCS
Mono Low
402
II
Mono
High Freq.
402 I Mono
Full Range
502B Mono
Low
MB4 Mono
Low
AWCS
Mono Low
402 I Mono
High Freq.
402 II Mono
Full Range
502B Mono
Low
502BEX
Mono Low
MB4 Mono
Low
AWCS
Mono Low
402
II
Mono
High Freq.
42
Page 43

APPENDIX
Bose® Loudspeaker EQ Preset List- Mono Bank (continued)
LCD Display Preset Description Output Default Configuration
Mono Presets Channel 1 Channel 2 Channel 3 Channel 4
502A
502A+502B 502A loudspeaker bi-amped
502A+MB4 502A loudspeaker bi-amped
502A+AWCS 502A loudspeaker bi-amped
502A HF 502A loudspeaker bi-amped
LCD Display Preset Description Output Default Configuration
Mono Presets Channel 1 Channel 2 Channel 3 Channel 4
802
II
802 II+502B
802 II+MB4 802 Series II loudspeaker
802 II+AWCS 802 Series II loudspeaker
802 II HF 802 Series II loudspeaker
802 II STK Stacked 802 Series
802
II
STK+502
802 II STK
+AWCS
802 II STK HF 802 Series II loudspeaker
B
502A loudspeaker full rangeEQ502A Mono
Full Range
502A Mono
with 502B
with MB4
with AWCS
Limiting is assigned to
Note:
channels 3 and 4 for
protection of the AWCS
with at 180 Hz
802 Series II loudspeaker full
range EQ
802 Series II loudspeaker
bi-amped with 502B
bi-amped with MB4
bi-amped with AWCS
Limiting is assigned to
Note:
channels 3 and 4 for
protection of the AWCS
bi-amped at 112 Hz
II
loudspeaker full range EQ
Stacked 802 Series
loudspeaker bi-amped with
502B
802 Series II loudspeaker
bi-amped with AWCS
Limiting is assigned to
Note:
channels 3 and 4 for
protection of the AWCS
bi-amped at 112 Hz
II
High Freq.
502A Mono
High Freq.
502A Mono
High Freq.
502A Mono
High Freq.
802
II
Mono
Full Range
802
II
Mono
High Freq.
802
II
Mono
High Freq.
802
II
Mono
High Freq.
802
II
Mono
High Freq.
802
II
Mono
Full Range
802
II
Mono
High Freq.
802
II
Mono
High Freq.
802
II
Mono
High Freq.
502A Mono
Full Range
502A Mono
High Freq.
502A Mono
High Freq.
502A Mono
High Freq.
502A Mono
High Freq.
802
II
Mono
Full Range
802
II
Mono
High Freq.
802
II
Mono
High Freq.
802
II
Mono
High Freq.
802
II
Mono
High Freq.
802
II
Mono
Full Range
802
II
Mono
High Freq.
802
II
Mono
High Freq.
802
II
Mono
High Freq.
502A Mono
Full Range
502B Mono
Low
MB4 Mono
Low
AWCS
Mono Low
502A Mono
High Freq.
802
II
Mono
Full Range
502B Mono
Low
MB4 Mono
Low
AWCS
Mono Low
802
Mono
II
High Freq.
802
II
Mono
Full Range
502B Mono
Low
AWCS
Mono Low
802
Mono
II
High Freq.
502A Mono
Full Range
502B Mono
Low
MB4 Mono
Low
AWCS
Mono Low
502A Mono
High Freq.
802
II
Mono
Full Range
502B Mono
Low
MB4 Mono
Low
AWCS
Mono Low
802 II Mono
High Freq.
802
II
Mono
Full Range
502B Mono
Low
AWCS
Mono Low
802 II Mono
High Freq.
43
Page 44

APPENDIX
Bose® Loudspeaker EQ Preset List- Mono Bank (continued)
LCD Display Preset Description Output Default Configuration
Mono Presets Channel 1 Channel 2 Channel 3 Channel 4
802
III
802
+502B
III
802
+MB4 802 Series
III
802
+AWCS 802 Series
III
802
HF 802 Series
III
802
STK Stacked 802 Series
III
802
III
STK+502
802
+AWCS
802
STK+MB4
802
B
STK
III
III
STK HF 802 Series
III
802 Series
full range EQ
802 Series
bi-amped with 502B
bi-amped with MB4
bi-amped with AWCS
Note:
channels 3 and 4 for
protection of the AWCS
bi-amped at 125 Hz
loudspeaker full range EQ
Stacked 802 Series
loudspeaker bi-amped with
502B
802 Series
bi-amped with AWCS
Note:
channels 3 and 4 for
protection of the AWCS
Stacked 802 Series
loudspeaker
bi-amped with MB4
bi-amped at 125 Hz
Limiting is assigned to
Limiting is assigned to
loudspeaker
III
loudspeaker
III
loudspeaker
III
loudspeaker
III
loudspeaker
III
loudspeaker
III
loudspeaker
III
III
III
III
802
III
Mono
Full Range
802
III
Mono
High Freq.
802
III
Mono
High Freq.
802
III
Mono
High Freq.
802
III
Mono
High Freq.
802
III
Mono
Full Range
802
III
Mono
High Freq.
802
III
Mono
High Freq.
802
III
Mono
High Freq.
802
III
Mono
High Freq.
802
III
Mono
Full Range
802
III
Mono
High Freq.
802
III
Mono
High Freq.
802
III
Mono
High Freq.
802
III
Mono
High Freq.
802
III
Mono
Full Range
802
III
Mono
High Freq.
802
III
Mono
High Freq.
802
III
Mono
High Freq.
802
III
Mono
High Freq.
802
III
Mono
Full Range
502B Mono
Low
MB4 Mono
Low
AWCS
Mono Low
802
III
Mono
High Freq.
802
III
Mono
Full Range
502B Mono
Low
AWCS
Mono Low
MB4 Mono
Low
802
III
Mono
High Freq.
802
III
Mono
Full Range
502B Mono
Low
MB4 Mono
Low
AWCS
Mono Low
802
III
Mono
High Freq.
802
III
Mono
Full Range
502B Mono
Low
AWCS
Mono Low
MB4 Mono
Low
802
III
Mono
High Freq.
44
Page 45

APPENDIX
Bose® Loudspeaker EQ Preset List- Mono Bank (continued)
LCD Display Preset Description Output Default Configuration
Mono Presets Channel 1 Channel 2 Channel 3 Channel 4
MA12 WALL MA12 loudspeaker full range
Wall mount EQ
MA12 FREE MA12 loudspeaker full range
Free field EQ
MA12+502B MA12 loudspeaker
bi-amped with 502B
MA12+MB4 MA12 loudspeaker
bi-amped with MB4
MA12 HF MA12 loudspeaker
bi-amped at 160 Hz
MA12STK
WALL
MA12STK
FREE
MA12STK+502BMA12 loudspeaker
MA12STK+MB4MA12 loudspeaker
MA12STK HF MA12 loudspeaker
MA12 loudspeaker full range
Wall mount EQ
MA12 loudspeaker full range
Free field EQ
bi-amped with 502B
bi-amped with MB4
bi-amped at 160 Hz
MA12
Mono
Full Range
MA12
Mono
Full Range
MA12
Mono
High Freq.
MA12
Mono
High Freq.
MA12
Mono
High Freq.
MA12
Mono
Full Range
MA12
Mono
Full Range
MA12
Mono
High Freq.
MA12
Mono
High Freq.
MA12
Mono
High Freq.
MA12
Mono
Full Range
MA12
Mono
Full Range
MA12
Mono
High Freq.
MA12
Mono
High Freq.
MA12
Mono
High Freq.
MA12
Mono
Full Range
MA12
Mono
Full Range
MA12
Mono
High Freq.
MA12
Mono
High Freq.
MA12
Mono
High Freq.
MA12 Mono
Full Range
MA12 Mono
Full Range
502B Mono
Low
MB4 Mono
Low
MA12 Mono
High Freq.
MA12 Mono
Full Range
MA12 Mono
Full Range
502B Mono
Low
MB4 Mono
Low
MA12 Mono
High Freq.
MA12 Mono
Full Range
MA12 Mono
Full Range
502B Mono
Low
MB4 Mono
Low
MA12 Mono
High Freq.
MA12 Mono
Full Range
MA12 Mono
Full Range
502B Mono
Low
MB4 Mono
Low
MA12 Mono
High Freq.
LCD Display Preset Description Output Default Configuration
Mono Presets Channel 1 Channel 2 Channel 3 Channel 4
MB4 100 Hz LP MB4 loudspeaker 100 Hz
Low pass
MB4 160 Hz LP MB4 loudspeaker 160 Hz
Low pass
MB4 200 Hz LP MB4 loudspeaker 200 Hz
Low pass
MB4 280 Hz LP MB4 loudspeaker 280 Hz
Low pass
MB4 MB4 MB4 MB4
MB4 MB4 MB4 MB4
MB4 MB4 MB4 MB4
MB4 MB4 MB4 MB4
45
Page 46

APPENDIX
Bose® Loudspeaker EQ Preset List- Mono Bank (continued)
LCD Display Preset Description Output Default Configuration
Mono Presets Channel 1 Channel 2 Channel 3 Channel 4
502B
LCD Display Preset Description Output Default Configuration
Mono Presets Channel 1 Channel 2 Channel 3 Channel 4
502BEX 502BEX loudspeaker Mono
LCD Display Preset Description Output Default Configuration
Mono Presets Channel 1 Channel 2 Channel 3 Channel 4
AWCS AWCS loudspeaker Mono low
LCD Display Preset Description Output Default Configuration
502B loudspeaker Mono low
pass 160 Hz
low pass 200 Hz
pass with limiting assigning to
all four channels
502B 502B 502B 502B
502BEX 502BEX 502BEX 502BEX
AWCS AWCS AWCS AWCS
Mono Presets Channel 1 Channel 2 Channel 3 Channel 4
LT3202
LT3202
CLUSTER
LT3202+MB4 LT3202 loudspeaker
LT3202+
502BEX
LCD Display Preset Description Output Default Configuration
Mono Presets Channel 1 Channel 2 Channel 3 Channel 4
LT4402
LT4402
CLUSTER
LT4402+MB4 LT4402 loudspeaker
LT4402+
502BEX
LT3202 loudspeaker full
range EQ
LT3202 loudspeaker cluster
EQ
bi-amped with MB4
LT3202 loudspeaker
bi-amped with 502BEX
LT4402 loudspeaker full
range EQ
LT4402 loudspeaker cluster
EQ
bi-amped with MB4
LT4402 loudspeaker
bi-amped with 502BEX
LT3202
Mono
Full Range
LT3202
Mono
Full Range
LT3202
Mono
High Freq.
LT3202
Mono
High Freq.
LT4402
Mono
Full Range
LT4402
Mono
Full Range
LT4402
Mono
High Freq.
LT4402
Mono
High Freq.
LT3202
Mono
Full Range
LT3202
Mono
Full Range
LT3202
Mono
High Freq.
LT3202
Mono
High Freq.
LT4402
Mono
Full Range
LT4402
Mono
Full Range
LT4402
Mono
High Freq.
LT4402
Mono
High Freq.
LT3202
Mono
Full Range
LT3202
Mono
Full Range
MB4 Mono
Low
502BEX
Mono Low
LT4402
Mono
Full Range
LT4402
Mono
Full Range
MB4 Mono
Low
502BEX
Mono Low
LT3202
Mono
Full Range
LT3202
Mono
Full Range
MB4 Mono
Low
502BEX
Mono Low
LT4402
Mono
Full Range
LT4402
Mono
Full Range
MB4 Mono
Low
502BEX
Mono Low
46
Page 47

APPENDIX
Bose® Loudspeaker EQ Preset List- Mono Bank (continued)
LCD Display Preset Description Output Default Configuration
Mono Presets Channel 1 Channel 2 Channel 3 Channel 4
LT9702
LT9702
CLUSTER
LT9702+MB4 LT9702 loudspeaker
LT9702+
502BEX
LCD Display Preset Description Output Default Configuration
Mono Presets Channel 1 Channel 2 Channel 3 Channel 4
M8 Model 8 loudspeaker full
M8+MB4 Model 8 loudspeaker
M8+FS3 Model 8 loudspeaker
M8+FS1B Model 8 loudspeaker
LT9702 loudspeaker full
range EQ
LT9702 loudspeaker cluster
EQ
bi-amped with MB4
LT9702 loudspeaker
bi-amped with 502BEX
range EQ
bi-amped with MB4
bi-amped with FS3
loudspeaker system
bi-amped with FS 1B
loudspeaker
LT9702
Mono
Full Range
LT9702
Mono
Full Range
LT9702
Mono
High Freq.
LT9702
Mono
High Freq.
M8 Mono
Full Range
M8 Mono
High Freq.
M8 Mono
High Freq.
M8 Mono
High Freq.
LT9702
Mono
Full Range
LT9702
Mono
Full Range
LT9702
Mono
High Freq.
LT9702
Mono
High Freq.
M8 Mono
Full Range
M8 Mono
High Freq.
M8 Mono
High Freq.
M8 Mono
High Freq.
LT9702
Mono
Full Range
LT9702
Mono
Full Range
MB4 Mono
Low
502BEX
Mono Low
M8 Mono
Full Range
MB4 Mono
Low
FS3 Mono
Low
FS1B Mono
Low
LT9702
Mono
Full Range
LT9702
Mono
Full Range
MB4 Mono
Low
502BEX
Mono Low
M8 Mono
Full Range
MB4 Mono
Low
FS3 Mono
Low
FS1B Mono
Low
LCD Display Preset Description Output Default Configuration
Mono Presets Channel 1 Channel 2 Channel 3 Channel 4
M32 Model 32 loudspeaker full
range EQ
M32+MB4 Model 32 loudspeaker
bi-amped with MB4
M32+FS3 Model 32 loudspeaker
bi-amped with FS3
loudspeaker system
M32+FS1B Model 32 loudspeaker
bi-amped with FS 1B
loudspeaker
M32+502BEX Model 32 loudspeaker
bi-amped with 502BEX
M32 Mono
Full Range
M32 Mono
High Freq.
M32 Mono
High Freq.
M32 Mono
High Freq.
M32 Mono
High Freq.
M32 Mono
Full Range
M32 Mono
High Freq.
M32 Mono
High Freq.
M32 Mono
High Freq.
M32 Mono
High Freq.
M32 Mono
Full Range
MB4 Mono
Low
FS3 Mono
Low
FS1B Mono
Low
502BEX
Mono Low
M32 Mono
Full Range
MB4 Mono
Low
FS3 Mono
Low
FS1B Mono
Low
502BEX
Mono Low
47
Page 48

APPENDIX
Bose® Loudspeaker EQ Preset List- Mono Bank (continued)
LCD Display Preset Description Output Default Configuration
Mono Presets Channel 1 Channel 2 Channel 3 Channel 4
FS1B 100 Hz
LP
FS1B Surface FreeSpace Model 1B
FS1B Flush FreeSpace Model 1B
LCD Display Preset Description Output Default Configuration
Mono Presets Channel 1 Channel 2 Channel 3 Channel 4
FS3 100 Hz LP FreeSpace 3 bass 100 Hz
FS3 150 Hz LP FreeSpace 3 bass 150 Hz
LCD Display Preset Description Output Default Configuration
Mono Presets Channel 1 Channel 2 Channel 3 Channel 4
FS360 Hard FreeSpace 360 loudspeaker
FS360 Soft FreeSpace 360 loudspeaker
FS360 Deck FreeSpace 360 loudspeaker
FreeSpace Model 1B
loudspeaker 100 Hz Low
Pass
loudspeaker surface mount
loudspeaker flush mount
Low Pass
Low Pass
in ground hard EQ
in ground soft EQ
deck EQ
FS1B FS1B FS1B FS1B
FS1B FS1B FS1B FS1B
FS1B FS1B FS1B FS1B
FS3 FS3 FS3 FS3
FS3 FS3 FS3 FS3
FS360
Mono full
range
FS360
Mono full
range
FS360
Mono full
range
FS360
Mono full
range
FS360
Mono full
range
FS360
Mono full
range
FS360
Mono full
range
FS360
Mono full
range
FS360
Mono full
range
FS360
Mono full
range
FS360
Mono full
range
FS360
Mono full
range
48
Page 49

APPENDIX
Bose® Loudspeaker EQ Preset List- Stereo Bank
LCD Display Preset Description Output Default Configuration
Stereo Presets Channel 1 Channel 2 Channel 3 Channel 4
402
I
402 I+502B
402 I+MB4 402 Series I loudspeaker
402 I+AWCS 402 Series I loudspeaker
402 I HF 402 Series I loudspeaker
LCD Display Preset Description Output Default Configuration
Stereo Presets Channel 1 Channel 2 Channel 3 Channel 4
402
II
402 II+502B 402 Series II loudspeaker
402 II+502BEX 402 Series II loudspeaker
402 II+MB4 402 Series II loudspeaker
402 II+AWCS 402 Series II loudspeaker
402 II HF 402 Series II loudspeaker
402 Series I loudspeaker full
range EQ
402 Series I loudspeaker
bi-amped with 502B
bi-amped with MB4
bi-amped with AWCS
bi-amped at 160 Hz
402 Series II loudspeaker full
range EQ
bi-amped with 502B
bi-amped with 502BEX
bi-amped with MB4
bi-amped with AWCS
bi-amped at 160 Hz
402
I
Full Range
402
I
High Freq.
402
I
High Freq.
402
I
High Freq.
402
I
High Freq.
402
II
Full Range
402
II
High Freq.
402
II
High Freq.
402
II
High Freq.
402
II
High Freq.
402
II
High Freq.
402
I
Full Range
402
I
High Freq.
402
I
High Freq.
402
I
High Freq.
402
I
High Freq.
402
II
Full Range
402
II
High Freq.
402
II
High Freq.
402
II
High Freq.
402
II
High Freq.
402
II
High Freq.
402
I
Full Range
502B Low 502B Low
MB4 Low MB4 Low
AWCS Low AWCS Low
402
I
High Freq.
402
II
Full Range
502B Low 502B Low
502BEX
Low
MB4 Low MB4 Low
AWCS Low AWCS Low
402
II
High Freq.
402
I
Full Range
402
I
High Freq.
402
II
Full Range
502BEX
Low
402
II
High Freq.
LCD Display Preset Description Output Default Configuration
Stereo Presets Channel 1 Channel 2 Channel 3 Channel 4
502A 502A loudspeaker full range
EQ
502A+502B 502A loudspeaker bi-amped
with 502B
502A+MB4 502A loudspeaker bi-amped
with MB4
502A+AWCS 502A loudspeaker bi-amped
with AWCS
Limiting is assigned to
Note:
channels 3 and 4 for
protection of the AWCS
502A HF 502A loudspeaker bi-amped
with at 180 Hz
502A
Full Range
502A
High Freq.
502A
High Freq.
502A
High Freq.
502A
High Freq.
502A
Full Range
502A
High Freq.
502A
High Freq.
502A
High Freq.
502A
High Freq.
502A
Full Range
502B Low 502B Low
MB4 Low MB4 Low
AWCS Low AWCS Low
502A
High Freq.
502A
Full Range
502A
High Freq.
49
Page 50

APPENDIX
Bose® Loudspeaker EQ Preset List- Stereo Bank (continued)
LCD Display Preset Description Output Default Configuration
Stereo Presets Channel 1 Channel 2 Channel 3 Channel 4
802
II
802 II+502B
802 II+MB4 802 Series II loudspeaker
802 II+AWCS 802 Series II loudspeaker
802 II HF 802 Series II loudspeaker
802 II STK Stacked 802 Series
802
II
STK+502B
802
II
STK+MB4
802 II STK
+AWCS
802 II STK HF 802 Series II loudspeaker
802 Series II loudspeaker full
range EQ
802 Series II loudspeaker
bi-amped with 502B
bi-amped with MB4
bi-amped with AWCS
Limiting is assigned to
Note:
channels 3 and 4 for
protection of the AWCS
bi-amped at 112 Hz
II
loudspeaker full range EQ
Stacked 802 Series
loudspeaker bi-amped with
502B
802 Series II loudspeaker
bi-amped with MB4
Stacked 802 Series
loudspeaker bi-amped with
AWCS
assigned to channels 3 and 4
for protection of the AWCS
bi-amped at 112 Hz
Note:
Limiting is
II
II
802
II
Full Range
802
II
High Freq.
802
II
High Freq.
802
II
High Freq.
802
II
High Freq.
802
II
Full Range
802
II
High Freq.
802
II
High Freq.
802
II
High Freq.
802
II
High Freq.
802
II
Full Range
802
II
High Freq.
802
II
High Freq.
802
II
High Freq.
802
II
High Freq.
802
II
Full Range
802
II
High Freq.
802
II
High Freq.
802
II
High Freq.
802
II
High Freq.
802
II
Full Range
502B Low 502B Low
MB4 Low MB4 Low
AWCS Low AWCS Low
802
II
High Freq.
802
II
Full Range
502B Low 502B Low
MB4 Low MB4 Low
AWCS Low AWCS Low
802
II
High Freq.
802
II
Full Range
802
II
High Freq.
802
II
Full Range
802
II
High Freq.
50
Page 51

APPENDIX
Bose® Loudspeaker EQ Preset List- Stereo Bank (continued)
LCD Display Preset Description Output Default Configuration
Stereo Presets Channel 1 Channel 2 Channel 3 Channel 4
802
III
802
+502B
III
802
+MB4 802 Series
III
802
+AWCS 802 Series
III
802
HF 802 Series
III
802
STK Stacked 802 Series
III
802
III
STK+502B
802
III
STK+MB4
802
STK
III
+AWCS
802
STK HF 802 Series
III
802 Series
full range EQ
802 Series
bi-amped with 502B
bi-amped with MB4
bi-amped with AWCS
Note:
channels 3 and 4 for
protection of the AWCS
bi-amped at 112 Hz
loudspeaker full range EQ
Stacked 802 Series
loudspeaker bi-amped with
502B
802 Series
bi-amped with MB4
Stacked 802 Series
loudspeaker bi-amped with
AWCS
assigned to channels 3 and 4
for protection of the AWCS
bi-amped at 112 Hz
loudspeaker
III
loudspeaker
III
loudspeaker
III
loudspeaker
III
Limiting is assigned to
loudspeaker
III
III
III
loudspeaker
III
III
Limiting is
Note:
loudspeaker
III
802 III
Full Range
802
III
High Freq.
802
III
High Freq.
802
III
High Freq.
802
III
High Freq.
802
III
Full Range
802
III
High Freq.
802
III
High Freq.
802
III
High Freq.
802
III
High Freq.
802
III
Full Range
802
III
High Freq.
802
III
High Freq.
802
III
High Freq.
802
III
High Freq.
802
III
Full Range
802
III
High Freq.
802
III
High Freq.
802
III
High Freq.
802
III
High Freq.
802
III
Full Range
502B Low 502B Low
MB4 Low MB4 Low
AWCS Low AWCS Low
802
III
High Freq.
802
III
Full Range
502B Low 502B Low
MB4 Low MB4 Low
AWCS Low AWCS Low
802
III
High Freq.
802
III
Full Range
802
III
High Freq.
802
III
Full Range
802
III
High Freq.
51
Page 52

APPENDIX
Bose® Loudspeaker EQ Preset List- Stereo Bank (continued)
LCD Display Preset Description Output Default Configuration
Stereo Presets Channel 1 Channel 2 Channel 3 Channel 4
MA12 WALL MA12 loudspeaker full range
Wall mount EQ
MA12 FREE MA12 loudspeaker full range
free field EQ
MA12+502B MA12 loudspeaker
bi-amped with 502B
MA12+MB4 MA12 loudspeaker
bi-amped with MB4
MA12 HF MA12 loudspeaker
bi-amped at 160 Hz
MA12STK
WALL
MA12STK
FREE
MA12STK+502B MA1 2 lou dspe aker
MA12STK+MB4 MA12 loudspeaker
MA12STK HF MA12 loudspeaker
MA12 loudspeaker full range
Wall mount EQ
MA12 loudspeaker full range
Free field EQ
bi-amped with 502B
bi-amped with MB4
bi-amped at 160 Hz
MA12
Full Range
MA12
Full Range
MA12
High Freq.
MA12
High Freq.
MA12
High Freq.
MA12
Full Range
MA12
Full Range
MA12
High Freq.
MA12
High Freq.
MA12
High Freq.
MA12
Full Range
MA12
Full Range
MA12
High Freq.
MA12
High Freq.
MA12
High Freq.
MA12
Full Range
MA12
Full Range
MA12
High Freq.
MA12
High Freq.
MA12
High Freq.
MA12
Full Range
MA12
Full Range
502B Low 502B Low
MB4 Low MB4 Low
MA12
High Freq.
MA12
Full Range
MA12
Full Range
502B Low 502B Low
MB4 Low MB4 Low
MA12
High Freq.
MA12
Full Range
MA12
Full Range
MA12
High Freq.
MA12
Full Range
MA12
Full Range
MA12
High Freq.
LCD Display Preset Description Output Default Configuration
Stereo Presets Channel 1 Channel 2 Channel 3 Channel 4
MB4 100 Hz LP MB4 loudspeaker 100 Hz
Low pass
MB4 160 Hz LP MB4 loudspeaker 160 Hz
Low pass
MB4 200 Hz LP MB4 loudspeaker 200 Hz
Low pass
MB4 280 Hz LP MB4 loudspeaker 280 Hz
Low pass
LCD Display Preset Description Output Default Configuration
Stereo Presets Channel 1 Channel 2 Channel 3 Channel 4
502B
LCD Display Preset Description Output Default Configuration
Stereo Presets Channel 1 Channel 2 Channel 3 Channel 4
502BEX 502BEX loudspeaker low
502B loudspeaker low pass
160 Hz
pass 200 Hz
MB4 MB4 MB4 MB4
MB4 MB4 MB4 MB4
MB4 MB4 MB4 MB4
MB4 MB4 MB4 MB4
502B 502B 502B 502B
502BEX 502BEX 502BEX 502BEX
52
Page 53

APPENDIX
Bose® Loudspeaker EQ Preset List- Stereo Bank (continued)
LCD Display Preset Description Output Default Configuration
Stereo Presets Channel 1 Channel 2 Channel 3 Channel 4
AWCS AWCS loudspeaker low pass
with limiting assigning to all
four channels
LCD Display Preset Description Output Default Configuration
AWCS AWCS AWCS AWCS
Stereo Presets Channel 1 Channel 2 Channel 3 Channel 4
LT3202
LT3202 cluster LT3202 loudspeaker cluster
LT3202+MB4 LT3202 loudspeaker
LT3202+502BEX LT 3202 loud spea ker
LCD Display Preset Description Output Default Configuration
Stereo Presets Channel 1 Channel 2 Channel 3 Channel 4
LT4402
LT4402 cluster LT4402 loudspeaker cluster
LT4402+MB4 LT4402 loudspeaker
LT4402+502BEX LT 4402 loud spea ker
LT3202 loudspeaker full
range EQ
EQ
bi-amped with MB4
bi-amped with 502BEX
LT4402 loudspeaker full
range EQ
EQ
bi-amped with MB4
bi-amped with 502BEX
LT3202
Full Range
LT3202
Full Range
LT3202
High Freq.
LT3202
High Freq.
LT4402
Full Range
LT4402
Full Range
LT4402
High Freq.
LT4402
High Freq.
LT3202
Full Range
LT3202
Full Range
LT3202
High Freq.
LT3202
High Freq.
LT4402
Full Range
LT4402
Full Range
LT4402
High Freq.
LT4402
High Freq.
LT3202
Full Range
LT3202
Full Range
MB4 Low MB4 Low
502BEX
Low
LT4402
Full Range
LT4402
Full Range
MB4 Low MB4 Low
502BEX
Low
LT3202
Full Range
LT3202
Full Range
502BEX
Low
LT4402
Full Range
LT4402
Full Range
502BEX
Low
LCD Display Preset Description Output Default Configuration
Stereo Presets Channel 1 Channel 2 Channel 3 Channel 4
LT9702
LT9702 cluster LT9702 loudspeaker ClusterEQLT9702
LT9702+MB4 LT9702 loudspeaker
LT9702+502BEX LT 4402 loud spea ker
LT9702 loudspeaker full
range EQ
bi-amped with MB4
bi-amped with 502BEX
LT9702
Full Range
Full Range
LT9702
High Freq.
LT9702
High Freq.
LT9702
Full Range
LT9702
Full Range
LT9702
High Freq.
LT9702
High Freq.
LT9702
Full Range
LT9702
Full Range
LT9702
Full Range
LT9702
Full Range
MB4 Low MB4 Low
502BEX
Low
502BEX
Low
53
Page 54

APPENDIX
Bose® Loudspeaker EQ Preset List- Stereo Bank (continued)
LCD Display Preset Description Output Default Configuration
Stereo Presets Channel 1 Channel 2 Channel 3 Channel 4
M8 Model 8 loudspeaker full
range EQ
M8+MB4 Model 8 loudspeaker
bi-amped with MB4
M8+FS3 Model 8 loudspeaker
bi-amped with FS3
loudspeaker system
M8+FS1B Model 8 loudspeaker
bi-amped with FS 1B
loudspeaker
LCD Display Preset Description Output Default Configuration
Stereo Presets Channel 1 Channel 2 Channel 3 Channel 4
M32 Model 32 loudspeaker full
range EQ
M32+MB4 Model 32 loudspeaker
bi-amped with MB4
M32+FS3 Model 32 loudspeaker
bi-amped with FS3
loudspeaker system
M32+FS1B Model 32 loudspeaker
bi-amped with FS 1B
loudspeaker
M32+502BEX Model 32 loudspeaker
bi-amped with 502BEX
M8
Full RangeM8Full RangeM8Full RangeM8Full Range
M8
High Freq.M8High Freq.
M8
High Freq.M8High Freq.
M8
High Freq.M8High Freq.
M32
Full Range
M32
High Freq.
M32
High Freq.
M32
High Freq.
M32
High Freq.
M32
Full Range
M32
High Freq.
M32
High Freq.
M32
High Freq.
M32
High Freq.
MB4 Low MB4 Low
FS3 Low FS3 Low
FS1B Low FS1B Low
M32
Full Range
MB4 Low MB4 Low
FS3 Low FS3 Low
FS1B Low FS1B Low
502BEX
Low
M32
Full Range
502BEX
Low
LCD Display Preset Description Output Default Configuration
Stereo Presets Channel 1 Channel 2 Channel 3 Channel 4
FS1B 100 Hz
LP
FS1B Surface FreeSpace Model 1B
FS1B Flush FreeSpace Model 1B
LCD Display Preset Description Output Default Configuration
Stereo Presets Channel 1 Channel 2 Channel 3 Channel 4
FS3 100 Hz LP FreeSpace 3 bass 100 Hz
FS3 150 Hz LP FreeSpace 3 bass 150 Hz
FreeSpace Model 1B
loudspeaker 100 Hz Low
Pass
loudspeaker surface mount
loudspeaker flush mount
Low Pass
Low Pass
FS1B FS1B FS1B FS1B
FS1B FS1B FS1B FS1B
FS1B FS1B FS1B FS1B
FS3 FS3 FS3 FS3
FS3 FS3 FS3 FS3
54
Page 55

APPENDIX
Bose® Loudspeaker EQ Preset List- Stereo Bank (continued)
LCD Display Preset Description Output Default Configuration
Stereo Presets Channel 1 Channel 2 Channel 3 Channel 4
FS360 Hard FreeSpace 360 loudspeaker
in ground hard EQ
FS360 Soft FreeSpace 360 loudspeaker
in ground soft EQ
FS360 Deck FreeSpace 360 loudspeaker
deck EQ
Bose Loudspeaker EQ Preset List- Bass Array Bank
LCD Display Preset Description Output Default Configuration
Bass Array Presets Channel 1 Channel 2 Channel 3 Channel 4
MB4 2xBS180 Hz T he MB 4 2x b road side bass
array preset provides 360 degree
horizontal coverage with a 10 to
15 dB suppression in energy
going up and down from 80 – 200
Hz. The crossover is set at 180
Hz and is recommended for use
with MA12, MB4 and 02 series
speakers.
MB4 2xBS280 Hz T he MB 4 2x b road side bass
array preset provides 360 degree
horizontal coverage with a 10 to
15 dB suppression in energy
going up and down from 80 – 200
Hz. The crossover is set at 280
Hz and is recommended for use
with LT series.
MB4 2xEF180 Hz Th e MB4 2 x endf ire b a ss ar ray
preset provides 180 degree
conical dispersion @ 160 Hz The
crossover is set at 180 Hz and is
recommended for use with MA12,
MB4 and 02 series speakers.
MB4 2xEF280 Hz Th e MB4 2 x endf ire b a ss ar ray
preset provides 180 degree
conical dispersion @ 160 Hz The
crossover is set at 280 Hz and is
recommended for use with MA12,
MB4 and LT series speakers.
MB4 4xEF180 Hz Th e MB4 4 x endf ire b a ss ar ray
preset provides 120 degree
conical dispersion @ 160 Hz The
crossover is set at 180 Hz and is
recommended for use with MA12,
MB4 and 02 series speakers.
MB4 4xEF280 Hz Th e MB4 4 x endf ire b a ss ar ray
preset provides 120 degree
conical dispersion @ 160 Hz The
crossover is set at 280 Hz and is
recommended for use with MA12,
MB4 and LT series speakers.
FS360 full
range
FS360 full
range
FS360 full
range
MB4/Mono MB4 /M ono N /A N /A
MB4/Mono MB4 /M ono N /A N /A
MB4/Mono MB4 /M ono N /A N /A
MB4/Mono MB4 /M ono N /A N /A
MB4/Mono MB4 /M ono M B4 /Mo no MB4/Mono
MB4/Mono MB4 /M ono M B4 /Mo no MB4/Mono
FS360 full
range
FS360 full
range
FS360 full
range
FS360 full
range
FS360 full
range
FS360 full
range
FS360 full
range
FS360 full
range
FS360 full
range
55
Page 56

THEORY OF OPERATION
The following is a brief functional description of the main and front panel PCBs for the Panaray
System Digital Controller.
Main PCB Overview
The main PCB includes the following features and main functional components:
• DSP for audio processing with associated SRAM and Flash memory
• Analog audio input
• Analog audio output
• MIDI interface (Input, Output)
• Support for 44.1 kHz
• Serial SPI interface to front panel
Front Panel PCB Overview
The front panel PCB includes the following features and main functional components:
• AVR microprocessor for handling display, keys, LEDs and encoder
• Reset
• 2 x 16 character display
• Keys and LEDs
• Encoder
• Standby button
®
Figure 3. Panaray Platform Diagram
56
Page 57

THEORY OF OPERATION
Power Supply
The power supply is a primary switch mode power supply (SMPS) which generates DC voltages
for the main PCB and front panel PCB.
Most digital logic runs at 3.3V to minimize power consumption. A few digital components run on a
5V digital voltage. The
a 5V low noise analog voltage which is generated on the main PCB by linear regulation from
+15V.
The DC voltages from the power supply is led to the front panel PCB as well.
The total maximum power consumption is below 15 Watts.
The power supply used on the Panaray
are no schematic diagrams available for it. The entire power supply PCB should be replaced in
the event of a failure.
DSP Circuit
+ 15V voltage is primarily used by the analog circuits. Each CODEC has
®
Digital Controller is non-repairable. As a result, there
The DSP (Digital Signal Processor) is the heart of the main PCB. This is the device that performs the sound processing and is the host processor of the system. The DSP is a 24 bit 56362
Digital Signal Processor from Motorola, which runs with a clock frequency of 100 MHz.
The DSP receives analog audio (through CODEC #1). These audio signals are transferred to
the DSP as serial digital data. The DSP processes the audio data as defined in software programs and transmits the processed audio data to the CODECs for analog output.
The DSP has attached 24 x 128 bit of fast SRAM. Software programs are transferred from Flash
to SRAM and executed from there. The SRAM is also used for temporary data storage.
The 8 x 256k bit Flash stores the programs to be executed in the DSP. Also presets are stored in
Flash memory. The Flash can be programmed in-circuit.
Boot
The DSP can either boot from the Flash or from the serial port interface. Flash boot is default. If
SPI boot is required, the “SPI_DOWNLOAD” signal must be pulled high. Booting from serial port
interface is an option which can be used for downloading new software to the Flash memory.
Downloading new code can be done directly on the connector to the MIDI port. When downloading through the MIDI port, data is sent to the microcontroller on the front panel PCB. The
microcontroller has access to the DSP RESET pin and the serial port interface. This way the
data can be retransmitted to the DSP through serial port interface.
JTAG
The DSP has a JTAG interface, which is used for debugging and hardware testing.
57
Page 58

THEORY OF OPERATION
Clock Circuit
The clock circuit selects and distributes the correct clock frequency to the rest of the main PCB.
The clock circuit is formed upon one independent clock oscillator, which is a NAND gate crystal
oscillator.
The clock oscillator is the base frequency for the 44.1 kHz sample frequency. The frequency of
the oscillator is 512 times the sample frequency. The clock oscillator has its own enable signal.
When the enable signal is high, the clock oscillator is active. There is a pull-up resistor on the
clock oscillator which ensures that the oscillator will start running during power up and reset
conditions.
The DSP core and CODEC #1 and #2 always runs at the crystal oscillator frequency.
Analog/Digital Audio Routing
The block diagram, Figure 4, shows the routing for the analog and digital audio signals. The
analog inputs and outputs are balanced, thus pin 3 should be connected to pin 1 when used with
unbalanced equipment. Both the input and output levels are controlled by the DSP. CODEC #1
converts the analog input signal to a digital signal. The DSP performs the sound processing and
the digital signal is forwarded to CODEC #1 and #2 where the signals are converted back to
analog signals.
Front Panel AVR Microprocessor
The microprocessor controls the display, encoder, keys and LEDs on the front panel PCB. The
microprocessor communicates with the DSP through a serial port interface.
Reset
The master reset controls the microprocessor. The microcontroller has access to the DSP
RESET pin so after the microcontroller wakes up it pulls the DSP out of reset.
Display
The display is a 2 x 16 character with back lighting.
Keys and LEDs
On the front panel PCB there are six keys. Four of the keys have built-in LEDs. The keys and
LEDs are part of a matrix circuit which are constantly scanned by the microprocessor.
58
Page 59

THEORY OF OPERATION
Figure 4. Block Diagram
59
Page 60

Service Manual Revision History
Date Revision
Level
6/02 00 Document released at revision 00. Service manual
4/06 01 Added new part number for the front panel
PCB assembly. Changed order of
information to conform to new service
manual format.
Description of Change Change Driven
By
release
New part number
for front panel
PCB assy
Page(s)
Affected
All
5
60
Page 61

Panaray® System Digital Controller
(US and non-US versions)
©2006 Bose Corporation
Service Manual
Part Number 266601-SM Rev 01
Page 62

SPECIFICATIONS AND FEATURES SUBJECT TO CHANGE WITHOUT NOTICE
Bose Corporation
The Mountain
Framingham Massachusetts USA 01701
P/N 266601-SM Rev. 01 04/2006 (P)
http://serviceops.bose.com
 Loading...