

Page 1
User’s Guide
52000 Series USB Power Sensor/Meter
Taking performance to a new peak
Page 2

Notices
Disclaimer
Warranty
© BOONTON (A WIRELESS TELECOM GROUP COMPANY) 2006 This
document contains information which is protected by copyright.
Reproduction, adaptation, or translation without prior permission is
prohibited, except as allowed under the copyright laws.
www.boonton.com
The information contained in this document is subject to change
without notice.
BOONTON (A WIRELESS TELECOM GROUP COMPANY) MAKES
NO WARRANTY OF ANY KIND WITH REGARD TO THIS MATERIAL,
INCLUDING, BUT NOT LIMITED TO, THE IMPLIED WARRANTIES OF
MERCHANTABILITY AND FITNESS FOR A PARTICULAR PURPOSE.
Boonton shall not be liable for errors contained herein or for
incidental or consequential damages in connection with the
furnishing, performance, or use of this material.
Refer to the warranty card included with the product. A copy of
the specic warranty terms applicable to your Boonton products
and replacement parts can be obtained from . To request more
information or parts, email sales@boonton.com.
Safety Notices
Before installing and operating these products, please read the safety
statements in “Safety and Specications” on page 61.
2 Introduction
Page 3

User’s Guide
Welcome Thank you for choosing the 52000 Series USB Power
Sensors/Meter and welcome to the Boonton User’s Guide.
This manual will guide you through the following sections:
• Software installation
• Hardware installation
• Using the software
• Getting more from your system
Introduction
The 52000 CW power sensors/meter are a new series of products
which connect directly to a laptop or desktop computer using
a standard USB port, without the need for a stand alone meter.
Measurements from the sensor can be displayed on the laptop or
desktop computer or can be integrated into your test system with a
set of user-dened software functions – supplied as standard.
This guide will take you through the software installation stages.
Then it will outline some typical hardware congurations and how to
get the most from your software. Finally, you will be shown how to
integrate the sensor into your test environment.
Key Features
The key features of the 52000 CW power sensor/meter are:
• Perfect for most Power measurement uses, including:
• Installation and maintenance
• Manufacturing test
• ATE
• Research and Development
• Easy to use software
• Quick conguration
• Flexible set-up and system integration
• Small, compact and rugged
• Multiple sensor support on single PC
• No reference calibration required
• Low cost alternative to tradition power measurements
Boonton 52000 Series 3
Page 4

What you should have
Warranty
User’s Guide
Card
USB
Cable
CD
52000 Sensor
52012 CW Power Sensor
ESD
Earth ground must be connected
Max pwr +23dBm avg, +30dBm peak for 1us +/- 10.0VDC Max.
10MHz - 12.4GHz
10nW - 100mW (-50dBm to 20dBm)
Before you start, please check you have the following items (Refer to
Figure 1 “What you should have” on page 4):
• 52000 CW power sensor (52012 or 52018)
• 6 feet (1.82m) USB cable (USB2-AB-06BK)
• Boonton software CD
• Product warranty card
• This User’s Guide
Figure 1 What you should have
If any of these items are missing or damaged, then please contact
your local representative as soon as possible or refer to “Contacting
Boonton ” on page 59.
4 Introduction
Page 5

Introduction .............................................................................................3
Key Features .............................................................................................3
What you should have ..........................................................................4
Installation Of Software
Install procedure .....................................................................................9
Contents
USB Installation
Driver installation with Windows® XP SP2 .................................. 13
Driver installation with Windows® XP SP1 .................................. 16
Hardware Connections
How to connect your sensor ............................................................ 21
Connection to your PC ...................................................................... 21
Connection to your unit under test (UUT) .................................. 22
Connecting multiple sensors ............................................................ 23
Using The Software
Using the software .............................................................................. 25
Zero your sensor .................................................................................. 26
Making a measurement ..................................................................... 26
Measurements using more than one sensor ............................... 28
How to make a pulse power measurement ................................30
Boonton 52000 Series 5
Page 6

Measuring GSM mobile signals ...................................................... 31
Making a measurement ..................................................................... 32
Measuring power greater than +20dBm (100mW) .................. 33
Measuring an attenuator using relative mode .......................... 34
How to use measurement limts ...................................................... 35
How to use trace mode ..................................................................... 38
Error and status messages ............................................................... 42
Sensor not zeroed ................................................................................ 42
Sensor frequency, offset and duty cycle enabled .......................42
Sensor overload .................................................................................. 43
High limit exceeded ............................................................................ 43
Low limit exceeded .............................................................................44
Zero sensor - temperature change ................................................. 44
Manually entered cal factor ............................................................. 45
Description Of Software
Description of icons ............................................................................ 46
Description of menu options. ........................................................... 47
Enhanced Features
Integrating your power sensor......................................................... 49
Troubleshooting
How to x “No Sensor Connected” problems .............................. 51
No sensor is attached to your PC.................................................... 52
The wrong USB driver has been installed ..................................... 52
The USB cable or USB port are faulty ............................................53
Incorrectly congured USB hub ..................................................... 53
More than one application has been started ..............................54
Unexpected measurements results ............................................... 54
Check status message ........................................................................54
Your sensor is potentially damaged ............................................... 54
Incorrect offset setting ...................................................................... 54
Incorrect measurement settings ................................................... 54
How to identify your PC operating system ................................. 55
Other useful information .................................................................. 56
What is zeroing? .................................................................................. 56
Pulse measurement and setting the duty cycle. ......................... 56
What is a dB? ........................................................................................57
What is a dBm? .................................................................................... 58
Contact And Support
Contacting Boonton ..........................................................................59
Our Website .........................................................................................59
6 Contents
Page 7

Safety And Specications
Safety notices ...................................................................................... 60
EC declaration of conformity ........................................................... 61
WEEE Directive ..................................................................................... 62
Product descriptions and requirements ........................................62
Minimum PC requirements ............................................................... 62
52012 Description ............................................................................... 62
52018 Description ............................................................................... 62
52000 Series Specications ............................................................. 63
Index ........................................................................................................65
Boonton 52000 Series 7
Page 8

This page is intentionally left blank
8 Installation
Page 9

1 Installation Of Software
This chapter provides information about installing the Boonton
power sensor/meter software.
Before you start, please check your PC for software compatibility.
Refer to “Minimum PC requirements” on page 63 for more
information.
Install procedure
To install the Boonton software, follow these steps:
Caution Do not connect any hardware to your PC until you have
installed the Boonton software.
Note If you are using Windows XP SP1, disconnect any LAN
connections. This will prevent your PC automatically downloading
the wrong USB drivers.
Do this Comment
1. Insert the CD into your PC The installation should start automatically.
2. (Optional) If the installation
does not start automatically,
select Start > Run and type
d:\BoontonSensorInstallation.exe
3. Select Continue Refer to Figure 2 on page 10.
Where D:\ is the name of your CD drive.
Boonton 52000 Series 9
Page 10
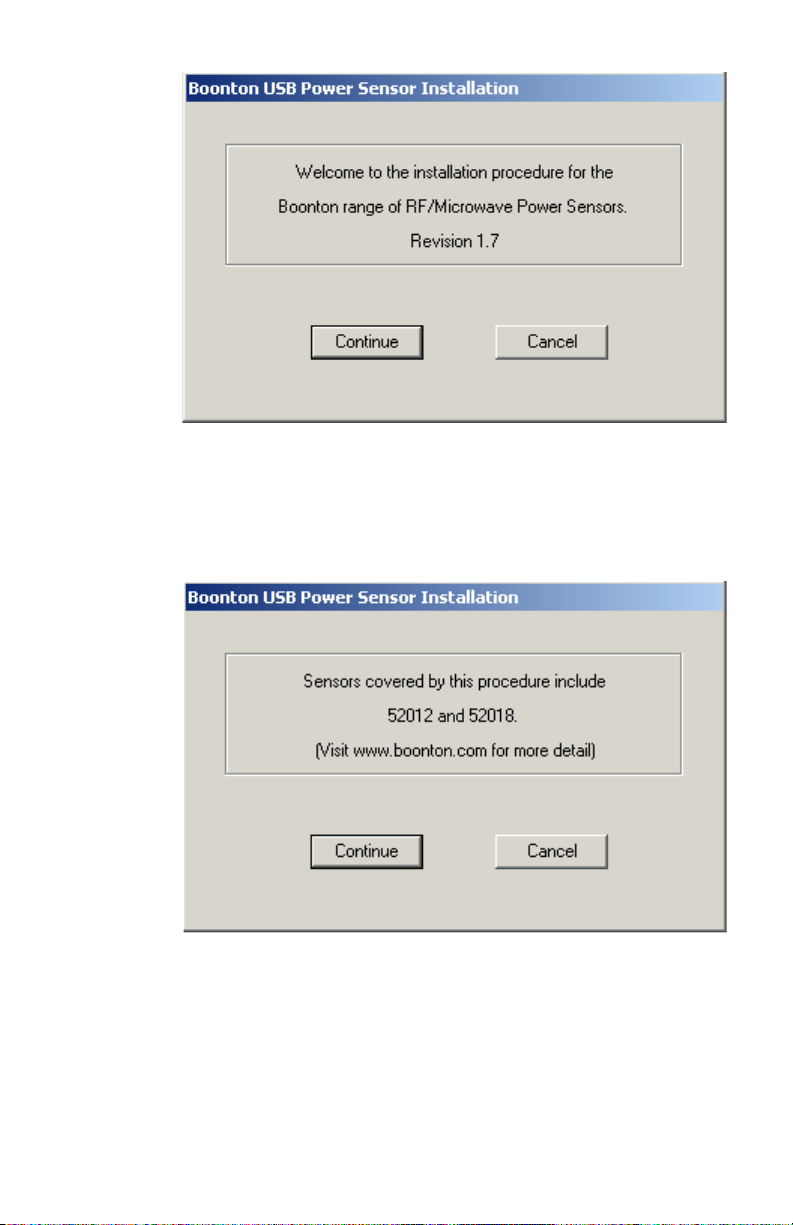
Figure 2 Start of installation software
4 Check the software matches your sensor types and then select
Continue The sensor part numbers are listed on the side of the sensor.
Refer to Figure 3 on page 10.
Figure 3 Check sensor part number
5 Carefully read all of the License Agreement. If you accept the terms
and conditions of the license agreement, enable the Accept option
and then select Continue.
If you have any questions about this agreement, then please contact
us. Refer to Figure 4 on page 11.
10 Software Installation
Page 11
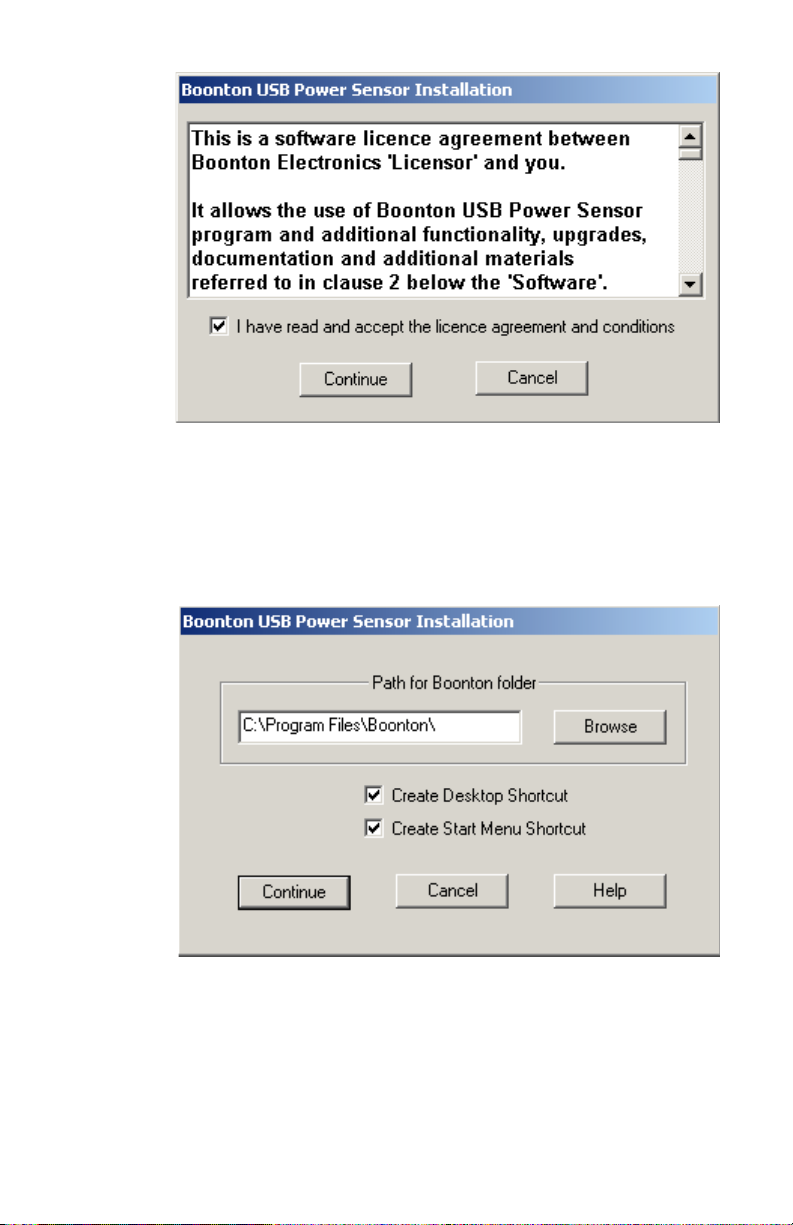
Figure 4 License agreement
6 Choose the installation location, whether you want a desktop icon
and a shortcut added to your start menu, then select Continue It is
recommended that you use the default installation options.
Refer to Figure 5 on page 11.
Figure 5 Installation location
7 Select Finish when the installation has completed
Refer to Figure 6 on page 12.
Boonton 52000 Series 11
Page 12
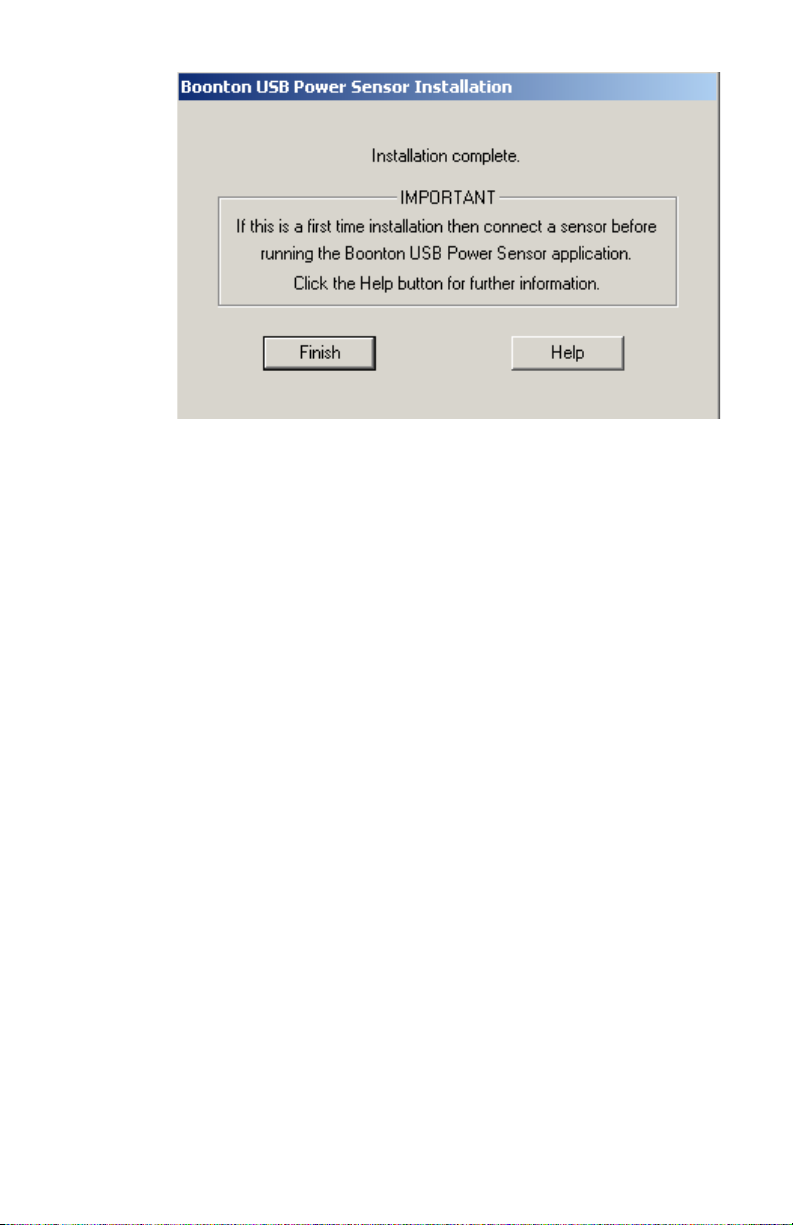
Figure 6 Installation completed
Note At the end of the installation you are asked to connect your
sensor. Refer to “USB Installation” on page 13 for more information.
12 Software Installation
Page 13

2 USB Installation
This chapter explains the process for installing and enabling the USB
drivers for your 52000 series CW power sensor/meter. These drivers
are required to enable effective measurement data Transfer.
There are two USB driver installation procedures covered in this
chapter – one for Windows® XP SP1 and the other for Windows® XP
SP2. To identify which operating system you have on your PC, refer to
“How to identify your PC operating system” on page 55.
Driver installation with Windows® XP SP2
This section describes how to install and congure your USB drivers
on a PC with Windows® XP and service pack 2 (SP2) operating
system.
Caution Do not connect your sensor and install the USB drivers
unless you have installed the Boonton software. Refer to “Installation
Of Software” on page 9 for more information.
1. Connect your sensor to the USB port of your PC. The Windows
Hardware Wizard starts automatically.
Refer to “How to connect your sensor” on page 21 for more
information.
2. Choose “No not at this time” and select Next.
Refer to Figure 7 on page 14.
Boonton 52000 Series 13
Page 14
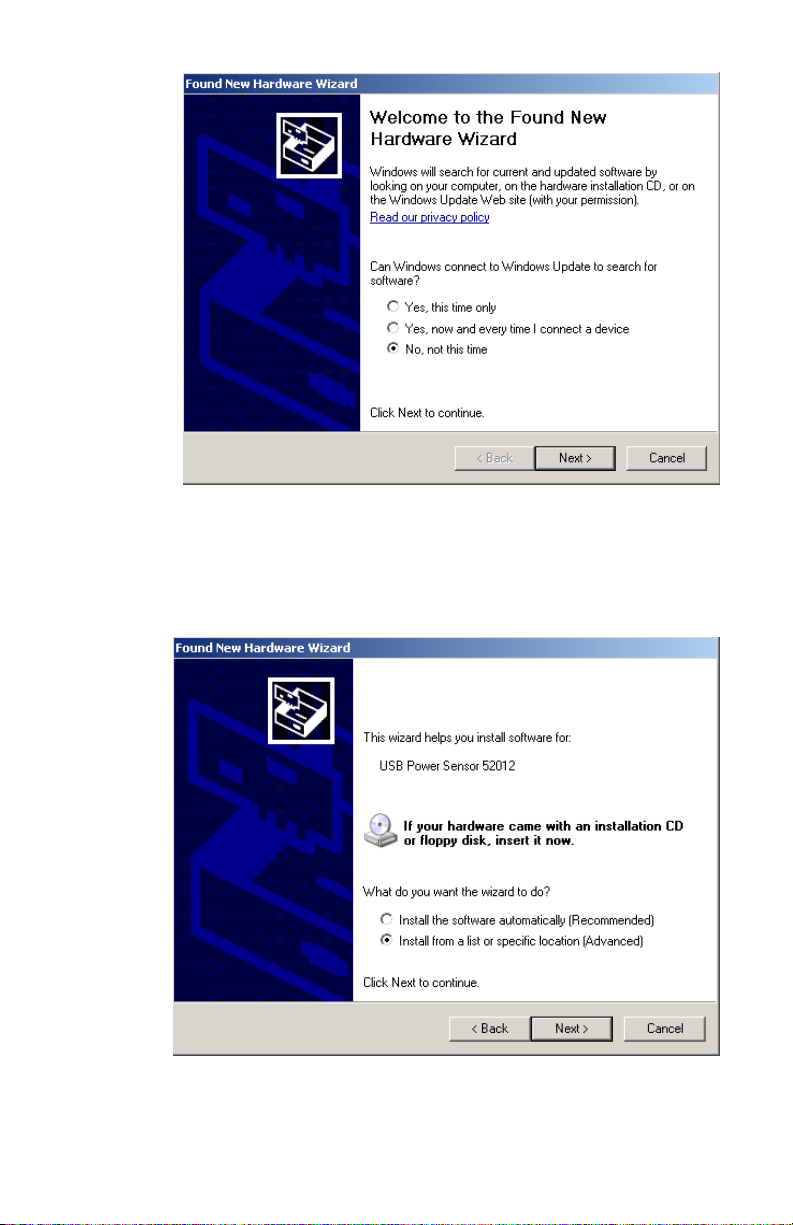
Figure 7 Windows hardware installation wizard
3. Choose “Install from a list or specic location (Advanced)” and
select Next.
Refer to Figure 8 on page14.
Figure 8 USB Driver location
14 USB Installation
Page 15
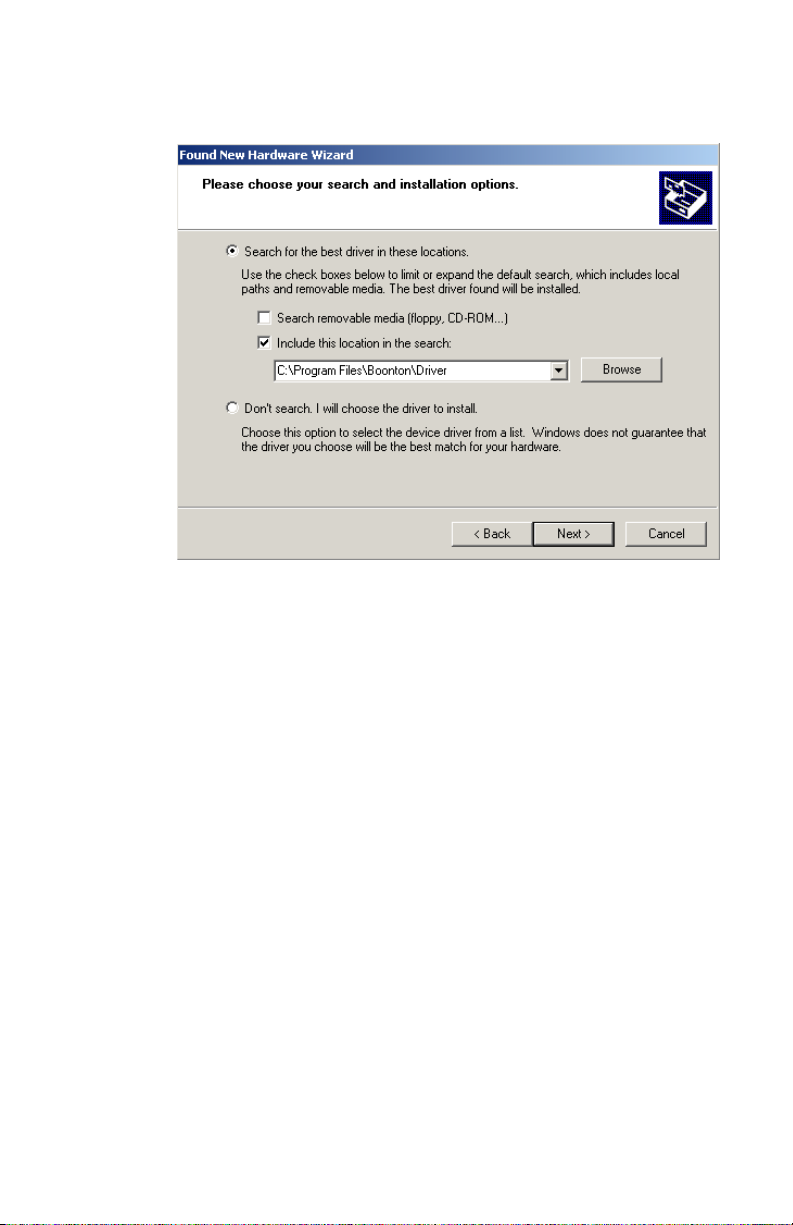
4. Choose “Include this location in the search”.
Refer to Figure 9 on page 15.
Figure 9 Choose the installation location
5. Browse to the following location: C:\ProgramFiles\Boonton\Driver.
If you have changed the default installation location, navigate to the
Boonton installation folder.
6. Select Next.
7. (Optional) During the installation Windows may check the driver
compatibility. Select Continue Anyway. The USB sensor driver is a
valid driver and will not damage your system. Refer to Figure 10 on
page 16.
Boonton 52000 Series 15
Page 16
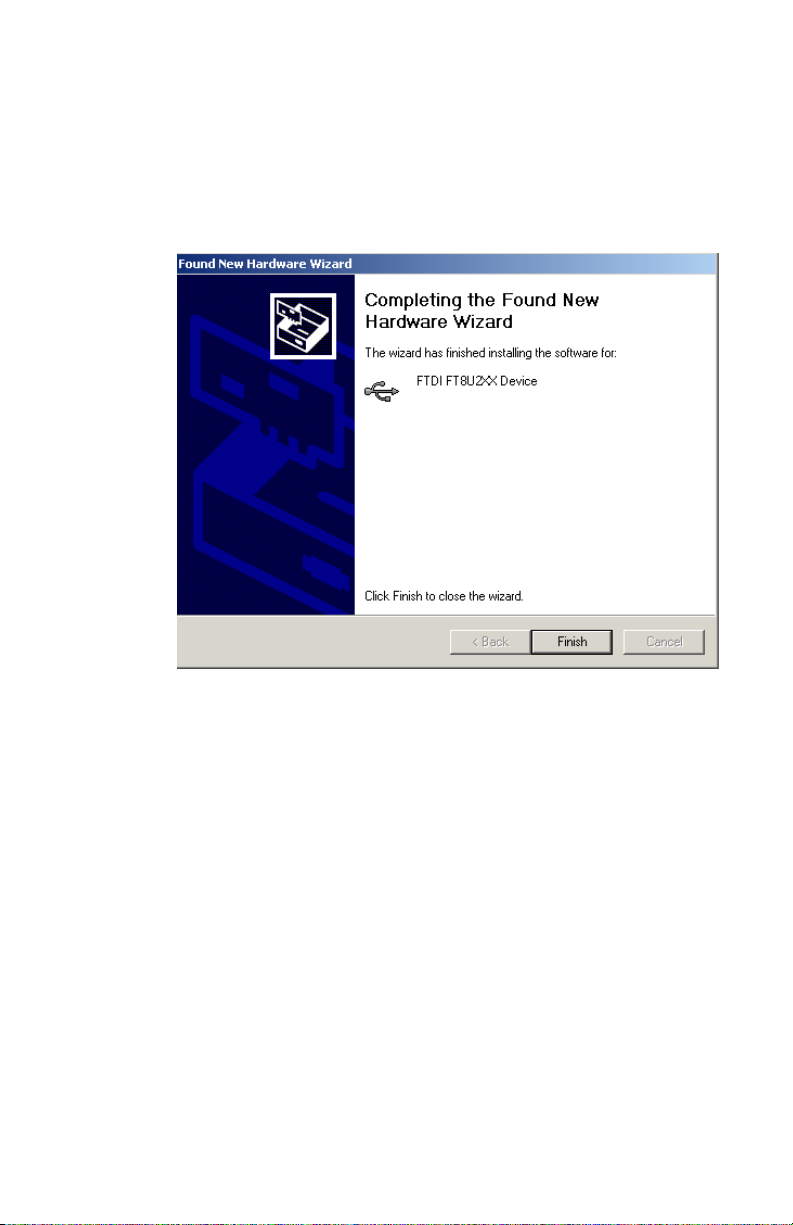
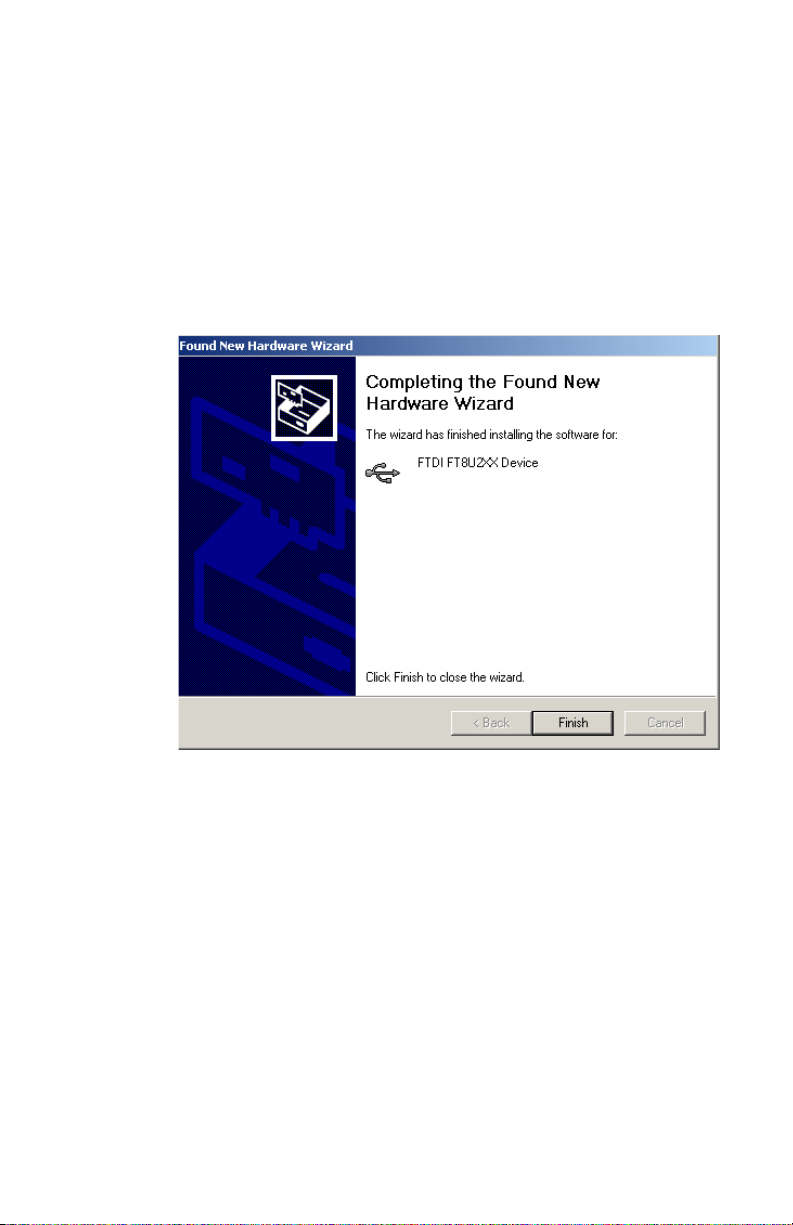
The USB driver that is installed is a generic USB sensor driver and it
is used for a range of USB sensors. The sensor driver installed on your
PC is called FTDI FT8U2XX Device.
Driver installation with Windows® XP SP1
Figure 10 Continue Anyway with installation
8. The driver will now be installed.
9. Select Finish when the driver installation is complete. Windows
will now conrm it has identied the USB sensor hardware.
This section describes how to install and congure your USB drivers
on a PC with Windows® XP and service pack 1 (SP1) operating
system.
Caution Disconnect any LAN connections to the PC. Windows® XP
SP1 does not provide exible USB driver installation. The operating
system rst attempts to obtain the USB driver from an external
source. This external driver does not provide a working connection
with your sensor.
16 USB Installation
Page 17
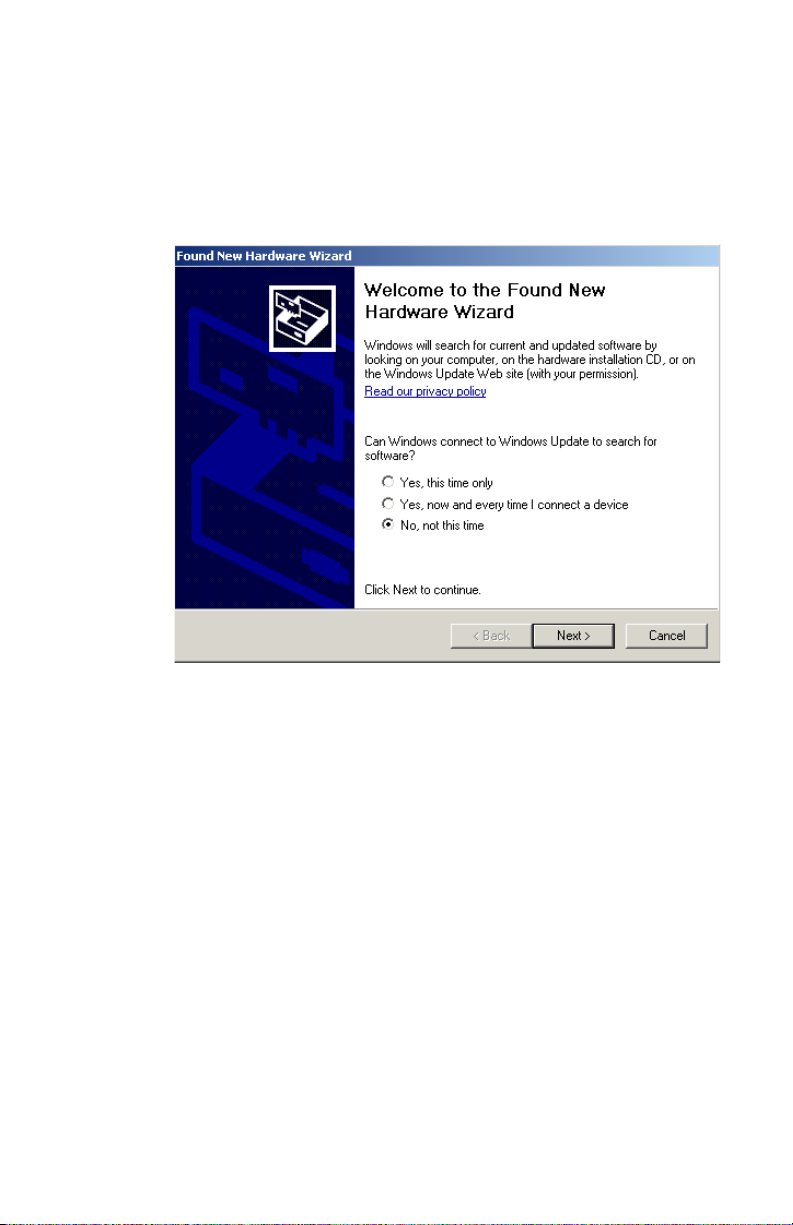
1. Connect your sensor to the USB port of your PC. The Windows
Hardware Wizard starts automatically. Refer to “How to connect your
sensor” on page 21 for more information.
2. Choose “No not at this time” and select Next. Refer to Figure 7 on
page 14.
Figure 11 Windows hardware installation wizard
3. Choose “Install from a list or specic location(Advanced)” and
select Next.
Refer to Figure 8 on page14
Boonton 52000 Series 17
Page 18
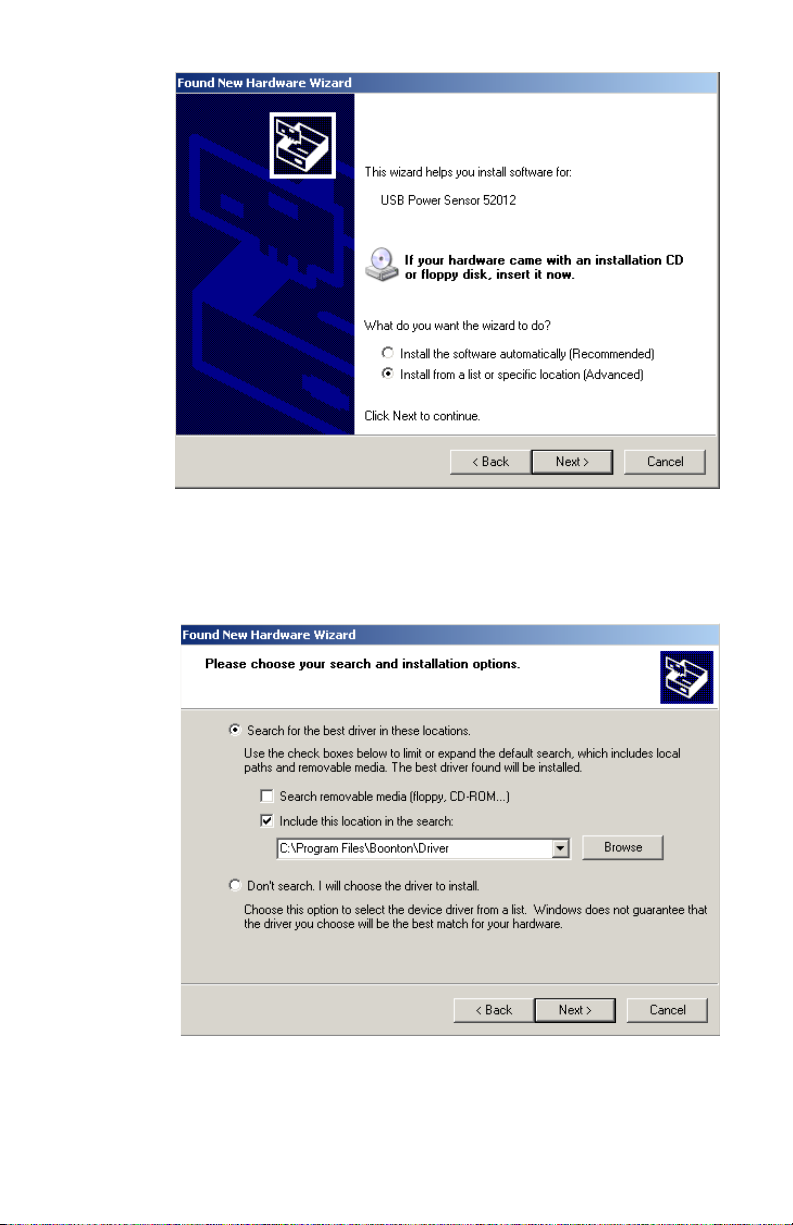
Figure 12 USB Driver location
4. Choose “Include this location in the search”.
Refer to Figure 9 on page15.
Figure 13 Choose the installation location
18 USB Installation
Page 19
5. Browse to the following location: C:\ProgramFiles\Boonton\Driver.
If you have changed the default installation location, navigate to the
Boonton installation folder.
6. Select Next.
7. (Optional) During the installation Windows may check the driver
compatibility. Select Continue Anyway. The USB sensor driver is a
valid driver and will not damage your system.
Refer to Figure 10 on page 16.
Figure 14 Continue Anyway with installation
8. The driver will now be installed.
9. Select Finish when the driver installation is complete Windows will
now conrm it has identied the USB sensor hardware.
Reconnect your LAN connection.
The USB driver that is installed is a generic USB sensor driver and it
is used for a range ofUSB sensors. The sensor driver installed on your
PC is called FTDI FT8U2XX Device. If this is not the driver installed on
your PC, refer to “How to x “No Sensor Connected” problems” on
page 51 for more information.
Boonton 52000 Series 19
Page 20

This page is intentionally left blank
20 USB Installation
Page 21
3 Hardware Connections
USB Cable
Your PC
52000 Sensor
52012 CW Power Sensor
ESD
Earth ground must be connected
Max pwr +23dBm avg, +30dBm peak for 1us +/- 10.0VDC Max.
10MHz - 12.4GHz
10nW - 100mW (-50dBm to 20dBm)
This chapter provides an overview of how to connect your 52000 CW
power sensor/meter in your test environment.
How to connect your sensor
The section describes some typical connection congurations.
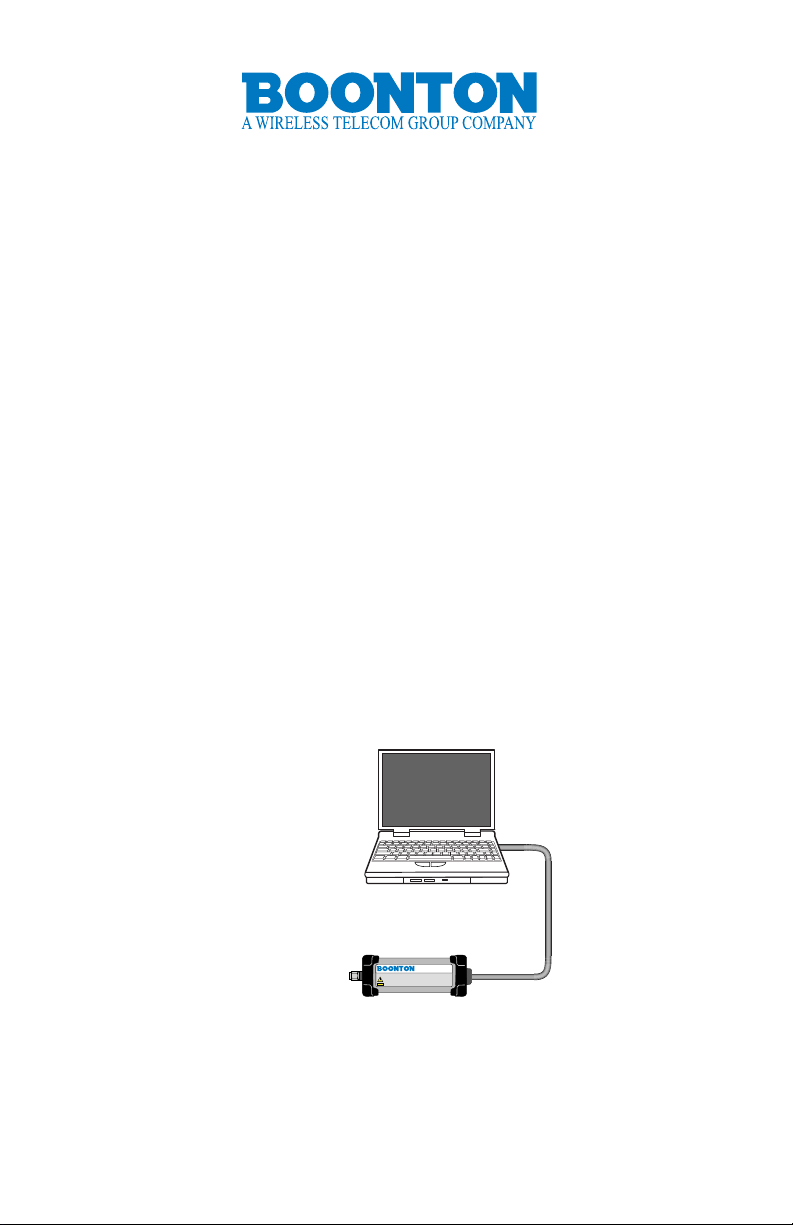
Connection to your PC
Connection to your PC is through a USB cable (supplied with
your sensor). The 52000 series CW Power sensor/meter is USB 2.0
compatible. It is recommended that you use the USB cable supplied
with your sensor. Refer to Figure 15 “Sensor to PC connection” on
page 21 for a diagram of the sensor and PC connection.
Figure 15 Sensor to PC connection
The maximum recommended connection length is 5m.
Boonton 52000 Series 21
Page 22

Connection to your unit under test (UUT)
Unit Under Test (UUT)
Test signal source
Your PC
USB
Cable
Signal cable
52012 CW Power Sensor
ESD
Earth ground must be connected
Max pwr +23dBm avg, +30dBm peak for 1us +/- 10.0VDC Max.
10MHz - 12.4GHz
10nW - 100mW (-50dBm to 20dBm)
The 52000 series CW power sensor/meter has a standard SMA-m
connection port.
The recommended torque for the SMA-m connection is 5 lbs/in (0.5 Nm).
Refer to Figure 16 “Typical sensor to UUT connection” on page 22 for
a diagram of the sensor connection.
Figure 16 Typical sensor to UUT connection
Caution Do not turn the body of the sensor when connecting the
sensor to a unit under test (UUT). To avoid internal sensor damage,
connect and disconnect the sensor by turning the metal nut only.
Caution Ensure that you do not apply any excessive force on the
sensor once it has been connected.
22 Hardware Connections
Page 23

Connecting multiple sensors
Your PC
Test signal source
USB
Hub
Units
Under Test (UUT)
USB
Cables
USB
Cables
Signal cables
52000 Sensors
52012 CW Power Sensor
ESD
Earth ground must be connected
Max pwr +23dBm avg, +30dBm peak for 1us +/- 10.0VDC Max.
10MHz - 12.4GHz
10nW - 100mW (-50dBm to 20dBm)
52012 CW Power Sensor
ESD
Earth ground must be connected
Max pwr +23dBm avg, +30dBm peak for 1us +/- 10.0VDC Max.
10MHz - 12.4GHz
10nW - 100mW (-50dBm to 20dBm)
52012 CW Power Sensor
ESD
Earth ground must be connected
Max pwr +23dBm avg, +30dBm peak for 1us +/- 10.0VDC Max.
10MHz - 12.4GHz
10nW - 100mW (-50dBm to 20dBm)
52012 CW Power Sensor
ESD
Earth ground must be connected
Max pwr +23dBm avg, +30dBm peak for 1us +/- 10.0VDC Max.
10MHz - 12.4GHz
10nW - 100mW (-50dBm to 20dBm)
It is possible to connect and monitor multiple sensors. The number
of sensors you can connect to your PC depends on your system
conguration. For example, you may chose to use a USB hub
interface. If this is the case, then carefully read the USB hub
manufacturer’s instructions when connecting and conguring
external USB devices.
Refer to Figure 17 “A typical multiple sensor conguration” on page
23 for a diagram of a typical multiple sensor conguration.
Figure 17 A typical multiple sensor conguration
Boonton 52000 Series 23
Page 24

This page is intentionally left blank
24 Hardware Connections
Page 25

4 Using The Software
This chapter describes how to use the Boonton software when
making typical power measurements. It also provides a description of
the user interface and key features of the software.
Using the software
Once you have installed the software, congured your USB drivers
and connected your hardware, you are ready to make measurements
using the Boonton software.
If you chose the default installation, you should have an icon on your
desktop for the test software. Double-click on this icon to start the
application. Refer to Figure 18 for an example start-up interface.
Figure 18 Default start-up interface
Boonton 52000 Series 25
Page 26

When the software is started, measurement results are displayed
right away. However you are reminded that you should zero the
sensor. Zero your sensor On the right side of the user interface you
are reminded that the sensor is not zeroed. For more information on
zeroing your sensor, refer to “What is zeroing?” on page 56. Use the
following procedure to zero your measurement sensor:
Making a measurement
The following procedure outlines a typical measurement procedure.
Do this Comment
1. With the sensor still connected, select the zero icon .
Or select Measurement > Zero Sensor
2. Conrm you wish to zero the sensor, select OK.
Ensure no power is being applied to the sensor during this process.
3. Wait until the zeroing is completed.
When the zero process is complete, the reminder is removed from the
user interface.
Do this Comment
1. Zero the sensor.
Refer to “Zero your sensor” on page 26.
2. Open the measurement control panel. Select the control panel icon
or select Measurement > ControlPanel.
Refer to Figure 19 on page 27.
26 Using the Software
Page 27

Figure 19 Control panel
3. Choose Log Power from the measurement mode section of the
control panel dialog box.
Top left corner of the dialog box.
Figure 20 Log power
4. Enter the desired measurement frequency.
Figure 21 Set frequency
Boonton 52000 Series 27
Page 28

5. Choose Use Table in the calibration factor section of the control
dialog box. This uses the sensor’s internal calibration table.
Refer to Figure 22 on page 28.
Figure 22 Use table
6. Select Apply and Close the measurement control panel.
Figure 23 Apply button
7. Enable the unit under test (UUT) providing a signal to the sensor.
8. The power measurement is displayed.
For denitions of dB and dBm, refer to “What is a dB?” on page 57
and “What is a dBm?” on page 58.
Measurements using more than one sensor
It is possible to make multiple measurements using multiple USB
sensors and multiple instances of the sensor software. Start the Boonton
software for each sensor connected to your PC. Follow this procedure:
28 Using the Software
Page 29

1. Connect all your sensors to your PC.
2. Double-click on the desktop icon for the Boonton software.
3. To identify which sensor you are connected to, match the serial
number on the display with the serial number on the sensor. Refer to
Figure 24 on page 29.
Figure 24 Sensor serial number identication
4. Congure your measurement software. Refer to “Making a
measurement” on page 26.
5. Again, double-click on the desktop icon for the Boonton software
and start another application.
6. Identify the sensor and congure your measurement.
7. Repeat this process (steps 2-4) for each sensor attached to your PC.
Boonton 52000 Series 29
Page 30

How to make a pulse power measurement
The following procedure outlines how to set up and make a pulse
power measurement. For more information on pulse power
measurement refer to “Pulse measurement and setting the duty
cycle” on page 56.
1. Open the application.
2. Zero your sensor.
Refer to “Zero your sensor” on page 26.
3. Open the measurement control panel. Select the control panel icon
or select Measurement > Control Panel.
4. Enable the duty cycle option and set the duty cycle percentage.
Refer to Figure 25 on page 30.
Figure 25 Setting the duty cycle
5. Set the Calibration Factor.
6. Select Apply.
The pulse repetition rate should be above 200 Hz for the internal
averaging to be effective. Below this PRF the reading will vary. The
duty cycle feature may be used down to about 1%. The peak power
limit of the sensor should be strictly adhered to. Refer to gure 26
on page 31 for more information.
30 Using the Software
Page 31

pulse pe riod
on time
time
pulse power
average
power
duty cycle =
on time
pulse period
100%
1
p.r.f. =
pulse period
average power =
on time
pulse power
x
x
pulse period
Watts
Figure 26 Typical RF burst
Measuring GSM mobile signals
GSM mobile signals are usually present for a single time-slot per
frame, that is, for approximately one eighth of the time, since there
are eight time slots per frame.
The mobile transmitter is active for slightly less than this time because
the transmitter has around three ‘tail’ bits to ramp up and down in
power, and 8.25 guard bits where the transmitter is silent. This means
that the transmitter is inactive for 11.25 bits out of 156.25.
That is for roughly (156.25 - 11.25) / 156.25 = 0.928 of a time slot.
The duty cycle of the transmitter is then 12.5% * 0.928 = 11.6%.
Refer to Figure 27 on page 32.
Note This measurement example is based on the 51012 sensor.
Boonton 52000 Series 31
Page 32

8 1
2
3 4
5
6 7 8
1
TB3Data
57
57
Data
Training
26
f
1
f
1
TB
3
GB
8.25
1 TDMA frame (4.615 ms)
1 timeslot (0.577 ms)
TB = Tail Bits
f = Flag
GB = Guard Band
Figure 27 GSM TDMA structure and normal burst
In some cases, when the modulation is GPRS, multiple time slots are
used. The correct duty cycle can be found by multiplying 11.6% by
the number of active time-slots.
Making a measurement
Follow this procedure:
1. Start the application.
2. zero the sensor.
Refer to “Zero your sensor” on page 26.
3. Open the measurement control panel. Select the control panel icon
or select Measurement > Control Panel.
4. Enable the duty cycle option and set the duty cycle percentage to
11.6%.
5. Select Apply.
The sensor will read the GSM phone power in the active part of the
time slot with reasonable accuracy.
32 Using the Software
Page 33

Measuring power greater than +20dBm (100mW)
The offset facility is useful when an attenuator or amplier is used
ahead of the sensor.
For example, if a 10.00 dB attenuator could be placed before the
sensor to measure powers up to +30dBm (1 Watt).
Caution Do not apply more than +20dBm directly to the sensor. This
level of power will damage the sensor.
1. Connect the sensor and open the application.
Refer to “Making a measurement” on page 32.
2. Zero the sensor.
Refer to “Zero your sensor” on page 26.
3. Set the measurement frequency.
This is set in the measurement control panel.
4. Insert the RF attenuator in front of the sensor. The power reading
decreases by the attenuation value.
5. In the measurement control panel, enable ‘Measurement Offset
(dB)’ and enter the value of the attenuator.
A positive number for attenuation, negative for gain.
6. The power reading will now increase by the value entered. This
counteracts the decrease in the displayed reading caused by the
attenuator. The offset value also appears on the application software.
7. The sensor and attenuator now measure from -40 dBm to +30 dBm.
Refer to Figure 28 on page 34.
Boonton 52000 Series 33
Page 34

Figure 28 Sensor conguration using an attenuator
10dB
PAD
+30 dBm
Offset
52012 CW Power Sensor
ESD
Earth ground must be connected
Max pwr +23dBm avg, +30dBm peak for 1us +/- 10.0VDC Max.
10MHz - 12.4GHz
10nW - 100mW (-50dBm to 20dBm)
Measuring an attenuator using relative mode
Use relative mode to measure an attenuator, similar to the type
used when measuring power greater than +20dBm. The process is as
follows:
1. Connect the sensor and open the application.
Refer to “Making a measurement” on page 32.
2. Zero the sensor.
Refer to “Zero your sensor” on page 26.
3. Set the measurement frequency.
This is set in the measurement control panel.
4. Connect the sensor to a signal generator and attenuator.
Set the signal generator level so that it will not damage to sensor,
even without the attenuator.
5. In the measurement panel, enable relative measurement mode.
Refer to Figure 29 on page 35.
34 Using the Software
Page 35

Figure 29 Enable relative measurement mode
6. Select the Set button.
The display should be 0.000 dB.
7. Remove the attenuator and reconnect the sensor to signal
generator.
8. The sensor now reads the value of the attenuator, in dB, at the
measurement frequency.
9. This value may be entered in the measurement offset.
How to use measurement limits
The limit facility is useful for placing a guard band around a
measurement.
For example, if the output from a device is +3dBm and must stay
within 1dB of that level, then the limits facility can be used to warn
you if the output rises above 4dBm or falls below 2dBm. Follow this
procedure:
1. Connect the sensor and open the application.
Refer to “Making a measurement” on page 32.
2. Zero the sensor.
Refer to “Zero your sensor” on page 26.
Boonton 52000 Series 35
Page 36

3. Set the measurement frequency. This is set in the measurement
control panel.
4. In the measurment control panel, enable the limits options.
Refer to Figure 30 on page 36.
Figure 30 Setting measurement limits
5. Set the Low (dB) limit to 2dBm.
6. Set the High (dB) limit to 4dBm These limit settings are shown on
the status area of the user interface.
If the level drops below 2dBm then a low limit warning message will
appear. Refer to Figure 31 on page 37.
36 Using the Software
Page 37

Figure 31 Low limits warning message
If the level rise above 4dBm then a high limit warning message will
appear. Refer to Figure 32 on page 37.
Figure 32 High limit warning message
Boonton 52000 Series 37
Page 38

How to use trace mode
The trace facility is useful for plotting the level being measured by
the sensor over a period of time.
To congure a trace, open the trace control dialog box. Select the
trace icon or select Tools > Trace...
The trace is congured as follows:
1. Set the number of samples.
This is the number of samples to be taken for the trace.
2. Set the sample period.
This is the time between the plotted points. Refer to Figure 33 on
page 38.
Figure 33 Trace control dialog box
3. Set the plot type.
Power linear (watts) or power log (dBm).
38 Using the Software
Page 39

4. Set the plot scaling to Auto.
The Y-axis is automatically scaled to suit the Min and Max values
associated with the level being plotted.
5. (Optional) Disable plot scaling.
The Y-axis uses the entered Min and Max values.
6. Set temperature display, enable the sensor option.
The temperature is displayed with a red trace.
7. (Optional) Enable the Auto Scale option.
The Y-axis is automatically scaled to suit the Min and Max
temperature values. If auto scaling is not selected, then Min and Max
values for the temperature Y-axis can be entered into the Min and
Max boxes.
8. Select Start to begin the real-time trace.
Refer to Figure 34 on page 39.
Figure 34 Typical trace with temperature
While the trace is drawing, the scaling can be altered by selecting
the settings icon or selecting Trace > Settings on the menu bar. Also,
the trace can be stopped by selecting the stop icon or selecting Trace
> Stop on the menu bar. Refer to Figure 35 on page 40.
Boonton 52000 Series 39
Page 40

Figure 35 Trace controls dialog box
When the trace is complete, markers for making X and Y
measurements can be turned on by selecting the markers icon or
selecting Trace > Markers in the menu bar. Refer to Figure 36 on
page 40.
40 Using the Software
Page 41

Figure 36 Trace markers
The displayed trace can be saved by selecting the File > Save Trace in
the trace control dialog box. A trace can be recalled by selecting File
> Recall Trace. The raw data used todraw the trace can be saved in a
le by selecting the Save Data icon.
To exit trace mode select the exit icon or select Trace > Exit.
Note Do not select the window close icon at the top right of the
application to exit
the trace feature as this closes the whole application. Instead select
the close icon .
Boonton 52000 Series 41
Page 42

Error and status messages
The right side of the users interface displays a series of warnings and
status messages. These are described as follows:
Sensor not zeroed
This message is displayed when the application rst detects a sensor
or the sensor needs to be re-zeroed. Refer to “Zero your sensor” on
page 26 for more information. Refer to Figure 37 on page 42.
Sensor frequency, offset and duty cycle enabled
These message let you know your measurement frequency setting. It
also shows if offset has been enable along with the duty cycle. Refer
to Figure 37 on page 42.
Figure 37 Frequency, Offset and Duty Cycle messages
42 Using the Software
Page 43

Sensor overload
This warning message indicates a sensor overload. Refer to Figure 38
on page 43.
Figure 38 Sensor overload warning message
High limit exceeded
This warning message tells you when you have exceeded the high
measurement limit you have set in the measurement control panel.
When you see this warning message, reduce the power being tested.
Refer to Figure 39 on page 43.
Figure 39 High limit warning
Boonton 52000 Series 43
Page 44

Low limit exceeded
This warning message tells you when you have exceeded the low
measurement limit you have set in the measurement control panel.
When you see this warning message, increase the power being
tested.Refer to Figure 40 on page 44.
Figure 40 Low limit warning
Zero sensor - temperature change
When the temperature of the sensor is too great for the reliable
measurement to be made, the zero sensor and temperature warning
message is displayed. Refer to Figure 41 on page 44.
Figure 41 Zero shift warning
44 Using the Software
Page 45

Manually entered cal factor
When you have entered a cal table, the entries are displayed on the
user interface. Refer to on page 45.
Figure 42 Manually entered cal table
Boonton 52000 Series 45
Page 46

5 Description of Software
Icon Description
Opens the control panel.
Starts the zero sensor process.
Sets the sensor frequency.
Changes the display between dBm nW.
Changes the display between numerical or numerical with graphical data
display to just a graphical display.
Changes the number of decimal places being displayed.
Opens the trace setting dialog box.
Saves the current data.
Recalls (Open) saved data.
Opens the application help.
Description of icons
The following section describes the basic software features. For more
information on the software and menu options, refer to the online
help in the application.
The icons, along the top of the application, are used for accessing the
most common tasks. The icons are used as follows:
46 Description of Software
Page 47

Description of menu options
The following describes the menu options from the application.
File Menu
Save Setup
Allows current setup to be saved to a simple text le.
Recall Setup
Allows a previous setup to be recalled.
Firmware download
Lets you update the rmware revision of the sensor.
Exit
Exits the application.
Measurement Menu
Control Panel
The control panel is used for setting most of the user interface
components and key measurement factors. The control panel is
divided into areas for conguring your measurement environment.
Zero Sensor
This performs a sensor zeroing process and will remove any offsets
before making a measurement. This function should be carried out
typically for values less than -35dBm. Refer to “What is zeroing?” on
page 56 for more information.
Preset
Resets all your congured measurements back to the factory default
settings.
Tools Menu
Trace
Opens the trace control dialog box. Congure and start your trace
from this dialog box.
Stats
This opens the statistics conguration dialog box. From this dialog
box you can setup and draw a snap-shot bar chart of your results.
Boonton 52000 Series 47
Page 48

Calculators
Help Menu
This menu option gives you access to three useful microwave
calculators.
These are:
• VSWR Mismatch
• Parameters
• Power Units Converter
The VSWR Mismatch calculator and the Parameter calculator have
help les which describe their operation.
USB Power Sensor Help
Opens the application help which provides detailed descriptions of
the features being used. Help on the measurement control panel is
displayed when you select the help button in the dialog box.
Sensor Details
Provides information about the detected sensor being used by the
application. This includes the rmware and serial number of the
sensor.
About…
This provides information about the revision of the application you
are using.
48 Description of Software
Page 49

6 Enhanced Features
This chapter outlines the advanced capabilities of the 52000 series
CW power sensor/meter software.There are brief outlines and
descriptions of how the software can be integrated into other test
environments such as C++, Agilent VEE and National Instruments® NI.
Refer to the programming reference guide for more details . An
electronic version is included on your Boonton CD.
Integrating your power sensor
The following section details how to integrate the Boonton software
into your test environment.
A library of function calls provides a simple, but powerful interface
between your application software and sensor hardware. All the
function calls are contained in a dynamic link library (DLL).
To use the library, the following three les are required:
• USB Sensor Lib.dll
• USB Sensor.Lib.lib
• USB Sensor.h
These les can be found on the installation CD. The latest versions
can be downloaded free of charge from the Boonton website www.
boonton.com
Boonton 52000 Series 49
Page 50

The le USB Sensor Lib.dll can reside in the same directory as your
application executable le, or in a path known to your application
executable le.
The le USB Sensor Lib.lib must reside in a path known to the linker
that will link to your application.
The le USB Sensor.h contains denitions required by the USB Sensor
function calls and must reside in a path known to the compiler that
will compile your source code.
50 Enhanced Features
Page 51

7 Troubleshooting
This chapter explains how to x some typical software and hardware
conguration issues that you may have encountered. It also provides
some technical background information that can help you better
understand your test environment.
How to x “No Sensor Connected” problems
When you start your Boonton software application you can get the
following condition message displayed - “No Sensor Connected”,
refer to Figure 43 on page 51.
Figure 43 No sensor connected warning
This can be the result of one of the following issues:
• No sensor is attached to your PC (refer to page 52)
• The wrong USB driver has been installed (refer to page 52)
• The USB cable or USB port are faulty (refer to page 53)
• Incorrectly congured USB hub (refer to page 53)
• More than one application has been started (refer to page 54)
The following procedures will help you correct these problems:
Boonton 52000 Series 51
Page 52

No sensor is attached to your PC
Check all cable connections from your PC to your sensor. A connector
may have been loosened and may not be making adequate contact.
This is especially important when using multiple sensor
congurations.
The wrong USB driver has been installed
If the wrong USB driver has been installed then there will be no
consistent communication between your sensor and PC. Use the
following procedure to identify the installed driver
.
This procedure applies to Windows® XP operating system.
1. On your PC, select Start > Control Panel.
2. Double-click on System.
This opens the System Properties dialog box.
3. Select the Hardware tab.
4. Select the Device Manager button.
This opens the Device Manager dialog box.
5. Expand the list of Universal Serial Bus controllers
Click the ‘plus’ symbol to expand the list.
6. If the correct driver has been installed you should see the
following item listed - FTDI FT8U2XX Device
Refer to Figure 43 on page 52.
Figure 44 Correct USB driver conguration
52 Troubleshooting
Page 53

If this is NOT the driver listed in your Device Manager, then use the
following procedure to remove the installed driver and congure the
correct driver:
The USB cable or USB port are faulty
In the event of a faulty cable or port, try the following solutions:
• Replace the cable with another high standard USB cable.
• Use another USB port on your PC. If you only have one port on your
PC, connect another USB device to the suspected port (for example a
mouse or printer) and verify device recognition.
Incorrectly congured USB hub
Some USB hub devices require custom driver installation. If the driver
installation procedures are not followed correctly some, or all the
ports provided by the hub, may not be seen by your PC. Carefully
read your USB hub manufacturer’s instructions on driver installation
and conguration. If you are not sure the fault is with the USB hub,
try connecting a sensor directly to your PC and verify connection
using the application. Do this Comment
1. Disconnect any sensors connected to your PC.
2. On your PC, select Start > Control Panel.
3. Double-click on Add or Remove Programs.
4. Locate and select the FTDI COM driver listed.
5. Select the Change/Remove button. This removes the USB driver.
6. When the driver has been removed, close the Add or Remove
Programs dialog box.
7. Close the Control Panel.
8. To install the correct USB, refer to “USB Installation” on page 13.
Boonton 52000 Series 53
Page 54

More than one application has been started
It is possible to start multiple instances of the application software.
The rst time the application is started it checks the available USB
ports for a recognised sensor. If the application is started again, but
you only have one sensor connected, then the application will report
a “No Sensor Connected” error.
Check your PC Taskbar for any minimised applications.
Unexpected measurements results
If you suspect that you are getting unexpected measurements, then
use the following procedures to correct the potential fault:
• Check the status messages displayed on the right-side of the application
• Your sensor is potentially damaged
• Incorrect offset setting
• Incorrect measurement settings
Check status messages
The status messages on the right-side of the applcaition provide
infroamtion about your measurement settings and any possible limits
errors. Refer to “Error and status messages” on page 42.
Your sensor is potentially damaged
If you suspect that your sensor is damaged, then connect a known
signal source and verify that the sensor is measuring that source
correctly. If this, or any of the other procedures do not correct the
fault then contact your local representative for more information.
Incorrect offset setting
If you have made the wrong measurement offset setting in
the measurement control panel, then you may see incorrect
measurements.
Incorrect measurement settings
Check that you have set all the right settings in the measurement
control panel. Refer to “Using the software” on page 25 for more
information. If you are not sure what settings you have set, select
Measurement > Preset to return the sensor measurement settings to
the factory default settings.
54 Troubleshooting
Page 55

How to identify your PC operating system
Your operating system
Installed service pack
The procedure for installing USB drivers differs slightly depending on
which version of operating system you have on your PC. Follow this
procedure to identify your operating system.
Do this Comment
1. On your PC, select Start.
2. Highlight and right-click on My Computer.
3. Select Properties from the pop-up menu. This opens the System
Properties dialog box.
4. Select the General tab. Refer to Figure 45 on page 55.
Figure 45 How to identify your operating system Your operating
system Installed service pack
Boonton 52000 Series 55
Page 56

Other useful information
The following sections provide some useful information about power
measurement and your USB sensor.
What is zeroing?
Zeroing is a measurement process that ensures that the sensor
indicates as close as possible to 0 watts when no power is applied.
This ensures that the sensor gives the best possible linearity.
Due to the very low voltages that are measured by the analogue to
digital converter in the sensor, some averaging is necessary and the
process takes about eleven seconds. The zero should be re-measured
periodically for best accuracy at low power levels. It should also be
re-measured after connecting the sensor directly to equipment that
is at a signicantly different temperature than the sensor, when the
sensor has reached operating temperature.
It is only necessary to re-zero if the power indicated when no power
is applied to the sensor is worse than -55 dBm. A poor zero affects
lower power measurements more than larger ones. Excessive zeroing
in automatic measurement programs is not recommended as it can
signicantly increase program run times.
Pulse measurement and setting the duty cycle
The duty cycle facility is used to measure the ‘pulse power’. This is the
power measurement while an RF burst is present, when the signal is
a gated burst of a sinusoidal RF signal - for example a radar pulse.
The sensor is calibrated to measure average power, and provided the
pulse repetition rate is sufciently high, a measurement of the pulse
power can be obtained from the average power.
Certain assumptions are made about the RF burst, and these must be
met if the measurement is to be accurate. The burst is assumed to be
either on or off, in other words it does not take a nite time to ramp
up or down.
The ramp up and down times should be small in relation to the
on time of the signal generator. The burst is also assumed to have
constant amplitude when on. The amplitude does not ring, droop
or overshoot. If the pulse does not have these attributes, then the
accuracy of the result is not valid.
56 Other Information
Page 57

The RF in the burst is also assumed to be un-modulated. If it were
amplitude modulated, for example, then the measurements would
be likely to vary with time as the modulation and the voltage
measurement made in the power meter would not be synchronized.
Constant amplitude modes of modulation like phase or frequency
modulation are permissible.
What is a dB?
The dBm and dB are common units occurring in power
measurements. ‘dB’ is short for decibel. The dB is a method of
describing the ratio of two powers over a very wide range and is
dened as:
The table below gives some power ratios and their equivalent dB
values:
Power ratio dB
0.001 -30.00
0.01 -20.00
0.1 -10.00
0.25 -6.02
0.5 -3.01
1 0
2 3.01
4 6.02
10 10.00
100 20.00
1000 30.00
Boonton 52000 Series 57
Page 58

What is a dBm?
When one of the powers is dened, again for convenience, as 1mW,
then the related unit, abbreviated to ‘dBm’, is described as follows.
The table below gives some powers and their equivalent dBm values:
Power dBm
1 μW -30.00
10 μW -20.00
100 μW -10.00
0.25 mW -6.02
0.5 mW -3.01
1 mW 0
2 mW 3.01
4 mW 6.02
10 mW 10.00
100 mW 20.00
1 W 30.00
58 Other Information
Page 59

8 Contact and Support
This chapter provides information about Boonton. It tells you how to
get in touch and what to do if you are having problems or need more
information about other products.
Contacting Boonton
To contact Boonton please contact your local representative or use
the following e-mail address:
boonton@boonton.com
Our Website
The Boonton website provides up to date product information and news.
www.boonton.com
Boonton 52000 Series 59
Page 60

9 Safety and Specications
This chapter provides information about the 52000 Series CW power
sensor/meter safety compliance and sensor specications.
Safety notices
Please careful read the following information:
WARNING A WARNING denotes a hazard. A WARNING that is not
followed and adhered to could result in injury or loss of life. Do not
proceed beyond the WARNING note until you have carefully read and
understood the note.
Caution A CAUTION denotes a hazard. A CAUTION that is not
followed and adhered to could result in partial or complete damage
of your equipment.
Do not proceed beyond the CAUTION note until you have carefully
read and understood the note.
Note A NOTE draws your attention to a procedure or additional
information that, if followed correctly, can prevent mis-use of the
your equipment. It also points out additional information that can
help you get more from your system.
60 Safety & Specications
Page 61

Boonton 52000 Series 61
Page 62

WEEE Directive
Boonton will undertake a “take back” policy for all sensor products
no longer t for purpose and dispose of the said products under the
European WEEE directive.
Please contact Boonton for more details, refer to “Contacting
Boonton”on page 59.
Product descriptions and requirements
The 52000 series CW power sensor/meter descriptions and PC
specications are as follows:
Minimum PC requirements
Your minimum recommended PC specications are:
PIII Windows XP SP2
256 RAM
600 MHz
USB Port (1.0 or greater)
CD Drive
52012 Description
• 52012 USB power sensor
• Frequency range: 10MHz to 12.4GHz
• Amplitude range: -50dBm to +20dBm
• RF input connector SMA male
52018 Description
• 52018 USB power sensor
• Frequency range: 10MHz to 18.5GHz
• Amplitude range: -50dBm to +20dBm
• RF input connector SMA male
62 Safety & Specications
.
Page 63

52012
Frequency 10MHz to 12.4GHz
Measurement range -50 to +20dBm CW
Operating Temperature 0 to 50 deg C
Shock 25G, 11 ms
Vibration 15G, 100 to 2000Hz
Linearity error 25 +/- 5 deg C +/-0.27 dB; -40dBm to +10dBm;
Cal factor error 25 +/- 5 deg C +/-0.24 dB; 10 MHz to 50 MHz
Linearity variation 25 +/- 25 deg C +/-0.29 dB; 50MHz to12.4GHz
Cal factor variation 25 +/- 25 deg C +/-0.29 dB; greater than or equal to 50 MHz
Zero set +/-1.2 nW
Noise 0.12 nW RMS
Input SWR - max 1.26:1 = 12.4 GHz 1.26:1 = 18.5 GHz
Measurement Speed: -50 to -35 dBm 8 measurements per sec.
-35 to -20 dBm 33 measurements per sec.
-20 to +20 dBm 50 measurements per sec.
Max input power (damage level) 200mW CW (+23dBm)
Connector type SMA (m)
Connectivity USB 2.0 (cable length up to 5m)
USB power supply current Approx. 50mA
Sensor Cable Length (std) 76” (193 cm)
Dimensions (max) H x W x L 1.34” x 1.69” x 4.92” (34 x 43 x 125 (mm)
Weight 0.18lb (83 grams)
Specications include expanded uncertainty of measurement stated as the standard uncertainty of
measurement multiplied by the coverage factor k=2 which corresponds to a coverage probability of
approximately 95% for abnormal distribution.
greater than or equal to 50 MHz
+/-0.49 dB; +10dBm to +20dBm;
greater than or equal to 50 MHz
+/-0.28 dB; -40dBm to +10dBm; less than 50 MHz
+/-0.95 dB; +10dBm to +20dBm; less than 50 MHz
+/-0.19 dB; 50MHz to 4.5GHz
+/-0.23 dB; 4.5GHz to 8.5GHz
+/-0.32 dB; 8.5GHz to 12.4GHz
+/-0.47 dB; 10 MHz to 50MHz
+/-0.44 dB; less than 50 MHz
Boonton 52000 Series 63
Page 64

52018
Frequency 10MHz to 18.5GHz
Measurement range -50 to +20dBm CW
Operating Temperature 0 to 50 deg C
Shock 25G, 11 ms
Vibration 15G, 100 to 2000Hz
Linearity error +/-0.27 dB; -40dBm to +10dBm;
Cal factor error 25 +/- 5 deg C +/-0.24 dB; 10 MHz to 50MHz
Linearity variation 25 +/- 25 deg C +/-0.35 dB; 50MHz to18.5GHz
Cal factor variation 25 +/- 25 deg C +/-0.32 dB; greater than or equal to 50 MHz
Zero set +/-1.8 nW
Noise 0.15 nW RMS
Input SWR - max 1.26:1 = 18.5 GHz
Measurement Speed: -50 to -35 dBm
-35 to -20 dBm
-20 to +20 dBm 50 measurements per sec
Max input power (damage level) 200mW CW (+23dBm)
Connector type SMA (m)
Connectivity USB 2.0 (cable length up to 5m)
USB power supply current Approx. 50mA
Sensor Cable Length (std) 76” (193 cm)
Dimensions (max) H x W x L 1.34” x 1.69” x 4.92” (34 x 43 x 125 (mm)
Weight 0.18lb (83 grams)
Specications include expanded uncertainty of measurement stated as the standard uncertainty of
measurement multiplied by the coverage factor k=2 which corresponds to a coverage probability of
approximately 95% for abnormal distribution.
greater than or equal to 50 MHz
+/-0.49 dB; +10dBm to +20dBm;
greater than or equal to 50 MHz
+/-0.28 dB; -40dBm to +10dBm; less than 50 MHz
+/-0.95 dB; +10dBm to +20dBm; less than 50MHz
+/-0.19 dB; 50MHz to 4.5GHz
+/-0.23 dB; 4.5GHz to 8.5GHz
+/-0.32 dB; 8.5GHz to 12.4GHz
+/-0.38 dB; 12.4GHz to18.5GHz
+/-0.47 dB; 10 MHz to 50MHz
+/-0.44 dB; less than 50 MHz
8 measurements per sec.
33 measurements per sec.
64 Safety & Specications
Page 65

Index
A
Attenuator .......................................................................................................... 33
C
cautions ............................................................................................................... 60
compliance ......................................................................................................... 60
connecting multiple sensors ........................................................................ 23
connection torque ........................................................................................... 22
contact Boonton .............................................................................................. 59
contents of your system ...................................................................................4
D
dB ......................................................................................................................... 57
dBm ..................................................................................................................... 58
declaration of conformity ..............................................................................61
driver
windows XP SP1 .............................................................................................. 16
windows XP SP2 .............................................................................................. 13
duty cycle .....................................................................................30, 31, 32, 56
E
embedding software ....................................................................................... 49
enhanced features .......................................................................................... 49
error messages ................................................................................................. 42
extra features ................................................................................................... 49
F
le menu ............................................................................................................ 47
forced zero ........................................................................................................ 44
G
GPRS measurement ........................................................................................ 32
GSM phone measurement ............................................................................ 32
GSM signal measurement ..............................................................................31
H
hardware conguration ..................................................................................21
Boonton 52000 Series 65
Page 66

help menu .......................................................................................................... 48
high limit ........................................................................................................... 43
high limit exceeded ........................................................................................ 43
I
icons .................................................................................................................... 46
identify operating system ............................................................................. 55
install USB drivers ........................................................................................... 13
installed USB driver ........................................................................................ 16
installing software ............................................................................................. 9
introduction ......................................................................................................... 3
K
key features ..........................................................................................................3
L
license agreement ............................................................................................10
low limit exceeded .......................................................................................... 44
M
make a measurement ..................................................................................... 26
manual cal factors .......................................................................................... 45
measure GSM signal ........................................................................................31
measure power greater than +20dBm ...................................................... 33
measure pulse power ..................................................................................... 30
measure using more than one sensor ....................................................... 28
measurement menu ........................................................................................ 47
measurement offset .......................................................................................33
measurement procedure ................................................................................ 26
menu
le ........................................................................................................................ 47
help ...................................................................................................................... 48
measurement .................................................................................................... 47
tools .................................................................................................................... 47
menu options .................................................................................................... 47
multiple sensor connection .......................................................................... 23
multiple sensors ............................................................................................... 28
N
no sensor connected ........................................................................................51
notes ................................................................................................................... 62
O
offset measurement .......................................................................................33
operating system identication .................................................................. 55
overloaded sensor ...........................................................................................43
P
PC specications ............................................................................................. 62
procedure for installing software .................................................................. 9
programming guide ........................................................................................ 49
66 Index
Page 67

pulse measurement ..................................................................................30, 56
R
return products ................................................................................................ 62
S
safety notices ................................................................................................... 60
sensor driver installation ............................................................................... 13
sensor overload ................................................................................................ 43
sensor to your UUT connection ................................................................... 22
sensor zero ........................................................................................................ 26
serial number .................................................................................................... 29
software
how to use ......................................................................................................... 25
software installation .........................................................................................9
software license agreement ..........................................................................10
software menus ............................................................................................... 46
52012 Specications ...................................................................................... 63
52018 specications ...................................................................................... 64
start-up screen ................................................................................................. 25
status messages ............................................................................................... 42
system integration .......................................................................................... 49
T
tools menu ....................................................................................................... 47
torque for connection .................................................................................... 22
troubleshooting ................................................................................................51
U
unit under test (UUT) .....................................................................................22
USB connection ................................................................................................21
USB driver installation ................................................................................... 13
USB driver problems ....................................................................................... 52
using the software .......................................................................................... 25
UUT connection ............................................................................................... 22
W
warnings ............................................................................................................ 60
website ............................................................................................................... 59
WEEE directive ................................................................................................. 62
welcome ................................................................................................................3
What is dB ......................................................................................................... 57
What is dBm ..................................................................................................... 58
Windows XP installation ............................................................................... 13
wrong USB driver ............................................................................................ 52
Z
zero sensor 26
zeroing what is it ............................................................................................ 56
Boonton 52000 Series 67
Page 68

Boonton Electronics
25 Eastmans Rd.
Parsippany, NJ 07054
U.S.A
Tel. +1 973 386 9696
Fax. +1 973 386 9191
boonton@boonton.com
www.boonton.com
© Copyright 2006
Boonton Electronics (A
Wireless Telecom Group
Company). All rights reserved.
 Loading...