

Page 1
Peak Power Analyzer
specs
4500B
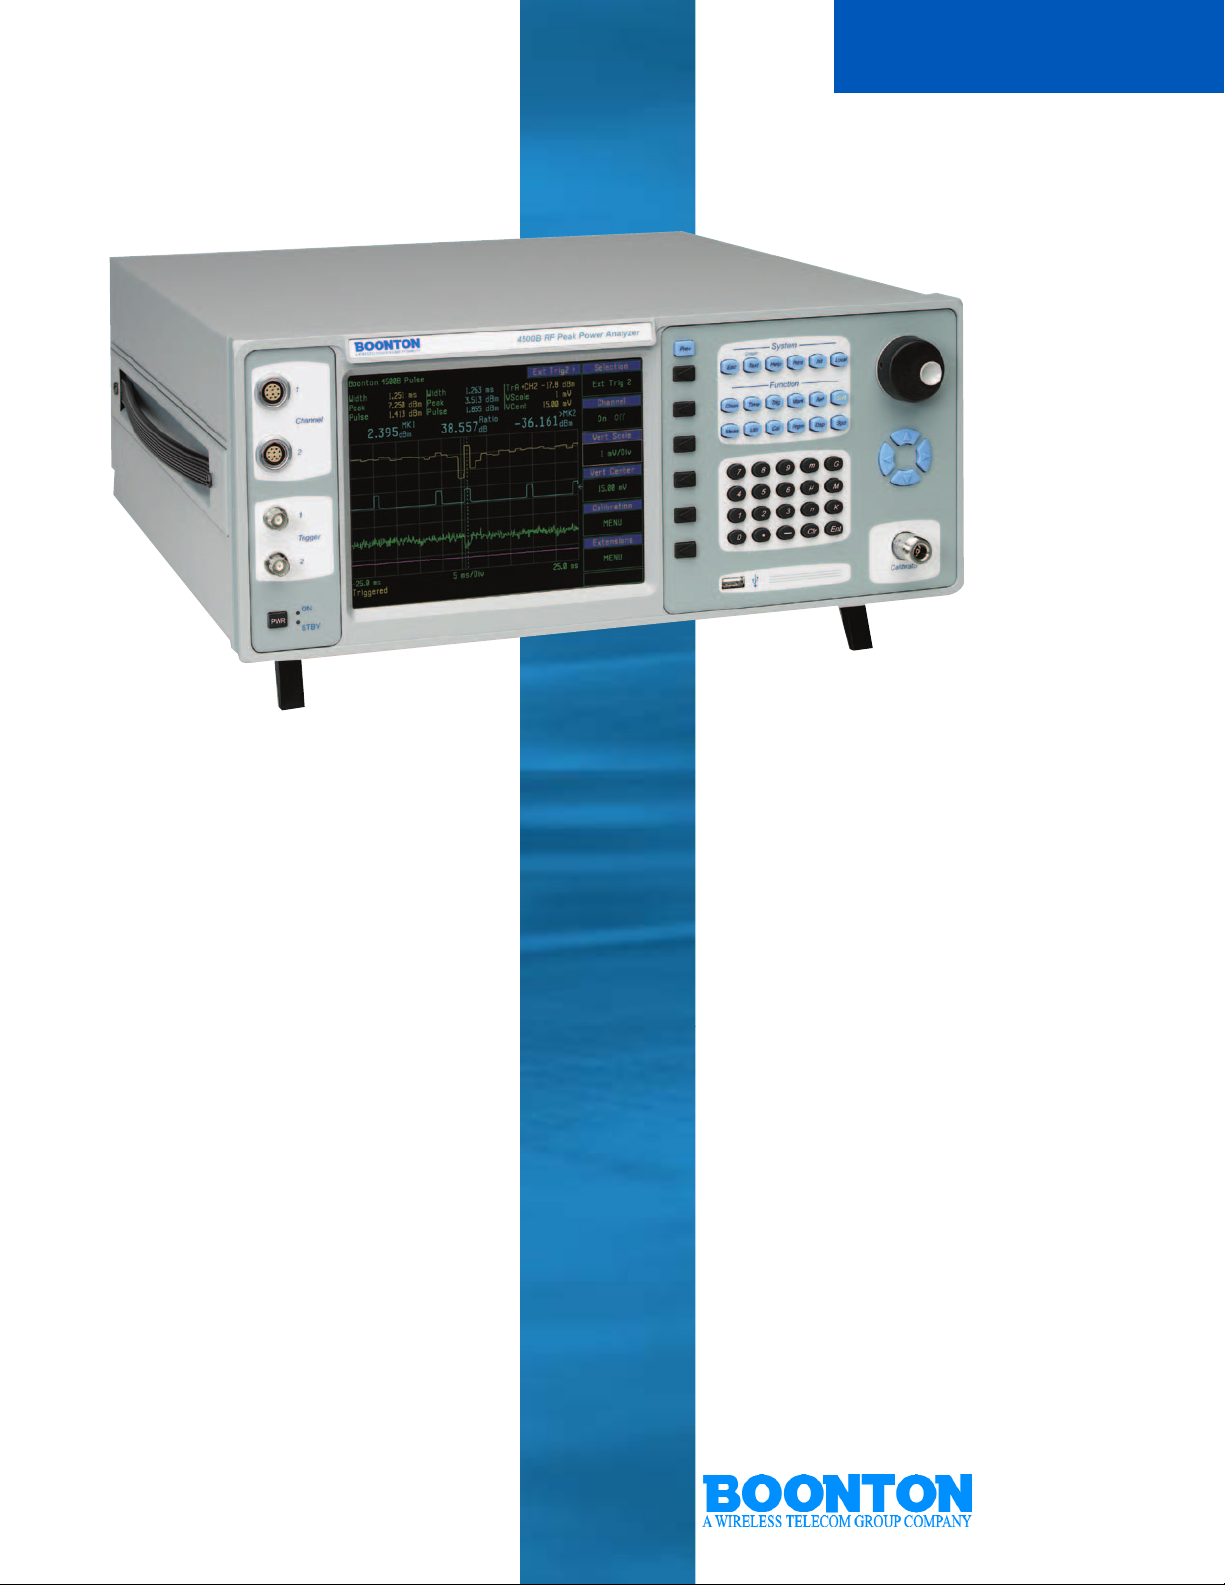
The Boonton Model 4500B is the instrument
T
of choice for capturing, displaying, analyzing
and characterizing RF power in both the time
and statistical domains. Applications include
pulsed RF such as RADAR, TDMA and GSM,
pseudorandom or noise-like signals such as
CDMA and WLAN and modulated time slotted signals such as GSM-EDGE and
TD-SCDMA.
The 4500B features 100 psec timebase resolution, video bandwidth greater than 35 MHz
(sensor dependent), flexible triggering and
greater than 60 dB dynamic range (sensor
dependent) without any range switching to
cover the most demanding peak power
measurement applications. The 4500B also
features continuous statistical analysis of
power (optional) at acquisition rates up to 25
MSa/s, a text display of up to 15 automatic
measurements per channel as well as
envelope and persistence views to provide
fast in-depth signal analysis. Convenient I/O
including USB ports for storing data such as
instrument setups, trace waveforms and bit
map image files.
FEATURES
n 8.4" TFT color LCD display
n Displays up to 4 measurement channels, 2
memory channels and 1 math channel
simultaneously
n Automatic peak-to-peak, delay-by-time and
delay-by-events triggering
n Statistical analysis including gated CCDF and PDF
with linear or log presentation (optional)
n Text view of up to 15 time and power
measurements per channel
n Envelope, persistence and roll mode displays
n GPIB, USB and LAN
25 Eastmans Road
Parsippany, NJ 07054 U.S.A.
Phone: +1 (973) 386-9696
Fax: +1 (973) 386-9191
Email: [email protected]
Web site: www.boonton.com
Page 2
Peak Power Analyzer
specs
4500B RF PEAK POWER ANALYZER
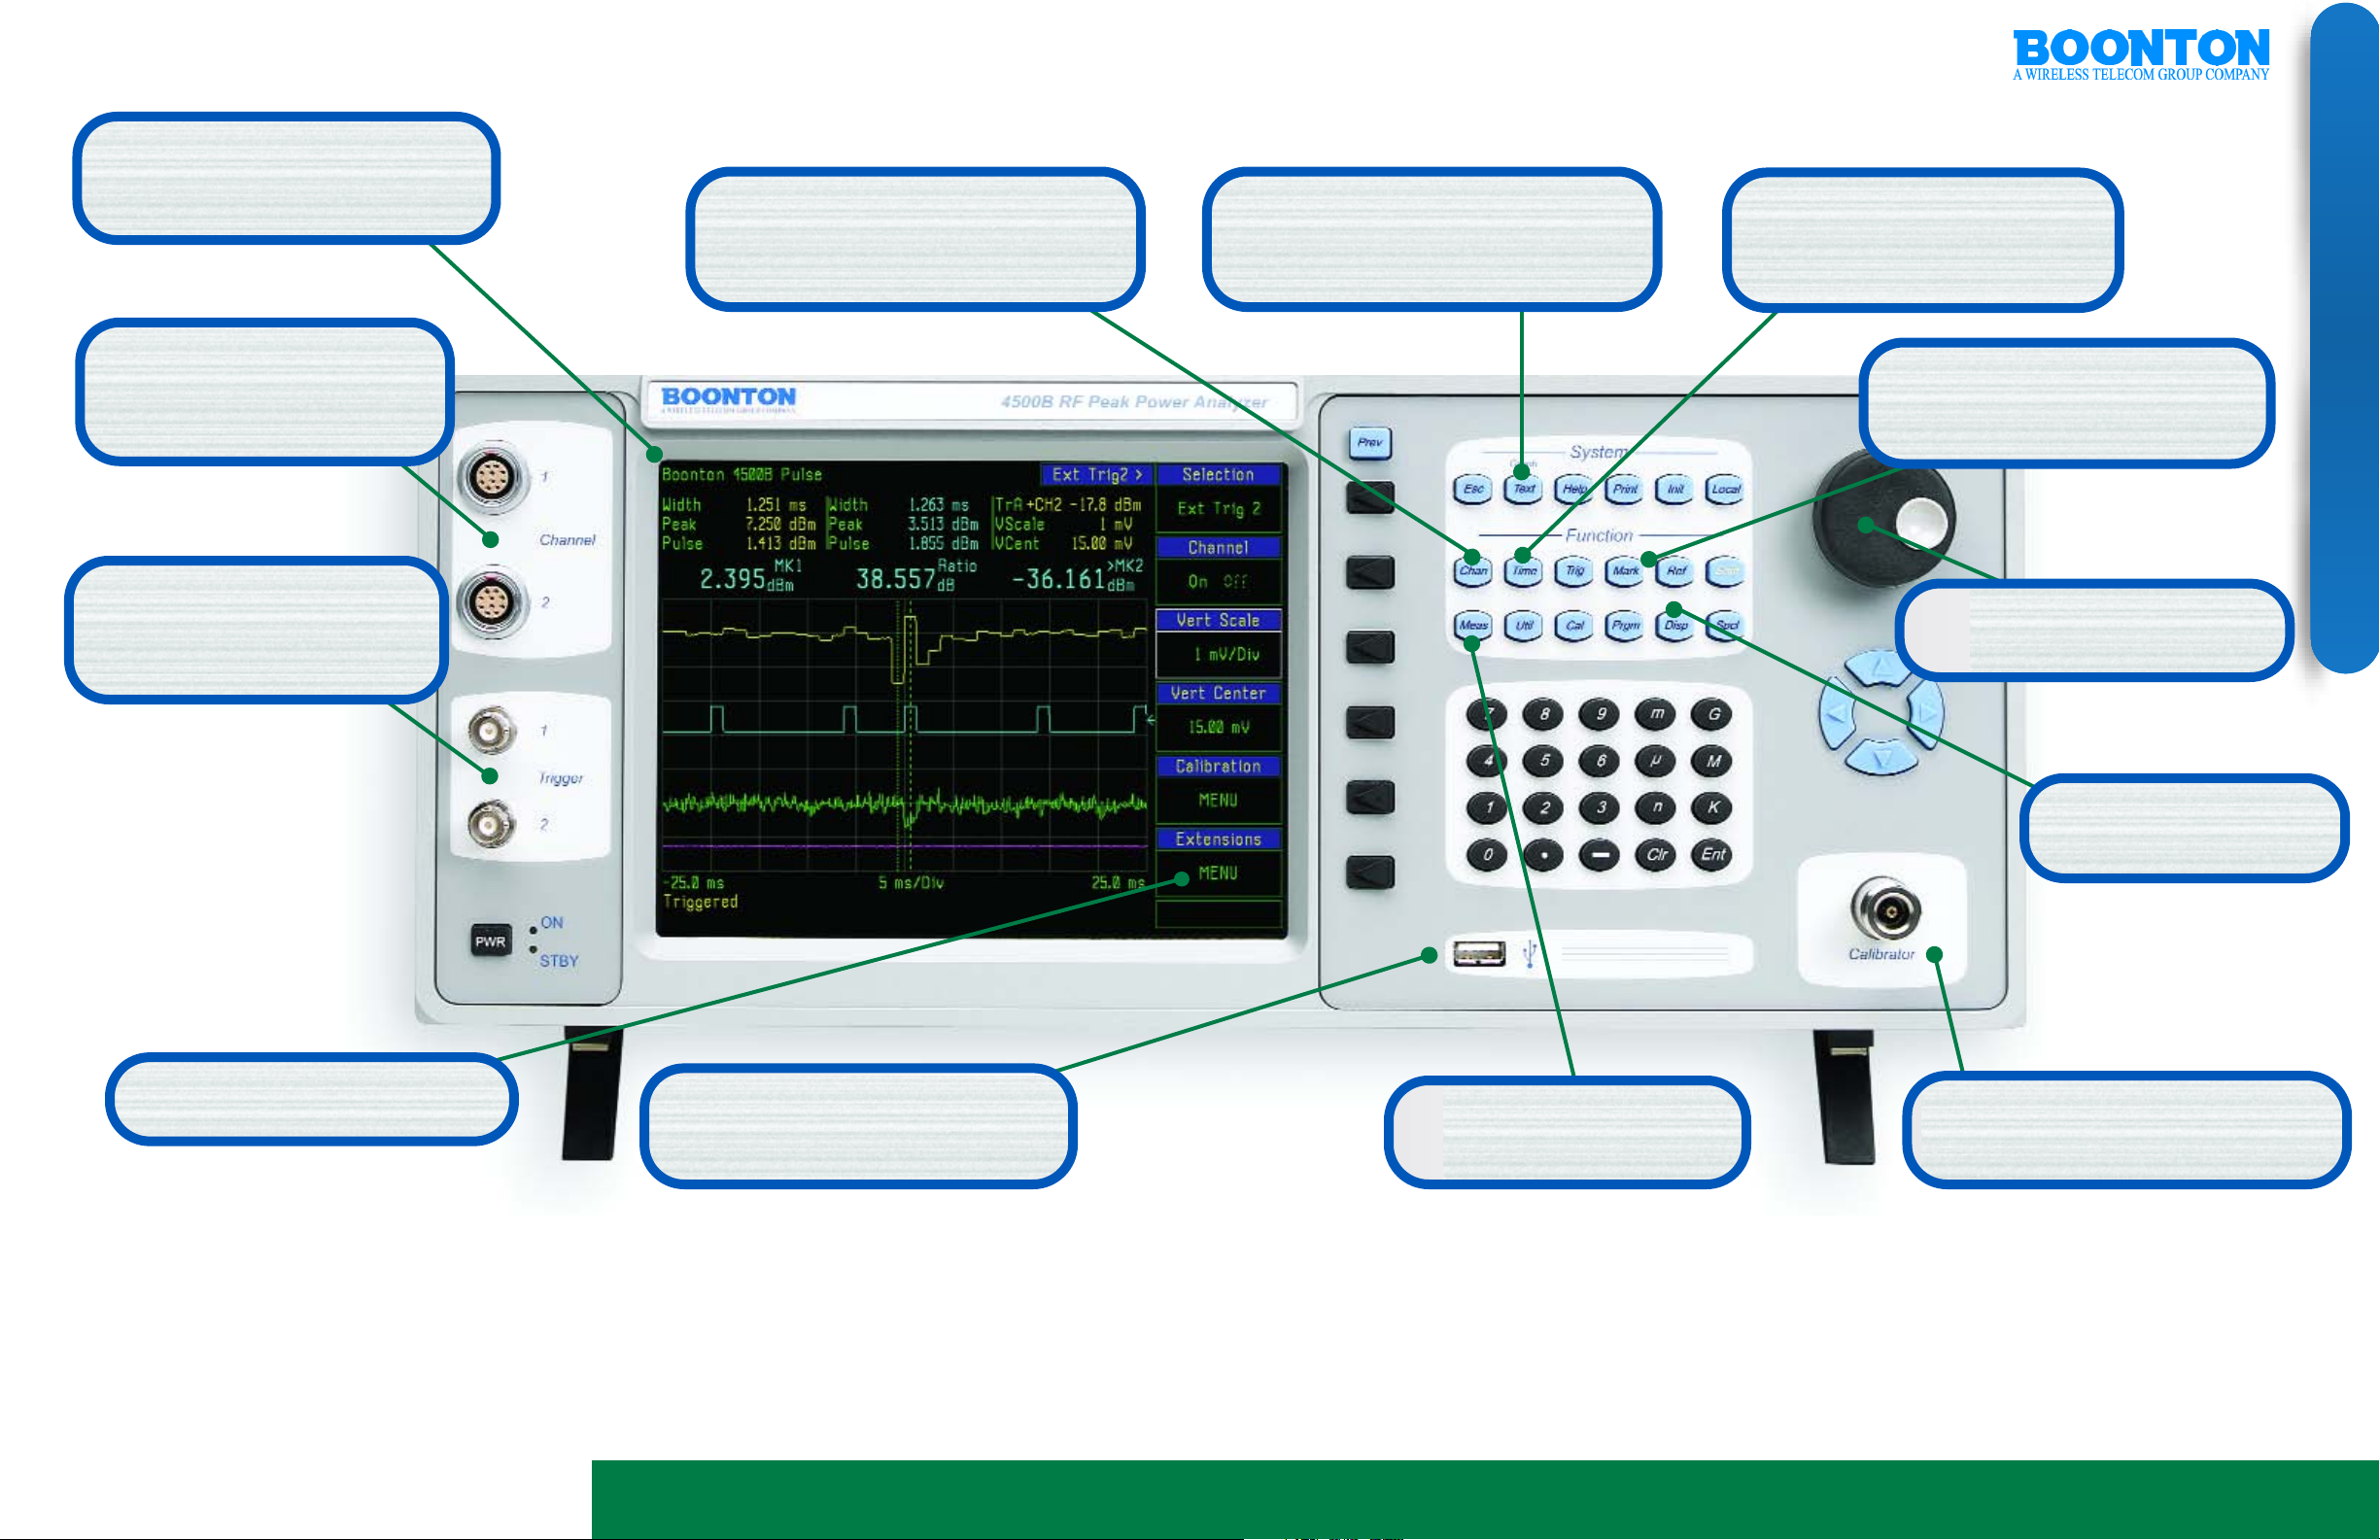
Large Display:
channels and measurements on the 8.4 Inch
Color TFT display
View multiple
High Bandwidth
Sensors:
are available, some with video bandwidth greater than 35 MHz and
risetimes less than 15 ns
Peak power sensors
Dual Trigger System:
Internal and external trigger with auto
peak-to-peak and B trigger delay by
time or events qualifier
Wide Dynamic Range:
power sensors are available from 1 MHz to 40 GHz,
some with greater than 60 dB dynamic range
Peak
Powerful Automatic
Measurements:
text key automatically displays up to 15
power and time measurements per channel
One button
Superior Time Capture:
View signals from 5 nsec/div to 1 hr/div with
100 psec resolution
Precise Measurements:
Markers and time gates allow for the
analysis of specific portions of a waveform
Interactive Control:
settings can be selected and updated
interactively with instant visual feedback
Most
Intuitive User Interface:
Easy to navigate, soft menu driven
Convenient I/O:
connectivity such as USB for data storage directly
to a flash drive
Windows based
Fast Data Analysis:
Statistical displays of PDF, CDF and CCDF
including time-gated analysis (optional)
Clear Views:
Persistence, envelope and roll
mode displays aid visual analysis
Accurate Auto-Calibration:
Precision 1 GHz RF step calibrator for superior
linearity and absolute level accuracy
- 2 -
- 3 -- 4 -
Visit www.boonton.com
Page 3
Peak Power Analyzer
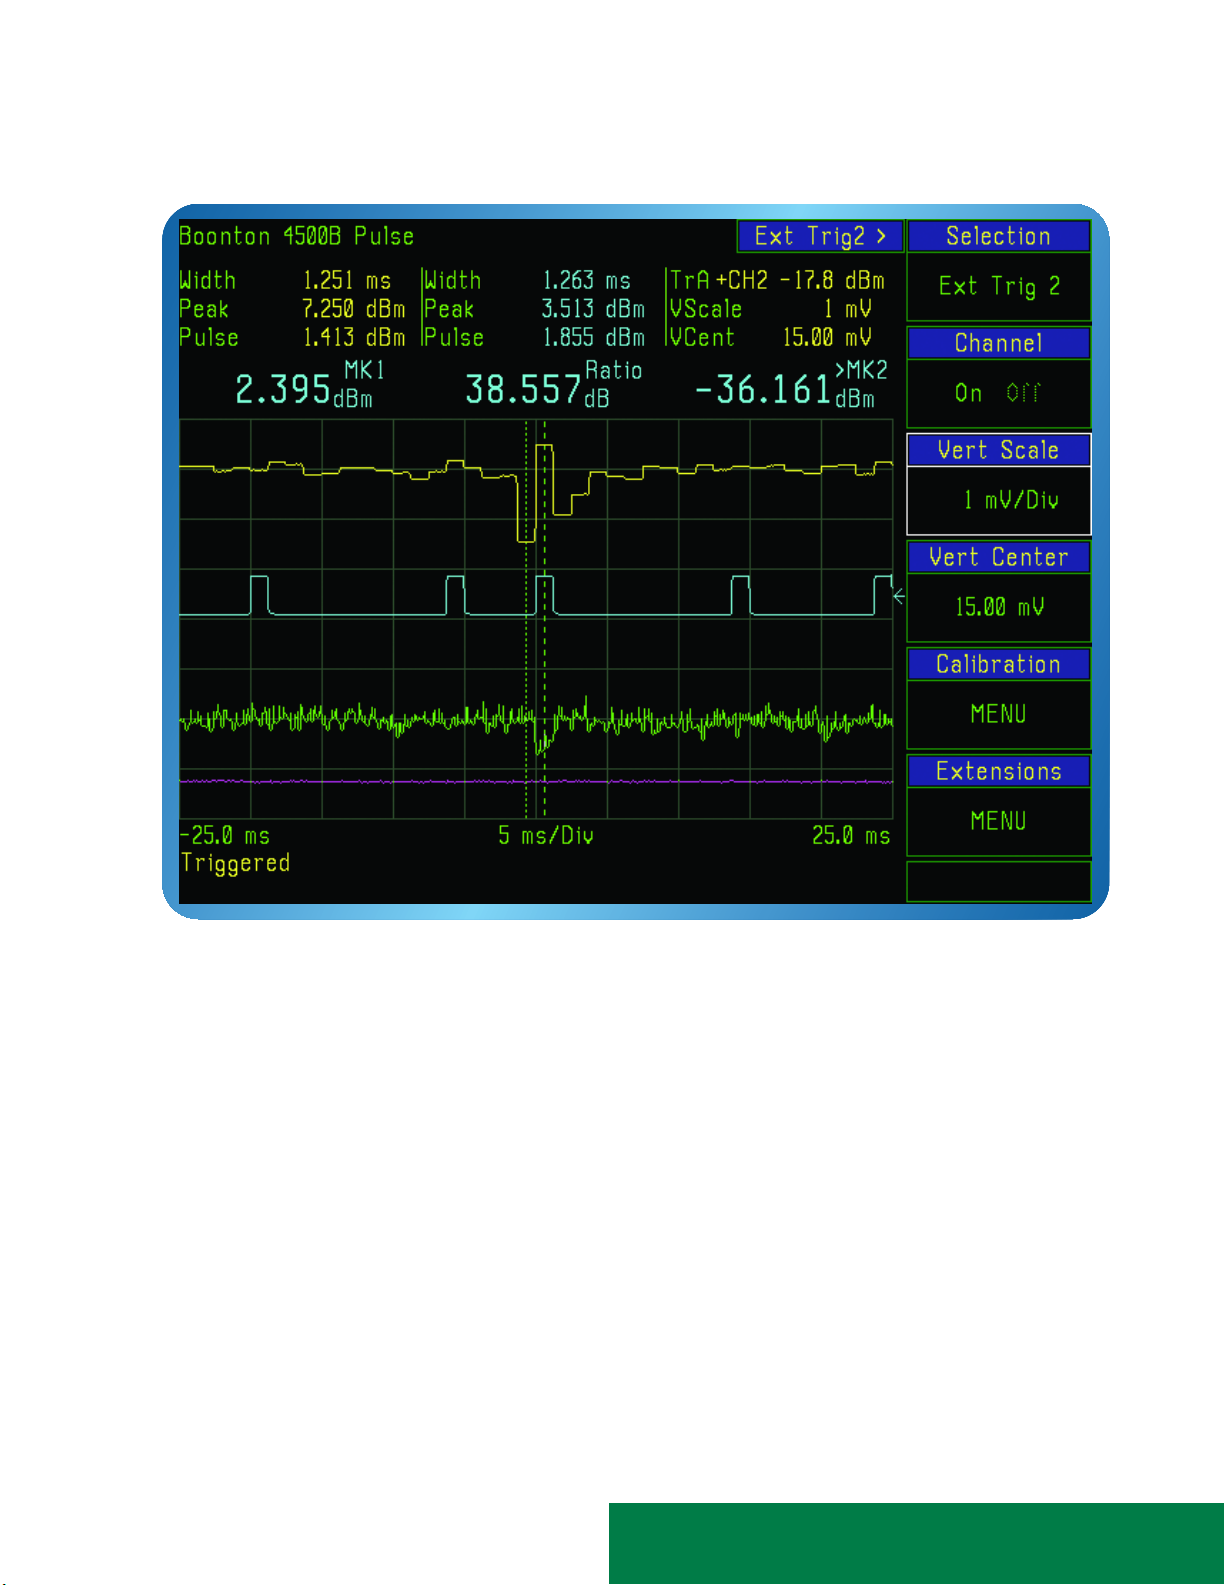
Capture Multiple Channels, Marker Measurements,
Automatic Measurements and Status in One Display
Figure 1:
The Boonton 4500B features a large 8.4” diagonal TFT color LCD, 640 x 480 pixels,
with CCFL backlight for a clear view of up to two live RF channels, two live trigger
channels, two stored memory channels and one live math channel simultaneously.
The need to clearly view multiple channels can be invaluable in many applications. The
large color display in the 4500B is especially well suited for multiple channel applications. User selectable colors are used to distinguish overlapping traces and to color
correlate graphical channel data with its measurements. For example, if the color of the
channel 1 is yellow then the measurements calculated on channel 1 are also yellow.
The traces and measurements are clearly marked and color correlated.
The 4500B gives the user the flexibility to customize the display by allowing them to
select the measurements or specific parametric settings and measurement indicators
they wish to display. These measurements can be grouped to avoid clutter.
Analysis of CDMA Pulse Train with RF and Trigger Channels Updating Simultaneously
- 4 -
Page 4
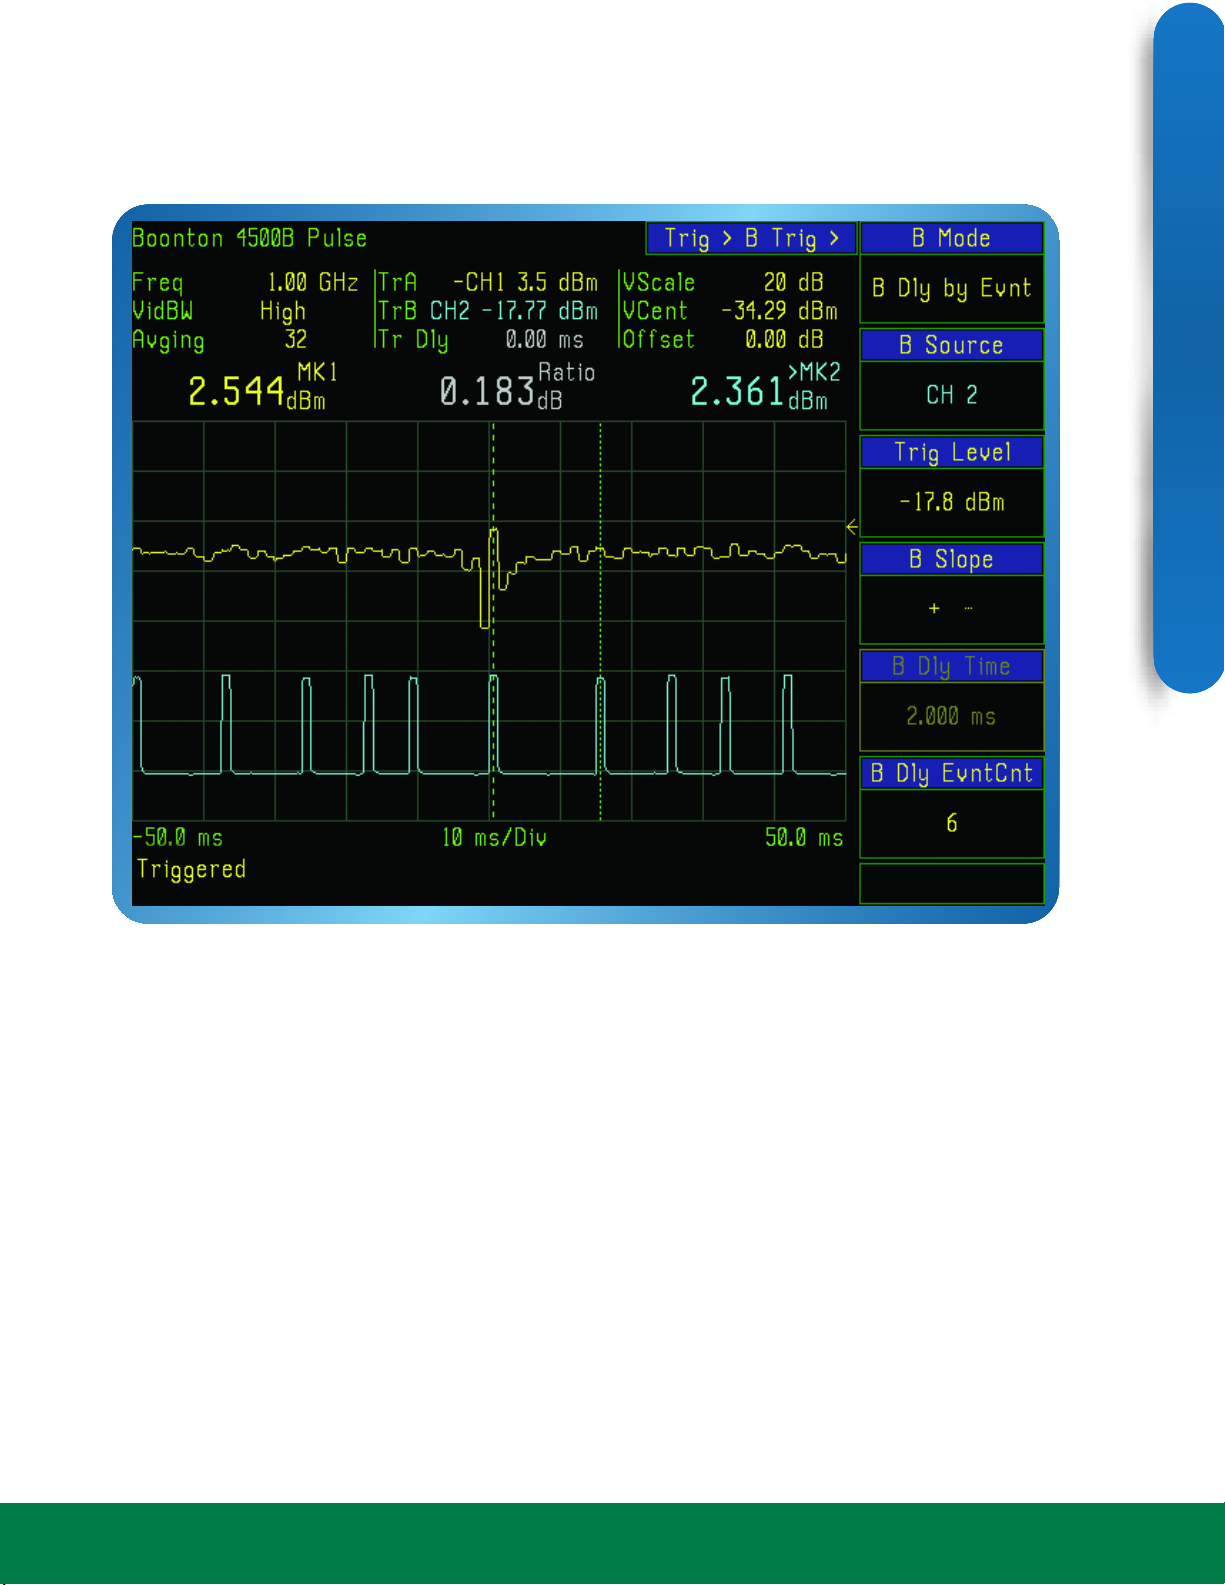
Capture a Signal Based on a User-Selected
Pulse or Time Delay
4500B RF PEAK POWER ANALYZER
Figure 2:
The 4500B features a unique trigger qualifier that allows a user to qualify the trigger
on a specific event or a specific delay time allowing a user-selected pulse to be
captured, even when its timing is variable. Modern communications signals typically
have long frames of data and it is often important to lock a peak power acquisition to
a specific time slot or to a specific event within a group. The B trigger qualifier eliminates problematic synchronization issues associated with time jitter within pulse bursts
that are often found in UWB and RADAR applications. This qualifier may be set up to
999,999 events or up to 1 second.
Qualify the Trigger on a Specific Event in CDMA pulse train
- 5 -
Visit www.boonton.com
Page 5
Peak Power Analyzer
Display the Envelope of Your Signal and Quickly
Analyze the Peaks
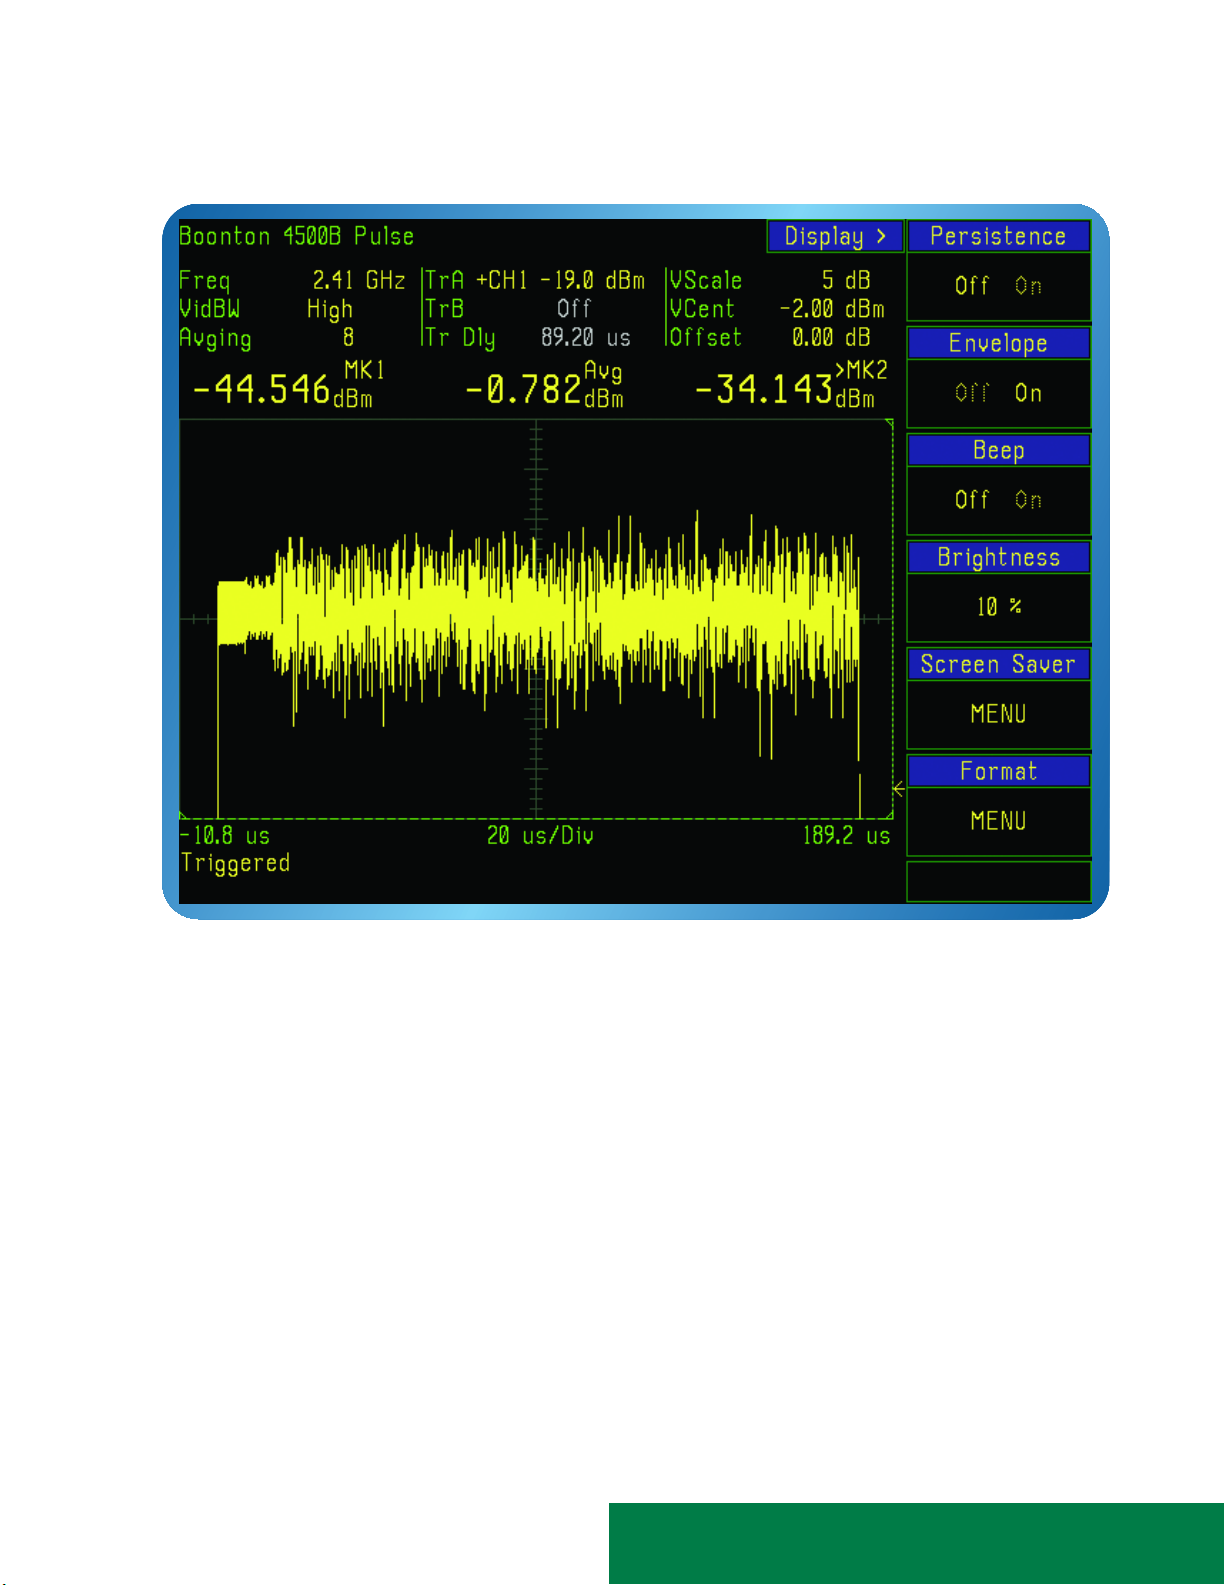
Figure 3:
The 4500B features persistence and envelope displays to aid in the analysis of noise-like
signals with complex modulation schemes such as WLAN and CDMA. Persistence and
envelope displays provide a fast view of the maximum and minimum excursions of the
signal under test. These display modes provide a clear, large screen representation of
changing signals. The combination of a large 8.4” diagonal color display with persistence and envelope displays make viewing signals far easier than with traditional
bench-top power meters.
Envelope of 802.11 WLAN Signal
- 6 -
Page 6
Analyze Your Signal with Automatic
Measurements and Markers
4500B RF PEAK POWER ANALYZER
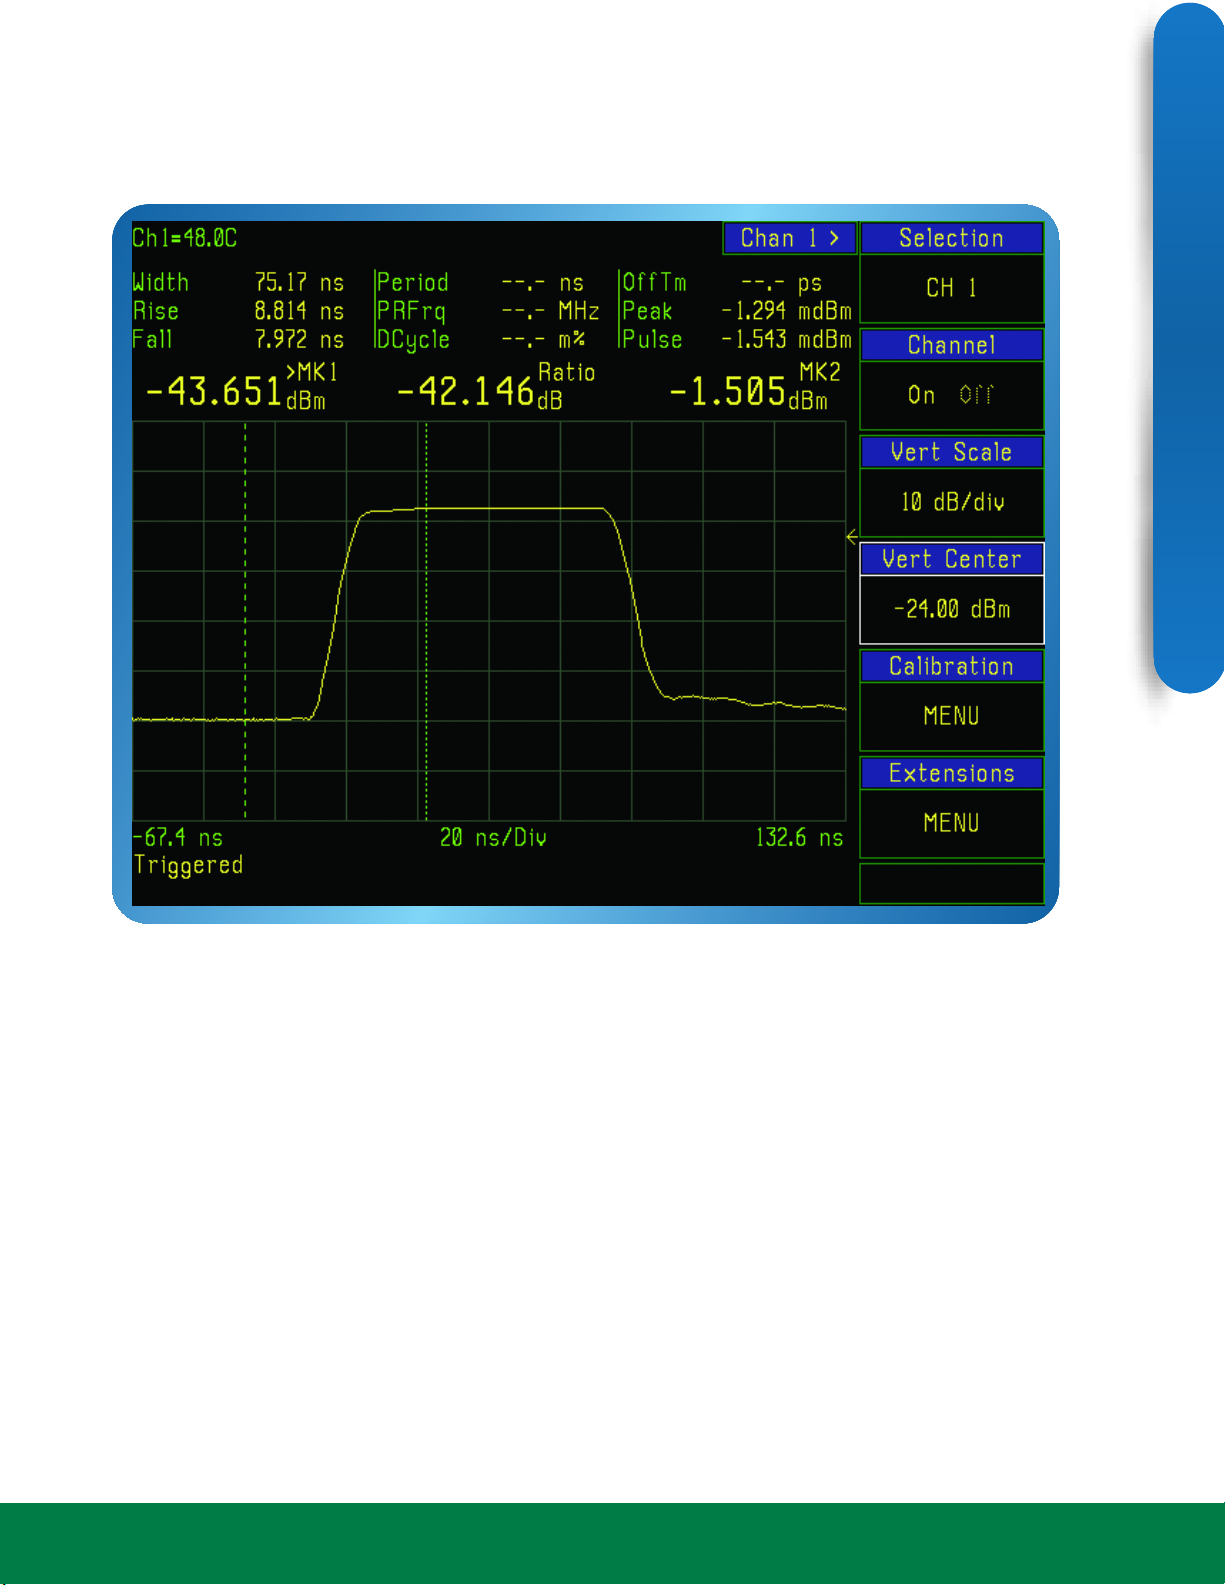
Figure 4:
The 4500B provides power-versus-time waveform analysis of repetitive RF signals.
Applications include TDMA and GSM, as well as RF amplifier linearity testing, RADAR,
satcom, and avionics. The timebase extends to 5 nsec/div and the logarithmic power
display will show more than 60 dB dynamic range.
Two adjustable markers can read the power at any point across the waveform. In
addition, the markers can be used to define the portion of the waveform in which the
maximum power, minimum power, long term average power and peak to average
ratios are measured. This is especially useful for characterizing the power level over a
portion of the top of a pulse.
An auto measure function measures and calculates 15 common power and timing
parameters. All parameters for up to four active channels are summarized in a Text
display and are also available as user defined display parameters above the Graph
display.
Pulsed RF including width, rise time and fall time measurements
- 7 -
Visit www.boonton.com
Page 7
Peak Power Analyzer
Analyze Your Signal with Channel Math
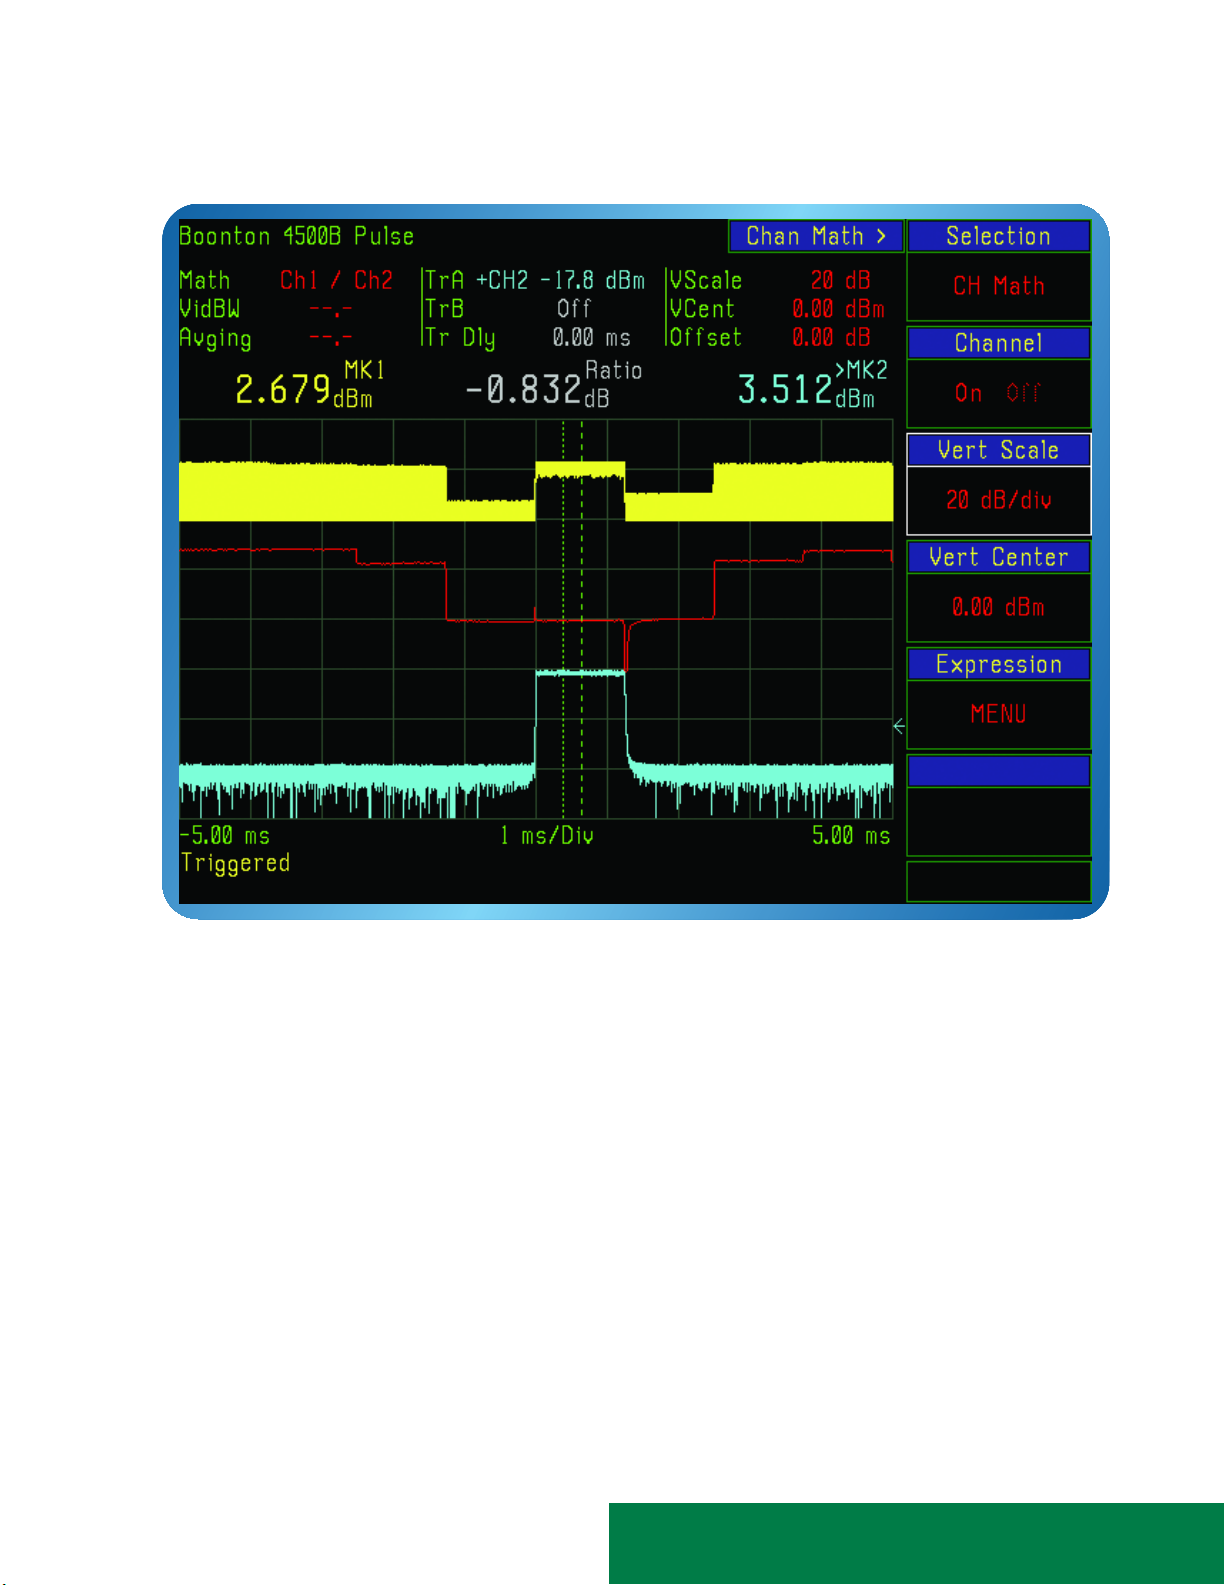
Figure 5:
Channel math can be performed on active and saved memory traces. These powerful
math functions can be used to analyze the differences between channels, making difficult measurements like output stage compression and inter-modulation distortion easy
to identify and correct. The large color display provides a clear view of the active channels and continuously updated math function. Status and measurement data is color
correlated with the associated channel or math function allowing for quick setup and
clear views of multiple channel measurements at the same time.
Math functions showing the ratio between channels of two signals
- 8 -
Page 8
Analyze Your Signal With Time Gated
Measurements
4500B RF PEAK POWER ANALYZER
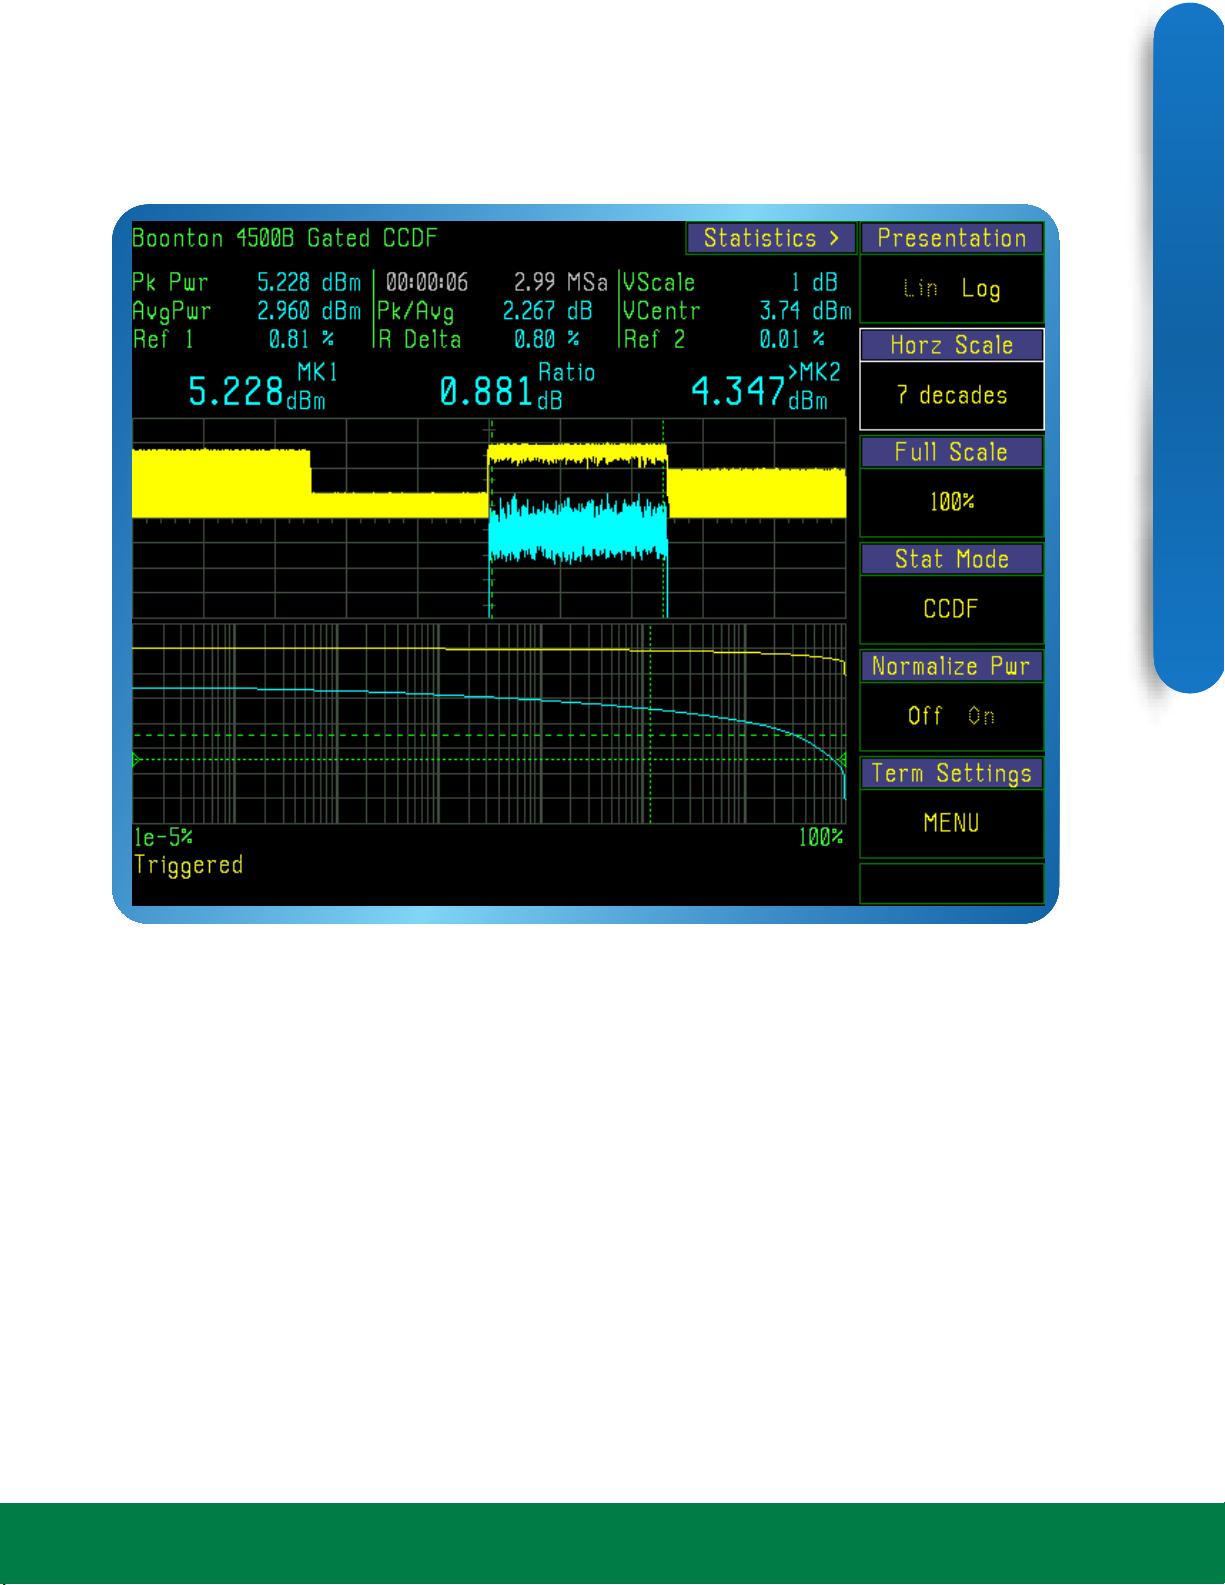
Figure 6:
Optional statistical power measurement techniques are powerful tools in measuring
noise-like signals such as CDMA, QAM, or OFDM. Complementary cumulative distribution function (CCDF) shows the peak power, average power and the peak-to-average
ratio as well as the probability of occurrence of different power levels with respect to
time. The instantaneous power values are sorted by amplitude and counted, and the
values are displayed as a power level vs. percent probability of occurrence. A powerful
analysis technique in the 4500B allows user defined intervals of signals to be gated and
the statistical distribution calculated. Time gated measurements provide analysis of
specific areas of interest on a signal.
CDMA timeslots with time gated complementary cumulative distribution function (CCDF)
- 9 -
Visit www.boonton.com
Page 9
Peak Power Analyzer
Characterize Your Signal With Fast
Statistical Analysis
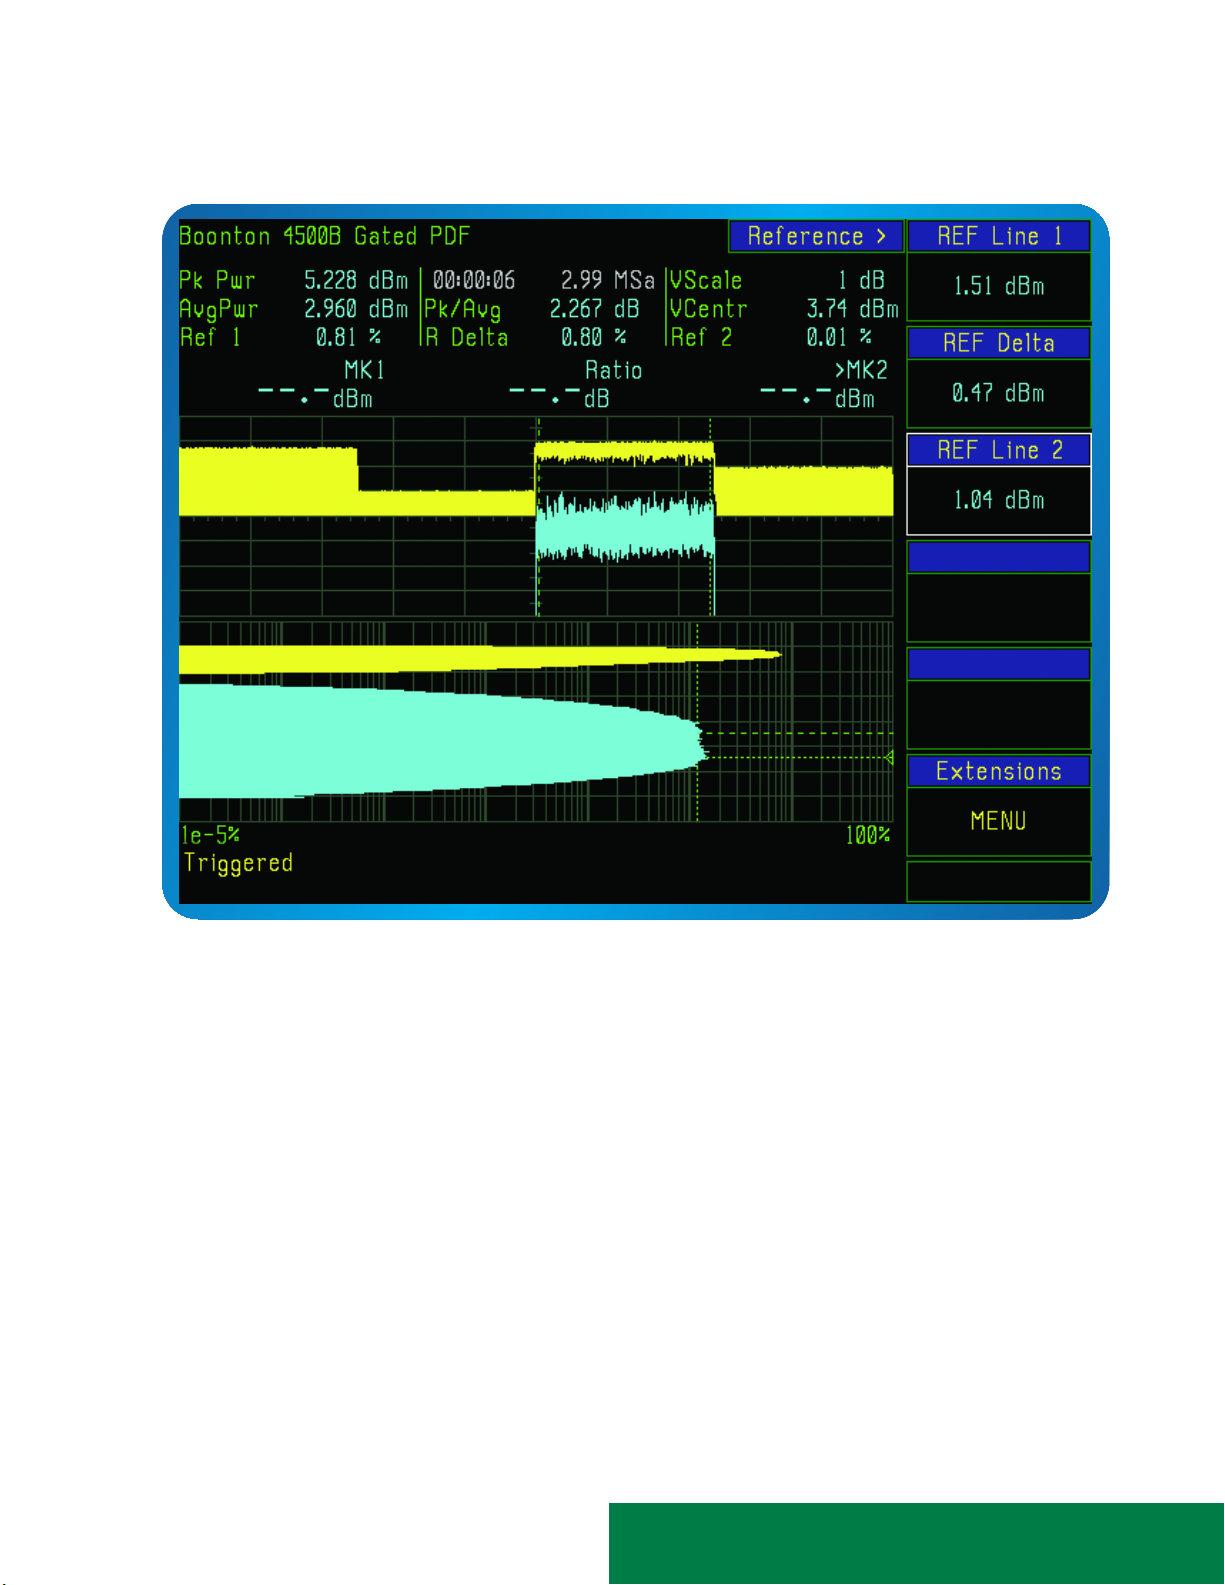
Figure 7:
The 4500B features optional probability density functions (PDF) and cumulative distribution functions (CDF, CCDF) to accurately characterize noise-like RF such as CDMA, HDTV
and WLAN. These statistical functions build and analyze a very large population of
power samples continuously at a rate of up to 25 MHz or triggered up to 50 MHz on
two channels simultaneously. These functions are fast, accurate and allow the measurement of very infrequent power peaks for a user-defined population size or acquisition
interval. Although the programmable acquisition time can be very long or continuous,
even short runs can resolve very low probabilities, due to the extremely high sample
throughput.
Analyze CDMA timeslots with time gated probability density function (PDF)
- 10 -
Page 10

specs
4500B RF PEAK POWER ANALYZER
Sensor Inputs
RF Frequency Range: 1 MHz to 40 GHz
Pulse Measurement Range: -40 to +20 dBm
Modulated Measurement Range: -50 to +20 dBm
Relative Offset Range: ±100.00dB
Logarithmic Vertical Scale 0.1 to 50 dBm/div in 1-2-5 sequence
Linear Vertical Scale 1 nW/div to 50 MW/div in 1-2-5 sequence
Rise Time: <3 nsec
Single-Shot Bandwidth: 5 MHz (based on 10 samples per pulse)
Pulse Repetition Rate: 50 MHz max
Minimum Pulse Width: 6 nsec
(performance specifications are sensor model dependent)
0.1 to 50 dBV/div in 1-2-5 sequence
0.1 to 50 dBmV/div in 1-2-5 sequence
0.1 to 50 dBuV/div in 1-2-5 sequence
1 mV/div to 50 kV/div in 1-2-5 sequence
Time Base
Time Base Range: 5 nsec/div to 1 hr/div
Time Base Accuracy: 0.01%
Time Base Resolution: 100 psec
Time Base Display: Sweeping or roll mode
Statistical X-Axis (optional)
Scale: Linear or logarithmic, 1 to 7 cycles
Linear Ranges: 0.1%/div to 10%/div
Linear Offset: 0 to 99.9%, 0.1% resolution
Log Range: 1e-9% to 100%
Trigger
Trigger Source: Channel 1 (internal)
Channel 2 (internal, with optional channel 2)
External trigger 1
External trigger 2 (with optional channel 2)
Trigger Slope: + or –
Trigger Delay Range: Time base setting Delay range; pre trig (-), post trig (+)
5 nsec to 500 nsec -4 msec to +100 msec
1 usec to 10 msec ±4000 divisions
20 msec to 3600 sec -40 to +100 sec
Trigger Delay Resolution: 0.02 divisions
- 11 -
Visit www.boonton.com
Page 11

Peak Power Analyzer
Trigger Hold-off Range: 0.0 – 1.0 sec
Trigger Hold-off Resolution: 10 nsec
Trigger Mode: Normal, auto, auto peak-to-peak, free Run
B Trigger Mode: A only, B delay-by-time, B delay-by-events
B Trigger Source: Chan 1, chan 2, ext trig 1, ext trig 2
B Trigger Slope: + or –
B Trigger Events Counter Range: 1 to 999,999 events
B Trigger Time Delay Range: 0.0 – 1.0 sec
B Trigger Time Delay Resolution: 10 nsec
Internal Trigger Level Range: -40 to +20 dBm (sensor dependent)
External Trigger Level Range: ±5 volts, ±50 volts
External Trigger Input: 1M or 50 ohm, DC Coupled
Calibration Source
Operating Modes: CW, internal pulse or external pulse
Frequency: 1.024 GHz ± 0.01%
Level Range: -50 to +20 dBm
Resolution: 0.1 dB
Output VSWR: 1.20 maximum
Absolute Accuracy: ±0.065 dB (±1.5%) at 0 dBm
Accuracy vs Level: add ±0.03 dB per 5 dB increment from 0 dBm
Preset Internal Pulse Period: 100 usec, 1 msec or 10 msec
Preset Internal Pulse Duty Cycle: 10% to 90% in 10% increments
Variable Pulse On Time: 7 usec to 65.535 msec in 1 usec steps
Variable Pulse Period: 28 usec to 131.072 msec in 2 usec steps
Off-time limits - within 7 usec to 65.535 msec
Pulse Polarity; + or –
RF Connector: Precision type N
External Pulse Input: Rear panel BNC, TTL level compatible
Auto-Calibration: The calibrator is used to automatically generate linearity calibration data
for peak power sensors.
Measurement System
Sensor Inputs: One or two sensor measurement channels.
Measurement Technique: Random repetitive sampling system that provides pre and post-trigger
data as well as statistical histogram accumulation.
Maximum Sampling Rate: 50 Mega-samples/second on up to four channels simultaneously.
(Equivalent effective sampling rate of 10 Giga-samples/second)
Memory Depth: 256K samples per channel at max sampling rate
Vertical Resolution: 0.008%, 14-bit A/D Converter
Waveform Averaging: 1 to 16,384 samples per data point (time domain measurement)
Number of Histogram Bins: 16,384
Size of Sample Bins: 32-bits (4,000 mega-samples)
Bin Power Resolution: <0.02 dB
- 12 -
Page 12

Statistical Acquisition (optional)
Modes: Continuous or gated by pulse mode time markers
Sampling Rate: 25 Mega-samples/second on 2 channels simultaneously.
Limit Count: Adjustable, 2 – 4096 Mega-samples
Limit Time: 3600 seconds (approximately 2.5 min. at full sample rate)
Terminal Action: Stop, flush and restart or decimate
System Displays
Display Type: Power versus time (pulse mode)
Power versus time (modulated mode)
External trigger versus time (pulse mode)
Auto-measure text (all modes)
Help text (all modes)
Reports (sensors, configuration, calibrator, files,
stored waveforms, GPIB commands, GPIB buffers)
4500B RF PEAK POWER ANALYZER
Statistical Display Type (Optional): Cumulative Distribution Function (CDF)
Complementary Cumulative Distribution Function (CCDF)
Split screen, gated CCDF and power versus time (pulse mode,CCDF)
Distribution function (histogram)
External trigger statistical (statistical mode)
Auto-measure text (statistical mode)
Pulse and Modulated Mode Marker Measurements
Markers (Vertical Cursors): Settable in time relative to the trigger position
Marker Independently: Power at specified time
Pair of Markers: Power at two specified times with ratio or average power between them.
The minimum and maximum power between the markers and the ratio or
average power between them.
The average power, peak power (hold) and peak-to-average power ratio
between the markers.
Lines (Horizontal Cursors): Settable in power
Automatic Tracking: Intersection of either marker and the waveform.
Either marker and pulse distal, mesial or proximal levels.
Statistical Mode Marker Measurements (optional)
Markers (Vertical Cursors): Settable in percent (distribution functions):
Each Marker Independently: Power at specified percent
Pair of Markers: Power ratio at two specified percents.
Statistical analysis between markers (using triggered statistical mode)
Ref Lines (Horizontal Cursors): Settable in power
Automatic Tracking: Set to track the intersection of either marker and the distribution
function measure percent probability at a defined power level
- 13 -
Visit www.boonton.com
Page 13

Peak Power Analyzer
Pulse Mode Automatic Measurements
Power Versus Time (Pulse) Mode: Pulse width
Pulse rise-time
Pulse fall-time
Pulse period
Pulse repetition frequency
Pulse duty cycle
Pulse off-time
Peak power
Pulse power
Percent overshoot
Average power
Top level power
Bottom level power
Pulse edge skew between channels
Edge delay
Statistical Mode Automatic Measurements (optional)
Statistical Mode: Peak power
Average power
Minimum power
Peak to average ratio
Dynamic range
Power at markers (absolute or normalized)
Percent at reference lines
Total time (indicated)
Total number of samples (indicated)
Waveform Storage
Storage Locations: Waveforms and distribution functions can be saved to and recalled from
internal storage locations and removable file-based memory devices.
External Interfaces
GPIB: Programmable interface; complies with SCPI ver. 1990
RS-232C Interface 1: Serial printer/plotter interface
RS-232C Interface 2: Diagnostic interface
USB: General purpose i/o interface
LPT1: Parallel printer/plotter (Centronics type)
LAN: Ethernet port. Optional software required.
- 14 -
Page 14
Other Characteristics
Display: 8.4” Diagonal TFT color LCD, 640 x 480 pixels, with CCFL Backlight.
Main Computer: Pentium based architecture
Hard Disk: Internal EIDE 40 Gbytes
Acquisition Engine: 32-bit Floating Point DSP in each installed channel
CE Mark Compliance for use in the European Union
Operating Temperature: 0 to 50 degrees C
Power Requirements: 90 to 260 VAC, 47 to 63 Hz, 120W
Dimensions (HWD): 19” rack-mountable; 7.0” x 17.5” x 19.5” (17.8 cm x 44.5 cm x 49.5 cm)
Weight: 25 lbs (11.4 kg)
4500B RF PEAK POWER ANALYZER
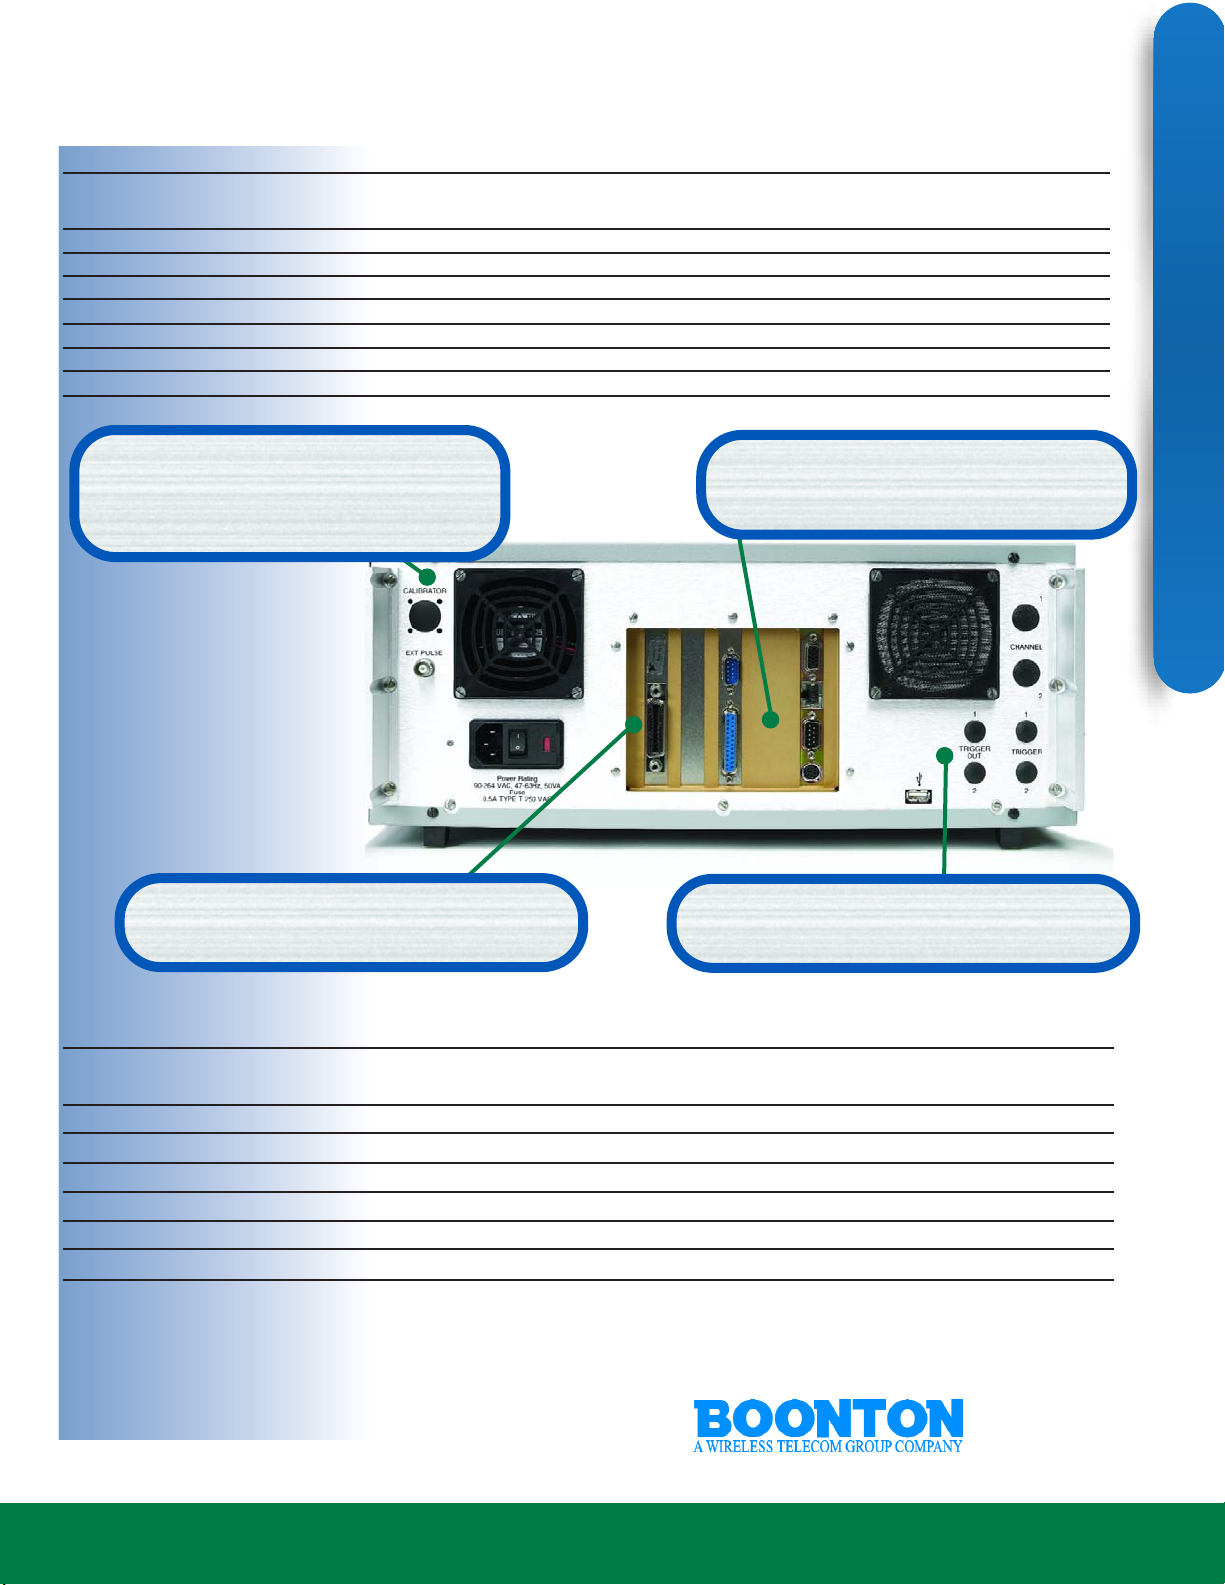
Efficient Design:
corrected power supply and thermostatically
controlled, dual-fan cooling system
Remote Control:
compliant command set and legacy support.
Ordering Information:
Power factor
GPIB with SCPI
Convenient I/O
external monitor, LAN and USB
Optional Inputs:
inputs, optional trigger output
Printer ports,
Replace front panel
4500B RF Peak Power Analyzer, single channel, front panel inputs.
-01 Dual channel, front panel inputs
-02 Single channel, rear panel inputs
-03 Dual channel, rear panel inputs
-06 Trigger outputs (rear panel only)
-07 Calibrator, rear panel output
-10 Statistical package (includes gated CCDF and PDF)
-30 Warranty extended to 3 years
©2005 Boonton Electronics (A Wireless Telecom
Group Company.) All Rights Reserved.
Specifications subject to change without notice.
- 15 -
Visit www.boonton.com
25 Eastmans Road
Parsippany, NJ 07054 U.S.A.
Phone: +1 (973) 386-9696
Fax: +1 (973) 386-9191
Email: [email protected]
Web site: www.boonton.com
 Loading...