

Page 1
Model 2650A/2651 Series
3.3 GHz/8.5 GHz Spectrum Analyzer
USER MANUAL
v 092711
Page 2
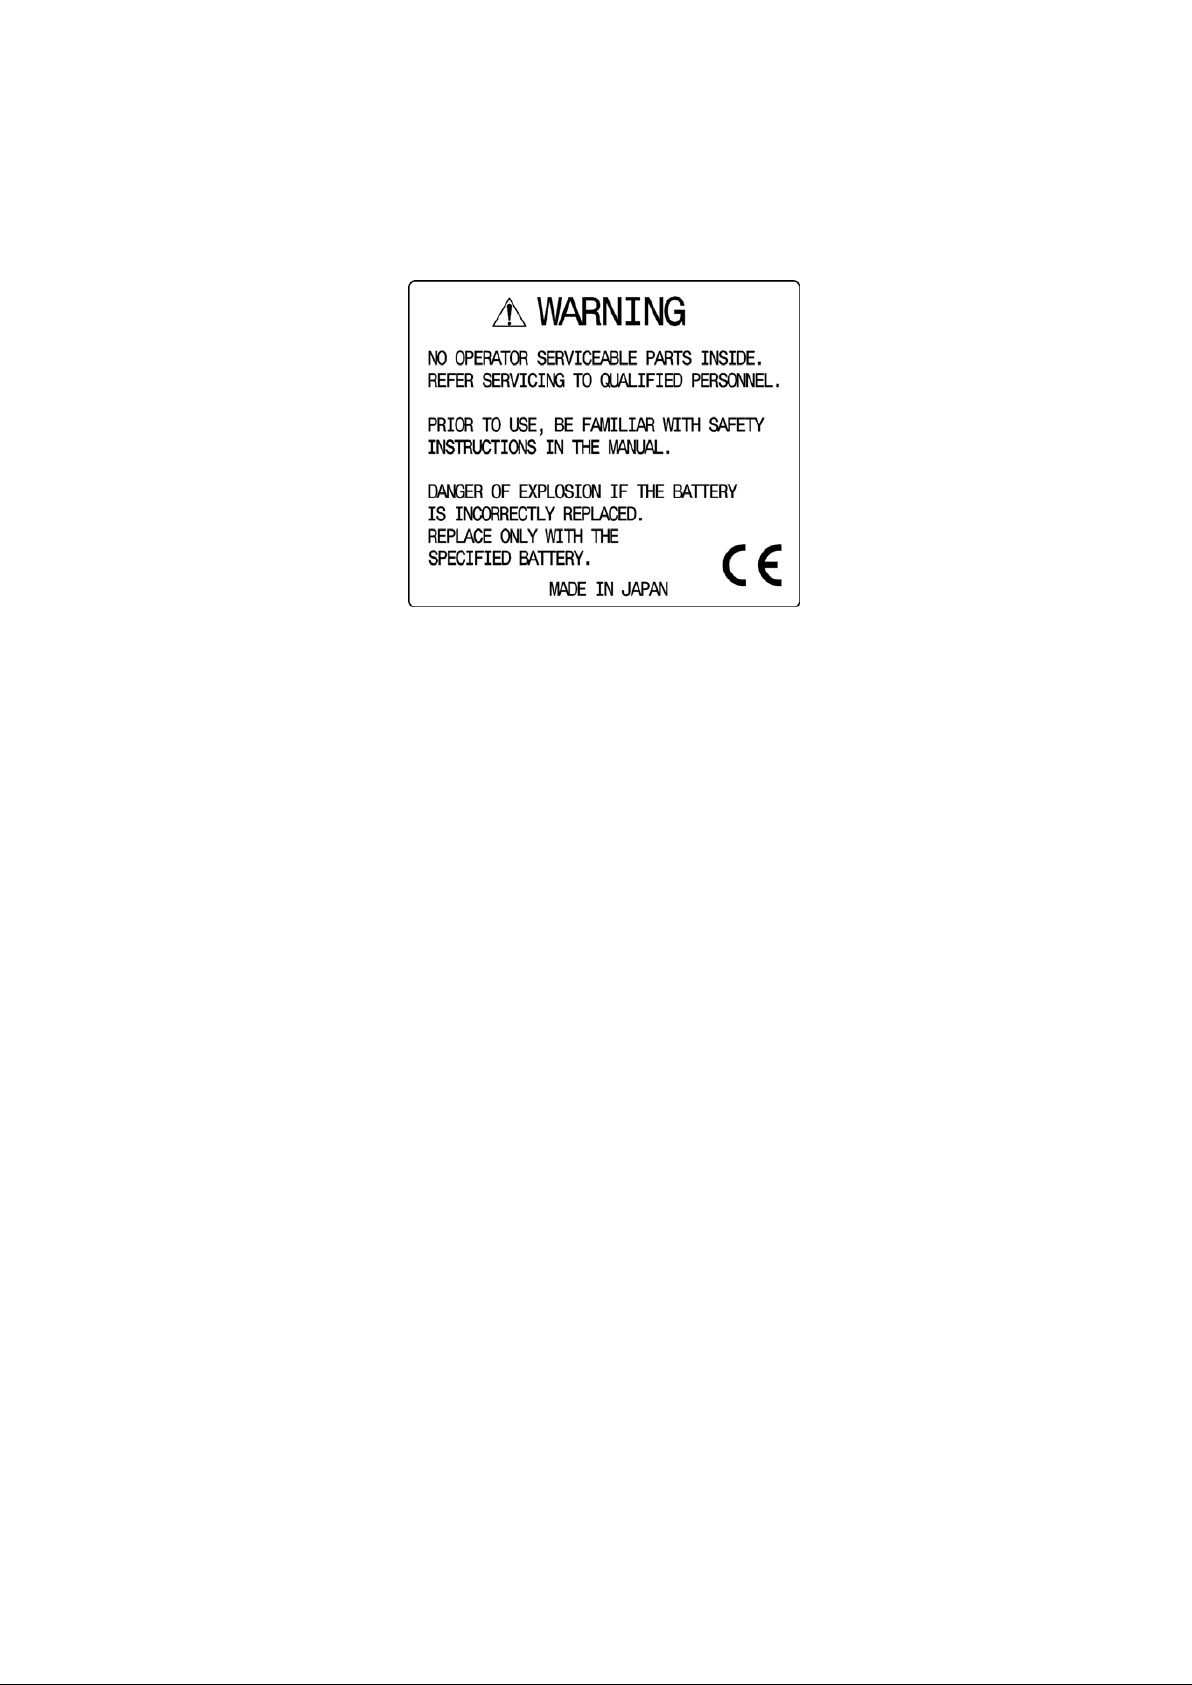
Before Using the Product
· Please note the following describe d on the back panel.
· For safe use:
1) When abnormal sound, abnormal smell or smoke is found, stop using the
product and remove the battery and AC adapter.
2) Never handle this product with wet hands to prevent risks of electric shock, fire,
or damage.
3) Never use this product under lightning conditions to prevent risks of damage.
4) Never use any AC adapter other than specified, or it will cause damage.
Connect the power cable only to three-terminal outlet for protection from static
electricity, otherwise this product or a device under test may be damaged.
5) Never use any battery other than specified, or it may damage this product. Turn
off the power and disconnect the AC adapter befo re remo vin g the b atter y out of
the battery compartment.
6) Be sure to charge the battery as specified in the instructions in this manual.
Moreover, an explosion, fire or smoke may occur if battery is handled
improperly.
Please read the notes for handling the battery.
i
Page 3

· Set clock function
The time information is set at Japan standard time. Set the year, month, day and
time when the 2650A series is used for the first time. (Refer to “24.4 Setting
the clock” for the details.)
· Quality assurance
Warranty
If the defect by our responsibility occurs within one year after delivered, it
shall be repaired free of charge. However, this warranty does not cover such
defect that :
1) is caused by a fire or natural disasters.
2) is caused by inappropriate handling such as dropping while moving the
unit delivered.
3) is caused by handling in contradiction to us age or precautions described
in the operating manual.
4) is caused by modification or misuse.
We will not be responsible for direct or indirect damage caused by use or
defect of this product.
Refer to the end of this manual for details.
Warm-up time
Warm up the product for at least ten minutes after turning on the power in
order to stabilize the internal circuit.
Precaution s for st o r age
1) Avoid direct sunlight or dust.
2) Store this unit in a place where temperature is between -20 °C to 60 °C,
humidity less than 60 °C/70 %RH and variations in temperature and
humidity are small.
After service
Please contact us without hesitation if you have any questions about this
product:
B&K PRECISION
22820 Savi Ranch Parkway
Yorba Linda CA, 92887
TEL. (714) 921 - 9095 FAX. (714) 921 - 6422
URL: http://www.bkprecision.com
ii
Page 4

Contents
1. OUTLINE -------------------------------------------------------------------------------------- 1
1.1
1.2
1.3
1.4
P
RODUCT OUTLINES -------------------------------------------------------------------------- 1
TANDARD ACCESSORIES ------------------------------------------------------------------- 2
S
PTIONAL ACCESSORIES -------------------------------------------------------------------- 2
O
VERVIEW OF ALL FOUR MODELS ---------------------------------------------------------- 3
O
2. SPECIFICATIONS -------------------------------------------------------------------------- 4
2.1
2.2
P
ERFORMANCE -------------------------------------------------------------------------------- 4
XTERNAL VIEW ------------------------------------------------------------------------------- 7
E
3. EXPLANATION OF PANEL ------------------------------------------------------------- 8
4. EXPLANATION OF SCREEN --------------------------------------------------------- 11
5. FUNCTION MENU ------------------------------------------------------------------------ 12
5.1
5.2
L
IST OF FUNCTION MENU ------------------------------------------------------------------ 12
ENU TREE ---------------------------------------------------------------------------------- 13
M
6. PREPARING FOR OPERATION ----------------------------------------------------- 19
6.1
6.2
6.3
6.4
S
TAND ---------------------------------------------------------------------------------------- 19
ONNECTION TO POWER SUPPLY -------------------------------------------------------- 19
C
ATTERY CHARGE -------------------------------------------------------------------------- 20
B
NSTALLATION OF BATTERY --------------------------------------------------------------- 20
I
7. CENTER FREQUENCY <FREQ> ---------------------------------------------------- 21
7.1
7.2
7.3
7.4
S
ETTING WITH STEP KEYS ( [F1], [F2] ) ------------------------------------------------- 21
ETTING WITH ENCODER ------------------------------------------------------------------ 21
S
ETTING WITH NUMERIC KEY -------------------------------------------------------------- 22
S
CCORDING TO MARKER POSITION ----------------------------------------------------- 23
A
8. FREQUENCY SPAN <SPAN> -------------------------------------------------------- 23
8.1
S
WITCHING FREQUENCY BAND ----------------------------------------------------------- 24
9. REFERENCE LEVEL <REFER> ----------------------------------------------------- 25
9.1
9.2
9.3
9.4
9.5
9.6
9.7
9.8
S
ETTING OF REFERENCE LEVEL --------------------------------------------------------- 25
HANGE OF UNIT OF AMPLITUDE AXIS -------------------------------------------------- 25
C
ETTING OF STEP SIZE OF REFERENCE LEVEL ---------------------------------------- 25
S
N-OFF SETTING OF OFFSET ------------------------------------------------------------ 25
O
ETTING OF OFFSET LEVEL --------------------------------------------------------------- 25
S
ETTING OF INPUT IMPEDANCE ----------------------------------------------------------- 26
S
EFERENCE LEVEL SETTING RANGE FOR EACH UNIT ------------------------------- 26
R
ELATIONSHIP BETWEEN REFERENCE LEVEL AND ATT/AMP (AT DBM) ---------- 27
R
10. DISPLAY SCALE <SCALE> ------------------------------------------------------- 29
10.1 S
ETTING THE FUNCTION KEY ------------------------------------------------------------- 29
11. RESOLUTION BANDWIDTH <RBW> ------------------------------------------- 29
11.1 MANUAL
11.2 AUTO
11.3 ALL
MODE ---------------------------------------------------------------------------- 29
MODE -------------------------------------------------------------------------------- 30
AUTO MODE -------------------------------------------------------------------------- 30
iii
Page 5

12. VIDEO BANDWIDTH <VBW> ------------------------------------------------------ 30
12.1 MANUAL
12.2 AUTO
12.3 ALL
MODE ---------------------------------------------------------------------------- 30
MODE -------------------------------------------------------------------------------- 30
AUTO MODE -------------------------------------------------------------------------- 31
13. SWEEP AXIS / DETECTION MODE <SWEEP> ------------------------------ 31
13.1 MANUAL
13.2 AUTO
13.3 ALL
13.4 S
13.5 S
ETTING OF DETECTION MODE ---------------------------------------------------------- 31
ETTING OF TRIGGER SOURCE ---------------------------------------------------------- 32
MODE ---------------------------------------------------------------------------- 31
MODE -------------------------------------------------------------------------------- 31
AUTO MODE -------------------------------------------------------------------------- 31
14. AUTO TUNING <AUTO TUNE> --------------------------------------------------- 32
15. HOLD / RUN <HOLD/RUN> -------------------------------------------------------- 32
16. CALCULATION FUNCTION <CALC> ------------------------------------------- 33
16.1 NORMAL
16.2 MAX
16.3 MIN
16.4 AVERAGE
16.5 OVERWRITE
16.6 SPURIOUS
MODE ---------------------------------------------------------------------------- 33
HOLD MODE ------------------------------------------------------------------------- 33
HOLD MODE -------------------------------------------------------------------------- 33
MODE -------------------------------------------------------------------------- 34
MODE ---------------------------------------------------------------------- 34
FREE MODE (2658A ONLY) ---------------------------------------------- 34
17. MARKER & PEAK SEARCH <MKR> ------------------------------------------- 35
17.1 M
17.2 N
17.3 Z
17.4 C
OVEMENT AND BASIC FUNCTION OF MARKER --------------------------------------- 36
ORMAL PEAK SEARCH ------------------------------------------------------------------- 36
ONE PEAK SEARCH ----------------------------------------------------------------------- 36
HANGE UNIT OF MARKER LEVEL ------------------------------------------------------- 37
18. SAVE / LOAD <SAVE/LOAD> ---------------------------------------------------- 37
18.1 S
18.2 S
18.3 A
18.4 L
18.5 D
18.6 P
ELECTION OF STORAGE DEVICE -------------------------------------------------------- 38
AVE FUNCTION ---------------------------------------------------------------------------- 39
BOUT FILE NAME -------------------------------------------------------------------------- 39
OAD FUNCTION ---------------------------------------------------------------------------- 40
ELETE FUNCTION ------------------------------------------------------------------------- 41
RESETTING (INITIALIZATION) ------------------------------------------------------------ 41
19. MEASURING FUNCTION <MEAS> ---------------------------------------------- 42
19.1 C
19.2 A
19.3 O
19.4 E
19.5 M
19.6 F
HANNEL POWER MEASUREMNT <CH POWER> ------------------------------------ 42
DJACENT CHANNEL LEAKAGE POWER MEASUREMENT <ACP> ------------------ 43
CCUPIED BANDWIDTH MEASUREMENT <OBW> ------------------------------------- 45
LECTRIC FIELD STRENGTH MEASUREMENT <E/F ANT> --------------------------- 45
AGNETIC FIELD STRENGTH MEASUREMENT <M/F PROBE> --------------------- 49
REQUENCY COUNTER <FREQ COUNT> --------------------------------------------- 51
20. EMI TEST (2651) ---------------------------------------------------------------------- 51
20.1 A
20.2 EMI
DDITIONAL FUNCTION FOR EMI TEST ------------------------------------------------- 51
TEST ------------------------------------------------------------------------------------ 52
21. SCREEN CONTROL <DSPL> ----------------------------------------------------- 54
21.1 S
21.2 ON/OFF
21.3 A
ETTING SCREEN DISPLAY COLOR ------------------------------------------------------ 55
SWITCHING OF LCD BACKLIGHT --------------------------------------------- 55
DJUSTING BRIGHTNESS OF LCD BACKLIGHT ----------------------------------------- 55
iv
Page 6

22. TRACKING GENERATOR MODE (2652A) ------------------------------------ 55
22.1 S
22.2 D
22.3 ON/OFF
22.4 N
PECIFICATION OF T.G. FUNCTION ------------------------------------------------------ 55
ESCRIPTION OF I/O CONNECTOR------------------------------------------------------- 56
SWITCHING OF T.G. FUNCTION ----------------------------------------------- 56
ORMALIZING FUNCTION ------------------------------------------------------------------ 57
23. STORAGE/PRINT SCREEN IMAGE <COPY> -------------------------------- 58
23.1 S
23.2 P
23.3 S
23.4 T
23.5 USB
23.6 USB
ELECTION OF IMAGE AREA -------------------------------------------------------------- 58
RINT ON PRINTER ------------------------------------------------------------------------- 58
TORAGE INTO USB MEMORY ----------------------------------------------------------- 58
RANSFERRING INTERNAL DATA TO USB MEMORY IN LUMP SUM ----------------- 59
PRINTER (OPTION) ------------------------------------------------------------------- 59
MEMORY ------------------------------------------------------------------------------- 60
24. UTILITY FUNCTION <UTIL> ------------------------------------------------------- 61
24.1 L
24.2 M
24.3 B
24.4 S
ABEL FUNCTION --------------------------------------------------------------------------- 61
ENU OFF ----------------------------------------------------------------------------------- 62
UZZER SETTING --------------------------------------------------------------------------- 62
ETTING THE CLOCK ----------------------------------------------------------------------- 62
25. USB DEVICE FUNCTION ----------------------------------------------------------- 64
25.1 O
25.2 H
25.3 I
25.4 S
25.5 E
25.6 I
25.7 T
25.8 W
UTLINE -------------------------------------------------------------------------------------- 64
OW TO CONNECT ------------------------------------------------------------------------- 64
NSTALLATION OF DRIVER ----------------------------------------------------------------- 64
AMPLE PROGRAM ------------------------------------------------------------------------- 64
XPLANATION OF COMMAND -------------------------------------------------------------- 65
NPUT OF FREQUENCY --------------------------------------------------------------------- 74
RANSFER OF SPECTRUM DATA --------------------------------------------------------- 74
RITING OF ORIGINAL COMPENSATION DATA ----------------------------------------- 75
26. OPTION ---------------------------------------------------------------------------------- 77
27. BASIC PERFORMANCE TEST (2650A/2651/2652A/2658A) ------------ 78
27.1 F
27.2 A
27.3 D
27.4 D
27.5 L
REQUENCY CHARACTERISTICS --------------------------------------------------------- 78
CCURACY OF REFERENCE LEVEL ------------------------------------------------------ 79
ISPLAY ACCURACY OF CENTER FREQUENCY ---------------------------------------- 79
ISPLAY ACCURACY OF FREQUENCY SPAN -------------------------------------------- 80
INEARITY OF AMPLITUDE AXIS ---------------------------------------------------------- 80
v
Page 7

1. Outline
1.1 Product outlines
The 2650A series are authentic spectrum analyzers in a compact and lightweight form factor providing
performance and functions comparable to large-size bench type instruments.
The features are as follows.
1) Compact and lightweigh t 1.8 kg.
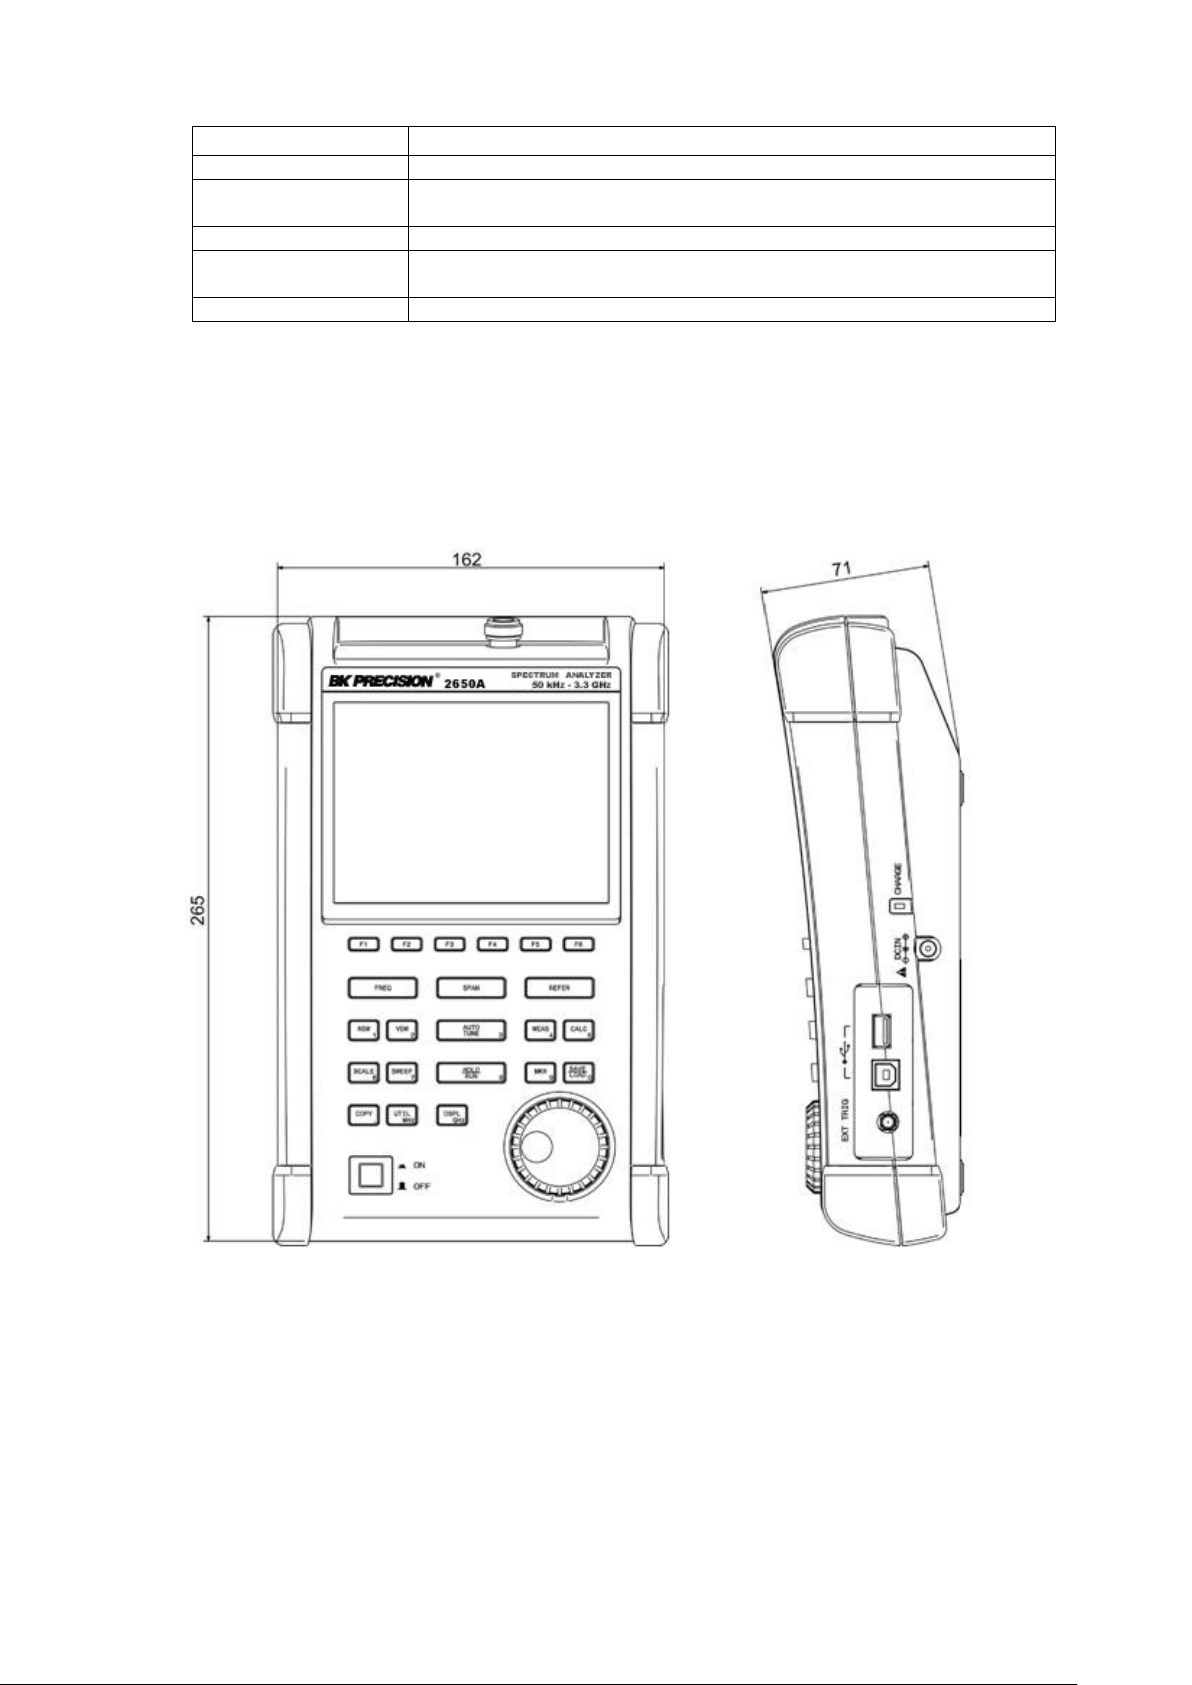
The dimensions are 162(W)×71(H)×265(D) mm, and the weight is only 1.8 kg including the battery, making the
instrument very conven ient f or field use.
2) Large color TFT display
5.7 inches, 640×480 color LCD
3) Four hours battery operation
The included Lithium-ion battery, when fully charged, can provide power for up to four hours of operation with the
backlight turned off. And about 3 ½ hours with the backlight set to the minimum level.
4) USB host ada pter
USB host port can be used with removable storage USB flash drives. The screen image is stored as BMP format, and
the spectrum and the setting parameters are stored as CSV format. The port conforms to USB 1.1 standa rds and is
backwards compatible with USB 2.0 devices.
5) USB device f or PC connectivity
USB interface with tran sfer rates up to 12 Mbps maximum (conform to USB 1.1 standards).
6) Accurate frequency measurement by PLL synthesizer
The center frequency is accurately set by PLL (Phase Locked Loop) synthesizer. Moreover, the frequency counter
(factory option) enables more accurate measurements of the frequency of a signal.
7) Average noise level -127 dBm
The low average noise level of -127 dBm @ 1 GHz provides a wide dynamic range.
8) 100 dB di splay dynamic range
Wide dy namic range display with a display scale of 100 dB/10div (at 10 dB/div) in the amplitude axis.
9) Easy operation with AUTO mode
● Auto range operation: RBW, VBW and sweep time are automatically selected based on the frequency span.
● Auto tuning operation: The center frequency is adjusted to the maximum level within full span, and the optimum
RBW, VBW and sweep time are chosen.
1
Page 8

10) Abundant functions
● Measuring functions : Channel power, Adjacent channel power, Occupied bandwidth, Electric field
strength, Magnetic field strength and Frequency measurement.
● Calculation functions : Max hold, Min hold, Averaging, Over write
● Marker measurement and peak search function
● Save/Load function
● H ard copy with printer
11) PC Software
The included PC software controls all four models of the 2650A/2651 series via PC. The software emulates the front panel keys
and supports transfer of 1001 point trace data from the analyzer to the PC. Screen images can be stored in BMP format and the
spectrum data in CSV format (stores frequency and level).
12) Options
There are many options available, such as dipole antennas, magnetic field probes and USB printer
1.2 Standard accessories
1. AC adaptor MA400
2. Carrying case LC2650A
3. Accessory pouch
4. User manual
5. PC software and USB cable
6. Lithium Ion battery MB400
1.3 Optional accessories
1. Dipole antennas M401, M402, M403, M404, M405, M406
2. Magnetic field probe PR 26M with a dedicated double shielded coaxial cable
3. Printer PT2650A with AC adaptor, 4pcs of AA batteries, one roll paper
4. Roll paper PX2650A for PT2650A printer (with 10 rolls)
2
Page 9

1.4 Overview of all four mo dels
Model
Contents
50 kHz to 3.3 GHz
50 kHz to 8.5 GHz
station
50 kHz to 3.3 GHz
return loss measurement
50 kHz to 3.3 GHz
2650A
2658A
2652A
2651
Applications: Cellular phone, 2.4 GHz wireless LAN, 2.5 GHz WiMAX, RF-ID,
Broadcasting
Covering most of the wireless communication frequency spectrum
Applications: 5 GHz wireless LAN, 3.5/5.8 GHz WiMAX, Maintenance of wireless base
With 5 MHz to 3.3 GHz tracking generator
Applications: Frequency characteristics measurement of electronic component/circuit and
For EMI te st
Applications: Radiated and conducted emission measurement
3
Page 10
2. Specifications
Frequency range
50 kHz t o 3.3 GHz
50 kHz t o 8.5 GHz
Frequency
range
Frequency
band
Harmonic
order
50 k to 3.5
Base band
1
3.3 G to 6.3
GHz
Band 1-
1
6.1 G to 8.5
GHz
Band 1+
1
Center frequency
Setting
20 kHz
Accuracy
within ± (30+20T) kHz±1 dot
within ±(30+20T) kHz ± 1 dot
RBW
within ±4 kHz @ 3 kHz, 10 kHz, 30 kHz
Frequency span
Setting range
0 Hz (zero span),
0 Hz (zero span),
Accuracy
within ±3% ±1dot
Display resolution
501dots on LCD scree n, 1001dots rea dout via PC
Resolution bandwidth
3 dB bandwidth (6 dB for 2651 @ 9 kHz, 120 kHz)
Setting range
3 kHz to 3 MHz (1-3 step) and AUTO
Accuracy
±20%
Selectivity
1:12 (typical, 3 dB : 60 dB)
Video bandwidth
100 Hz to 1 MHz (1-3 step) and AUTO
SSB phase noise
-90 dBc/Hz (typical)
Spurious response
less than -60 dBc
Harmonics
2.1 Performance
Frequency section
2650A, 2652A, 2651 2658A
resolution
frequency
error
―――
Allows rotary encoder, num eric key and functi on key
@frequency span: 200 kHz to 10 MHz,
RBW 3 k Hz, 23±5°C
within ± (60+300T) kHz±1dot
@frequency span: 20 MHz to 3.3 GHz,
RBW 100 kHz、23±5°C
T: sweep time (s)
within 20% of RBW @ R BW: 100 kHz, 300 kHz
within 10% of RBW @ RBW: 1 MHz, 3 MHz
200 kHz to 2 GHz (1-2-5 step) and
3.3 GHz (full span)
@ sw eep time of 0.3s, 23±5 °C
GHz
@frequency span: 200 kHz to 10 MHz,
RBW 3 k Hz, 23±5°C
within ± (60+300T) kHz±1dot
@frequency span: 20 MHz to 8.5 GHz,
RBW 100 k Hz, 23±5°C
T: sweep time (s)
200 kHz to 5 GHz (1-2-5 step) and
8.5 GHz (full span)
# of points per trace
(501 dots are visible on the display, 1001 dots of trace data a re captured interna lly and can be
transferred to a PC via USB device interface.)
(2651: 3 kHz, 9 kHz , 30 kHz, 120 kHz, 300 kHz, 1 MHz, 3 MHz)
@100 kHz offset, RBW : 3 kHz, VBW : 100 Hz, sweep time: 1 s
less than -40 dBc @ ≧100 MHz
4
Page 11

2650A, 2652A, 2651
2658A
Reference level
Setting range
+10 to -60 dBm (1dB step)
Accuracy
within ± 0.8 dB ± 1 dot
@ center frequency : 100 MHz, RBW : 3 MHz, VBW : 1 MHz, REF : -15 dBm, 23±5 °C
Unit
dBm, dBV, dBmV, dBμV, dBμV/m, dBμA/m
Average noise level
-127 dBm (typical) @ CF : 1 GHz, RBW : 3 kHz, VBW : 100 Hz, Ref. level < - 40dBm ( preamp
automatically ON)
Frequency
within ±2.0 dB ±1dot @50 kHz to 100 MHz
within ±2.0 dB ±1dot @50 kHz to 100 MHz
Input impedance
50 Ω
Input VSWR
less than 2.0
Input attenuator
Operating
0 to 25 dB (1 dB step), coupled with reference level
Switching
±0.6 dB @100 MHz
RBW switching e rror
±0.6 dB
Display resolution
(vertical)
381 dots/10div
Scale
10 dB/div, 5 dB/div, 2 dB/div
Accuracy
±(0.2 dB+1dot)/2 dB ±(0.4 dB+1dot)/5 dB
±(0.8 dB+1dot)/10 dB ±(1.8 dB+1dot)/83 dB
+27 dBm (CW average power), 25 VDC
2650A, 2652A, 2651
2658A
Sweep time
Setting range
10 ms to 30 s and AUTO
10 ms to 30 s and AUTO
Accuracy
Within ±0.1 %±1dot
@frequency span : 0 to 2GH z
Within ±0.1 %±1dot
@frequency span : 0 to 5GH z
within ±1.5 %±1dot @ full span
within ±2.5 %±1dot @ full span
Trigger
Trigger mode
AUTO (Available only for zero span)
Trigger source
Internal and External
Amplitude section
(dBμV/m and dBμA/m are used for measurement functions)
characteristics
range
error
Display
scale
Input damage level
within ±1.0 dB ±1dot @ 100 MHz to 3.3 GHz
within ±1.0 dB ±1dot @100 MHz to 8.5 GHz
Sweep section
@frequency span : 0 to 2 GHz
30 ms to 30 s and AUTO
@frequency span : full span
1-3 step
5
@frequency span : 0 to 2 GHz
30 ms to 30 s and AUTO
@frequency span : 5 GHz, full span
1-3 step
Page 12

External trigger
Input voltage range
Detection mode
Positive peak, Negative peak, Sample
2650A, 2652A, 2658A, 2651 common
Marker measurement
DELTA:displays frequency diff erence and level difference between two markers.
Peak search function
Searches for peak level with all of 10 div (NORM mode) or within ZONE specified
NORM mode.
Calculation function
NORM, MAX HOLD, MIN HOLD, AVERAGE, OVER WRITE
Measuring function
Channel power, Adjacent channel power, Occupied bandwidth, Electric field strength
Auto tuning
When pressing AUTO TUNE key, the spectrum of maximum level within full span is
Save
Saves 200 spectrums and 200 s etting parameters
Load
Loads one spectrum and one setting parameter
2650A, 2652A, 2658A, 2651 common
Input connector
N(J) connector
USB Communication
Protocol
USB version 1.1 (will als o work with USB 2.0 de vices)
Device Connector
B plug
Transfer rate
12 Mbps
Hard copy
USB printer (option) conn ected to A plug (host) enables hard copy of screen.
host connector
A plug
Display
Display
5.7 inches and color LCD
Backlight
LED backlight
Number of dots
640(H) x 480(V) dots
Power supply
Dedicated
Input : 100 to 240 VAC
Lithium-ion battery
MB400 : 7.4 V/5000 mAh Li-Ion battery
Frequency range
Input coupling
Trigger level
Input RC
Input damage level
Input connector
1 to 10 Vp-p
DC to 5 MHz
DC coupling
approx. 0.56 V(fix)
approx. 10 kΩ / less than 15 pF
±50 V(DC+AC peak)
SMA(J)
( QP and AV for model 2651 only.)
Function
NORM:displays frequency (8digits max) and level (4digits max) at marker point.
Save/
Load
(ZONE mode) and displays frequency and level at pe ak level, and moreove r NEXT peak at
Number of sweeps is 2 to 1024 ( power of 2 ) and inf inite.
(needs optional dipole antenna), Magnetic field strength (needs optional magnetic field
probe) and Frequency count er
adjusted to center, and reference level, RBW, VBW and sweep time are set to optimum
parameters.
General
AC adaptor
Charge function
Remainder indication
Output : 9 VDC/2.6 A
Capable of charging during power-off.
Indicates 4 conditions w ith two colors LED (red and green).
5 level indicator
6
Page 13
Other
2650A, 2652A, 2658A, 2651 common
Operating temperature
0 to 50° C (guaranteed at 23±10 °C, without soft carrying case)
Operating humidity
less than 40 °C/80 %RH
Storage temperature
-20 to 60 °C, less than 60 °C/70 %RH
Dimensions
162(W) x 71(H) x 265(D) mm , 6.38 (W) x 2.80 (H) x 10.43 (D) inch
(excluding projections, protection bum per and stand)
Weight
approx. 1.8 kg or 4 l bs (including battery)
(guaranteed at less than 33 °C/70 % RH, without soft carrying case)
* Refer to section 22) Tracking Generator Mode for the s pecification s of the tr acking gen erator , model 2652A.
2.2 External view
[Unit : mm]
* B&K Precision reserves the right to make changes in design, specification and other information without prior notice.
7
Page 14

3. Explanation of Panel
1) TFT display
This is a large liquid crystal display with 640 (H) x 480 (V) dots. It simultaneously displays spectrum (10div x
10 div), various setting parameters and measured values.
2) Function key (F1 to F 6)
The function can change according to the operation key.
3) Center frequency key
8
Page 15

The center frequency is set with this key. The setting range is 0 to 3.3 GHz (for 2650A, 2652A, and 2651), and
0 to 8.5 GHz (for 2658A). The setting resolution is 20 kHz.
4) Frequency span key
The frequency span is set with this key.
For 2650A, 2652A, and 2651, it is set in the range from 200 kHz to 2 GHz, ZERO SPAN or FULL SPAN (3.3
GHz). For 2658A, it is set in the range from 200 kHz to 5 GHz, ZER O SPAN or FULL SPAN (8.5 GHz).
5) Reference level key
The reference level is set with this key. It can be set in the range from +10 dBm to –60 dBm by 1 dB step.
6) R esolution bandwid th key
The resolution bandwidth is set with this key. It can be set in the range from 3 kHz to 3 MHz and to AUTO.
7) Video bandwidth key
The video bandwidth is set with this key. It can be set in the range from 100 Hz to 1 MHz and to AUTO.
8) AUTO tuning key
When pushing this key, the spectrum with the maximum level is searched within full span (3.3 GHz @
2650A/2652A/2651 and 8.5 GHz @ 2658A), and then it is adjusted to the center of the screen, and the
optimum setting parameters are set. In the case when in zero span, full span, input signal level lower than –40
dBm and input frequency lower than 50 MHz, this function will not work correctly.
9) M easuring function key
Available for Channel power, Adjacent channel leakage power, Occupied frequency bandwidth, Electric field
strength, and Magnetic field strength measurement.
10) Calculation function key
Available for Max hold, Min hold, Average and Over write.
11) Display scale key
The display scale of amplitude axis can be selected as 2 dB/div, 5 dB/div or 10 dB/div with this key.
12) Sweep key
The sweep time can be set in the range from 10 ms to 30 s or AUTO. This key can also select the detection
mode.
13) Hold/Run key
Used to hold or run measurements.
9
Page 16

14) Marker & Peak search key
This key is used for setting marker or peak search.
15) Save/Load key
Used for saving or loading a spectrum or settings parameters.
16) Copy key
This key allows the screen image to be printed on USB printer (option) or stored in USB memory.
17) UTIL key
Used for setting label entry, clock, and buzzer.
18) Display control key
Used for setting color, backlight ON/OFF or brightness of backlight.
19) Rotary encoder
This is used for adjusting settings and parameters.
20) Power switch
This is for power ON or OFF.
21) Input connector
N(J) connector
22) Indicator for charg ing condition
Two color LED indicates the charging conditions of battery.
23) Input connector for DC power source
Connect AC adapt or MA400.
24) USB A plug
For connecting USB printer (option) or USB memory.
25) USB B plug
For interfacing with a PC
10
Page 17
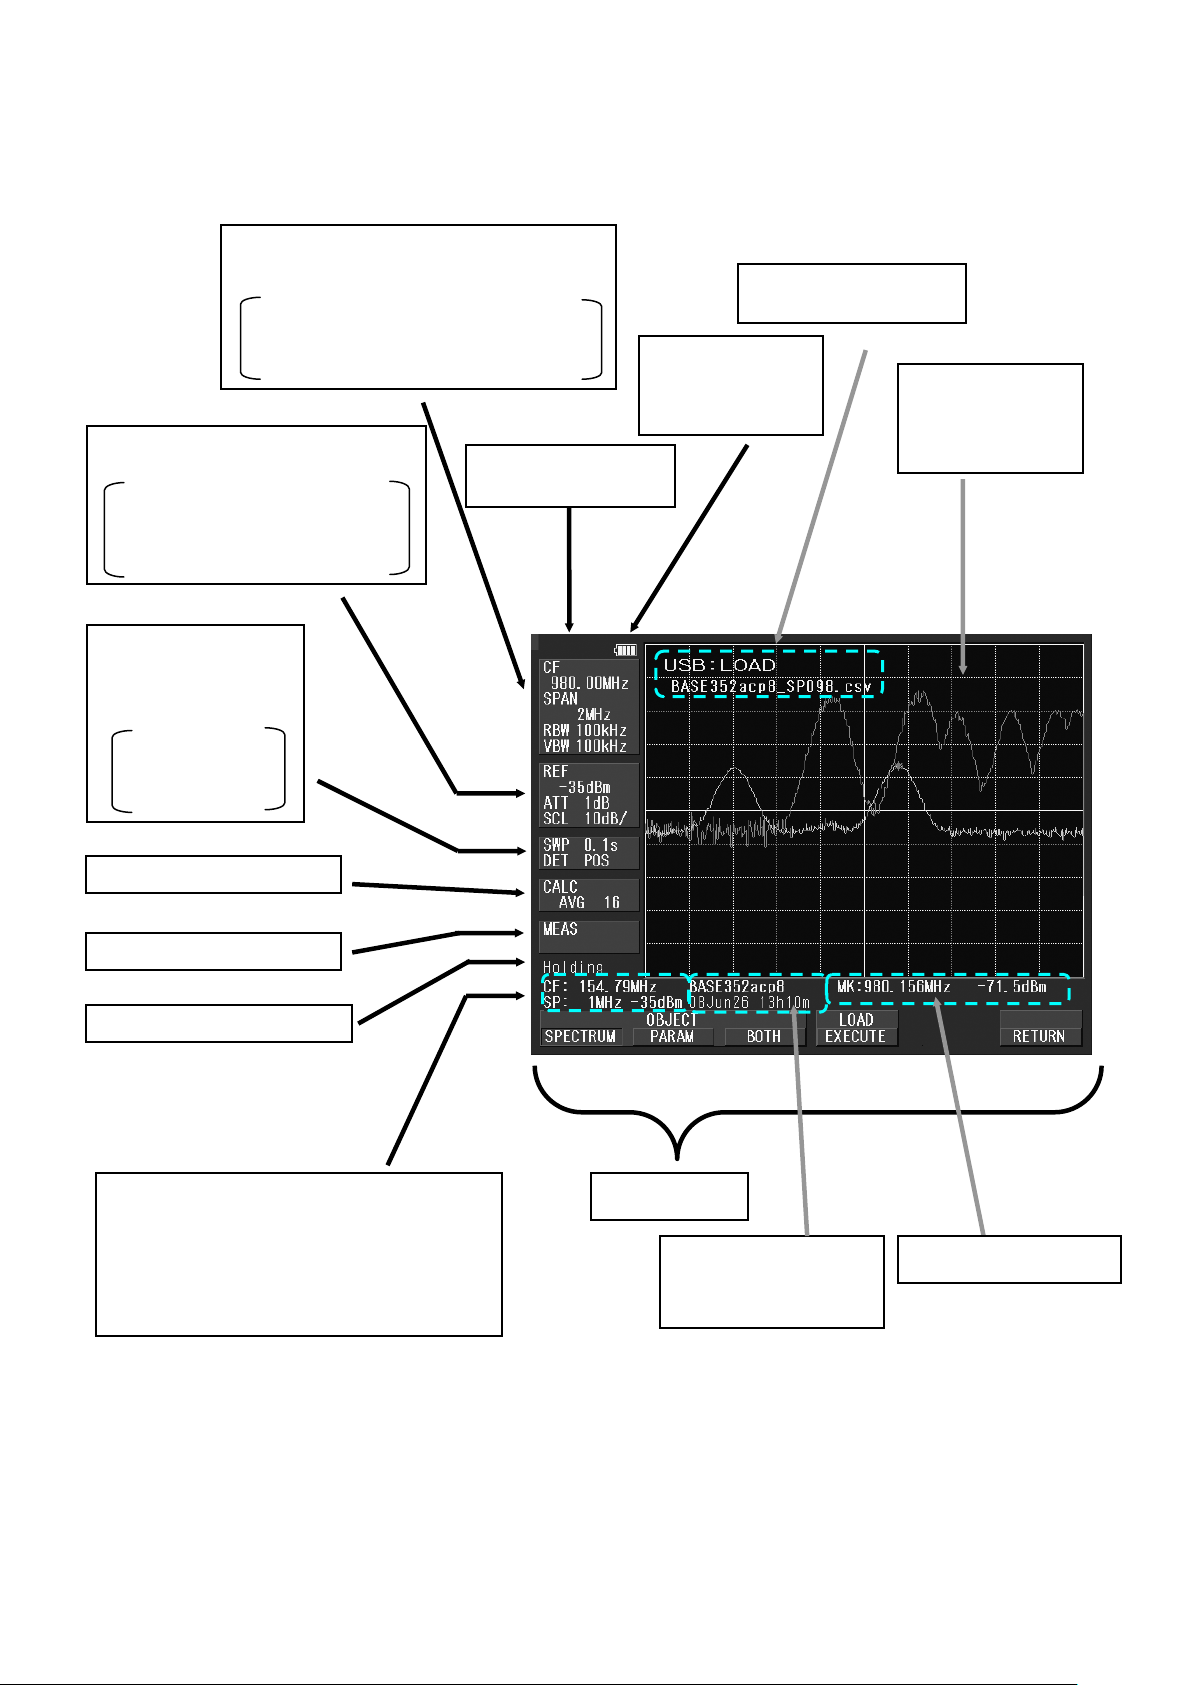
4. Explanation of Screen
Center frequency, Frequency span,
Resolution bandwidth, Video bandwidth
cases, slowing down the sweep rate will change this indicator.
Frequency Axis Setting Values Display
Remaining Battery
Active Area Display
Amplitude Axis Se tting Values Display
Reference level, Input attenuator,
Display scale
Sweep Axis Setting
Values Display
Sweep time,
Detection mode
Calculation function display
Measuring function display
**UNCAL Display
UNCAL
Display
Spectrum Display
10div x 10 div
Operating Information display
Loaded spectrum information display
* This is also used as a display for set values
when the measuring function is used.
**UNCAL is displayed when a normal measurement cannot be done due to sweep rate being too fast. In such
Function Menu
Lower: Clock Display
11
Upper: Label Display
Measured Values display
Page 18

5. Function Menu
Function menu
Key Sequence
Page
A
ACP
MEAS → F2
41
ACP WIDTH
MEAS → (F2) → F3
42
ANT
MEAS → (F4)→ F1
44
AVG
CALC → F4
32
B
BACK LT
DSPL → F2
53
BACK SPACE
FREQ → F6 → F5
21
BAND CNTR
MEAS → (F1) → (F1)
41
BAND WIDTH
MEAS → (F1) → (F1)
41
BUZZER
UTIL → F3
59
C
CENTER FREQ ←
FREQ → F1
20
CENTER FREQ →
FREQ → F2
20
CLEAR
FREQ → F6 → F4
21
CLOCK CONFIG
UTIL → F4
59
CONV
MKR → F6
33
D
DELETE
SAVE/LOAD → F3
36
DEVICE MEM
SAVE/LOAD → F4
36
DET
SWEEP → F4
29
DISP CLEAR
SAVE/LOAD → F2 →
38
E
E/F ANT
MEAS → F4
43
EncST
FREQ → F4
20
EMI-R **1
SAVE/LOAD → F6 →
50
F
FREQ COUNT
MEAS → F6
49
I
IMP
REFER → F6
25
K
KeyST
FREQ → F3
20
L
LABEL
UTIL → F1
58
LOAD
SAVE/LOAD → F2
38
M
M/F PROBE
MEAS → F5
47
MAX HLD
CALC → F2
31
MEAS OFF
MEAS → (F1~5) → F6
41
MIN HLD
CALC → F3
31
MARKER
MKR → F1
33
Function menu
Key Sequence
Page
M
MODE
MEAS → (F1 → F3)
41 to 43
N
NEXT PEAK
MKR → (F4) → F2
34
NORMAL
CALC → F1
31
NORMAL **1
SAVE/LOAD → F6 →
50
O
OBW
MEAS → F3
42
OFSdB
REFER → F5
24
OFS STEP
REFER → F3
24
P
PEAK SERCH
MKR → F4
34
PEAK SERCH
MKR → F5
34
PROBE
MEAS → (F5) → F1
48
R
RATIO
MEAS → (F3) → F2
43
RBW ALL AUTO
RBW → F3
28
RBW AUTO
RBW → F2
28
RBW MANUAL
RBW → F1
27
REFERENCE
MEAS → (F2) → F1→
42
S
SAVE
SAVE/LOAD → F1
36
SCALE 5dB
SCALE → F3
27
SPR. FR **2
CALC → F6
32
SWEEP AUTO
SWEEP → F2
29
SWEEP MANUAL
SWEEP → F1
29
T
T.G. MODE **3
SWEEP → F6
55
TRIG
SWEEP → F5
30
U
V
VBW ALL AUTO
VBW → F3
29
VBW AUTO
VBW → F2
28
VBW MANUAL
VBW → F1
28
Z
ZONE CENTER
MKR → (F5) → F1
35
5.1 List of Functi on Menu
The function menu is shown in the table below. For descriptions of each function, see their respective page. For the
sequence of selection for the function menu, refer to “5.2 Menu tree”.
ACP OFFSET MEAS → (F2)→ F2 42
→ F1
F1
→ F2
→ F3
BRIGHT DSPL → F3 53
CH POWER MEAS → F1 41
COLOR DSPL → F1 53
F5
EMI-C **1 SAVE/LOAD → F6 →
F2
F3
50
OVR WR CALC → F5 32
PEAK SEACH MKR → (F5)→ F1 34
NORM
ZONE
PRE SET SAVE/LOAD → F6 36
REFERENCE
CENTER
WIDTH
SET MKR FREQ → F5 20
MEAS → (F2) → F4 42
F5
MARKER DELTA MKR → F2 33
NORMAL
Ten Key MODE FREQ → F6 20
UNIT REFER → F1 → 4 24
ZONE WIDTH MKR → (F5) → F2 35
**1 2651 only **2 2658A only **3 2652A only
12
Page 19
5.2 Menu Tree
SPAN
50 MHz
* Refer to “9. Reference Level” for details.
CH POWER
OBW
CENTER FREQ
100 MHz
MHz
CLEAR
SPACE
RETURN
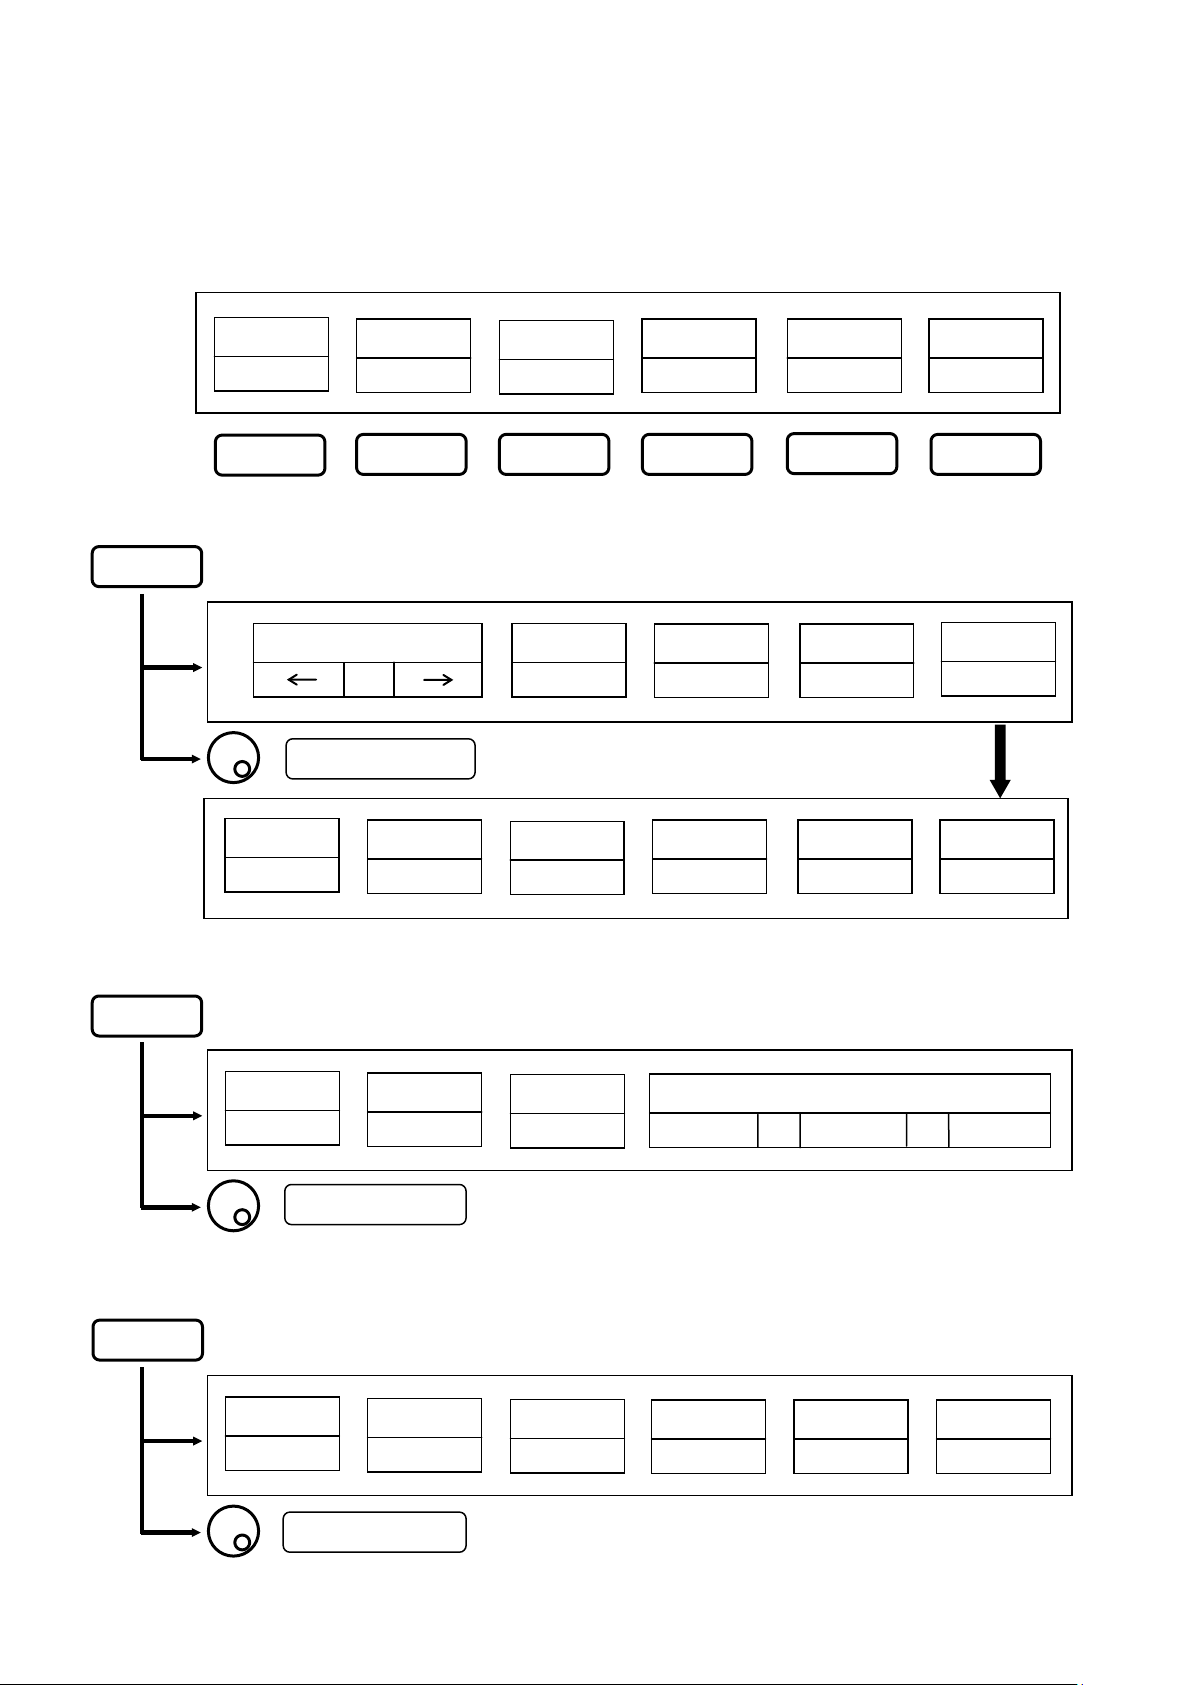
The following is the sequence of selection for the function menu. The function menu corresponds to the function key
of F1 to F6.
“Function menu”
FREQ
ACP
F1
F2 F3 F4
* Refer to “7. Center Fre quency” for details.
: Set the center frequency
GHz
KeyStep
“.”
E/F
ANT
EncStep
10 MHz
M/F
PROBE
F5
SET
MKR
BACK
FREQ
COUNT
F6
Ten Key
MODE
SPAN
REFER
* Refer to “8. Frequency S pan” for details.
NORMAL
SPAN
FULL
: Set the frequency span
UNIT
dBm
RL STEP
1dB
: Set the reference level
ZERO
SPAN
OFS STEP
1dB
1 GHz
OFFSET
OFF
SPAN
OFS dB
0dB
1 MHz
IMP
50Ω
13
Page 20
* T.G. MODE is only for 2658A.
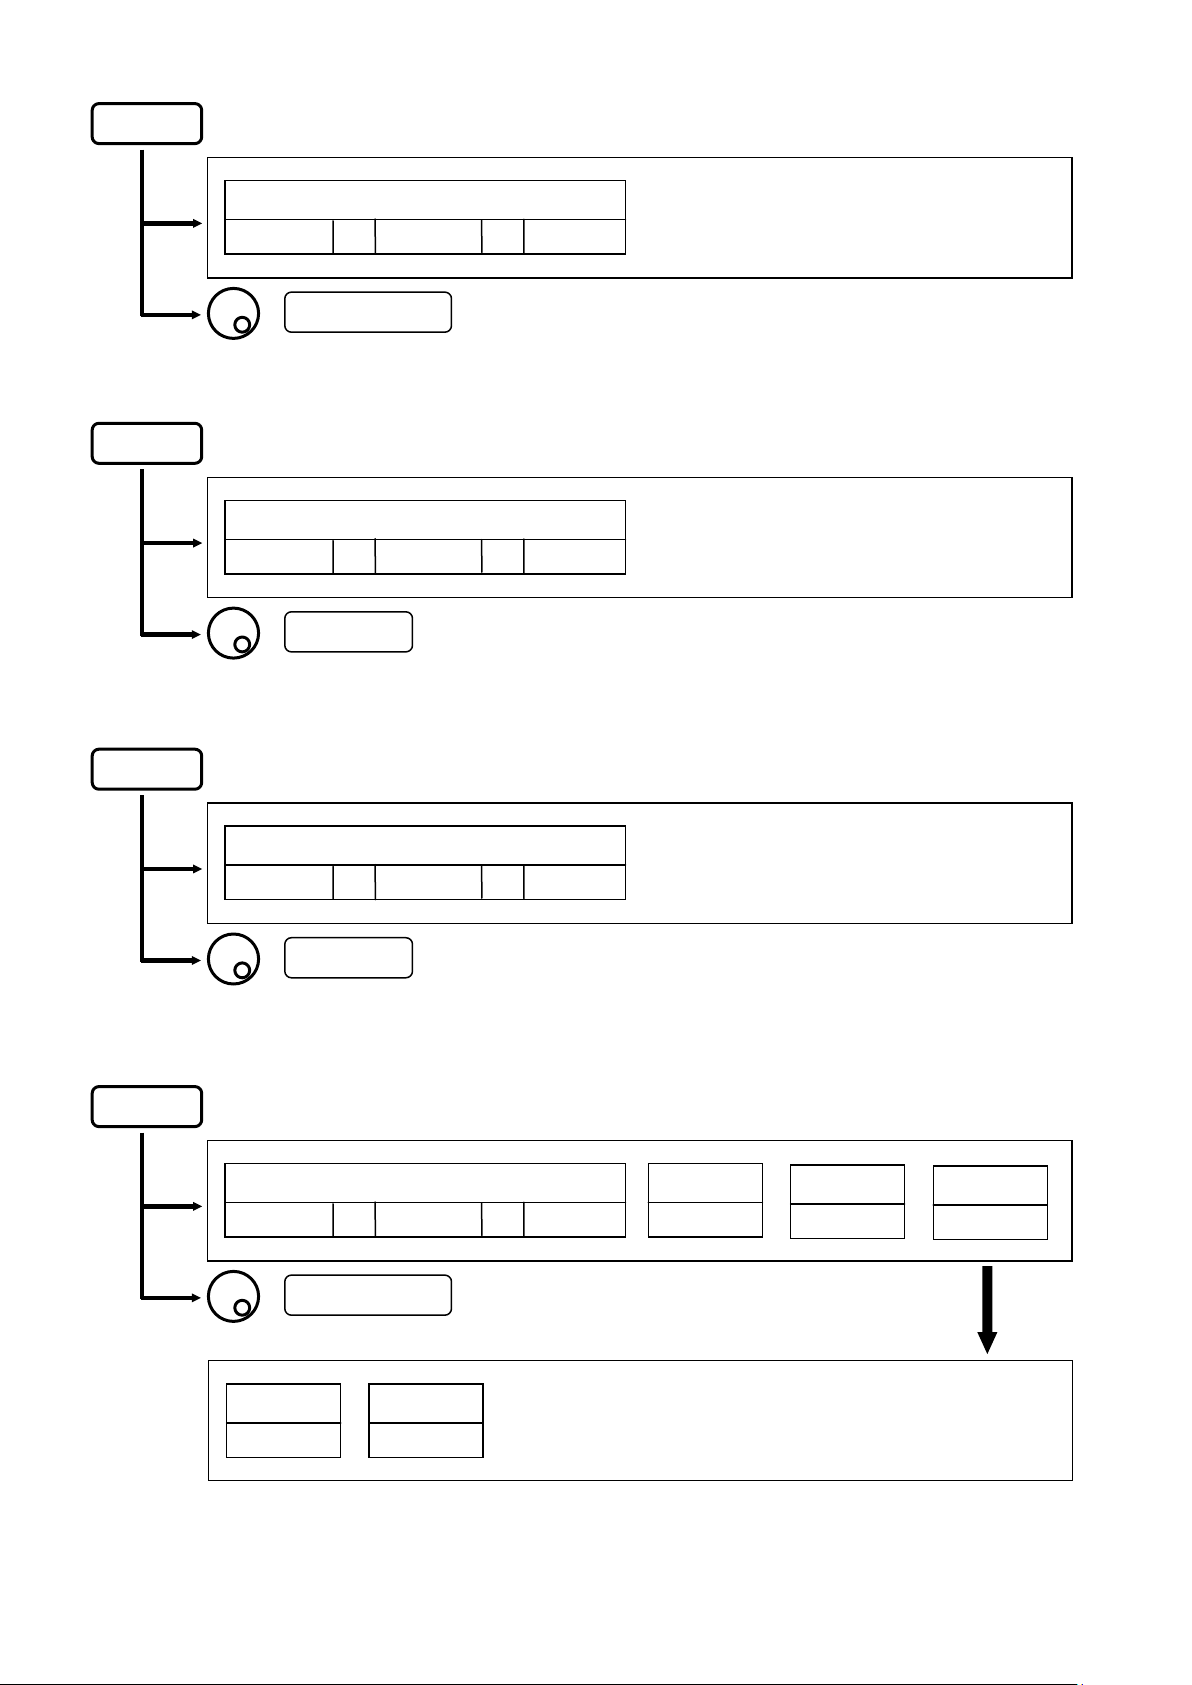
* Refer to “13. Sweep Axis / Detection Mode” for details.
AUTO
* Refer to “12. Video Bandwidth” for details.
* Refer to “11. Resolution B andwidth” for details.
* Refer to “10. Dis play scale” for details.
SCALE
SCALE
RBW
VBW
: Set the display scale
MANUAL
: Set the RBW
5dB/ 10dB/
RBW
AUTO
2dB/
ALL AUTO
SWEEP
MANUAL
: Set the VBW
MANUAL
: Set the sweep time
T.G.
VBW
AUTO
SWEEP TIME
NORM
ALL AUTO
ALL AUTO
DET
SMPL
TRG
INT
T.G.
MODE
ON
ON
14
Page 21
* Refer to “16. Calculation Fu nction” for details.
CALC
* Refer to “17. Marker & Peak Search” for details.
* “SPR. FR” is only for 2658A.
NORMAL
MAX HLD
256
MIN HLD
256
AVG
256
OVR WR
256
SPR. FR
OFF
: Set the number
MKR
MARKER
DELTA NORMAL OFF
: Move the marker (NORM mode)
PEAK
NEXT
PEAK SEARCH
NORMAL
F4: Peak Search
ZONE
CONV
dBm → W
SEARCH
PEAK
RETURN
: Move the marker (NORM mode)
F5: Zone marker
CENTER
ZONE
WIDTH
RETURN
: Set the zone center frequency (ZONE mode)
15
Page 22

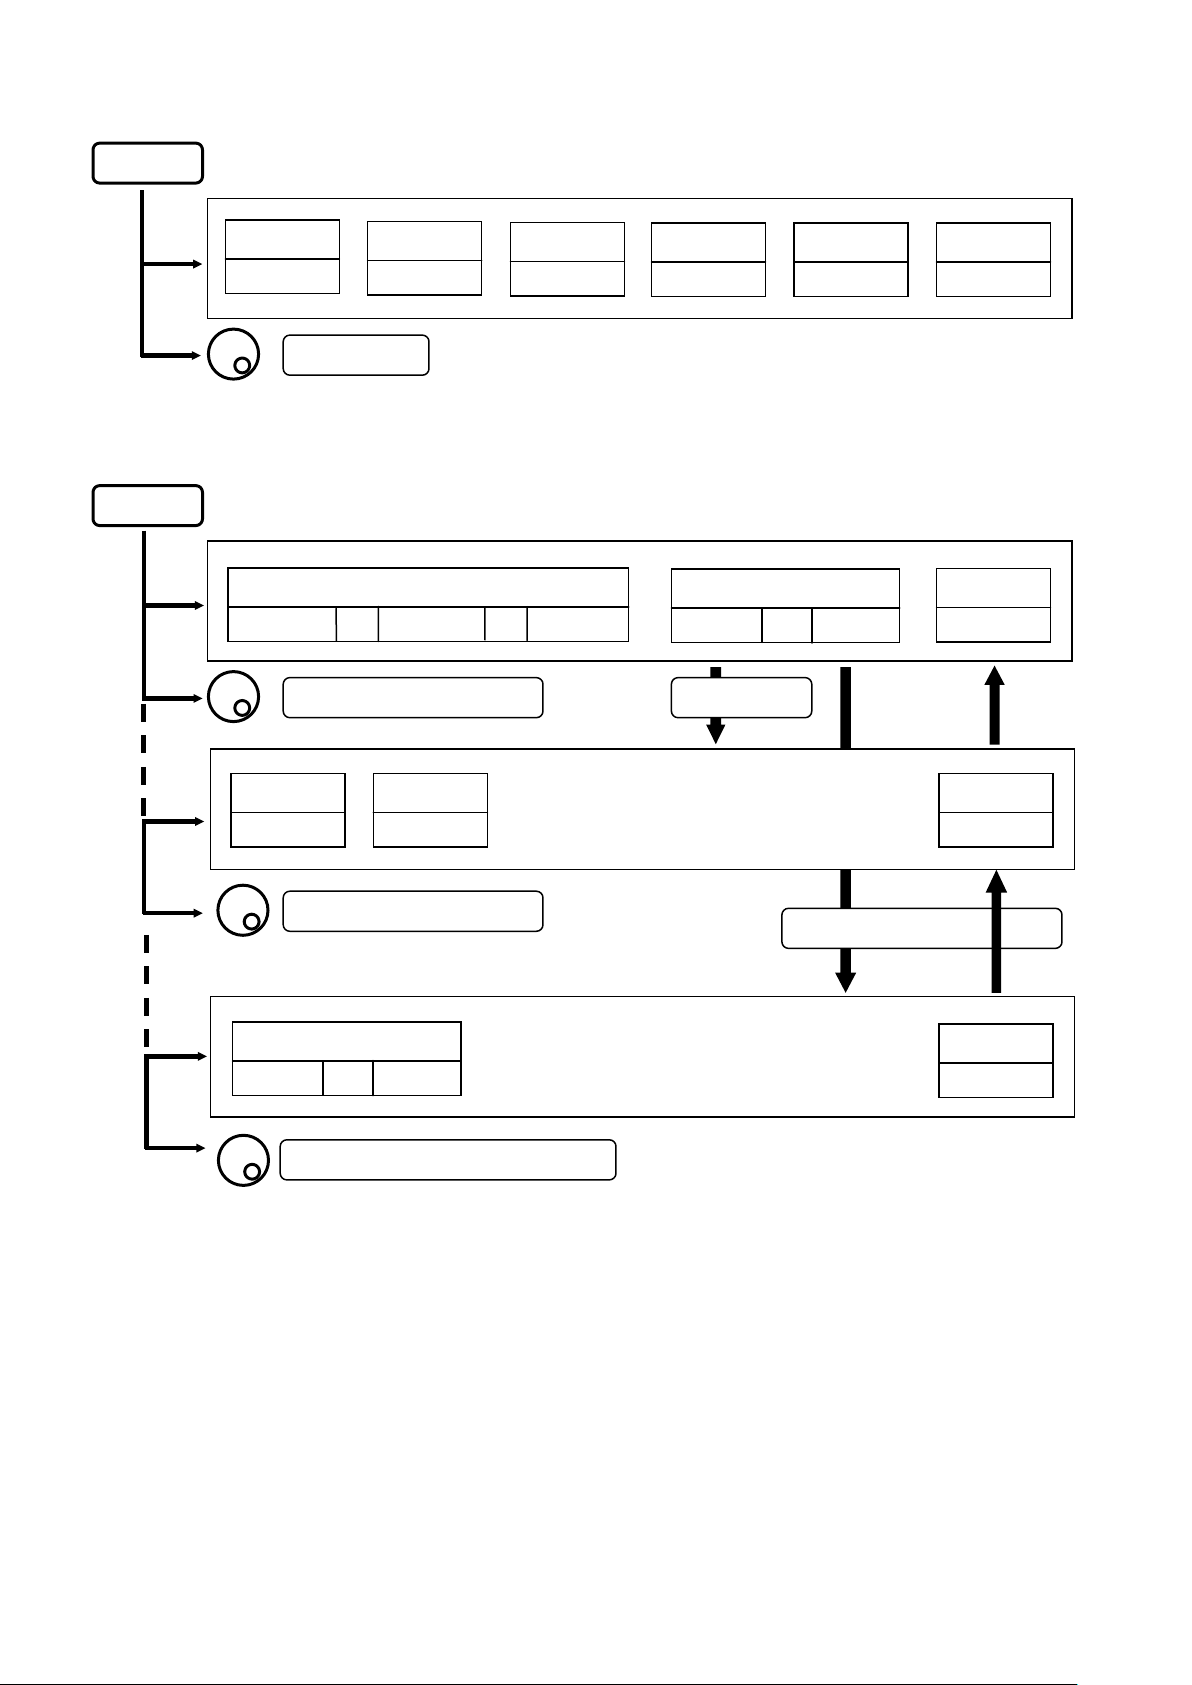
* Refer to “18. Save / Load” for details.
SAVE/LOAD
SPECT
Save menu
Load menu
1
Delete menu
Main menu
NORMAL
EMI - C
Preset menu for 2 651
SAVE
MODE SELECT
LOAD
DELETE
MEM
DEVICE
USB
PRE
SET
OBJECT
PARAM
BOTH
SAVE
EXECUTE
RETURN
: Set the address to store the spectrum or the parameter
File Search Step
10
100
LOAD
EXECUTE
DISP
CLEAR
RETURN
: Set the address to call the spectrum or the parameter
File Search Step
1 100
10
DELETE
EXECUTE
RETURN
: Set the address to eliminate the trace or parameter
For 2651
PRESET
EMI - R
16
Page 23

MEAS
WIDTH
* Refer to “19. Measuri ng Func tion” for details
CH POWER
MODE
BAND
MODE
BAND
ACP
OBW
: Set the parameter
BAND
CENTER
: Set the parameter
ADJ CH
OFFSET WIDTH
E/F
ANT
REFERENCE
CENTER WIDTH
M/F
PROBE
Freq
COUNT
MEAS
OFF
MEAS
OFF
: Set the parameter
MODE
N%
ANT
M401
PROBE
CP-2S
RATIO %
99.5%
Enc Step
1%
Input the probe ID (first time only) *Refer to “19.5 Magnetic field strength measurement” for details.
MEAS
OFF
MEAS
OFF
MEAS
OFF
17
Page 24

OFF
JUN
←
→
* Refer to “21. Screen Control” for details
DSPL
ON
COPY
UTIL
COLOR
COLOR1
BACK LT
BRIGHT
80
* Refer to “23. Storage/Print Screen Image” for details
AREA
WHOLE
PRINT
EXECUTE
Bmp->USB
COPY
* Refer to “24. Utility Function” for details
LABEL
MENU
BUZZER
MEM->USB
EXECUTE
CLOCK
012
: Select the character
YEAR
08
: Select the numeric value
abc
MONTH
ALARM
ABC
DATE
30
CONFIG
@%*
HOUR
23
BACK SP
MIN
50
ENTER
ENTER
18
Page 25

6. Preparing for Operation
Battery full charge time: approx. 4 hours
Please make sure to connect to ground.
6.1 Stand
Utilize the stand on the back to use the screen in an easier-to-see angle on the desk.
6.2 Connection to power supply
The AC adapter MA400 is used to power the instrument and for charg ing the MB400 battery. (Charging starts
automatically if the A C adapter is c onnected and unit is power-off.) Connect the adapter as in the figure below and
connect t he AC plug t o the power line (100-240 VAC, 50/60 Hz). For static electricity protection, ground the unit
by connecting the three cores if possible. Not grounding the unit can damage the unit and/or device being
measured. Do not use an AC adapter other than the MA400 supplied with the unit. Using an AC adapter other
than the MA400 may cause damage to the unit.
Battery operating time: 4 hours maximum
(with backlight set to minimum)
*Tested at normal temperature with initial setting
parameters.
The battery indicator is divided into five levels and is displayed on the screen. When the mark of the battery
remainder displays , the buzzer will sound even if buzzer is OFF under settings, and the power will turn off
within a few minutes. Ensure to protect any data or measurements promptly by saving into memory to prevent
data lost if the unit shuts down.
Connect to 100 to 240 VAC, 50/60 Hz
19
Page 26

6.3 Battery Charge
On Charge
Red
Completion of Charge
Green
Remove the battery when unit is connected to the AC adaptor.
No battery
Green Abnormal
Blinking Re d
Fig. 1
Fig. 2
Fig. 3
* Please exchange the battery for a new one (MB400) when operating time extremely shortens.
When the unit is powered off and c onnected to AC adaptor MA400, the battery will be charged. The charging
conditions are indicated by two c olors LED , and they correspond to the table below.
Charging condition Color of LED Good usage of battery
Otherwise, battery life will be shortened.
※LED is turned off at power-on.
The “abnormal” condition means that the charging time is more than the time expected, or the battery voltage
is too high.
Note: The battery charges only when the unit is turned off (and the AC adapter connected). It is not possible to
charge the batteries while the unit is turned on. Please charge batteries with ambient temperature
in the range of 0 ºC to 40 ºC.
Caution
Misuse of the battery may cause leaks, abnormal heat, fire or explosion.
For safe use, please observe the following precautions fully.
* Do not short-circuit the terminal of the removed battery.
* Do not cause an impacted shock due to throwing, dropping or striking.
* Do not disassemble or remodel the battery.
* Do not throw the battery into a fire or any sources with heat.
* Do not leave the battery in a place with high temperature.
* Do not wet the terminal of the battery.
* Do not cool the battery, and do not charge it in cold outdoor conditions. It decreases performance
and battery life.
* Do not charge the battery in any other way except according to specifications.
* When you ke ep the bat tery, please keep it in a cool, dark environment where humidity is low.
Moreover, please keep it out of reach from children.
If the battery remains not used for a long time, it might decrease its charges.
6.4 Installation of Battery
To install the battery, please turn off the power and unplug the AC adaptor if in use. Remove the battery cover on
the back of the unit by first pressing down with light pressure, then slide towards the direction of the arrow as
shown in Fig.1. Next, put the battery a s shown in Fig.2. Move it in the direction of the arrow shown in Fig.3 unti l it
locks in. Use only the MB400 battery as s pecified. Otherwise, the unit may cause problems or malfunction.
20
Page 27

7. Center Frequency <FREQ>
←
→
* Center frequency setting range: 0 to 3.3 GHz for 2650A/2652A/2651, 0 to 8.5 GHz for 2658A
When is pushed, the following function menu is displayed.
FREQ
CENTER FREQ
F1 F2 F3 F4 F5 F6
KeyStep
100M
* The center frequency may shift for a while (up to 10 sec.), after setting is changed.
7.1 Setting with step keys ( [F1], [F2] )
1. When is pushed, the center frequency decreases in the set step size.
2. When is pushed, the center frequency increases in the set step size.
3. Setting step size:
F1
F2
EncStep
0.1M
SET
MKR
Ten Key
Mode
When is pushed, the step size is changed according to the following.
F3
AUTO 100MHz 10MHz 1MHz 100kHz 20kHz
However, only for 500 kHz frequency span, the step size is set to 50 kHz.
If the frequency span is less than 500 kHz, the step size is set to 20 kHz.
AUTO is recommended for normal use.
AUTO : The step size is 1/10 of the frequency span.
7.2 Setting with encoder
1. By rotating , the center frequency is changed in the set step size.
2. Setting step size:
When is pushed, the step size is changed according to the following.
AUTO 100MHz 10MHz 1MHz 100kHz 20kHz
AUTO : The step size is 1/500 of the frequency span
However, if the frequency span is less than 5 MHz, the step size is set to 20 kHz.
AUTO is recommended for normal use.
F4
21
Page 28

7.3 Setting with numeric key
SPACE
GHz
MHz
1 2 3 4 5
6 7 8
9
0
.
MHz
GHz
1. When is pushed, the following function menu is displayed.
2. , and correspond to <GHz>, <MHz> and <. >
and correspond to <CLEAR> and <BACK SPACE>.
F1 F2 F3
F4 F5
F6
F1 F2 F3 F4 F5 F6
“.”
CLEAR
BACK
RETURN
Changing the center frequency by encoder is available in Ten Key Mode.
3. The center frequency can be entered directly according to “Numeric Key Mapping Diagram” as follows.
“Numeric Key Mapping D iagram”
RBW VBW
SCALE
SWEEP
AUTO
TUNE
HOLD
RUN
COPY UTIL DSPL
4. The center frequency is determined by inputting the unit of frequency.
To enter the unit, and are available.
F1 F2
( and are also available.)
UTIL
DSPL
MEAS CALC
MKR
SAVE
LOAD
* Any figures below the setting resolution (20 kHz) will be truncated.
5. C hange of se tting
The setting can be changed before pushing the unit key.
: The setting values are cleared.
: The last input digit is deleted.
F4
F5
22
Page 29

6. Cancel of Ten Key Mode
1GHz
By pus hing or , unit will return to function menu.
FREQ F6
7.4 According t o Marke r Posit ion
When is pushed, the center frequency is set according to the frequency of current marker position.
* Any figures below the setting resolution (20 kHz) will be truncated.
* When the marker is not displayed, this operation is invalid. (The menu option disappears.)
F5
8. Frequency Span <SPAN>
When is pushed, the following function menu is displayed.
SPAN
NORMAL
SPAN
F1 F2 F3 F4 F5 F6
By opera ting , the frequency span is set.
SPAN
FULL
SPAN
ZERO
SPAN
SPAN
50MHz 1MHz
2650A / 2652A / 2651
By rotating , the frequency span is changed in the specified step size as follows.
ZERO 200k 500k 1M 2M 5M 10M
20M 50M 100M 200M 500M 1G 2G FULL (3.3 GHz)
2658A
1. By rotating , the frequency span is changed in the specified step size as follows.
ZERO 200k 500k 1M 2M 5M 10M 20M
50M 100M 200M 500M 1G 2G 5G FULL (8.5 GHz)
2. By pushing , the frequency span is set to FULL SPAN. Under this condition, the instrument
F2
will return to the former span when the rotary knob is rotated.
3. By pushing , the frequency span is set to ZERO SPAN.
F3
23
Page 30

4. When is pushed and then the setting is FULL or ZERO span, the frequency span is returned to
Two bands
Frequency connection point
3.4 GHz
Band 1- and Band 1+
6.2 GHz
Frequency band
Measured frequency range
Base band
50 kHz to 3.5 GHz
-
3.3 GHz to 6.3 GHz
Band 1+
6.1 GHz to 8.5 GHz
the last setting.
F1
5. By pushing ~ , the frequency span in function menu is set.
F4 F6
8.1 Switching Frequency Band
2658A has three frequency bands.
Band 1
The frequency band is automatically set to the appropriate band based on the center frequency and span.
(At the span less than 200 MHz, only one band is used.)
When the setting frequency range belongs to two ba nds, the lower band has prior ity.
The frequency connection point of two bands is fixed as follows.
Base band and Band 1-
Note: The spectrum may change a little at the frequency connection point.
For accurate measurement, center frequency and span should be set as the measured frequency range in one band.
24
Page 31

9. Reference Level <REFER>
When is pushed, the following function menu is displayed.
REFER
UNIT
dBm
F1 F2 F3 F4 F5 F6
RL STEP
1dB
OFS STEP
1dB
OFFSET
OFF
9.1 Setting of Reference Level
By rotating , the reference level is changed.
(Refer to “9.7 Reference Level Setting Range for Each Unit” for details.)
9.2 Change of Unit of Amplit ude Axis
OFSdB
0.0
IMP
50Ω
When is pushed, the unit is set as f ollows.
F1
dBm dBμV dBmV dBV
9.3 Setting of Step Size of Reference Level
By pushing , the step size is changed to 10 dB or 1 dB.
F2
9.4 On-Off Setting of Offset
By pushing , the offer set ON/OFF is changed.
F4
9.5 Setting of Offset Level
1. By operating , the offset of reference level is set.
When external amplifier or attenuator is used, the display level can be matched by the offset.
F5
The setting range is -50.0 to 50.0 dB.
The reference level is displayed including the offset.
* If the offs et is set, “OFST” is displayed in Amplitude axis setting values display area.
Furthermore, the level at the marker point is displayed including the offset.
25
Page 32

* If the unit is changed to dBμV, dBmV, dBV or dBm, the offset is automatically changed.
Maximum
10
117
57
-3
Minimum
-40
67 7 -53
Minimum
dBμA/m
Setting
M401
M402
M403
M404
M405
M406
CP-2S
Maximum
143
146
149
150
137
159
160 ~ 203
Minimum
93
96
99
100
87
109
110 ~ 153
Minimum
2. By pushing , the step size of offset is changed. (10 dB, 1 dB, 0.1 dB)
F3
9.6 Setting of Input Impedance
By pushing , the input compensation can be set to 50 Ω (no offset) or 75 Ω. (5.6 dB offset
compensation)
The reference level is adjusted automatically, based on the input impedance selection. When the input impedance
is set to 75 Ω, the reference level is displayed including offset and conversion of 75Ω. For the amplitude reading to
be correct, a coaxial 50 Ω /75 Ω impedance conversion adapter must be connected to the RF input.
* When “75 Ω” is selected, values in Amplitude axis setting values display area will change according to
75 Ω, and the offset is set to 5.7 dB (insertion loss of 50 Ω /75 Ω adapter ). Moreover, the offset can be
changed.
When the unit at marker point is set to W, V, V/m or other, it is converted correctly from dBm.
* Be sure to attach a coaxial 50 Ω /75 Ω impedance conversion adapter when selecting “75 Ω”
F6
9.7 Reference Level Setting R ange fo r Each Un it
Unit dBm dBμV dBmV dBV
(shifted spectrum data)
“Available unit in measuring function”
Unit dBμV/m (Electric field strength measurement)
-60 47 -13 -73
(Magnetic field strength
measurement)
(shifted spectrum
data)
* When the reference level is set between “Minimum” and “Minimum (shifted spectrum data)”, the
spectrum of “Minimum” is shifted and displayed on the screen.
73 76 79 80 67 89 90 ~ 133
26
Page 33

* When the reference level is set below “Minimum”, “*S/W AMP” is displayed in Amplitude axis setting
values display area on t he screen.
Calculation for mula (con version from dBm)
● A[dBμV] = 107 + X [dBm] ● B[dBmV] = 47 + X [dBm] ● C[dBV] = -13 + X [dBm]
● D[dBμV/m] = 68.8 / λ×√(X/Gar) [dBm] λ : Wavelength[m] Gar : Antenna absolute gain[times]
● E[dBμA/m] = 107 + X + F[dBm] F : Probe calibration coefficient[dB] **changes depending on the
frequency.
9.8 Relationship Between Reference Level and ATT/AMP (at dBm)
REFER
(dBm)
10 25 0
9 24 0
8 23 0
7 22 0
6 21 0
ATT
(dB)
AMP
(dB)
REFER
(dBm)
-3 12 0
-4 11 0
-5 10 0
-6 9 0
-7 8 0
ATT
(dB)
AMP
(dB)
REFER
(dBm)
-16 20 21
-17 19 21
-18 18 21
-19 17 21
-20 16 21
ATT
(dB)
AMP
(dB)
REFER
(dBm)
-29 7 21
-30 6 21
-31 5 21
-32 4 21
-33 3 21
ATT
(dB)
Internal input attenuator (ATT) and IF amplifier (AMP) are automatically set to the optimum values based on the
reference level (REFER). (The input attenuator cannot be set independently.)
AMP
(dB)
27
Page 34

5 20 0
-8 7 0
-21 15 21
-34 2 21
4 19 0
3 18 0
2 17 0
1 16 0
0 15 0
-1 14 0
-2 13 0
-9 6 0
-10 5 0
-11 4 0
-12 3 0
-13 2 0
-14 1 0
-15 0 0
-22 14 21
-23 13 21
-24 12 21
-25 11 21
-26 10 21
-27 9 21
-28 8 21
-35 1 21
-36 5 26
-37 4 26
-38 3 26
-39 2 26
-40 1 26
* When the input signal level is higher than the proper level for 1st mixer’s terminal, harmonics distortion and
spurious are generated.
This product is designed so that the input signal level of 1st mixer is determined to proper level based on the
reference level.
28
Page 35

10. D isplay Scale <SCALE>
10div/
5div/
2div/
When is pushed, the following function menu is displayed.
SCALE
SCALE
F1 F2 F3 F4 F5 F6
10.1 Setting the Func tion Key
1. By pushing , 10 dB/div display scale is set.
2. By pushing , 5 dB/div display scale is set.
3. By pushing , 2 dB/div display scale is set.
F1
F2
F3
11. Resolution Bandwidth <RBW>
When is pushed, the following function menu is displayed.
By rotating , RBW is set as follows.
RBW
RBW
MANUAL
F1 F2 F3 F4 F5 F6
AUTO ALL AUTO
11.1 MANUAL Mode
By pushing or rotating , MANUAL mode is set.
F1
2650A/2652A/2658A: 3kHz 10kHz 30kHz 100kHz 300kHz 1MHz 3MHz
2651: 3kHz 9kHz 30kHz 120kHz 300kHz 1MHz 3MHz
29
Page 36

11.2 AUTO Mode
By pushing , the optimum RBW is set based on the frequency span and sweep time.
* When AUTO mode is set, “*” is displayed on the right end of RBW setting value display.
F2
11.3 ALL AUTO Mode
By pushing , the optimum RBW, VBW and sweep time are set based on the frequency span.
* When ALL AUTO mode is set, “*” is displayed on the right end of each setting value display.
* When RBW is set to 3 kHz or 10 kHz, the selectivity at 60 dB becomes larger than an actual value due to SSB
phase noise.
F3
12. V ideo Bandwidth <VBW>
When is pushed, the following function menu is displayed.
VBW
VBW
MANUAL
F1 F2 F3 F4 F5 F6
AUTO ALL AUTO
12.1 MANUAL Mode
By pushing or rotating , MANUAL mode is set.
By rotating , VBW is set as follows.
100Hz 300Hz 1kHz 3kHz 10kHz 30kHz
100kHz 300kHz 1MHz
F1
12.2 AUTO Mode
By pushing , the optimum VBW is set based on the frequency span and sweep time.
When AUTO mode is set, “*” is displayed on the right end of VBW setting value display.
F2
30
Page 37

12.3 ALL AUTO Mode
By pushing , the optimum RBW, VBW and sweep time are set based on the frequency span.
F3
* When ALL AUTO mode is set, “*” is displayed on the right end of each setting value display.
13. Sw eep Axis / Detection Mode <SWEEP>
When is pushed, the following function menu is displayed.
* T.G. MODE [F6] is only for 2652A. This menu is not displayed on 2650A, 2651 and 2658A.
For the details, refer to “22. Tracking Generator Mode”. [F5] is only displayed when an external trigger signal is
detected at the trigger port.
SWEEP
SWEEP
MANUAL
F1 F2 F3 F4 F5 F6
AUTO
ALL AUTO
DET
SMPL
TRIG
INT
T.G.
MODE
13.1 MANUAL Mode
By pushing or rotating , MANUAL mode is set.
By rotating , sweep time is set as follows.
10ms 30ms 0.1s 0.3s 1s 3s 10s 30s
* For 2650A, 2651 and 2652A, when the setting is FULLSPAN, it cannot be set to 10 ms.
* For 2658A, when the setting is 5 GHz SPAN or FULLSPAN, it cannot be set to 10 ms.
F1
13.2 AUTO Mode
By pushing , the optimum sweep time is set based on the frequency span and RBW.
* When AUTO mode is set, “*” is displayed on the right end of SWEEP setting value display.
F2
13.3 ALL AUTO Mode
By pushi ng , the optimum RBW, VBW and sweep time are set based on the frequency span.
F3
* When ALL AUTO mode is set, “*” is displayed on the right end of each setting value display.
13.4 Setting of Detection Mode
(For 2651, refer to “20. EMI test”)
31
Page 38

By pushing , the detection mode is set.
POS SMPL NEG
POS (Positive Peak): The maximum value of the sample points is detected.
SMPL (Sample): The momentary value of the sample points is detected.
NEG (Negative Peak): The minimum value of the sample points is detected.
F4
13.5 Setting of Trigger Source
By pushing , the trigger source is set.
INT EXT
INT: The sweep is automatically repeated. This setting is normally used.
EXT: When the signal over the trigger level (0.56 V) is input to external trigger input, the sweep
starts. The sweep automatically starts without an input. (Available only for zero span)
F5
14. AUTO Tuning <AUTO TUNE>
When is pushed, the spectrum with the maximum level is searched within full span, and then
it is adjusted to the center of the screen, and the optimum setting parameters are set.
* Set the frequency span before setting AUTO tuning.
* There is no function menu displayed for this mode. Auto tuning will execute upon pushing the key.
* The auto tuning does not operate normally in the following conditions.
AUTO TUNE
1) Zero span
2) Full span
3) The signal level is –40 dBm or lower.
4) The signal frequency is 50 MHz or lower.
15. Hold / Run <HOLD/RUN>
By pushing , the sweep is switched to halt and continuance.
* There is no function menu displayed for this mode.
HOLD / RUN
32
Page 39

16. C alculation Function <CALC>
When is pushed, the following function menu is displayed.
CALC
NORMAL
F1 F2 F3 F4 F5 F6
* By pushing , the sweep is restarted.
* By pushing ~ , the calculation function is selected.
MAX HLD
* *
HOLD / RUN
F1 F5
MIN HLD
* *
AVG
56
By rotating , the number of times of the sweep can be set.
16.1 NORMAL Mode
1. When is pus hed, the normal mode is set. The calculation is not performed in this mode. The
F1
number of times of the sweep is infinite. This mode is normally used.
OVRWR
* *
SPRI FR
OFF
* When this mode is set, “NORMAL” is displayed in the CALC area on the screen.
(Refer to “4. Explanation of Screen” for the details.)
16.2 MAX HOLD Mode
1. By the operation of , the number of times of the sweep in the MAX HOLD mode
is set.
2. The update spectrum data is compared with the data left last time at each point, and the larger one is retained
and displayed.
2 4 8 16 32 64 128
256 512 1024 * * (infinite)
* When this mode is set, “MAX --- (number of times)” is displayed in the CALC area on the screen.
(Refer to “4. Explanation of Screen” for the details.)
F2
16.3 MIN HOLD Mode
1. By the operation of , the number of times of the sweep in the MIN HOLD mode
F3
is set.
33
Page 40

2. The update spectrum data is compared with the data left last time at each point, and the smaller one is retained
and displayed.
2 4 8 16 32 64 128
256 512 1024 * * (infinite)
* When this mode is set, “MIN --- (number of times)” is displayed in the CALC area on the screen.
(Refer to “4. Explanation of Screen” for the details.)
16.4 AVERAGE Mo de
1. By the operation of , the number of times of the sweep in the AVERAGE mode is
set.
2. The simple averaging process is executed at each sweep.
2 4 8 16 32 64 128
256 512 1024
* When this mode is set, “AVG --- (number of times)” is displayed in the CALC area on the screen.
(Refer to “4. Explanation of Screen” for the details.)
F4
16.5 OVERWRITE Mode
1. By the operation of , the number of times of the sweep in the OVER WRITE
mode is set.
2. The image on the screen is not cleared at each sweep, and the overwriting display is executed.
2 4 8 16 32 64 128
F5
256 512 1024 * * (infinite)
* When this mode is set, “OVER WR” is displayed in the CALC area on the screen.
(Refer to “4. Explanation of Screen” for the details.)
* Only the last spectrum is saved.
16.6 SPURIOUS FREE Mode (2658A only)
1. By pushing , the SPRIOUS FREE mode, by which the spurious response at band 1- and band
1+ is simply deleted, is selected.
* “SPR” is displayed in CALC area on the screen.
(Refer to “4. Explanation of Screen” for the details.)
F6
34
Page 41

dBm →W
NORMAL
DELTA
OFF
* Differing from base band at which the up-c onversion of input frequency is done with a frequency mixer, the
spurious resp onse pec uliar to ban d 1- and band 1+ is generated because the down-conversion is done at those
two bands.
* About SPURIOUS FREE mode
1. SPURIOUS FREE mode is a mode by which the spurious response peculiarly caused at band
1+ is simply deleted.
2. SPURIOUS FREE mode is especially effective in the measurement of a stationary wave.
3. If SPURIOUS FREE mode is used in measurement of a signal with level change or frequency
change, the phenomenon that the level goes down will occur.
4. The noise level goes down a little in case of a noise changing at random. In short, the same
phenomenon as MIN HOLD function happens.
* How to judge SPURIOUS response at band 1- and band 1+
The procedure for judging SPURIOUS response at band 1- and band 1+ is as follows.
1. Set the center frequency to < (current setting value) + f >.
2. The spectrum shifting left by f is a correct spectrum, but another spectrum shifting such as left
by 2f, left by 3f, right by f, right by 2f or right by 3f is a spurious response.
* “f ” should be changed according to SPAN for easy judgment. For reference;
f = SPAN / (10 to 50) (corresponding to 0.2 to 1 div)
Example: judging a spectrum displayed at 6.92 GHz
(setting : center frequency 6.92 GHz and SPAN 500 MHz)
1. Set the center frequency to < 6.92 GHz + 500 MHz/25 > = 6.94GHz.
2. A spectrum at 6.92 GHz (shifting left by f from 6.94 G Hz) is correct. A spectrum at 6.98 GHz (shifting
right by 2f from 6.94 GHz) is spurious.
* Additio nally, a sp urious re sponse men tioned abo ve shift ing right by 2f at band 1+ is larges t, and othe r
spurious response are about 25 to 50 dB smaller than that.
17. M arker & Peak Search <MKR>
When is pushed, the following function menu is displayed.
● Ma in menu of marker function
MKR
MARKER
NORMAL ZONE
F1 F2 F3 F4 F5 F6
CENTER FREQ
CONV
35
Page 42

17.1 Movement and Basic F unction of Mar ker
1. By rotating , the mar ker moves.
2. By pushing , the normal marker mode is selected and the marker operates as an independent
F1
marker.
The frequency and the le vel at the marker poi nt are disp layed in the lower rig ht side.
3. When is pushed, the delta marker mode is selected, and the reference marker and
F2
the active marker are displayed.
The frequency and the level at the marker points are displayed as follows;
Frequency = (freq. at active marker) – (freq. at reference marker)
Level = (level at active marker) – (level at reference marker)
4. By pushing , the marker is erased (marker off).
F3
17.2 Normal Peak Search
● Menu of normal peak search
When is pushed, the following function menu is displayed.
F4
PEAK
SEARCH
F1 F2 F3 F4 F5 F6
1. When is pushed, the marker moves to the maximum peak position of spectrums.
2. When is pushed, the marker moves to the next highest peak. Fifty or less peaks are available.
3. When is pushed, the function menu is returned to the main menu of marker function.
NEXT
PEAK
F1
F2
F6
17.3 Zone Peak Search
● Menu of normal peak search
When is pushed, the following function menu is displayed.
F5
RETURN
36
Page 43

RETURN
ZONE
CENTER
WIDTH
F1 F2 F3 F4 F5 F6
At the Zone mode, the marker automatically moves to the maximum peak point within the range set beforehand.
When entering this mode, the zone is displayed with thin blue shadow in the spectrum display area.
The marker moves to maximum level within this zone at each sweep.
The center of the zone can be adjus ted by pressing
The width of the zone can be adju sted by pre ssing
F1
F2
Note: The marker does not move in HOLD.
17.4 Change Unit of Marker Level
When is pushed, the unit of the marker level is changed.
If the unit of the reference level is dBμV, dB mV or dBV, it can be changed to
Note: “V/M” is only displayed when the electric field strength measurement is selected
“A/M” is only displayed when the magnetic field strength measurement is selected
F6
If the unit of the reference level is dBm, it can be changed to [dBm] [W].
[dBμV, dBmV, dB V] [V].
If the unit of the reference level is dBμV/m, it can be changed to [dBμV/m] [V/m].
If the unit of the reference level is dBμA/m, it can be changed to [dBμA/m] [A/m].
Each unit change as described above has their own sub-menu for more unit display options. They are
shown belo w:
[W] [W, mW, μW, nW, pW, fW]
[V] [V, mV, μV, nV]
[V/m] [V/m, mV/m, μV/m, nV/m]
[A/m] [A/m, mA/m, μA/m, nA/m]
18. Save / Load <SAVE/LOAD>
When is pushed, SAVE/LOAD menu is displayed as follows.
SAVE / LOAD
37
Page 44

PRE
SET
SAVE
MEM
USB
SET
MODE SELECT
LOAD DELETE
DEVICE
PRE
F1 F2 F3 F4 F5 F6
18.1 Selection of Storage Device
1. When is pushed, the built-in flash memory is selected as a storage device.
When is pushed, the external USB memory is selected as a storage device.
F4
F5
* Install the USB memory in USB A- plug on the right side firmly. Refer to the figure below.
* Once you disconnect, then reconnect the same or a different USB flash memory drive, the 2650A series
will not automatically recognize the new USB drive. After connecting the drive, you must first press the
Save/Load key, follow ed by F5 key (USB) in order for the 2650A to "see" the new drive., then proceed as
described below.
.
38
Page 45

18.2 Save Funct ion
SPECT
PARAMM
BOTH
EXECUTE
SET
RETURN
When is pushed, SAVE menu is displayed as follows.
F1 F2 F3 F4 F5 F6
F1
OBJECT
SAVE
1. In this function, the data is stored in the built-in memory or USB memory by CSV format.
The data stored in USB memory can be used with a personal computer as a CSV file.
“2650A_csvData” folder will automatically be created and the data will be stored in it as a file.
2. The object to be stored is selected with , or .
F1 F2 F3
SPECT: The current spectrum on the screen is stored.
PARAM: The setting parameters are s tored.
BOTH: The spectrum and setting parameters are stored as one file.
* The selected key will look pushed-in on the display.
PRE
3. When is pushed, SAVE is executed.
F4
The data is stored based on the file name displayed in the active area (refer to “4. Explanation of screen”).
As for the file name, refer to “18.3 About File Name”.
Up to 200 files can be stored in the built-in memory.
Up to 1000 files can be stored in USB memory.
4. Pushing w ill return to the former menu.
F6
18.3 About File Name
1. The file name is attached to the file stored using this function as follows.
LABEL-SP001.csv
(1) (2) (3) (4)
(1) This is the labe l en tere d from the labe l func tion . Refer to “24.1 Label function.” Note: Symbols and
spaces are not recognized as a file name.
(2) S : The object stored is the spectrum (SPECT).
P: The object stored is the setting parameters (PARAM).
SP: The object stored is both of spectrum and setting parameters (BOTH).
(3) The consecutive three digit number from “000” is automatically attached if (1) and (2) are same.
(4) This is the extension showing CSV format and is automatically attached.
39
Page 46

2. If the label is not named, “2650A” will be the first part of the file name instead. For example:
RETURN
1
10
100
EXECUTE
CLEAR
1) USB : LOAD
2650A_SP001.csv
3. About file name at the time of storage
When SAVE is selected, the file name is displayed in the active area following according to the above labeling
convention.
When SAVE is executed as it is, the data is stored with that file name. If the file exists in the storage device and
is rotate d left before SAVE is executed, those file names are displayed one by one.
If SAVE is executed with an existing file name displayed, the data is overwritten on it.
18.4 Load Function
When is pushed, LOAD menu is displayed as follows.
F2
File Search Step
F1 F2 F3 F4 F5 F6
LOAD
DISP
1. When is rotate d rig ht or left, the stored file name is displayed one by one from the specified
storage device in the active area as follows.
2) 2650A_SP012.csv
3) 12
1) The storage device in which the file is stored.
(USB: USB memory, MEM: built-in memory)
2) The file name selected.
3) Number attached to file
The files in the specified folder of the storage device are sorted in alphabetical order, and this shows that
number.
2. To search files, press
, and the file will be displayed in order of the number attached to it in the active area.
F1
The search steps can be adjusted by pressing to search i n steps of 10 files at a t ime or pres sing
F3
to search in steps of 100 files at a time.
F2
Select it according to the number of stored files.
3. When is pushed, LOAD is executed.
F4
* When SPECT is selected, a spectrum waveform is loaded. The setting parameters of loaded spectrum
are displayed in the setting parameters display area.
[Refer to “4. Explanation of screen” for details.]
40
Page 47

* When PARAM is selected, setting parameters are loaded.
Items
Parameters
Center frequency
1 GHz
Frequency span
20 MHz
Reference level
10 dBm
Offset
0.0 dB
Impedance
50 Ω
Sweep time
30 ms
Detection mode
Sample mode (SMPL)
RBW
100 kHz
VBW
30 kHz
Display scale
10 dB/div
RETURN
1
10
100
EXECUTE
* When the spectrum is loaded, the 2650A series enters HOLD state and the current spectrum disappears,
replacing it with the loaded spectrum on main display.
When is pushed right after, the loaded spectrum and a current spectrum are
HOLD/RUN
displayed together.
4. When is pushed, the l oaded spec trum can be cleared on display.
F5
18.5 Delete Function
When is pushed, DELETE menu is displayed as follows.
F1 F2 F3 F4 F5 F6
1. The file name to be deleted is selected from the specified device with , and the active area will
2. When is pushed, DELET E is execu ted. The file displayed in the active area is deleted at this
F3
File Search Step
DELETE
indicate this name. As for the number of search steps, it is the same as “18.4 Load Function”.
F4
time.
3. Repeat step 1 and 2 above to delete more than one file.
18.6 Presetting (Initialization)
(For 2651, refer to “20. EMI test”)
When is pushed, the setting parameters are reset to the preset values as sh own below .
F6
41
Page 48

COUNT
ANT
PROBE
OBW
CH POWER
ACP
F4
F5
F6
19. Me asuring Function <MEAS>
When is pushed, the following function menu is displayed.
MEAS
F1 F2 F3 F4 F5 F6
E / F
The measuring function can be selected as follows.
F1
F2
F3
CH POWER ----------- Channel power measurement
ACP ----------------------- Adjacent channel leakage power measurement
OBW ---------------------- Occupied bandwidth measurement
E/F ANT ---------------- Electric field strength measurement
M/F PROBE ----------- Magnetic field strength measurement
FREQ COUNT --------- Frequency counter (factory option)
M / F
FREQ
* Once the measuring function is set, when is pushed, the function menu is directly returned to the last
MEAS
setting of the measuring function. In order to stop the measuring function or to select the other measuring function,
push [F6] key (MEAS OFF), then the function menu is returned to the main menu of the measuring function.
* Each of the four functions (Channel power, Adjacent channel leakage power, Occupied bandwidth and Frequency
counter) and the marker function cannot be used at the same time. When is pushed while each of the
MKR
four functions is selected, the measuring function will stop.
Similarly, when the measuring function is selected while using the marker function, the marker function will stop.
* Althoug h 501 points can be displayed on the screen, the number of points calculated in the instrument is 1001.
19.1 Channel Power Measuremnt <CH POWER>
The total power in the specified frequency band is measured.
Two modes, TOTAL and BAND, are available.
• TOTAL mode [ By pushing (MODE), TOTAL mode is selected.]
F1
The sum of power in the displayed spectrum specified by center frequency and frequency span is measured.
42
Page 49

[Setting parameter]
[Measured Value]
[Measuring Mode]
* “CP TOTAL” is displayed in MEAS area on the screen.
* The measured value is displayed at the lower right corner on
the screen.
• BAND mode [ By pushing (MODE), BAND mode is selected.]
F1
The sum of power in the band specified by band center and bandwidth is measured.
* “CP BAND” i s display ed in MEAS area on th e screen.
* The measured value an d the set ting param eter are
displayed at the l ower part of the screen.
1. By (BAND ENTER) ,
the band center is set .
2. By (BAND WIDTH) ,
the band width is set.
[Measuring Mode]
[Measured Value]
F2
F3
19.2 Adjacent Chann el Leakag e Power Measu rement <ACP>
F2
The adjacent channel leakage power is measured as the ratio of power in the range specified by offset frequency
and bandwidth to carrier power. Both leakage power at the upper and lower side are measured.
Furthermore, the method for measurement is selected out of three methods based on the classification of definition
of carrier power; total power method, reference level method and in-band method.
• Mode selection and measurement
[ By pushing (MODE), TOTAL, BAND or PEAK mode is selected.]
F1
* “ACP TOTAL”, “ACP BAND” or “ACP PK” is displayed in MEAS area on the screen.
43
Page 50

* The measured value and the setting parameter are displayed at the lower par t of the screen.
[Measuring mode]
[Setting parameter]
[Measured value]
1. By (ACP OFFSET) , the
offset frequency of adjacent channel is set.
* The offset is from the center frequency of the reference
carrier.
2. By (ACP WIDTH)
band width of adjacent channel is set.
3. By (REFERENCE CENTER) ,
the center
* [F4] is only for TOTAL and BAND mode.
4. By (REFERENCE WIDTH)
the band width of reference carrier is set.
* [F5] is only for BAND mode.
F2
F3
F4
f requency of the reference carrier is set.
F5
,
, the
• Definition of Reference Carrier for each Mode
TOTAL (total power m ethod)
This is based on the sum of power in the
displayed spectrum. Th e center frequency
of the reference carrier is set by [F4].
BAND (in-band method)
This is based on the sum of power in the
specified bandwidth. The center
frequency of the reference carrier is set by
[F4].
PEAK (reference level method)
This is based on the power of peak on the
screen. The center frequency of the
reference carrier is automatically set to the
peak on the screen.
44
Page 51

19.3 Occupied Band width Measu rement <OBW >
[Setting parameter]
F3
It is possible to measure the occupied frequency bandwidth defined as the width of points at N(%) of the total
power (N% POWER), or a s the widt h of points t hat are X( dB) lower than the pea k level (XdB DOWN).
• N% POWER mode [ By pushing (MODE), N% POWER mode (N%) is selected.]
[Measuring mode]
• XdB DOWN mode [ By pushing (MODE), XdB DOWN mode (X dB) is selected.]
F1
The bandwidth of points at N(%) of the total power is measured.
* “OBW N%” is displayed in MEAS area on the screen.
* The measured value is displayed at the lower right corner on the screen.
1. By (RATIO %) , the percentage of the
total power is set.
* Setting range : 80.0 to 99.9%
2. By , the step size of RATIO % can be set to 1% or 0.1%.
[Measured value]
F2
F3
F1
The bandwidth of points that are X(dB) lower than the peak level is measured.
* “OBW XdB” is displayed in MEAS area on the screen.
* The measured value is displayed at the lower right corner on the screen.
[Measuring mode]
[Setting parameter]
[Measured value]
1. By (XdB) , the down level fr om
the peak level is set.
* Setting range : 0.1 to 99.0dB
2. By , the step size of XdB can be set to 1dB or 0.1dB.
F2
F3
19.4 Electric Field Strength Measurement <E/F ANT>
Connecting a dipole antenna (option) to the RF input enables the measurement of the electric field strength.
F4
(Refer to “25.8 Writing of Original Compensation Data” for the details.)
Other than the optional antenna is also available by creating the original compensation data.
45
Page 52

Connect to
Antenna
[Ant enna connection] [Measurem ent envir onment]
M401
M402
M403
M404
M405
RF INPUT.
M406
2650A series
* Turn the back to the signal source.
[Specifications of dipole antenna (The antenna gain and VSWR are specified at the center of frequency range.)]
Items M401 M402 M403 M404 M405 M406
Type Sleeve Sleeve Sleeve Sleeve ¼ λ whip Sleeve
Frequency range 0.8 to 1GHz 1.25 to 1.65GHz 1.7 to 2.2GHz 2.25 to 2.65G Hz 300 to 50 0MHz 4.7 to 6.2GHz
Antenna gain >1dB >1dB >1dB >1dB >1dB >1dB
VSWR < 1.5 < 1.5 < 1.5 < 1.5 < 1.5 < 1.5
Dimensions 7.5φ ×280mm 7.5φ ×280mm 7.5φ ×210mm 7.5φ ×210mm 8.0φ ×212mm 7.5φ ×152mm
Weight Approx. 58g Approx. 60g Approx. 58g Approx. 56g Approx. 62g Approx. 54g
Reference level
setting range
(except for the
minimum value in
screen shift)
93 to 143
dBμV/m
96 to 146
dBμV/m
99 to 149
dBμV/m
100 to 150
dBμV/m
87 to 137
dBμV/m
109 to 159
dBμV/m
* When M405 is used, the measurement errors will occur due to how to hold of instrument and influence of
human body, because M405 is ¼ λ whip ante nna. The er ror value will be seve ral dB or mo re. In orde r to
reduce the error, separa te 2650A series from human body as much as possible.
• Mode Selection and Measurement
By pushing (ANT), the antenna (M401/M402/M403/M404/M405/M406/USER) can be selected
F1
The measurement starts as soon as the antenna is selected.
46
Page 53
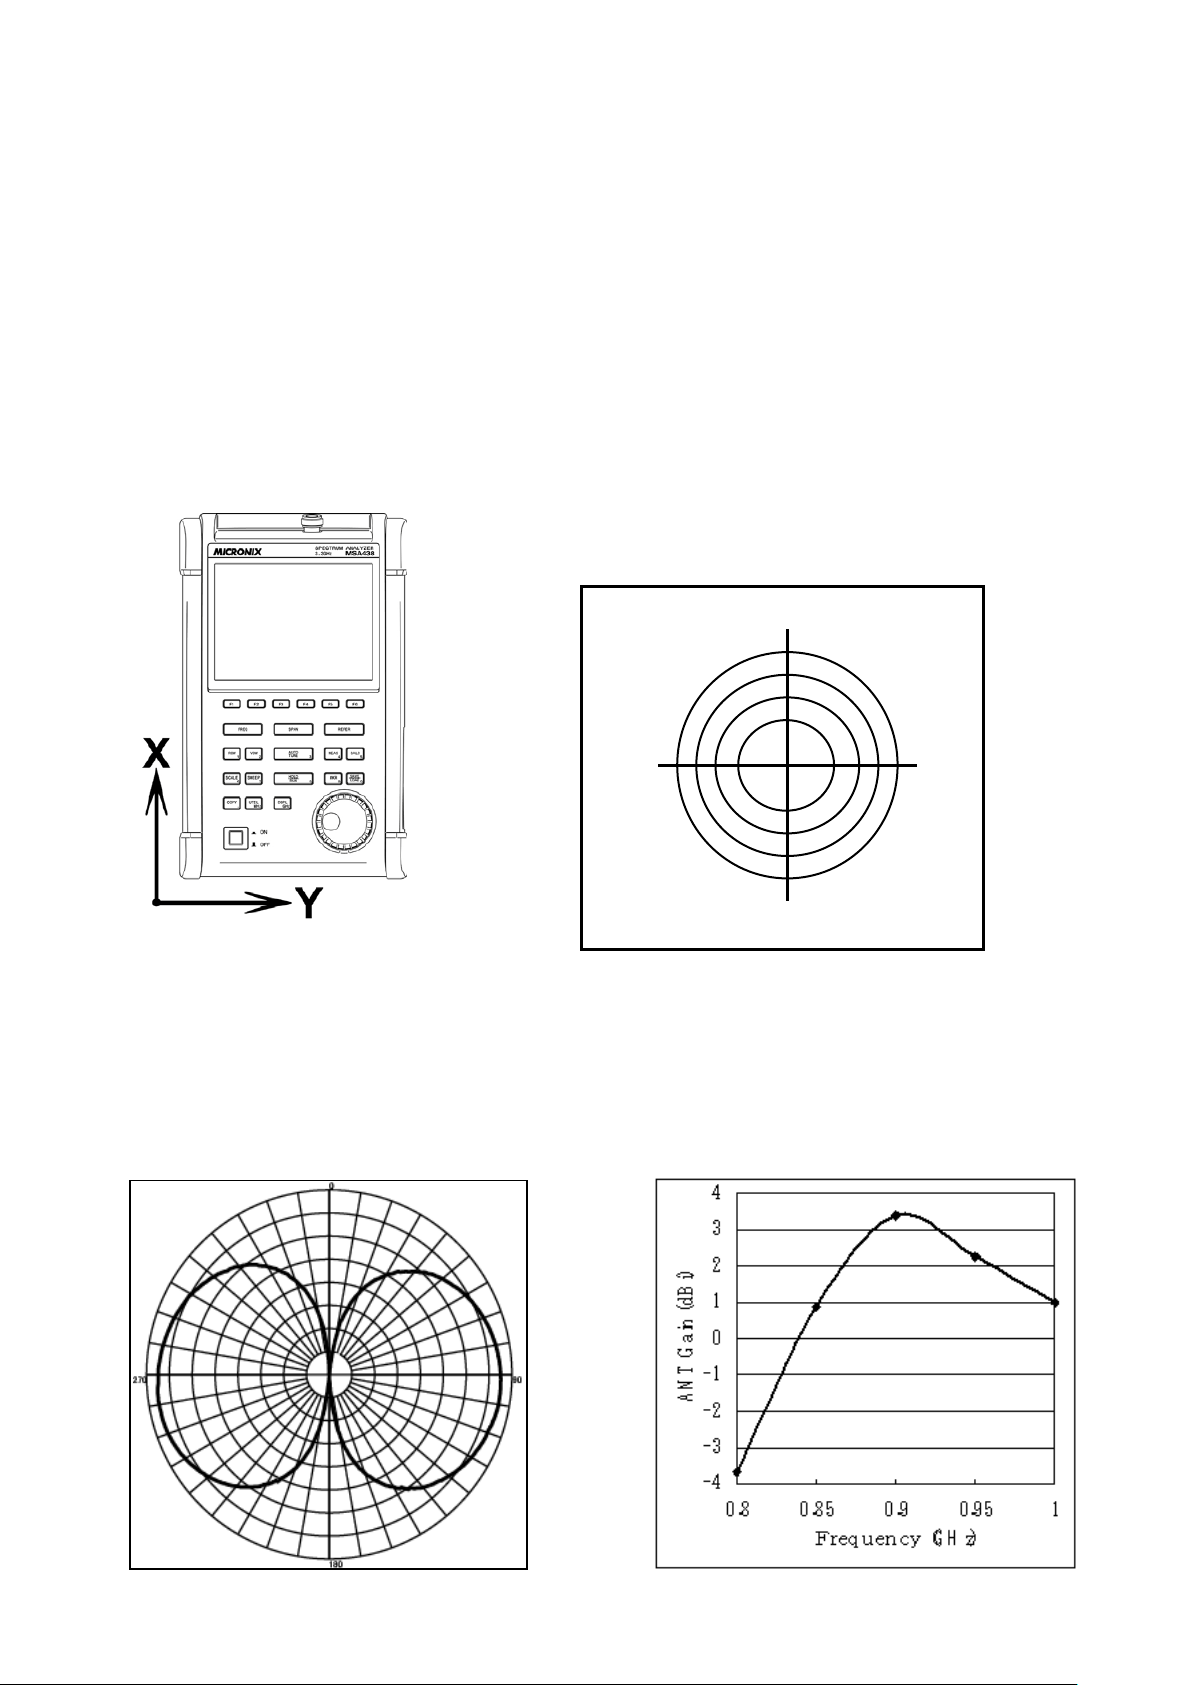
* “E/F M40X” or “E/F USER” is displayed in MEAS area on the screen.
90°
270°
180°
M401 (900 MHz, E plane)
* “USER” is the original compensation data which is created by the user.
(Refer to “25.8 Writing of Original Compensation Data” for the details.)
* The spectrum may exceed the area on the screen depending on the antenna gain compensation.
The unit of amplitude axis automatically changes into [dBμV/m].
* The optimum center frequency and frequency span are automatically set according to the antenna.
In addition, a spectrum other than the frequency range of the antenna is not displayed.
• Directivity of Antenna (reference data)
E plane: X-Y axis (X direction=0°)
0°
* The following are the data when the antenna is connected to RF input directly with no obstacles around.
Actually, the directivity changes due to the human body when handling the unit.
* However, the data of M405 is the reference data which is included the influence of the human body.
Antenna gain vs. Frequency
47
Page 54

M404 (2.4 GHz, E plane)
0.5
1
1.5
2
2.5
3
3.5
4
4.5
5
5.5
1.7 1.8 1.9 2 2.1 2.2
Frequency (GHz)
ANT Gain (dBi)
M402 (1.5 GHz, E plane)
Antenna gain vs. Frequency
1
1.5
2
2.5
3
3.5
4
4.5
5
5.5
2.25 2.35 2.45 2.55 2.65
Fr equency (GHz)
ANT Gain (dBi)
M403 (2 GHz, E plane)
Antenna gain vs. Frequency
Antenna gain vs. Frequency
48
Page 55

M406 (5.4 GHz, E plane)
2
ANT Gain (dB)
4.95
M405 (horizontal plane)
Antenna gain vs. Frequency
Antenna gain vs. Frequency
3.5
3
2.5
1.5
1
4.70
5.20 5.45
Frequency(GHz)
5.70 5.95
19.5 Magnetic Field Strength Measurement <M/F PROBE>
The magnetic field distribution can be measured by using the magnetic field probe CP-2S (option).
6.20
F5
49
Page 56

Item
Specifications
Frequency range
10 MHz to 3 GHz
approx. 0.25 mm
Reference level setting range: maximum
160 to 203 dBμA/m
Reference level setting range: minimum
Measurement error
approx. ±1 dB (probe simple substance)
[Magnetic field probe connection]
The tip of the magnetic field probe CP-2S is made of glass-ceramic board. Take
care when handling the probe even though the strength of the glass-ceramic
board is durable under normal operation.
“Specifications of magnetic field probe CP-2S” (Refer to the operating manual of CP-2S for the de tails.)
Space resolution (-6 dB)
(depending on objects)
(except for the minimum value in screen shift)
110 to 153 dBμA/m
• Mode Selection and Measurement
By pushing (PROBE), CP-2S or USER mode is selected.
F1
The measurement starts as soon as the probe is selected.
* “M/F CP2S” or “M/F USER” is displayed in MEAS area on the screen.
* “USER” is the original compensation data which is created by the user.
(Refer to “25.8 Writing of Original Compensation Data” for the details.)
The unit of amplitude axis automatically changes into [dBμA/m].
* A spectrum other than the frequency range of the probe is not displayed.
50
Page 57

19.6 Frequency Counter <FREQ COUNT>
This function currently not supported.
20. EMI Test (2651)
20.1 Additional Functi on for EMI Test
Detection mode (Refer to “13.4 Setting of Detection mode”)
F6
By pushing , the detection mode can be set.
POS SMPL NEG QP AV
In the 2651, QP detection and AV detection are added for EMI measurement.
POS (Positive Peak) : The s pectrum of the maximum value between the sample points
SMPL (Sample) : T he spectr um of the momentary value between the sample points
NEG (Negative Peak) : The spect rum of the minimum value between the sample points
QP (Quasi Peak) : The spectrum of the quasi peak value between the sample points
AV (Average) : The spectrum of the average value between the sample points
As for QP detection, the following characteristics are chosen accord ing to RBW settings.
(based on CISPR16)
RBW charging
time constant
9kHz 1ms 160ms 160ms
F6 SWEEP
dis-charging
time constant
meter
time constant
120kHz 1ms 550ms 100ms
• Preset (Initialization) (Refer to “18. Save / Load”)
In the 2651, the radiated emission measurement and the conducted emission measurement are added to the
preset as a default setting.
By pushing , the menu is displayed
F1
F2
F3
In the radiated mission measurement, “USER” is selected as an antenna.
It is necessary to input the compensation data of antenna beforehand.
NORMAL : The initial parameters of normal mode are set.
EMI-C : The initial parameters of conducted emission measurement are set.
EMI-R : The initial parameters of radiated emission measurement are set
F6 SAVE/LOAD
51
Page 58

20.2 EMI Test
The QP detection is usually used in both of the radiated and conducted emission measurements, and the AV
detection is usually used in the conducted emission measurement. The measurement time can be shortened by
using them in the final measurement to the spectrums narrowed by the PK detection.
Conducted Emission Measurement
The conducted emission discharged through the power supply line is measured.
In this measurement, LISN* (Line Impedance Stabilization Network) device is needed.
The connection is shown in the figure below. Please refer to the manual of LISN for details of the
connection and notes.
Power Supply
1. Turn on the power of the 2651 after the connection.
2. Set the initial parameters of conducted emission measurement by pushing
. The setting parameters are as follows.
Center Frequency : 25.5 MHz
Frequency span : 50 MHz
RBW : 9 kHz
VBW : 1 MHz
Sweep time : 3 sec
Detection mode : Positive peak mode
F6 SAVE/LOAD F2
LISN *
2651
EUT
3. Confirm whether the connection and the operation are correct by supplying the power to the EUT and
measuring.
4. Set the number of times of the sweep in the MAX HOLD mode by operating
.
5. Search the frequency of disturbance noise that exceeds the AV or QP limits by using the marker
function.
6. Set the center frequency to the point that exceeds the limits, the SPAN to 2 MHz and the SWEEP to
0.1 sec. And measure the frequency accurately.
F2 CALC
52
Page 59

7. M oreover, m easure the frequency detected in the above with QP or AV detection, then the SPAN is
200 kHz and the SWEEP is 10 sec.
Radiated Emission Measurement
The electric field strength of disturbance noise that EUT radiates in the air is measured.
Antenna
2651
1. Set the compensation data of the antenna beforehand.
Refer to “25.8 Writing original compensation data” for the details.
2. Turn on the power of the 2651 after connection.
3. Set the initial parameters of radiated emission measurement by pushing
EUT
. The setting parameters are as follows.
F6 SAVE/LOAD F3
Center Frequency : 515 MHz
Frequency span : 1 GHz
RBW : 120 kHz
VBW : 1 MHz
Sweep time : 0.3 sec
Detection mode : Positive peak mode
4. Confirm whether the connection and the operation are correct by supplying the power to the EUT and
measuring.
5. Set the number of times of the sweep in the MAX HOLD mode by operating
.
F2
CALC
6. Search the frequency of disturbance noise that exceeds the QP limits by using the marker function.
7. Set the center frequency to the point that exceeds the limits, the SPAN to 50MHz and the SWEEP to
30 msec. And measure the frequency accurately.
8. Moreover, m easure the frequency detected in the above with QP detection, then the SPAN is 1MHz
and the SWEEP is 30 sec.
53
Page 60

EMI standards (selected)
CISPR22 class A
0.15 MHz to 0.50 MHz
79 dBuV
CISPR22 class B
0.15 MHz to 0.50 MHz
66 to 56 dBuV
56 to 46 dBuV
Decreasing linearly with the logarithm of the
CISPR22 class A
30 MHz to 230 MHz
40 dBuV/m
---
Measurement distance 10 m
CISPR22 class B
30 MHz to 230 MHz
30 dBuV/m
---
Measurement distance 10 m
VCCI class A
0.15 MHz to 0.50 MHz
79 dBuV
66 dBuV
VCCI class B
0.15 MHz to 0.50 MHz
66 to 56 dBuV
56 to 46 dBuV
Decreasing linearly with the logarithm of the
VCCI class A
30 MHz to 230 MHz
40 dBuV/m
---
Measurement distance 10 m
1000 MHz to 3000 MHz
76 dBuV/m
56 dBuV/m
Measurement distance 3 m
1000 MHz to 3000 MHz
70 dBuV/m
50 dBuV/m
Measurement distance 3 m
FCC part15 subpartB class A
0.15 MHz to 0.50 MHz
79 dBuV
66 dBuV
FCC part15 subpartB class B
0.15 MHz to 0.50 MHz
66 to 56 dBuV
56 to 46 dBuV
Decreasing linearly with the logarithm of the
FCC part15 subpartB class B
30 MHz to 88 MHz
40 dBuV/m
---
Measurement distance 3 m
Limits of co nducte d distur bance at
mains ports
Limits of co nducte d distur bance at
mains ports
Limits of r adiate d dist urbance
Limits of r adiate d dist urbance
Limits of co nducte d distur bance at
mains ports
Limits of co nducte d distur bance at
mains ports
Limits of r adiate d dist urbance
VCCI class B
Limits of r adiate d dist urbance
Frequency Quasi Peak Average
0.50 MHz to 30 MHz
0.50 MHz to 5 MHz
5 MHz to 30 MHz
230 MHz to 1000 MHz
1000 MHz to 3000 MHz
3000 MHz to 6000 MHz
230 MHz to 1000 MHz
1000 MHz to 3000 MHz
3000 MHz to 6000 MHz
0.50 MHz to 30 MHz
0.50 MHz to 5 MHz
5 MHz to 30 MHz
230 MHz to 1000 MHz
3000 MHz to 6000 MHz
30 MHz ~ 230 MHz
230 MHz ~ 1000 MHz
73 dBuV
56 dBuV
60 dBuV
47 dBuV/m
76 dBuV/m
80 dBuV/m
37 dBuV/m
70 dBuV/m
74 dBuV/m
73 dBuV
56 dBuV
60 dBuV
47 dBuV/m
80 dBuV/m
30 dBuV/m
37 dBuV/m
46 dBuV
50 dBuV
--56 dBuV/m
60 dBuV/m
--50 dBuV/m
54 dBuV/m
60 dBuV
46 dBuV
50 dBuV
---
60 dBuV/m
---
---
frequency
frequency.
Measurement distance 10 m
Limits of co nducte d distur bance at
mains ports
Limits of co nducte d distur bance at
mains ports
FCC part15 subpartB class A
Limits of r adiate d dist urbance
Limits of r adiate d dist urbance
3000 MHz to 6000 MHz
0.50 MHz to 30 MHz
0.50 MHz to 5 MHz
5 MHz to 30 MHz
30 MHz to 88 MHz
88 MHz to 216 MHz
216 MHz to 960 MHz
over 960 MHz
88 MHz to 216 MHz
216 MHz to 960 MHz
over 960 MHz
74 dBuV/m
73 dBuV
56 dBuV
60 dBuV
39.1 dBuV/m
43.5 dBuV/m
46.4 dBuV/m
49.5 dBuV/m
43.5 dBuV/m
46 dBuV/m
54 dBuV/m
54 dBuV/m
60 dBuV
46 dBuV
50 dBuV
---
---
---
---
---
---
---
frequency.
Measurement distance 10 m
(Note: Informatio n provided i n this table serves as a reference only. B&K Precision is not lia ble f or any dam ages d ue to any mistakes in the table.)
21. S creen Control <DSPL>
When is pu shed, the following function menu is dis played.
DSPL
54
Page 61

Item
Specification
Frequency range
5 MHz to 3.3 GHz
Output Level
-10 dBm ± 1 dB @1 GHz(Fixed value)
Output flatness
±1.5 dB
Output impedance
50 Ω
Output VSWR
Less than 2.0
Output connector
N(J) connector
80
COLOR
COLOR1
ON
F1 F2 F3 F4 F5 F6
BACK LT
BRIGHT
21.1 Setting Scree n Display Color
When is pushed, the color of screen display can be selected.
COLOR1 COLOR2 MONO
• COLOR1 : For norma l use
• COLOR2 : For printing screen
•
F1
MONO : Monochrome
21.2 ON/OFF Switching of LCD Backlight
Use button to toggle the backlight ON or OFF.
F2
21.3 Adjusting Brightness of LCD Backlight
Use to set the brightness. It can be set in the range of 0 to 100.
F3
22. Tr acking Generator Mode (2652A)
22.1 Specification of T.G. Function
55
Page 62

MODE
SMPL
INT
22.2 Description of I/O Connector
1) Input connector
N (J) connector
Input for an external signal
Make sure that the total power of input signals does not exceed +27 dBm.
2) Output connector
N (J) connector
It is an output terminal of Tracking Generator.
*Please set to “TG : OFF” to p revent the influence of th e leak from the Tracking
Generator in case of disuse of the T.G. function..
22.3 ON/OFF Switching of T.G. Function
When is pushed, the following function menu is display.
SWEEP
SWEEP
MANUAL
F1 F2 F3 F4 F5 F6
AUTO ALL AUTO
DET
TRIG
T.G.
1. When is pushed, T.G. MODE is set.
F6
56
Page 63

T.G.
NORM
ON
F1 F2 F3 F4 F5 F6
2. Each time is pressed, T.G. output is alternately switched to ON or OFF.
F1
ON
22.4 Normalizing Function
NORM ON: The input level is made flat to the red line on the screen.
1. When is pushed, the same function menu as the previous item is displayed.
2. When is pushed, TG. MODE is set.
3. Each time is pushed, the normalizing function is alternately switched to ON or OFF.
If the normalizing function is switched to ON, “NORM ON” is displayed on the screen.
SWEEP
F6
F2
* If the setting is changed as follows, the normalizing function is automatically turned off.
· The span is expande d. · The center frequency is changed beyond the range normalized.
( When SPAN is changed from FULL SPAN according to center frequency, it is turned off.)
· The magnetic field strength measurement is selected.
· The AUTO tuning is executed. · The power supply is turned off. · The presetting is executed.
* When the scale is 2 dB or 5 dB, the normalizing function does not operate correctly if the spectrum level is not
displayed at a proper position on the screen.
57
Page 64

23. Storage/Print Screen Image <COPY>
COPY
EXECT
The following function menu is displayed when is pushed.
AREA
WHOLE
F1 F2 F3 F4 F5 F6
PRINT
EXECT
Bmp → USB
COPY
MEM → USB
23.1 Selection of Image Area
When is pushed, the image area to be stored or printed can be selected.
WHOLE : the whole screen image is stored or printed.
SPECT : only the spectrum display area is stored or printed.
F1
23.2 Print on Printer
When pushing after connecting the printer (option), the area selected in 23.1 is printed.
F2
23.3 Storage into USB Memory
When pushing after connecting USB memory (removable storage) to this unit, the area
selected in 23.1 is stored in USB memory in BMP (bit map) format. As for the file name, the number is
automatically set and incremented in the form “2650A_001.bmp”. In the case when some characters are
written in the label area, the file name will consist of it and the number put automatically such as
“LABEL001.bmp”. The folder “2650A_IMG” is automatically generated and these files are stored
inside.
To change the color of the display before print, refer to “21. Screen Control”.
F3
58
Page 65

※ Once you disconnect, then reconnect the same or a different USB flash memory drive, the 2650A
series will not automatically recognize the ne w USB drive. After connecting the drive, you first must press the
Save/Load, followed by F5 key (USB) in order for the 2650A to "see" the new drive, then proceed with copying
data to the drive.
23.4 Transferring Inter nal Data to USB Memory in Lump Sum
When pushing after connecting USB memory (removable storage) to this unit, the data
stored in the internal memory with SAVE/LOAD function are transferred to USB memory in a lump
sum. During the transfer process, the screen on the lower right corner will display “Saving”. Wait until it
disappears, indicating that transfer is complete, before continuing operation. The folder “2650A_SaveAll”
is automatically generated and these files are stored inside.
※ Once you disconnect, then reconnect the same or a different USB flash memory drive, the 2650A
series will not automatically recognize the ne w USB drive. After connecting the drive, you must first press the
Save/Load key, followed by F5 key (USB) in order for the 2650A to "see" the new drive, then proceed as normal.
F5
23.5 USB Printer (option)
The 2650A/2651 series enables a hard copy of the screen by connecting a USB printer (option) to USB A
plug with the included USB cable.
59
Page 66

* Turn on the power of the 2650A/2651 series unit first. After that, turn on the power of USB printer.
Otherwise, it will not work correctly.
23.6 USB Memory
USB B plug
USB A plug
Printer
USB memory can be used as a removable storage.
60
Page 67

24. U tility Function <UTIL>
BACK SP
OFF
ALWAYS
CONFIG
When is pushed, the following function menu is displayed.
UTIL
LABEL
MENU
BUZZER
CLOCK
F1 F2 F3 F4 F5 F6
Label Function : Enters the label menu for customizing filename.
F1
Menu Off : Turns off menu and active area display.
F2
Buzzer Setting : Sets the condition of the buzzer sound.
F3
Clock Function Setting : Sets the built-in clock.
F4
24.1 Label Function
ABC
F1 UTIL
@%*
+
←
ENTER
→
When is pushed, t he following function menu is displayed.
012
abc
F1 F2 F3 F4 F5 F6
1. The kind of character to be written is selected with to .
012 : 0 to 9 (numeral)
abc : a to z (lower case alphabet)
ABC : A to Z (upper case alphabet)
@%* : Special characters ( ! ” # $ % & ’ ( ) * + , - . / : ; < = > ? @ [ ¥ ] ^ _ ` { Ω } µ)
F1
F2
F3
F4
F1 F4
*Note: Certain special characters may not be recognized or valid as a filename.
2. A block cur sor will be display ed in the labe l display area.
By rotating , a number, small letter alphabet, capital letter alphabet or special character will
be indicated on the cursor position. Turn the knob until the desired label character is displayed.
3. When is pushed, the cursor position will move right by one character. And the previous character
F6
is set.
61
Page 68

4. When is pushed, the cursor position will move left by one character. To change the
JUN
F5
character, turn the encoder. To delete, press F5 again. Characters previously entered can be deleted
by consecutively pushing F5.
5. When finished, press to exit the label menu.
UTIL
24.2 Menu Off
By pushing , the display of the function menu and the active area can be turned off
temporarily.
F2
24.3 Buzzer Setting
By pushing , the buzzer sound can be set to beep when keys are pressed or rotary encoder
is turned. The following three options are selectable by pressing F3 until the desired option is displayed.
OFF : The buzzer is off.
ALARM : The buzzer will sound off when an incorrect setting is made.
F3
ALWAYS : The buzzer will sound whenever a key or the rotary encoder is
operated.
※ When the battery voltage becomes low during battery operation, the buzzer will sound.
(Even if OFF is selected, it will sound.)
24.4 Setting the Clock
When is pushed, the following function menu is displayed.
YEAR
08
F1 F2 F3 F4 F5 F6
MONTH
DATE
30
F4 UTIL
HOUR
23
MIN
50
ENTER
The year, month, day and time are displayed below the screen. (Refer to “4. Explanation of Screen”)
Set the year, month, day and time when 2650A/2651 series is used for the first time.
The time information is updated even if the power is turned off.
62
Page 69

F3
1. By rotating , the values for a selected parameter (choosen by pressing any butt on between F1 and F5)
can be changed.
2. Used to set the year. Two last digits of the y ear are displayed. This can be set from 00 to 99.
Used to set the month. This can be set from 1 to 12.
F1
F2
Used to set the date. This can be set from 1 to 31.
Used to set the hour. It is displayed in twenty-four hour format. Values can be set from 1 to 24.
Used to set the minute.
F4
F5
3. By pushing , the values which are set from item 2. above are saved. The values are updated only
F6
when this key is pushed.
* The clock function of the 2650A/2651 series is driven by a dedicated LSI, and the power is supplied by a
built-in lithium battery.
63
Page 70

25. USB Device Function
25.1 Outline
The 2650A/2651 series is equipped with two kinds of USB connecters; A and B plugs. The A plug is for USB
host and is connected to USB devices such as USB memory or printer. The B plug is for USB device and is
connected to USB host such as a personal computer. The device function is explained in this chapter.
As for the host function using USB A plug, refer to “23. Storage and print of screen image”.
25.2 How to Connect
When using the USB device, connect with the included USB cable as illustrated
USB A plug
USB B plug
25.3 Installation of Driver
An instrument specified USB driver is neces sary in order to control the 2650A/2651 series with a PC via USB
interface, and should be installed in the PC prior to using the software. The driver along with instructions can be
downloaded from our website www.bkprecision.com. (Go to the Support section and select download). After the
downloaded file is unzipped, the 2650A/2651 series is connected to a PC with the USB cable and then the power
is turned on. The detection wizard for the USB driver starts on the PC screen the moment the power of the
2650A/2651 series is turned on, and install it following this wizard.
25.4 Sample Program
Please contact us at www.bkprecision.com to request a sample code which demonstrates how to write a
custom program using the commands in the following section.
64
 Loading...