

Page 1
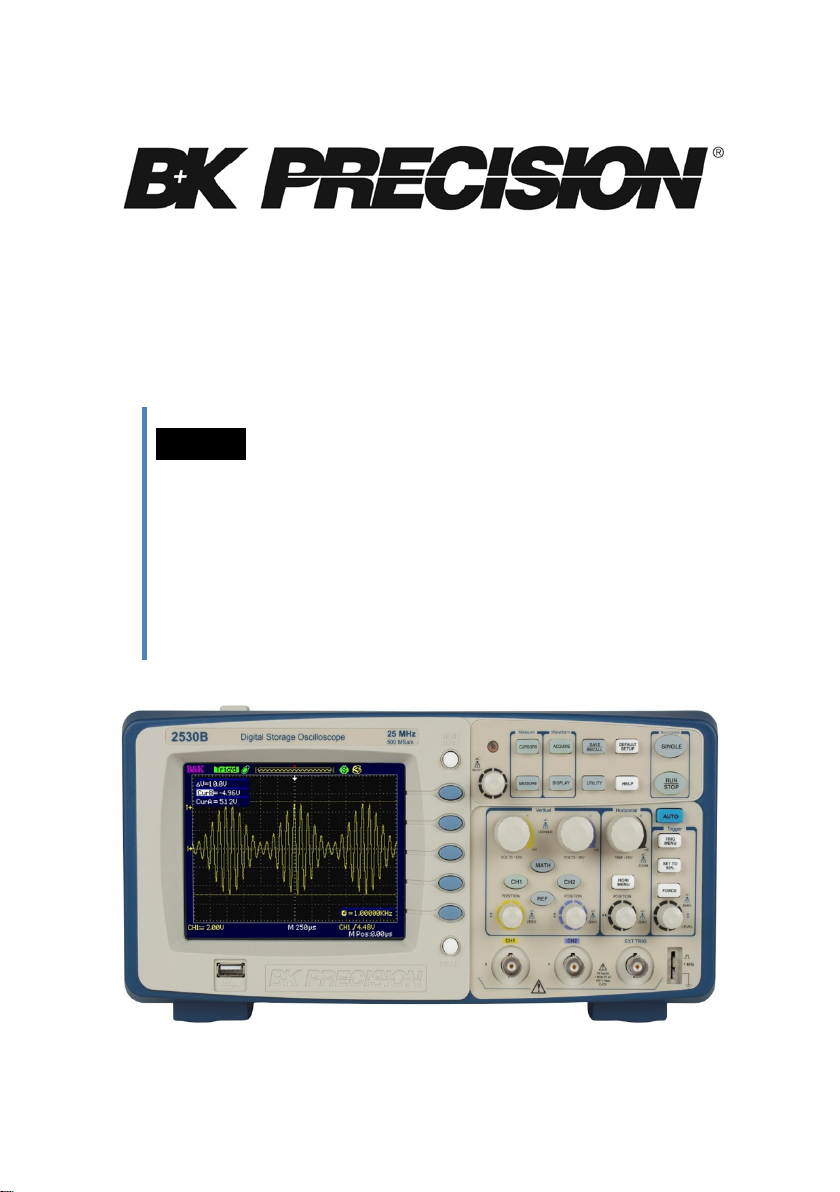
Model: 2530B, 2532B
25 MHz & 40 MHz Digital
Storage Oscilloscope
USER MANUAL
Page 2

Page 3

Safety Summary
The following safety precautions apply to both operating and
maintenance personnel and must be observed during all phases of
operation, service, and repair of this instrument. Before applying
power, follow the installation instr uctions and become familiar
with the operating instructions for this instrument.
If this device is damaged or something is missing, contact the
place of purchase immediately.
This manual contains information and warnings must be followed
to ensure safe operation as well as to maintain the oscilloscope in a
safe condition.
GROUND THE INSTRUMENT
To minimize shock hazard, the instrument chassis and cabinet
must be connected to an electrical gro und. This instrument is
grounded thr ough the ground conductor of the supplied, threeconductor ac power cable. The power cable must be plugged into
an approved three-conductor electrical outlet. Do not alter the
ground connection. Without the prote ctive ground connection, a ll
accessible conductive parts (including control knobs) can render
an electric shock. The power jack and mating plug of the power
cable meet IEC safety standards.
DO NOT OPERATE IN AN EXPLOSIVE ATMOSPHERE
Do not operate the instrument in the presence of flammable gases
or fumes. Operation of any electrical instrument in such an
environment constitutes a definite safety hazard.
KEEP AWAY FROM LIVE CIRCUITS
Instrument covers must not be removed by operating personnel.
Component replacement and internal adjustments must be made
by qualified maintenance personnel. Disconnect the power cord
before removing the instrument c overs and replacing components.
Under certain conditions, even with the power cable removed,
dangerous voltages may exist. To avoi d injuries, always
disconnect power and discharge circuits before touching them.
DO NOT SERVICE OR ADJUST ALONE
3
Page 4

Do not attempt any internal service or adjustment unl ess another
Do not alter the ground connection. Without the
protective ground connection, all accessible
conductive parts (including control knobs) can
render an electric shock. The power jack and
mating plug of the power cable meet IEC safety
standards.
To avoid electrical shock hazard, disconnect power
cord before removing covers. Refer servicing to
qualified personnel.
Before connecting the line cord to the AC mains,
check the rear panel AC line voltage indicator.
Applying a line voltage other than the indicated
voltage can destroy the AC line fuses. For
continued fire protection, replace fuses only with
those of the specified voltage and current ratings.
This product uses components which can be
damaged by electro-static discharge (ESD). To
avoid damage, be sure to follow proper procedures
for handling, storing and transporting parts and
subassemblies which contain ESD-sensitive
components.
person, capable of rendering first aid and resuscitation, is present.
DO NOT SUBSTITUTE PARTS OR MODIFY THE INSTRUMENT
Do not install substitute parts or perform any unauthorized
modifications to this instrument. Return the instrument to B&K
Precision for service and repair to ensure that safety features are
maintained.
WARNINGS AND CAUTIONS
WARNING and CAUTION statements, suc h as the following
examples, denote a hazard and appear throughout this manual.
Follow all instructions containe d in these statements.
A WARNING statement calls atte ntion to an operating procedure,
practice, or condition, which, i f not followed correctly, could
result in injury or death t o personnel.
A CAUTION statement calls attentio n to a n operating procedure,
practice, or condition, which, i f not followed correctly, could
result in damage to or destruction of part or all of the product.
WARNING:
WARNING:
CAUTION:
CAUTION:
4
Page 5
Compliance Statements
This product is subject to Directive
Disposal of Old Electrical & Elect r onic Equipment (Applicable in the
European
Union and other European countries with separate collection systems)
2002/96/EC of the European
Parliament and the Council of the
European Union on w aste
electrical and electronic equipment
(WEEE) , and in jurisdicti ons
adopting that Directive, is marked as
being put on the market a fter August
13, 2005, and should not be disposed
of as unsorted
municipal waste. Please utilize your
local WEEE collection
facilities in the disposition of this
product and otherwise observe all
applicable requirements.
Safety Symbols
This symbol is used to denote the measurement ground
connection.
Electrical Shock hazard.
This symbol on an instrument indicates caution. For details,
the user should refer to the operating instructions i n the
manual.
5
Page 6

On (Power). This is the In position of the power switch
This symbol shows that the switch is a power switch located
CAT I
IEC Measurement Category I.
when instrument is ON.
Off (Power). This is the Out position of the power switch
when instrument is OFF.
at the top of the oscilloscope. Pressing this button toggles the
oscilloscope’s state between operation and power off mode.
(400V)
Inputs may be connected to
mains (up to 400 VAC) und er
Category I overvoltage conditions.
6
Page 7

Table of Contents
SAFETY SUMMARY ...................................................................... 3
CHAPTER 1 INTRODUCTION ....................................................... 10
ANEL AND DISPLAY INFORMATION .................................................... 11
P
Front Panel ........................................................................................ 11
Back and Side Panel .......................................................................... 12
Display Information .......................................................................... 15
ACKAGE CONTENTS ........................................................................ 17
P
C
HECKING FUNCTIONS ..................................................................... 17
P
ROBE SAFETY ................................................................................ 19
P
ROBE ATTENUATION ...................................................................... 20
P
ROBE COMPENSATION .................................................................... 21
CHAPTER 2 FUNCTIONS AND OPERATING DESCRIPTIONS ........... 23
ENU AND CONTROL BUTTON .......................................................... 24
M
ONNECTORS ................................................................................. 26
C
A
UTO SETUP ................................................................................... 27
D
EFAULT SETUP .............................................................................. 30
U
NIVERSAL KNOB ............................................................................ 31
V
ERTICAL SYSTEM ............................................................................ 32
C
HANNEL FUNCTION MENU .............................................................. 33
Setting Up Channels .......................................................................... 35
SING VERTICAL POSITION KNOB AND VOLT/DIV KNOB ......................... 42
U
ATH FUNCTIONS ........................................................................... 43
M
FFT Spectrum Analyzer ...................................................................... 45
Displaying the FFT Spectrum ............................................................. 48
Select FFT Window ............................................................................ 49
Magnifying and Positioning and FFT Spectrum ................................ 50
Measuring an FFT Spectrum Using Cursors ...................................... 50
SING REF ..................................................................................... 54
U
H
ORIZONTAL SYSTEM ....................................................................... 56
Horizontal Control Knob .................................................................... 56
Window Zone .................................................................................... 58
RIGGER SYSTEM ............................................................................. 59
T
7
Page 8

Signal Source ..................................................................................... 61
Trigger Type ...................................................................................... 61
Coupling ............................................................................................ 81
Position ............................................................................................. 81
Slope and Level ................................................................................. 81
Trigger Holdoff .................................................................................. 82
CQUIRING SIGNALS SYSTEM ............................................................ 84
A
D
ISPLAY SYSTEM ............................................................................. 91
X-Y Format ........................................................................................ 97
EASURE SYSTEM ........................................................................... 99
M
Scale Measurement .......................................................................... 99
Cursor Measurement ........................................................................ 99
Auto Measurement ......................................................................... 105
TORAGE SYSTEM .......................................................................... 114
S
U
TILITY SYSTEM ............................................................................ 133
System Status .................................................................................. 136
Language ........................................................................................ 137
Self Calibration ................................................................................ 138
Self Test ........................................................................................... 139
Updating the System Software ....................................................... 142
Pass/Fail .......................................................................................... 143
Waveform Recorder ........................................................................ 149
Record ............................................................................................. 153
NLINE HELP FUNCTION ................................................................. 157
O
CHAPTER 3 APPLICATION EXAMPLES ....................................... 159
AKING SIMPLE MEASUREMENTS ..................................................... 160
T
T
AKING CURSOR MEASUREMENTS ................................................... 162
M
EASURING RING FREQUENCY ........................................................ 162
Measuring Ring Amplitude ............................................................. 163
APTURE A SINGLE EVENT ............................................................... 164
C
ANALYZING THE SIGNAL DETAIL ....................................................... 166
Looking at a Noisy Signal ................................................................ 166
Separating the Signal from Noise ................................................... 166
RIGGERING ON A VIDEO SIGNAL ..................................................... 167
T
Triggering on Video Field ................................................................ 167
Triggering on Video Lines ................................................................ 168
8
Page 9

APPLICATION OF X-Y FUNCTION ....................................................... 168
A
NALYZING A DIFFERENTIAL COMMUNICATION SIGNAL ....................... 170
CHAPTER 4 MESSAGE PROMPTS AND TROUBLESHOOTING....... 172
ESSAGE PROMPTS ...................................................................... 172
M
T
ROUBLESHOOTING ....................................................................... 174
CHAPTER 5 SPECIFICATIONS .................................................... 177
PECIFICATIONS............................................................................. 177
S
C
ERTIFICATION .............................................................................. 183
APPENDIX A DEFAULT SETUP................................................... 184
APPENDIX B INDEX ................................................................. 187
APPENDIX C DISABLING AUTO FUNCTION ................................ 188
SERVICE INFORMATION .......................................................... 189
LIMITED ONE-YEAR/THREE-YEAR WARRANTY .......................... 190
9
Page 10

Chapter 1 Introduction
The 2530B/2532B digital storage oscilloscopes (DSO) are portable
benchtop instruments used for making measurements of signal s and
wavefor ms. This chapter will highlight information on the fo ll o wing:
• Panel and display information
• Package Contents
• Checking functions
• Probe Attenuation
• Probe Compensation
10
Page 11
Panel and Display Information
1
2
3
4
5
6
10
1
12
13
14
15
1
17
18
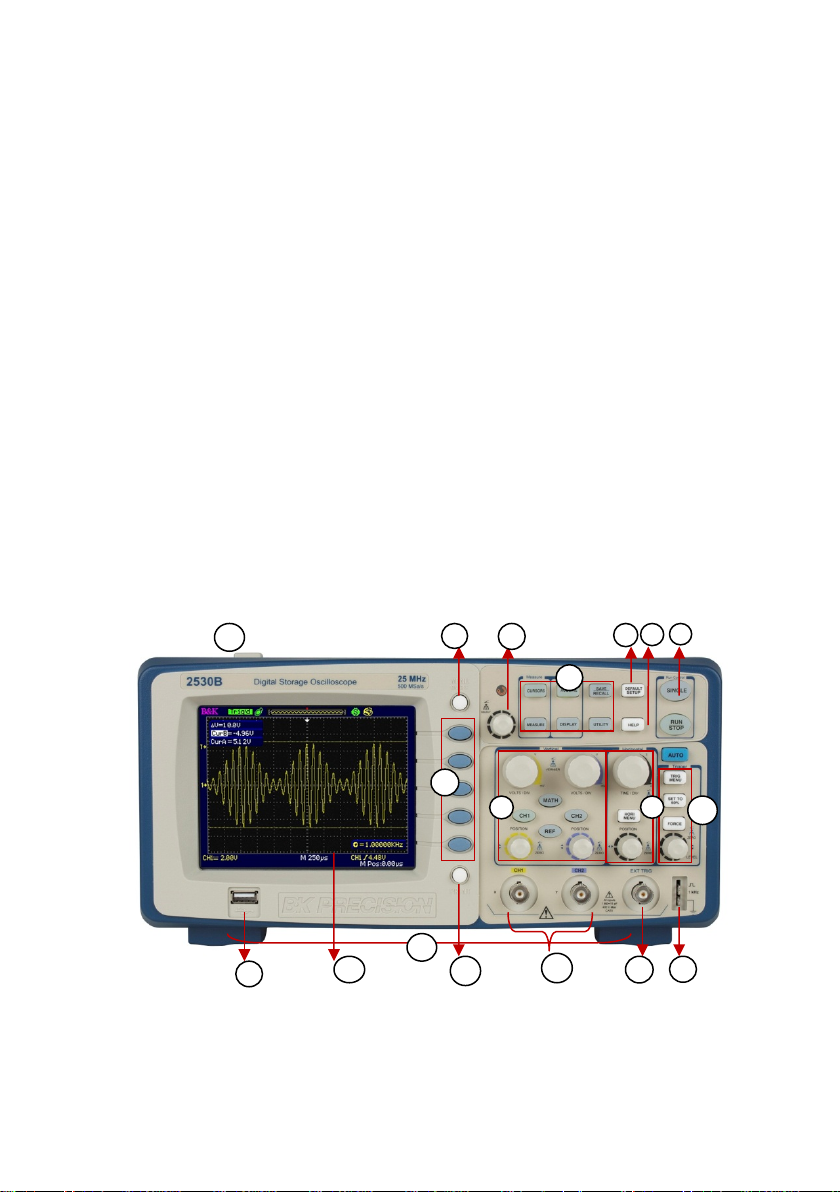
Figure 1 - Front Panel Controls
Front Panel
It is important for you to understand the DSO’s front panel before operating
it. The following contents are a br ie f introduction for the front panel
function, which is useful to become familiar with the oper a tion of the
2530B/2532B DSO.
The oscilloscope provides an easy-to-use front panel to simplify operations
for the user
11
Page 12

1. Menu On/Off display button
2. Selection option b uttons
3. Unive rsa l kno b
4. Common function but tons (Cursor, Measure, Acquire, Display,
Save/Recall, Utility)
5. Vertical Controls (Volts/div, vertical position, CH1 & CH2
On/Off, Mat h function, Reference function)
6. Default setup button
7. Help button
8. Run Controls (Single, Run/Stop)
9. Horizontal Contro ls ( Time/div, horizontal position, Horizo ntal
menu)
10. Trigger Co ntrols (Trigge r menu, Set to 50%, Force, Trigger level)
11. 1 kHz probe compensation
12. External trigger
13. CH1 and CH2 inputs
14. Print button
15. LCD Display
16. USB Host port (for storage to USB thumb drives)
17. Main power On/Off button
18. Tilt feet
Back and Side Panel
The following shows the back and side panel connect i ons of the DSO.
12
Page 13
1
2
3
4
6
7
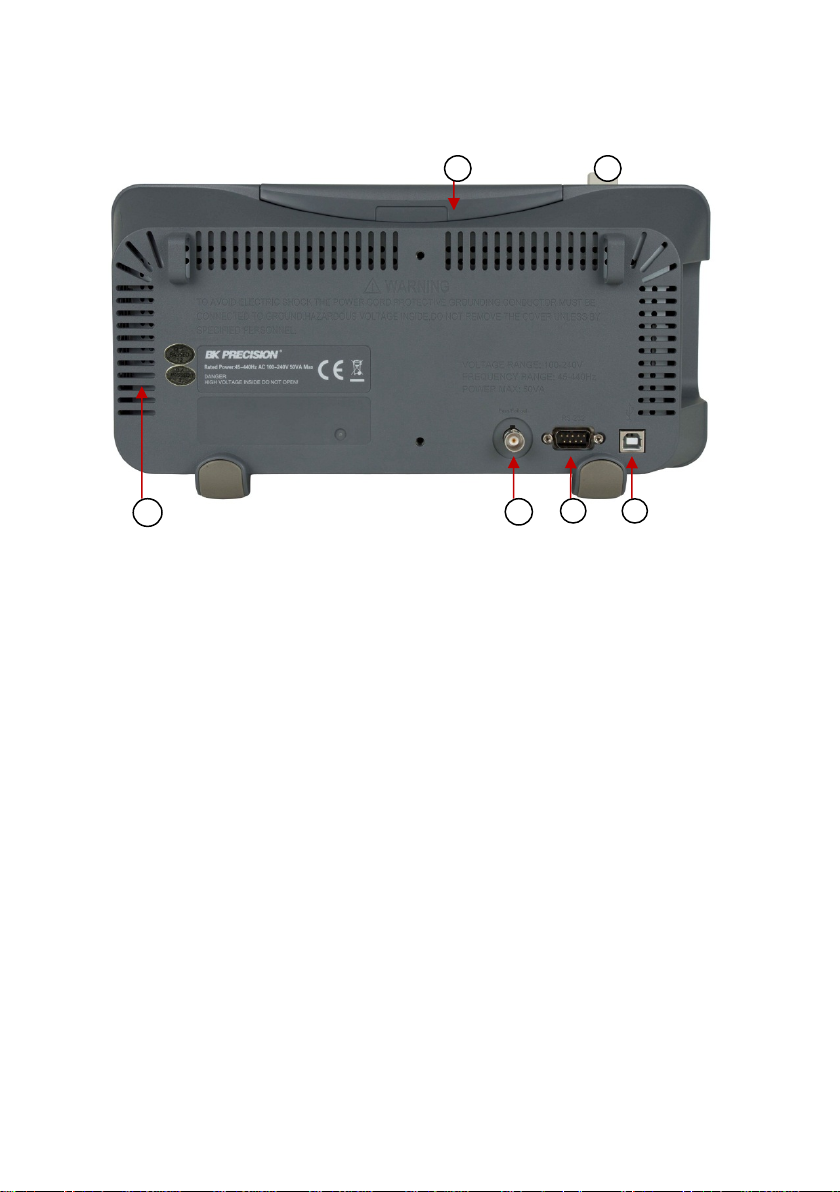
Figure 2 - Back Panel
1. Side ventilation fan
2. Pass/Fail outp ut
3. RS-232 Port
4. USB interface port (for remote connection to EasyScope
software)
5. AC line input (100~240 V, 45-440 Hz, max. 50 VA)
6. Carr yi ng hand le
7. Main power On/Off button
13
Page 14
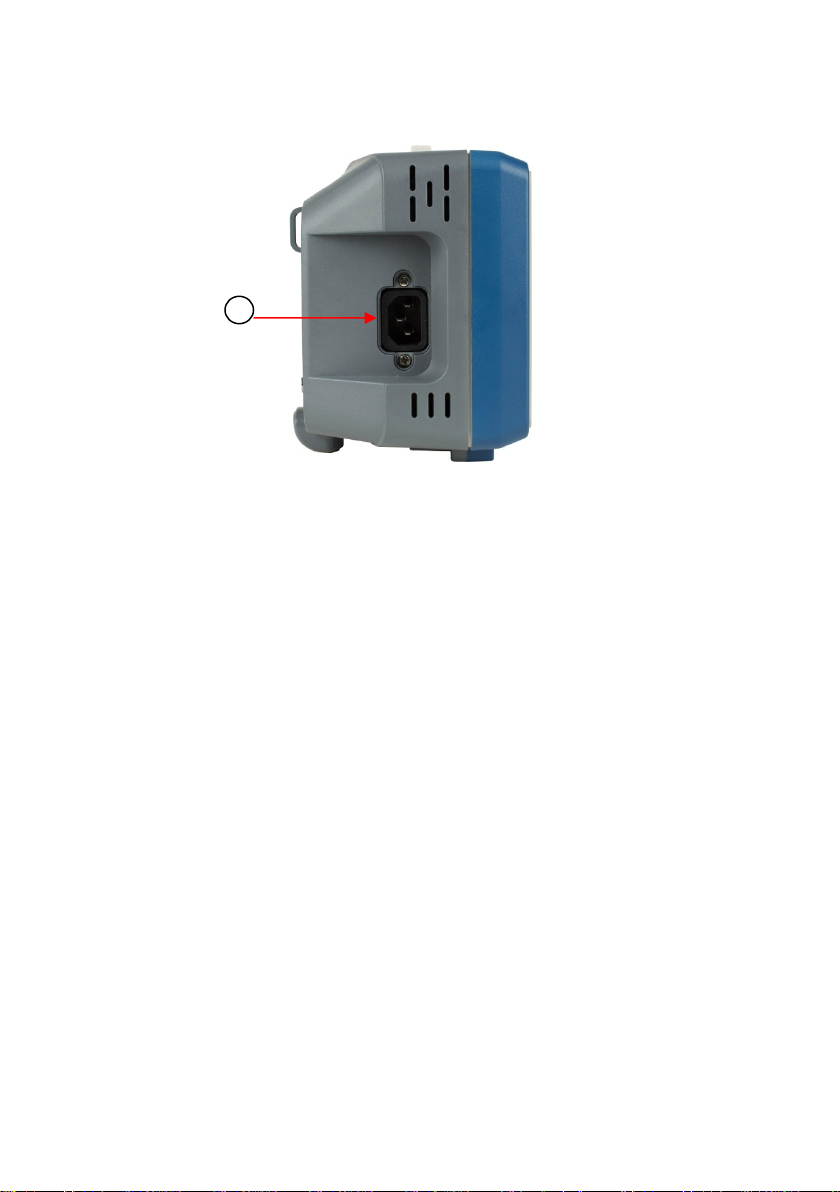
5
Figure 3 - Side Panel
14
Page 15
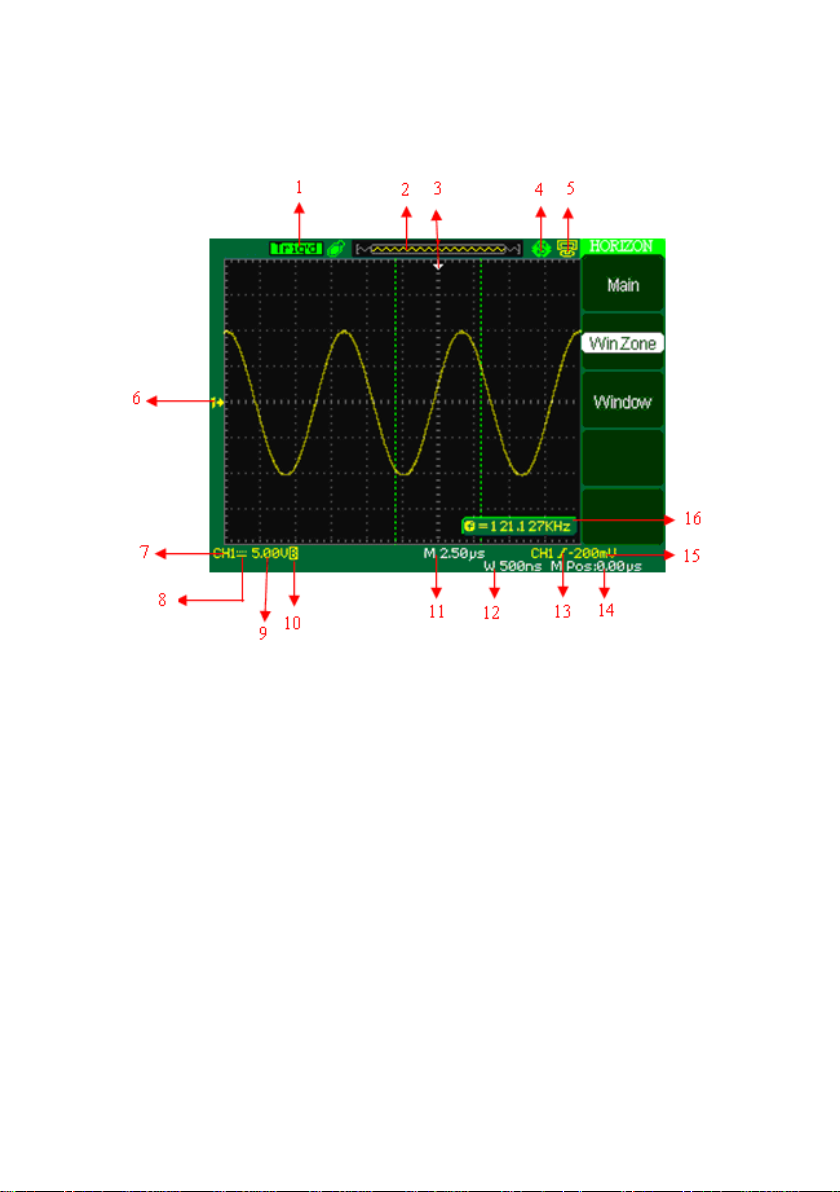
Display Information
1. Trigger status
Figure 4 - Display Screen
• Armed - The oscilloscope is acquiring pre-trigger data.
All triggers are ignored in this state.
• Ready - All pre-trigger data has been acquired and the
oscilloscope is ready to accept a trigger.
• Trig’d - The oscilloscope has seen a trigger and is
acquiring the post-trigger data.
• Stop - The oscilloscope has stopped acquiring waveform
data.
• Auto - The oscilloscope is in auto mode and is acquiring
waveforms in the absence of triggers.
• Scan - The oscilloscope is acquiring and displaying
wavefor m data continuous ly in scan mod e. This mode
15
Page 16
occurs whe n oscilloscope is looking for a signal or when
timebase is set slow enough in which the scope requires
longer time to “scan” in order to acquire the entire signal
on display.
2. Displays positio n o f t he present waveform window in internal
memory.
3. Marker shows horizontal trigger position. Turn the
HORIZONTAL POSITION KNOB to adjust the position of the
marker.
4. Print Key – Indicates whether the PRINT KEY option is set to
print picture or save picture.
• “Print Key” option is set to “Pr int Picture”
• “Print Key” option is set to “Save Picture ”
5. Back USB – Indicates whether the BACK USB option is set to
Computer or Printer.
• “Back USB” option is set to “Computer”.
• “Back USB” option is set to “Printer” (not available)
6. Tag to show waveform channel number.
7. On-screen markers show the ground reference points of the
displayed waveforms. If there is no marker, the channel is not
displayed. Display signal source.
8. Signal Coupling Symbol
9. Vertical scale factor of corresponding channels.
10. Indicates whether the bandwidth limiting filter is “On” or “Off”.
The “B” icon indicates the filter is On.
11. Main time base scale setting
12. Horizontal position of main time base waveform.
13. Shows the icon for the tri gger type
14. Displays real time and date
15. Shows the trigger voltage
16. Trigger signal frequency
16
Page 17

Package Contents
The digital storage oscilloscopes are shipped with the following contents:
• 2530B/2532B Digital Storage Oscilloscope
• User Manual
• Easyscope Software Installation Disk
• USB (Type A to B) communication cable
• AC Power Cord
• Two 10:1 passive oscilloscope probes
Please locate each item from the original packaging and contact B&K
Precision immediately if something is missing.
Checking Functions
Please follow the steps below when checking the oscilloscope’s
functionality.
1. Power on the oscilloscope.
Press “DEFAULT SETUP” to show the result of the self check.
The probe default attenuation is 1X.
17
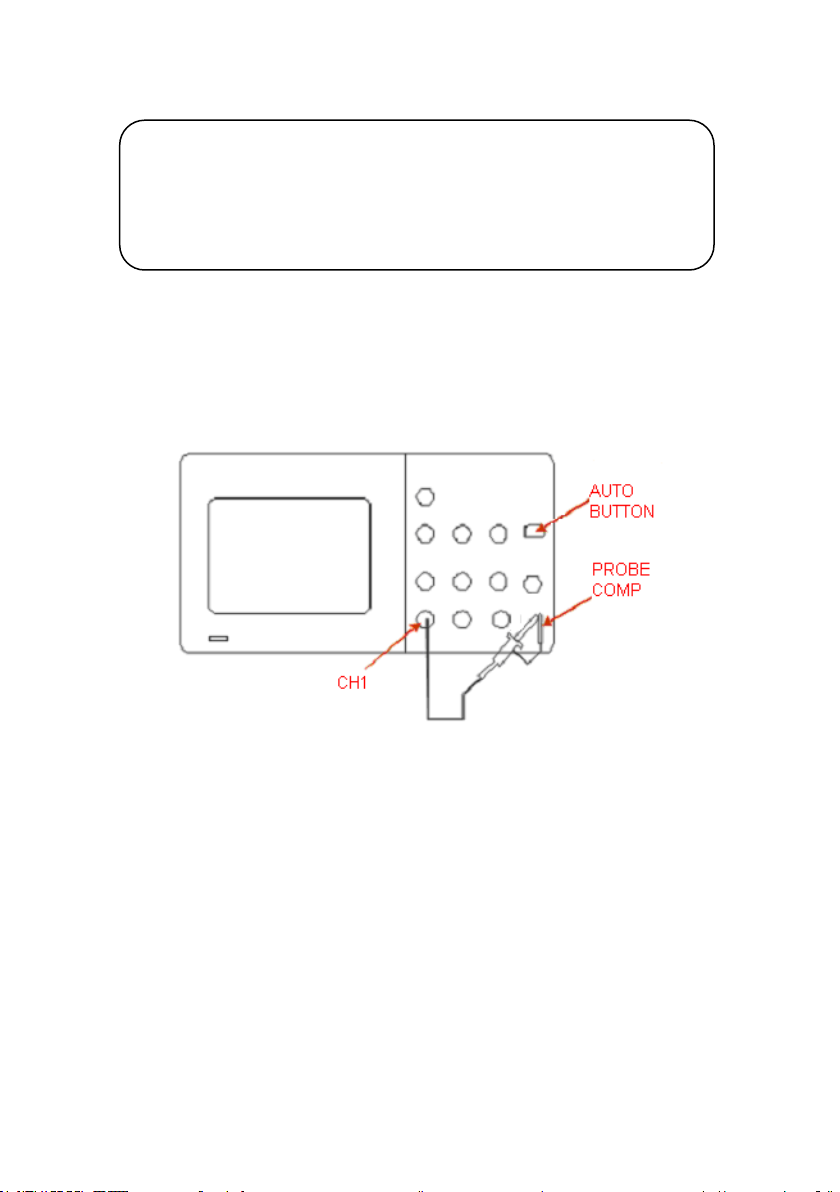
Page 18
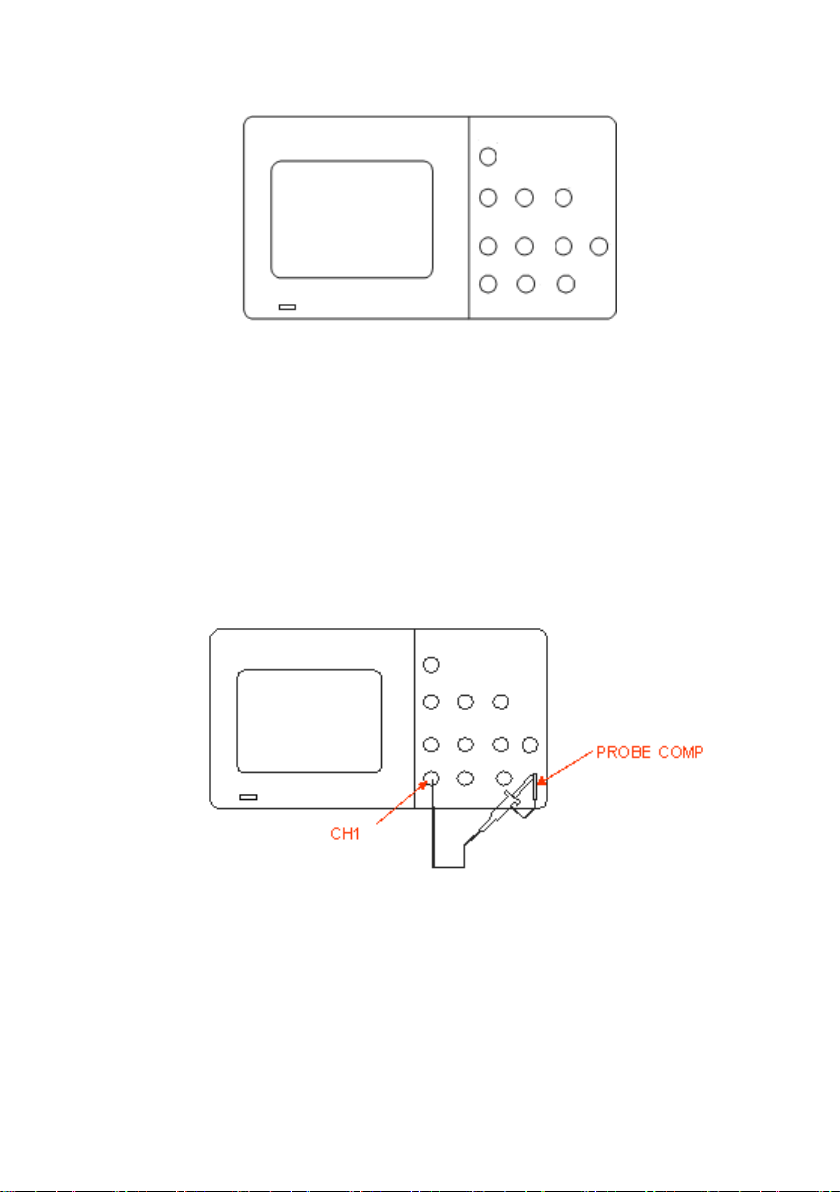
Figure 5 - Scope Layout
2. Set the switch to 1X on the probe and connect the probe to channel
1 on the oscilloscope. To do this, align the slot in the probe
connector with the key on t he CH 1 BNC, p ush to connect, and
twist to the right to lock the probe in place. Connect the probe tip
and reference lead to the PROBE COMP connectors.
Figure 6 - Probe Compensation
3. Press “AUTO” to show the 1 kHz frequency and about 3V peak-
peak square wave in couple seconds.
18
Page 19
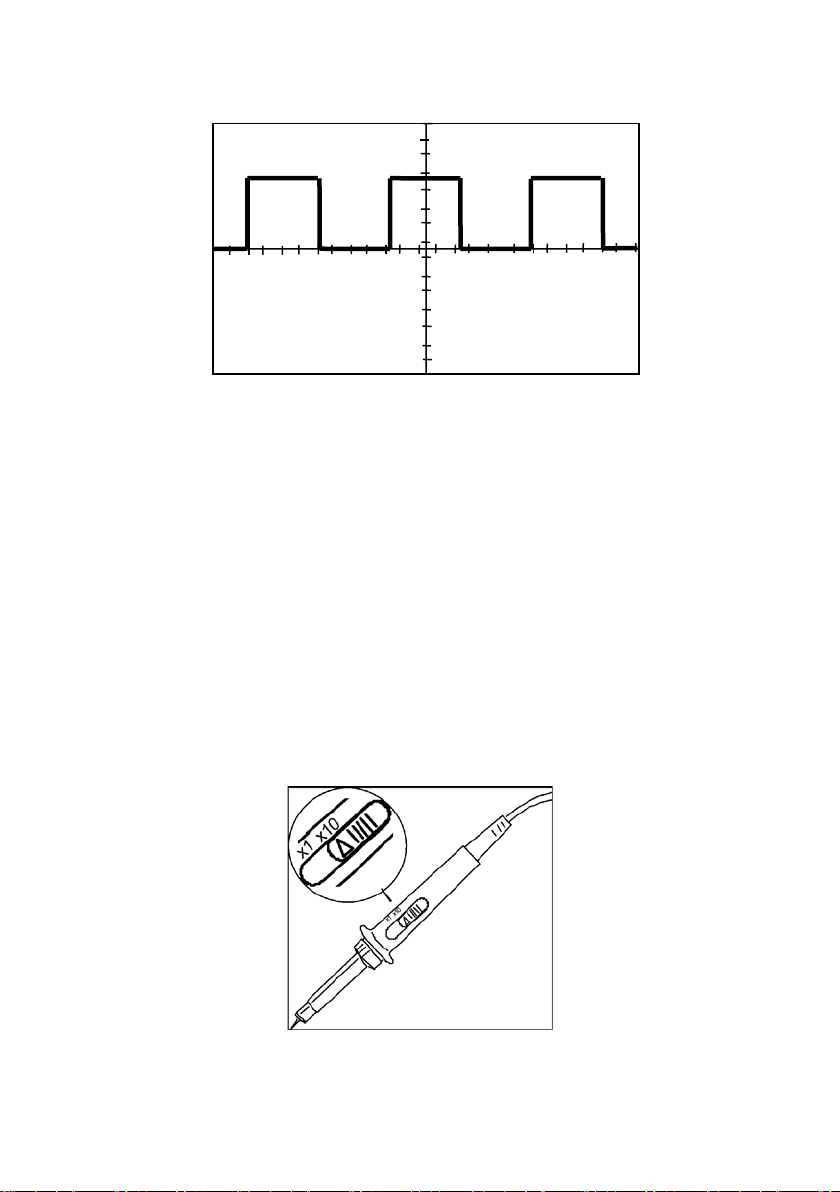
Figure 7 - 3Vpp Square Wave
4. Press “CH1” two times to cancel the channel 1, Press“CH2” to
change screen into channel 2, reset the channel 2 as step 2 and step
3.
Probe Safety
A guard aro und the probe body provides a finger barrier for pro te c tion from
electric shock.
Figure 8 - Probe
19
Page 20

Connect the probe to the oscilloscope and connect the ground terminal to
Note: ● To avoid electric shock when using the probe, keep fingers behind
Note. The default setting for the Probe option is 1X.
ground before you take any measurements.
the guard on the probe body.
● To avoid electric shock while using the probe, do not touch
metallic portions of the probe head while it is connected to a
voltage source. Connect the probe to the oscilloscope and
connect the ground terminal to ground before you take any
measurements.
Probe Attenuation
Probes are available with various attenuation factors which affec t the
vertical scale of the signal. The Probe Check function verifies that the
Probe attenuati on option matches the attenuation of the probe.
You can push a vertical menu button (such as the CH 1 MENU button), and
select the Probe option that matches the attenuation factor of your probe.
Be sure that the attenuation switch on the probe matches the Probe option
in the oscilloscope. Switch settings are 1X and 10X.
20
Page 21
Note. When the attenuation switch is set to 1X, the probe limits the
bandwidth of the oscilloscope to 10 MHz (according to Probe spec). To use
the full bandwidth of the oscilloscope, be sure to set the switch to 10X.
Probe Compensation
As an alternative method to Probe Check, you can manually perform this
adjustment to match your probe to the inp ut channel.
Figure 9 - Probe Compensation Setup
1. Set the Probe option attenuation in the channel menu to 1 0X. Do
so by pressing CH1 button and selecting “Probe” from menu.
Select 10X. Set the switch to 10X on the probe and connect the
probe to channel 1 on the oscilloscope. If you use the probe hooktip, ensure a proper connection by firmly inserting the tip onto the
probe.
2. Attach the probe tip to the PROBE COMP 3V connector and the
reference lead to the PROBE COMP Ground connector. Display
the channel and then push the “AUTO” button.
3. Check the shape of the displayed waveform.
21
Page 22
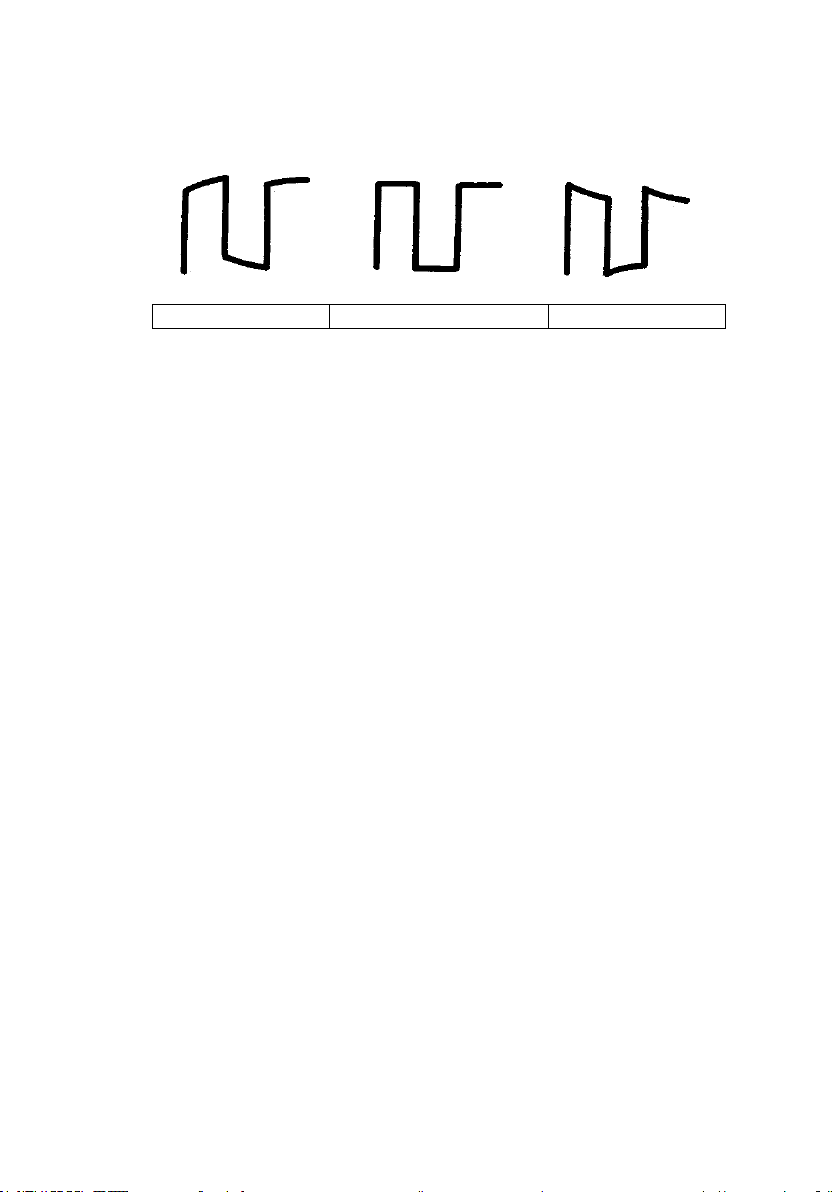
Overcompensated
Compensated Correctly
Undercompensated
4. If necessary, adjust your probes compensation trimmer pot. Repeat
as necessary.
22
Page 23

Chapter 2 Functions and Operating Descriptions
To use your oscilloscope effectively, you need to learn about the following
oscilloscope functions:
• Menu and control button
• Connector
• Auto Setup
• Default Setup
• Universal knob
• Vertical System
• Horizontal System
• Trigger System
• Acquiring signals System
• Display System
• Measuring waveforms System
• Utility System
• Storage System
• Online Help function
23
Page 24
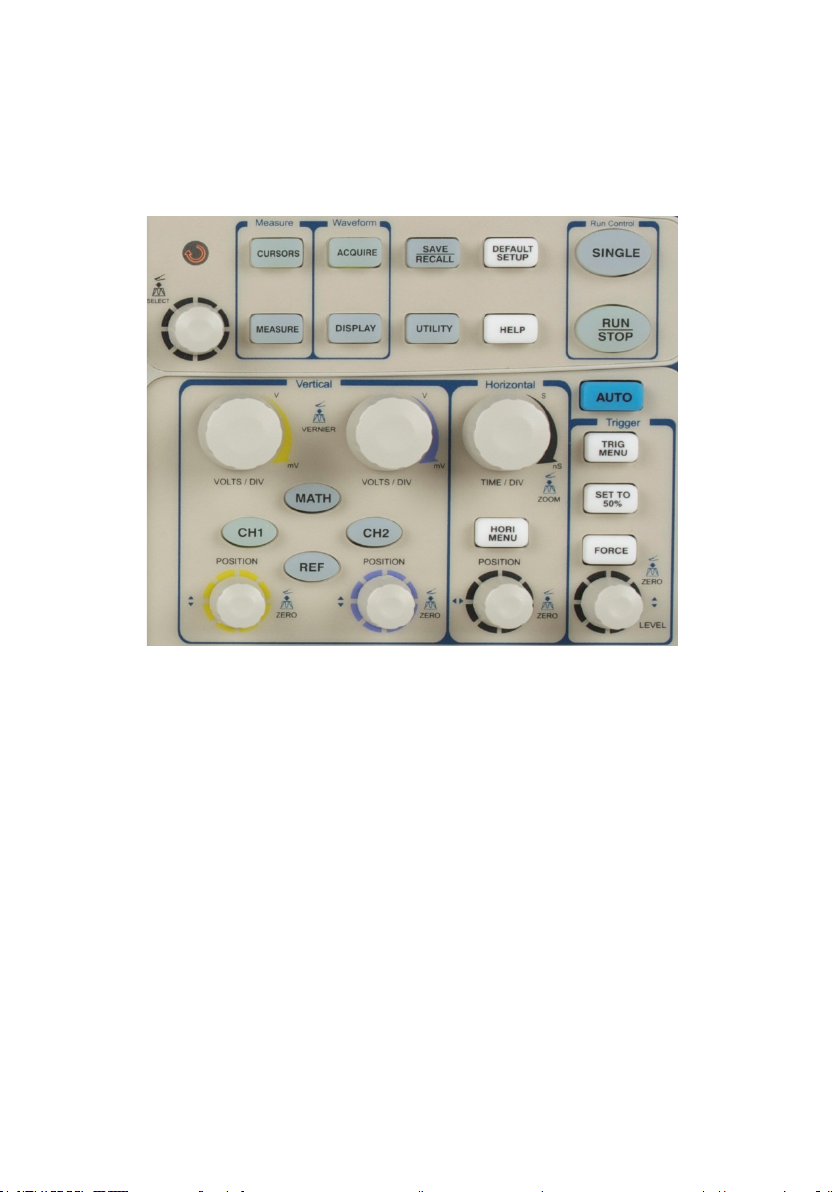
Menu and Control Button
Figure 10 - Control Buttons
Channel buttons (CH1, CH2): Press a channel button (CH1 or CH2) to
turn that channel ON or OFF and open the Channel menu for that channel .
You can use the channel menu to set up a channel. When t he channel is
ON, the channel button is lit.
MATH: Press to display the Math menu. You can use the MATH menu to
use the oscilloscope’s Math functions.
REF: Press to display the Ref Wave menu. You can use this menu to save
and recall reference waveforms to and from internal memory.
24
Page 25

HORI MENU: Press to display the Horizontal menu. You can use the
Horizontal menu to display the waveform and to zoom a segment of a
waveform.
TRIG MENU: Press to display the Tr igger menu. You can use the Trigger
menu to set the trigger type (Edge, Pulse, Video, Slope, Alternative) and
trigger settings.
SET TO 50%: Press to stabilize a waveform quickly. The oscilloscope can
set the trigge r level to be halfway between the minimum and maximum
voltage level automatically. This i s useful when you connect a signal to the
EXT TRIG connector and set the trigger source to Ext or Ext/5.
FORCE: Use the FORCE button to complete the current waveform
acquisition whether the oscilloscope detects a trigger or not. This is useful
for Single acquisitions and Normal trigger mode.
SAVE/RECALL: Press to display the Save/Recall menu. You can use the
Save/Recall menu to save and recall up to 20 oscilloscope setups and 10
waveforms to/from interna l memory or a USB memory device (limited by
memory capacity of the USB flash drive). You can also use it to recall the
default factory settings, to save waveform data as a comma-delimited file
(.CSV), and to save the di s played waveform image.
ACQUIRE: Press to display Acquire menu. You can use the Acquire menu
to set the acquisition Sampling Mode (Sampling, Peak Detect, Average).
MEASURE: Press to display a menu of measurement parameters.
CURSORS: Display the Cursor Me nu. Ver tic a l Position controls adjust
cursor position while displaying the Cursor Menu and the cursors are
activated. Cursors remain displayed (unless the “Type” option is set to
“Off”) after leaving the Cursor Menu but are not adjustable.
DISPLAY: Press to open the Display menu. You can use the Display menu
to set grid and waveform display styles, and persistence.
25
Page 26
UTILITY: Press to open the Utility menu. You can use the Utilit y menu to
Figure 11 - Connectors
configure oscilloscope features, such as sound, language, counter, etc. You
can also view system status and update software.
DEFAULT SETUP: Press to reset the oscilloscope’s settin gs to the default
factory configuration.
HELP: Enter the online help system.
AUTO: Automatically sets the o scilloscope controls to produce a usable
display of the input signals.
RUN/STOP: Continuously acquire s waveforms or stops the acquisition.
Note: If waveform acquisition is stopped (using the
RUN/STOP or SINGLE button), the TIME/DIV control
expands or compresses the waveform.
SINGLE: Acquire a single waveform and then stops.
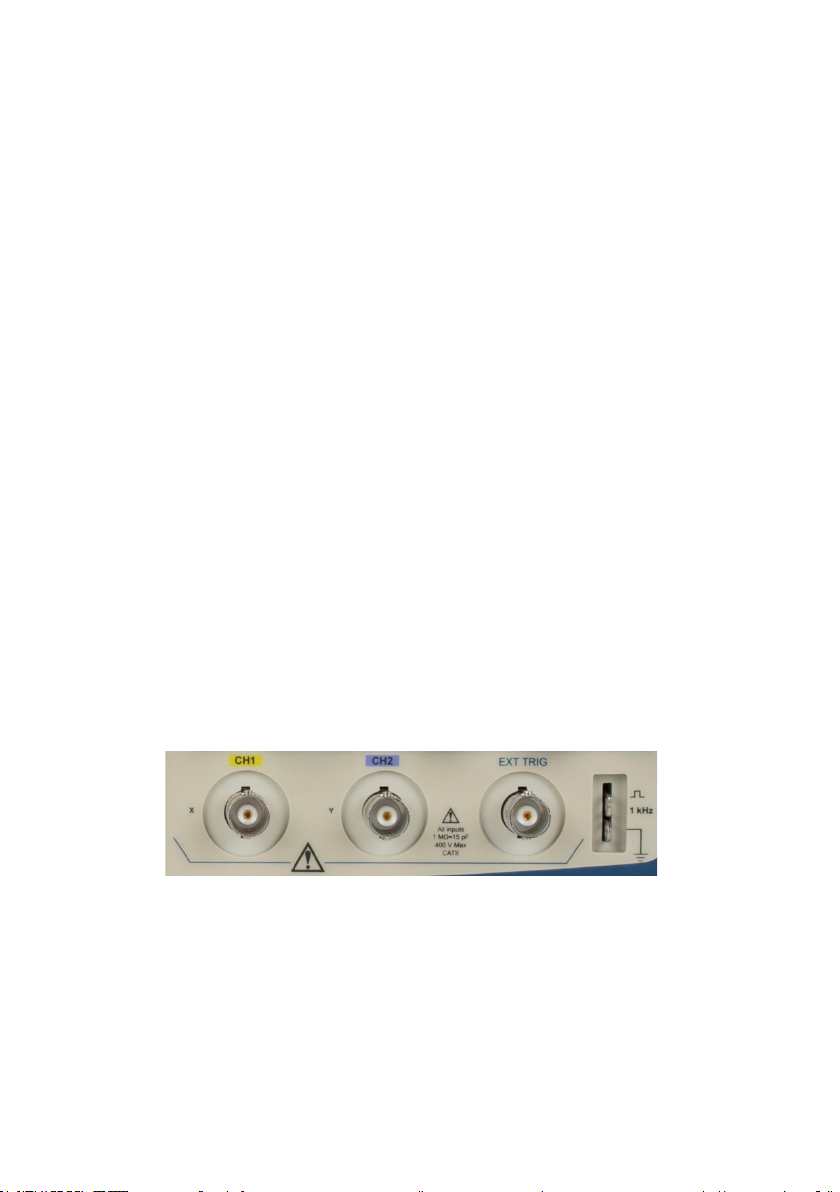
Connectors
Channel Connector (CH1, CH2): Input connectors for waveforms
display.
26
Page 27
EXT TRIG: Input connector for an external trigger source. Use the Trigger
Menu to select the “Ext” or “Ext/5” trigger source.
Probe Compensation: 1 kHz voltage probe compensation output and
ground. Use to electrically match the probe to the oscilloscope input
circuit.
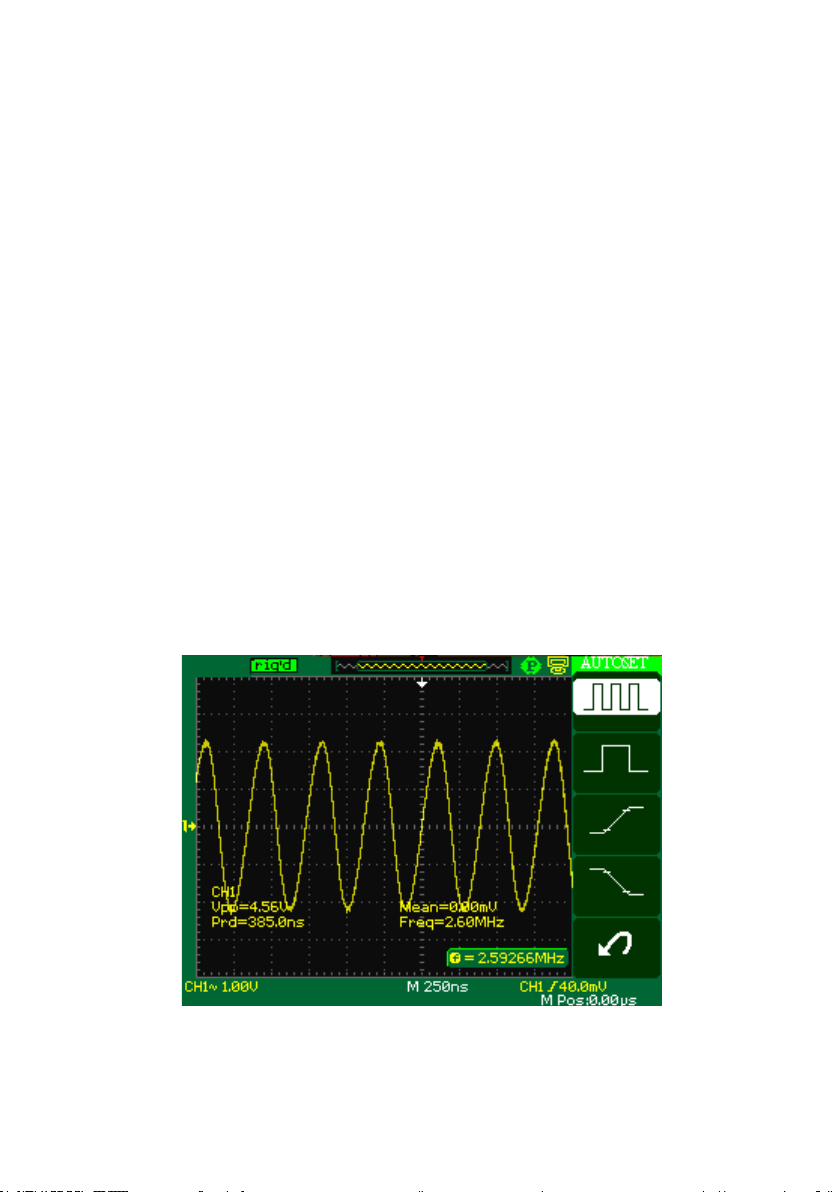
Auto Setup
The 2530B/2532B Digital Storage Oscilloscopes have an Auto Setup
function that identifies t he wa vefo r m types and automatically adjusts
controls to produce a usable display of the input signal.
Press the AUTO front panel button, and t hen press the menu option button
adjacent to the desired waveform as follows:
Figure 12 - Auto Setup
27
Page 28
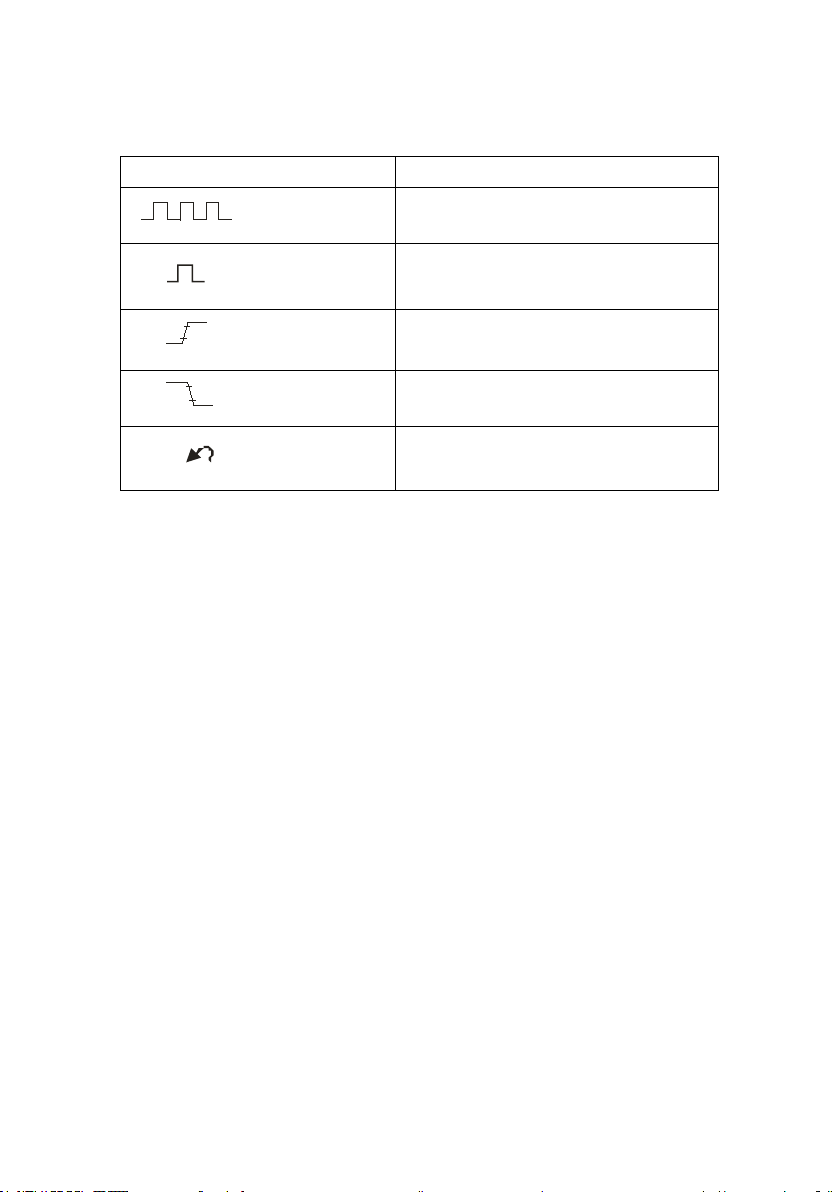
Table 1 - Autoset Menu
Option
Description
Auto set the screen and display
Set the screen and auto display single
Auto set and show the risi ng time.
Auto set and show the falling time.
Causes the oscilloscope to recall the
(Multi-cycle sine)
(Single-cycle sine)
several cycles signal.
cycle signal.
(Rising edge)
(Falling edge)
(Undo Setup)
previous setup.
Auto set determines the trigger source based on the following conditions:
• If multiple channels have signals, channel wit h the lowest
frequency signal.
• No signals found, the lowest-numbered channel displayed when
Auto set wa s invoked
• No signals found and no channels displayed, oscilloscope displays
and uses channel 1.
28
Page 29

Function
Setting
Acquire Mode
Adjusted to Sampling
Display Format
Y-T
Display Type
Set to Dots for a video signal, set to Ve c tors
Vertical Coupling
Adjusted to DC or AC according to the
V/div
Adjusted
VOLTS/DIV
Coarse
Signal inver ted
Off
Horizontal position
Center
TIME/DIV
Adjusted
Trigger type
Edge
Trigger so urce
Auto detect the channel which has the input
Trigger slope
Rising
Trigger mode
Auto
Trigger coupling
DC
Trigger holdoff
Minimum
Trigger le vel
Set to 50%
adjustability
Table 2 - Autoset Function Menu Items
for an FFT spectrum; otherwise, unchanged
input signal
signal
Note: The AUTO button can be disabled. Please see “Appendix C
Disabling Auto Function” for deta ils.
29
Page 30

Default Setup
The oscilloscope is set up for normal operation when it is shipped from the
factory. This is the default setup. To recall this setup, press the
DEFAULT SETUP button. For the default options, buttons and controls
when you pre s s the DEFAULT SETUP button, refer to “Appendix A
Default Setup”.
The DEFAULT SETUP butto n does not reset the following settings:
• Language option
• Saved reference waveform files
• Saved setup files
• Display contrast
• Calibration data
30
Page 31

Universal Knob
Figure 13 - Universal Knob
You can use the Universal knob with many functions, such as adj usting
the hold of f t ime, moving cursors, setting t he pulse widt h, setting the
video line, adjusting the upper and lo wer frequency limit, adjust X and Y
masks when using the pass/fail function, etc. You can also turn the
“Universal” knob to adjust the storage position of setups, wavefor ms,
pictures when saving/recalling, and to select menu options. With some
functions, the light indicator ab ove the knob will turn on to indicate that
the knob can be used to make changes or adjustments for that functio n.
The knob ca n also be pushed to make a selection after
changes/adjustments have been made.
31
Page 32

Vertical System
Figure 14 - Vertical System Controls
The vertical control could be used for displaying waveform, rectify scale
and position.
32
Page 33

Channel Function Menu
Option
Setting
Introduction
Coupling
DC
DC passes both AC and DC components of the
Volts/Div
Coarse
Selects the resolution of the Vo lts/Div knob
Probe
1X
Set to match the type of probe you are using to
Next Page
Page 1/2
Press this button to enter second page menu.
Table 3- Channel Function Menu
AC
GND
Fine
5X
10X
50X
100X
*ISFE
500X
1000X
input signal.
AC blocks the DC component of the input
signal and attenuates signals below 10 Hz.
GND disconnects the input s ignal.
Coarse defines a 1-2-5 sequence.
Fine changes the resolution to small steps
between the coarse settings.
ensure correct vertical readouts.
*Reserved for future use.
33
Page 34

Option
Setting
Instruction
Invert
on
Turn on inve rt function.
Filter
Press this button to enter the “Digital Filter
Next Page
Page 2/2
Press this button to return the fir st page me nu.
Option
Setting
Introduction
Filter
On
Turn on the digital filter.
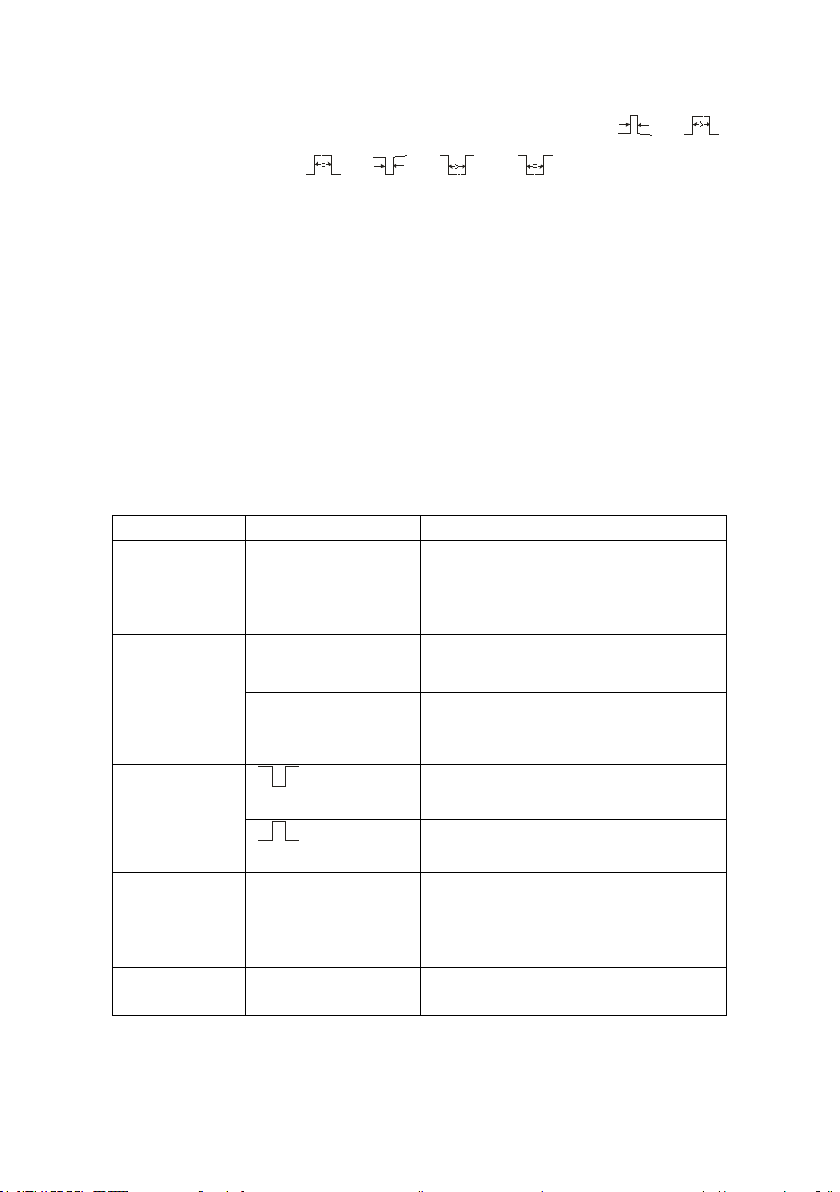
Type
Setup as LPF (Low Pass Filter).
Upper_limit
Turn the “Universal” kno b to set upper limit.
Lower_limit
Turn the “Universal” knob to set lower limit.
Return
Return to digital filter mai n menu.
off
Turn off invert function.
menu”.
Table 4 - Channel Function Menu 2
Off
Turn off the digital filter.
Setup as HPF (High Pass Filter).
Setup as BPF (Band Pass Filter).
Setup as BRF (Band Reject Filter).
Table 5 - Digital Filter Function Menu
34
Page 35

• “GND” Coupling: Use GND coupling to display a zero-volt
Note: ● The oscilloscope vertical response rolls off slowly above its
waveform. Internally, the channel input is connected to a zero-volt
reference level.
• Fine Resolution: The vertical scale readout displays the actual
Volts/Div setting while in the fine resolution setting. Changing the
setting to coarse does not change the vertical scale until the
VOLTS/DIV control is adjusted.
bandwidth. Therefore, the FFT spectrum can show valid frequency
information higher than the oscilloscope bandwidth. However, the
magnitude information near or above the bandwidth will not be
accurate.
● If the channel is set to DC couplin g, you can quickly measure the
DC component of the signal by simply noting its distance from the
ground symbol.
● If the channel is set to AC coupling, the DC component of the
signal is blocked allowing you to use greater sensitivity to display
the AC component of the signal.
Setting Up Channels
Each channel has its own separate Menu. The items are set up
separately according to each channel.
1. Setup Chan ne l Coupling
35
Page 36

Take the CH1 for example; the tested signal is a sine wave
signal with DC deflection:
• Press“CH1”→“Coupling”→“AC”, Set to AC couple mode.
This will block the DC component of the input signal.
Figure 15 - AC Coupling
• Press“CH1”→“Coupling”→“DC”, Set to DC couple mode.
Both DC and AC components of the input si gnal will be
captured.
36
Page 37

Figure 16 - DC Coupling
• Press“CH1”→“Coupling”→“GND”, Set to GROUND mode.
This disconnects the input signal.
Figure 17 - GND Coupling
37
Page 38

2. Volts/Div Settings
Vertical scale adjust have Coarse and Fine modes, Vertical
sensitivity range of 2 mV/div – 10 V/div.
Take CH1 for example:
• Press“CH1”→“Volts/Div”→“Coarse”. I t is the d e fault setting of
Volts/Div, and it makes the vertic a l sca ling in a 1-2-5-step
sequence from 2 mV/div, 5 mV/div, 10 mV/div to 10 V/div.
Figure 18 - Coarse Control
• Press CH1”→ Volts/Div”→ F ine”. This setting changes the
vertical control to small steps between the coarse settings. It will
be helpful when you need to adjust the waveform vertical size in
smaller steps.
38
Page 39

Figure 19 - Fine Control
3. Setting Probe Attenuation
In order to assort the attenuation coeffici ent, you need to respond in
the channel operation Menu. If the attenuation coefficient is 10:1, the
input coefficient should be set to 10X, so that the Volts/div
information and measurement testing is correct.
Take CH1 fo r example, when you use the 100:1 probe:
• Press“CH1”→“Probe” →“100X”
39
Page 40

Figure 20 - Setting Probe Attenuation
4. Inverting waveforms
Take CH1 for example:
• Press“CH1”→Next Page“ page1/2” →“Invert”→“On”:
Figure 21- Invert Waveform Screen
40
Page 41
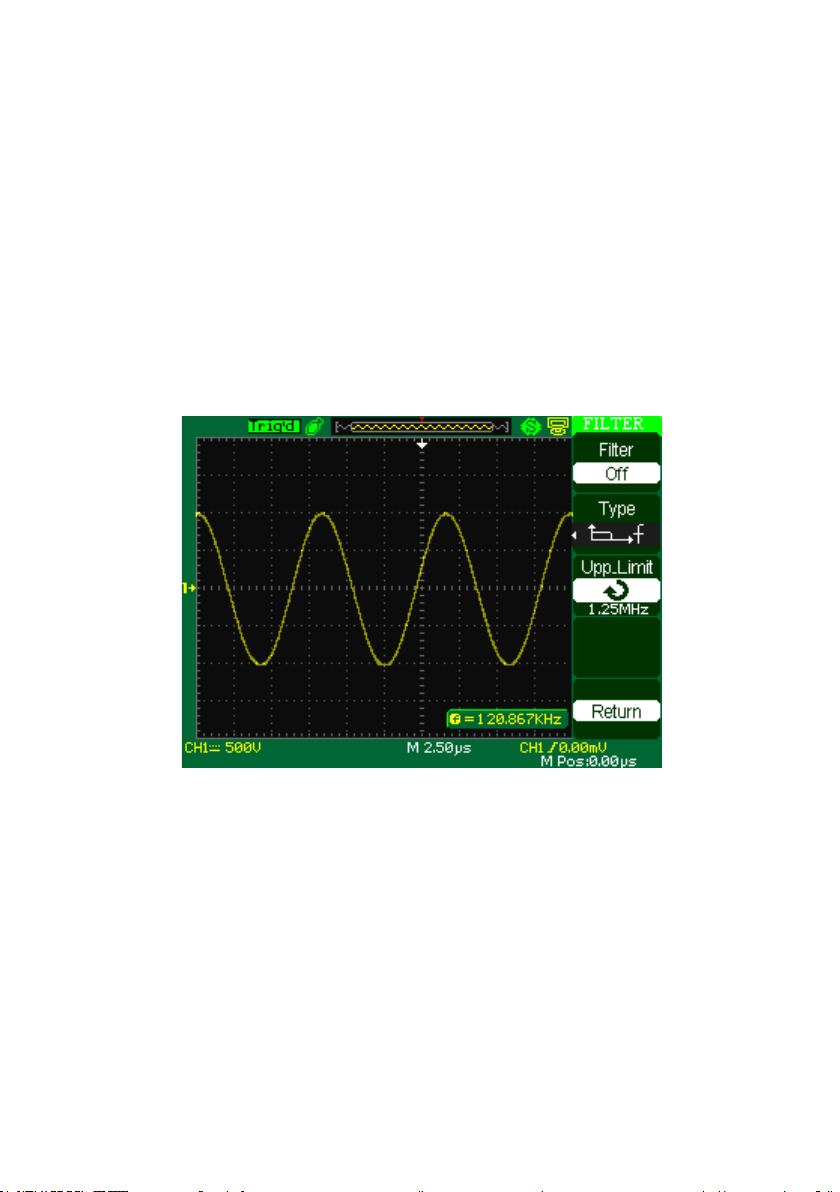
5. Using the Digit al Filter
Press “CH1”→“Next Page page1/2”→ “Filter”, display the d igital
filter menu. Select “Filter Type”, then select “Upper Limit” or “Lower
Limit” and t urn the “Unive rsal” knob to adjust them.
• Press “CH1”→“Next Page page1/2”→ “Filter” →“Off”. Turn
off the Digital Filter function.
Figure 22 - Digital Filter Menu
• Press “CH1”→ “Next Page page1/2”→ “Filter” → “On”.
Turn on the Digital Filter function.
41
Page 42
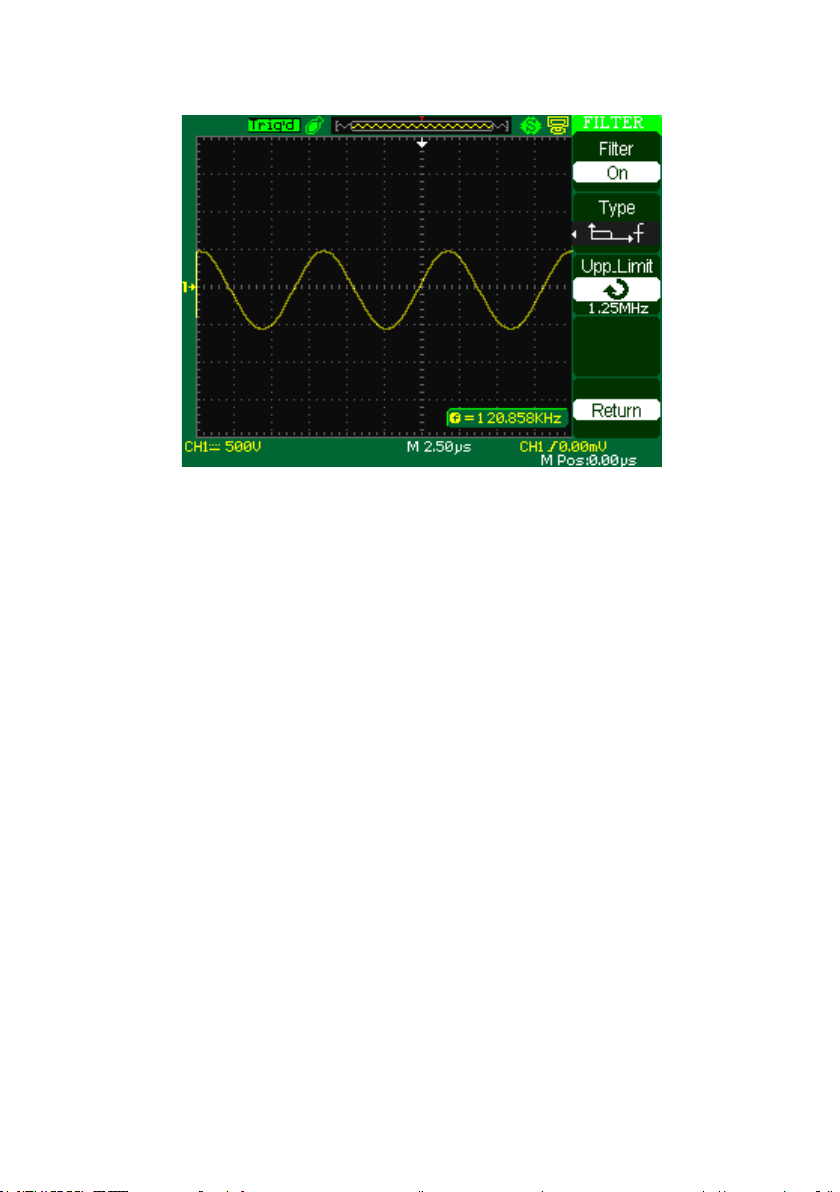
Figure 23 - Digital Filter Adjustment Screen
Using Vertical Position Knob and Volt/div Knob
• Vertical “POSITION” knob
1. Use the Vertical “POSITION” knobs to move the channel
wavefor ms up or down on the screen. This button’s reso lution
varies based on the vertical scale.
2. When you adjust the vertical position of channel waveforms,
the vertical position informati on will display on the bottom
left of the screen. For example “Volts Pos=24.6mV”.
3. Press the vertical “POSITION” knob to set the vertical
position to zero.
42
Page 43

• “Volts/div” knob
1. Use the “Volts/div” knobs to co ntrol how the oscilloscope
amplifies or attenuates the source si gnal of channel
waveforms. When you turn the “volts/div” knob, the
oscilloscope increases or decreases the vertical size of the
waveform on the screen with respect to the ground level;
2. When you press the “Volt/div” Knob, you can switch
“Volt/div” option between “Coarse” and “Fine”. The
vertical scale is set by th e 1-2-5 step in the Coarse.
Increase in the clockwise direction, decrease in the counter
clockwise direction. In the fine mode, the knob changes
the Volts/Div scale in small steps between the coarse
settings. Again, increase in the clockwise direction,
decrease in the counterclockwise direction.
Math Functions
Math shows the results after +,-,*, /, and FFT operation of CH1 and CH2.
Press the MATH button to display the wa veform math operations. Press the
MATH button again to remove the math waveform display.
43
Page 44

Table 6 - Math Function Menu
Function
Setting
Introduction
Operation
+, -. *, /, FFT
Math operations between signal source
CH1 Invert
on
Invert the CH 1 waveform.
CH2
on
Invert the CH 2 waveform.
Operation
Setting
Introduction
CH1+CH2
CH1 waveform adds CH2 waveform.
CH1-CH2
The channel 2 waveform is subtracted
CH2-CH1
The channel 1 waveform is subtracted
*
CH1*CH2
Source 1 multiply source 2.
/
CH1/CH2
The channel 2 waveform is divided by
the channel 1 waveform.
CH2/CH1
The channel 1 waveform is divided by
the channel 2 waveform.
FFT
Fast Fourier Transform.
CH1 and CH2.
Invert
+
-
off
off
Table 7 - Math Function Description
Turn off C H1 Invert function.
Turn off C H2 Invert function.
from the channel 1 waveform.
from the channel 2 waveform.
44
Page 45

Figure 24- CH1 added with CH2
MATH Waveform
FFT Spectrum Analyzer
The FFT process mathematically converts a time-domain signal into its
frequency components. You can use the M ath FFT mode to view the
following types of signals:
• Analyze the harmonic wave in a power cable.
• Test the harmonic content and d istortion in a system
• Show the Noise in a DC power supply
• Test the filter and pulse response in a system
• Analyze vibration
45
Page 46

FFT Option
Setting
Introduction
Source
CH1, CH2
Select this channel as the FFT source.
Window
Hanning
Select FFT window types.
FFT ZOOM
1X
Changes the horizontal magnification of the
Next Page
Page 1/2
Enter the second page of FFT menu.
FFT Option
Setting
Introduction
Scale
Vrms
Set Vrms to be the Vertical Scale unit.
dBVrms
Set dBVrms to be the vertical Scale u nit.
Split
Full screen
Display FFT waveform on half screen.
Display FFT waveform on full screen.
Page 2/2
Return the first page of FF T menu.
Table 8 - FFT Function Menu 1
Hamming
Rectangular
Blackman
2X
FFT display.
5X
10X
Table 9 - FFT Function Menu 2
Display
Next Page
To use the Math FFT mode, you need to pe rform the following tasks:
1. Set up the source (time-doma in) wa v efor m.
2. Press the AUTO button to display a YT waveform.
3. Turn the vertical “POSITION” knob to move the YT
waveform to the center vertically (zero divisions).
46
Page 47

4. Turn the horizontal “POSITION” knob to position the part
of the YT waveform that you want to analyz e in the center
eight divi sions of the scr een.
5. The oscilloscope calculates the FFT spectrum using the
center 1024 points of the time-domain wavefor m.
6. Turn the “Volts/div” knob to ensure that the entire
waveform remains on the screen.
7. Turn the “time/div” knob to provide the resolution you
want in the FFT spectrum.
8. If possible, set the oscilloscope to display many signal
cycles.
To display FFT correctly, follow these steps:
1. Push the “MATH” b ut ton.
2. Set the “Operation” option to FFT.
3. Press t he “Source” button to select “CH1” or “CH2”
according t o input signal channel.
4. According to Nyquist law, turn the “time/div” knob to adjust
the sampli ng rate (this parameter is displayed behind the time
base parameter), making sure it is at least double the input
signal freque nc y.
47
Page 48

Displaying the FFT Spectrum
Set dBVrms to
Time base
Sampling
FFT
Press the MATH button to display the Math Menu. Use the options to
select the Source channel, Window algorithm, and FFT Zoom factor. You
can display only one FFT spectrum at a time. You can select “Full screen”
or “Split” in “Display” option to display FFT waveform on full screen or
display channel waveform and its FFT waveform on half screen at a time.
Figure 25 - Math Function Screen
be the vertical
Scale unit
scale
window
type
rate
48
Page 49

Select FFT Window
Window
Characteristics
Applications
Rectangular
Best frequency resolution,
Symmetric transients
Hanning
Better frequency, poorer
Sine, periodic, and
Blackman
Best magnitude, worst
Single freque nc y
Windows reduce spectral leakage in the FFT spectrum. The FFT assumes
that the YT waveform repeats forever. With an integral number of cycles,
there are no discontinuities in the signal shape. A non-integral number of
cycles in the YT waveform cause the signal start and end points to be at
different amplitudes. The transitions between the start and end points cause
discontinuities in the signal that introduce high-frequenc y tra nsients.
Table 10 - FFT Window Instruction
Hamming
worst magnitude
resolution. This is
essentially the same as no
window.
magnitude a ccuracy than
Rectangular. Hamming has
slightly better frequency
resolution than Hanning.
49
or bursts.
Equal-ampli tude sine
waves with fixed
frequencies.
Broadband random
noise with a relatively
slo wly var ying
spectrum.
narrow-band random
noise. Asymmetric
transients or bursts.
Page 50

frequency resolution.
waveforms, to find
higher order
harmonics.
Magnifying and Positioning and FFT Spectrum
You can magnify and use cur sors to take measurements on the FFT
spectrum. The oscilloscope includes an “FFT Zoom” option to magnify
horizontally, press this option button to select “1X”, “2X”, “5X” or “10X”.
Moreover, you also can turn the “Universal” knob to magnify FFT
waveform horizontally in a 1-2-5 step. To magnify vertica lly; you can turn
the “Volts/div” knob.
Measuring an FFT Spectrum Using Cursors
You can take two measurements on FFT spectrums: magnitude (in dB ) and
frequency (in Hz). Magnitude is referenced to 0 dB, where 0 dB equals 1
VRMS. You can use the cursors to take measurements at any zoom factor.
Use horizontal cursors to measure amplitude and vertical cursors to
measure frequency.
If you input a sine signal to channel 1, follow these steps:
1. Measure F FT Amplitude
50
Page 51

1. Input a sine signal to channel 1, and press the “AUTO”
button.
2. Press the “MATH” button to enter the “MATH” menu.
3. Press the “Operation” option b utto n to se le ct “FFT”.
4. Press the “Source” option button to select “CH1”.
5. Press CH1 button to display CH1 menu.
6. Turn the “time/div” knob to adjust sampling rate (at least
double bigger than frequency of input signal).
7. If FFT display on full screen, press CH1 button again to
remove channel waveform display.
8. Press the “CURSOR” button to enter “Cursor” menu.
9. Press t he “Cursor Mode” button to select “Manual”.
10. Press the “Type” option button to sele c t “Voltage”.
11. Press the “Source” option button to select “FFT”.
12. Press the “CurA” option button; turn the “ Universal”
knob to move Cursor A to the highest point of the FFT
waveform.
13. Press the “CurB” option button, turn the “Universal”
knob to move Cursor B to the lowest point of the FFT
waveform.
14. The amplitude (△T) displays on the top of the left screen.
51
Page 52

Figure 26 - Measure FFT Screen
2. Measure FFT Frequency
1. Press t he CURSOR button.
2. Press t he “Cursor Mode” button to select “Manual”.
3. Press the “Type” option button to select “Time”.
4. Press the “Source” option button to select “FFT”.
5. Press the “CurA” option button, turn the “Univers al”
button to move Cursor A to the highest position of the
FFT waveform.
6. The value of CurA disp la ying on the top of t he left screen
is FFT highest Frequency. This frequency should be the
same as inpu t signal frequency.
52
Page 53

Figure 27 - Measure FFT Frequency Screen
NOTE:- The FFT of a waveform that has a DC component or offset
can cause incorrect FFT waveform magnitude values. To
minimize the DC component, choose AC Coupling on the
source waveform.
- To display FFT waveforms with a large dynamic range, use
the dBVrms scale. The dBVrms scale displays component
magnitudes using a log scale.
- The Nyquist frequency is t he highest frequency that a ny
real-time digitizing oscilloscope ca n ac quire without
aliasing. This frequency is half that of t he sample rate
provided it is within the analog ba ndwidth of the
oscilloscope. Frequencies above the Nyquist frequency will
be under sampled, which causes aliasing.
53
Page 54

Using REF
Option
Setting
Introduction
Source
CH1,CH2,
Choose the waveform display to store.
REFA
REFB
Choose the reference location to store or
recall a waveform.
Save
Stores source waveform to the chosen
REFA/REFB
on
Recall the reference waveform on the
Turn off the reference waveform.
The reference control saves waveforms to a nonvolatile waveform memory.
The reference function becomes available after a waveform has been saved.
Table 11 - REF Function Menu
CH1 off
CH2 off
reference location.
off
Press the Ref button to display the “Reference waveform menu”.
Figure 28 - Reference Waveform Menu
screen.
54
Page 55

Operation step:
1. Press the “REF” menu button to display the “Reference
waveform menu”.
2. Press the “Source” option button to select input signal
channel.
3. Turn the vertical “P OSITION” knob and “Volt/div” knob to adjust
the vertical position and scale.
4. Press t he third option button to select “REFA” or “REFB” as
storage position.
5. Press the “Save” option button.
6. Press the bottom option button to select “REFA On” or
“REFB On” to recall the reference waveform.
Figure 29 - REF Waveform Menu
55
Page 56

Option
Setting
Description
Delayed
On
Turn on this function for
wavefor m on the screen.
Note: - X-Y mode waveforms are not stored as reference waveforms.
- You cannot adjust the horizontal position and scale of the
reference waveform.
Horizontal System
Shown below, there is one button and two knobs in the HORIZONTAL
area.
Table 12 - Horizontal System Function Menu
Off
main timebase waveform
to display on the top half
screen and window
timebase waveform to
display on the below half
screen at the same time.
Turn off this function to
only display main timebase
Horizontal Control Knob
You can use the horizontal controls to change the horizontal scale and
position of waveforms. The horizontal position readout shows the time
represented by the center of the screen, using the time of the trigger as zero.
56
Page 57

Changing the horizontal scale causes the waveform to expand or contract
around the screen center.
• Horizontal “POSITION” knob
1. Adjust the horizontal position of all channels and
math wavefo rms (the positi on of the trigge r relative
to the center of the screen). The resolution of this
control varies with the time base setting.
2. When you press the horizontal “POSITION” Knob ,
you can set the horizontal position to zero.
• “time/div” knob
1. Used to change the horizontal time scale to magnify
or compress the waveform. If waveform acquisition is
stopped (using the RUN/STOP or SINGLE button),
turn the time/div knob to expand or compress the
waveform.
2. Select the horizontal time/div (scale factor) for the
main or the window time bas e. When Window Zone is
enabled, it changes the width of the window zone by
changing the window time b ase.
57
Page 58

• Display scan mode:
When the TIME/DIV control is set to100 ms/div or slower and the trigger
mode is set to Auto, the oscilloscope enters the scan acquisition mode. In
this mode, the waveform display updates from left to right. There is no
trigger or horizontal position control of waveforms during scan mode.
Window Zone
Use the Window Zone option to define a segment of a waveform to see
more detail. This fu nction behave s like zooming into a portion of the
captured waveform. The window time base setting cannot be set slower
than the Main time base setting.
You can turn the Horizontal Position and TIME/DIV co ntrols to enlarge or
minimize waveforms in the Window Zone.
If you want to see a section of the waveform in details, follow these steps:
1. Press the “HORI MENU” button to enter the “Horizontal menu”.
2. Turn the “time/div” knob to change the main timebase scale.
3. Press t he “Delayed” option button to select “On”.
58
Page 59

Figure 30 - Horizontal Delay Menu
4. Turn the “Horizontal Position” knob (adjust window’s position) to
select the window that you need and expanded window waveform
display will show on the below half of the screen at the same time.
Trigger System
The trigger d etermines when the oscilloscope starts to acquire data and
display a waveform. When a trigger is set up properly, the oscilloscope
converts unstable displays or blank screens into meaningful waveforms.
Here are thr ee buttons and one knob in the tr igger area. See below:
59
Page 60

• “TRIG MENU” Button: Press the “TRIG M ENU” Button to
display the “Trigger Menu”.
• “LEVEL” Knob: The LEVEL knob is to set the corresponding
signal voltage of trigger point in ord e r to sample. Press the
“LEVEL” knob to set trigger level to zero.
• “SET TO 50%” Button: Use the “SET TO 50%” button to
stabilize a waveform quickly. The oscilloscope can set the Trigger
Level to be about halfway between the minimum and maximum
voltage levels automatically. This is useful when you connect a
signal to the EXT TRIG BNC and set the tr igger source to Ext or
Ext/5.
• “FORCE Button: Use the FORCE button to complete the current
waveform acquisition whether the oscilloscope detects a trigger or
not. This is useful for SINGLE acquisitions and Normal trigger
mode.
• Pre-trigger/Delayed trigger: The data before and after trigger at
the trigger position is typically set a t the horizontal center of the
screen, in t he full-screen display the 6div data of pre-trigger and
delayed trigger can be surveyed. More data of pre-trigger and 1s
delayed trigger can be surveyed by adjusting the horizontal
position.
60
Page 61

The feature is very useful because you can see the events that led
up the trigger point. Everything to the right o f the trigger point is
the post-trigger information. The amount of delay range (pre-
trigger and post-trigger informatio n) available is dependent on t he
sweep speed selected.
Signal Source
You can use the Trigger Source options to select the signal that the
oscilloscope uses as a trigger. The source can be any signal connected to a
channel BNC, to the EXT TRIG BUS, or the AC power line (available only
with Edge T rigger).
Trigger Type
The scopes have five trigger types: Edge, Video, Pulse, Slope, and
Alternative.
Edge Trigger
Use Edge triggering to trigger o n the ed ge of the oscilloscope input signal
at the trigger threshold.
61
Page 62

Table 13 - Edge Trigger Function Menu
Option
Setting
Explain
Type
Edge
With Edge highlighted, the rising or falling edge
Source
CH1
Triggers o n a channel whether or not the
EXT
Does not display the trigger signal; the Ext option
EXT/5
Same as Ext option, but attenuates the signal by a
range.
AC Line
This selection uses a signal der ived from the
Slope
Trigger on R ising edge of the trigger signal.
trigger signal.
Mode
Auto
Use this mode to let the acquisition free-run in
Normal
Use this mode when you want to see only valid
Single
When you want the oscilloscope to acquire a
“SINGLE” button.
Set up
Enter the “Trigger Setup Menu” (See below
of the input signal is used for the trigger.
CH2
waveform is displayed.
uses the signal connected to the EXT TRIG frontpanel BNC and allows a trigger level range of -
1.2 V to +1.2 V.
factor of five, and allows a trigger level range of
+6 V to -6 V. This extends the trigger level
power line as the trigger source; trigger coupling
is set to DC and the trigger level to 0 volts.
Trigger on Falling edge of the trigger si gnal.
Trigger on R ising edge and F alling edge o f the
the absence of a valid trigger. This mode scans
waveform at 100 ms/div or slower time base
settings.
triggered wave fo rms; when you use this mod e ,
the oscilloscope does not display a waveform
until after the first trigger.
single capture of a waveform, press the
table).
62
Page 63

Table 14 - Trigger Setup Function Menu
Option
Setting
Explain
Coupling
Blocks DC components, attenuates signals below
50 Hz.
Attenuates the high-frequency components above
150 kHz.
Blocks the DC component attenuates the lowfrequency components below 7 kHz.
Holdoff
Using the “universal” knob to adjust holdoff time
Holdoff
Reset holdoff time to 100 ns.
Return
Return the first page of “Trigger main menu”.
DC Passes all components of the signal
AC
HF Reject
LF Reject
Reset
(sec), the holdoff value is displayed.
Figure 31 - Trigger Menu Screen
63
Page 64

Operating Instructions:
1. Set up Type
1) Press the “TRIG MENU” button to display “Trigger”
menu.
2) Press the “Type” option button to select “Edge”.
2. Set up Source
According to input signal, press the “Source” option button to
select “CH1”, “CH2”, “EXT”, “EXT/5”or “AC Line”.
3. Set up Slope
Press the “Slope” option button to selec t “ ” , “
” or “ ”.
4. Set up Trigge r mode
Press the “Trigger mode” optio n b utto n to sele c t “Auto”,
“Normal”, “Single”.
Auto: The waveform refresh at a high speed whether the
trigger condition is
satisfied or not.
Normal: The waveform refresh when the t rigger
condition is satisfied and waits for next trigger event
occurring when the trigger condition is not satisfied.
64
Page 65

Single: The oscilloscope acquire a waveform when the
Option
Setting
Explain
Type
Pulse
Select the pulse to trigger
trigger condition.
Source
CH1
EXT/5
Select input signal
trigger condition is satisfied a nd then stops.
5. Set up Trigge r coupling
• Press the “Set up” button to enter the “Trigger Setup
Menu”.
• Press the “Coupling” option button to select “DC”,
“AC”, “HF Reject” or “LF Reject”.
Pulse Trigger
Use Pulse Wi dth triggering to trigger on a berrant pulses.
Table 15 - Pulse trigger Function Menu 1
CH2
EXT
the pulse match the
source.
65
Page 66

When
(Positive pulse width less than
pulse width setting)
Select how to compare
Set Width
20.0 ns~10.0 s
Selecting this option can
up the pulse width.
Next Page
Page 1/2
Press this button to enter
the second page.
pulse width setting)
(Positive pulse width larger
the trigger pulse relative
to the value selected in
the Set Pulse Width
option.
than pulse width setting)
(Positive pulse width equal to
pulse width setting)
(Negative pulse width less
than pulse width setting)
(Negative pulse width larger
than pulse width setting)
(Negative pulse width equal to
turn the uni versal to set
Figure 32 - Pulse Trigger Menu Screen
66
Page 67

Table 16 - Pulse Trigger Function Menu 2
Option
Setting
Explain
Type
Pulse
Select the pulse to trigger the pulse
Mode
Auto
Select the type of triggering; Normal
Set up
Enter the “T rigger setup menu”.
Next Page
Page 2/2
Press this button to return the first page.
match the trigger condition.
Normal
single
mode is best for most Pulse Width
trigger applications.
Figure 33 - Pulse Trigger Menu 2
Operating Instructions:
1. Set up Type
1) Press the “TRIG MENU” button to display “Trigger
menu”.
2) Press the “Type” option button to select “Pulse”.
2. Set up condition
67
Page 68
Press the “When” option button to select “
Option
Setting
Instruction
Type
Video
When you select the video type,
and SECAM video signal.
Source
CH1
Select the input source to be the
EXT
Ext and Ext/5 use the signa l
connector as the source.
Polarity
Normal triggers on the negative
Inverted tr iggers on the positive
Sync
All lines
Even Field
Next Page
Page 1/2
Enter the second page of
“Video trigger menu”.
”, “ ”, “ ”, “ ”or “ ”.
3. Set up pulse width
Turn the “Universal” kno b to set up width.
Video Trigger
Trigger on fi elds or lines of standard video signals.
Table 17 - Functional Menu of Video Trigger 1
put the coupl e set to the AC, then
you could trigger the NT S C , PAL
”, “
CH2
EXT/5
(Normal)
(Inverted)
Line Num
Odd field
trigger signal.
applied to the EXT TRIG
edge of the sync pulse.
edge of the sync pulse.
Select appropriate video sync.
68
Page 69

Option
Setting
Instruction
Type
Video
When you select the video
SECAM video signal.
Standard
NTSC
Pal/Secam
Select the video standard for sync
and line number count.
Mode
Auto
Use this mode to let the
of a valid trigger.
Normal
Use this mode when yo u wa nt to
first trigger.
Single
When you want the oscilloscope
press the “SI NGLE ”butto n.
Set up
Enter the “T rigger setup menu”.
Figure 34 - Video Trigger Screen
Table 18 - Functional Menu of Video Trigger 2
type, put the couple set to
the AC, the n you could
trigger the NTSC,PAL and
acquisition free-run in the absence
see only valid triggered
wavefor ms; when you use this
mode, the oscilloscope does not
display a waveform until after the
to acquire a single waveform,
69
Page 70

Next Page
Page 2/2
Return the first page of “Video
Trigger menu”.
Operating Instructions:
Set up Type
1. Pre s s the “TRIG MENU” button to d isplay “Trigger” menu.
2. Press the “T ype” o ption button to select “Video”.
Set up Polarity
1. Press the “Polarity” option button to select “
Set up Synchronization
1. Press the “Sync” option button to select “All Lines”, “Line
Num”, “Odd Field”, and “Even Field”.
” or “ ”.
70
Page 71

2. If you select “Line Num”, you can turn the “Universal” knob
Option
Setting
Instruction
Type
Slope
Trigger on positive slope of
time of the oscilloscope.
Source
CH1
EXT/5
Select trigger source.
When
Select trigger condition.
to set the appointed line number .
Set up Standard
1. Press the “next Page Page2/2” option button.
2. Press the “Standa rd” option button to select “PAL/SECAM ”
or “NTSC”.
Slope Trigger
Trigger on positive slope or negative slope according to setup time of the
oscilloscope.
Table 19 - Slope Trigger Function Menu 1
negative slope according to setup
CH2
EXT
71
Page 72

Time
Turn the “Universal” knob to set
20ns-10s.
Next Page
Page 1/2
Enter the second page of slope
trigger.
Option
Setting
Instruction
Type
Slope
Trigger on positive slope of
< Set Time>
slope time. Time setup range is
Figure 35 - Slope Trigger Menu
Table 20 - Slope Trigger Function Menu 2
negative slope according to
setup time of the oscilloscope.
72
Page 73

Vertical
Select the trigger level that can
Use this mode to let the acquisition
ms/div or slower time base settings.
Use this mode when you want to see
the first trigger.
When you want the oscilloscope to
“SINGLE” button.
Enter the “T rigger setup menu” (See
table 2-14).
Next Page
Page 2/2
Return the first page of slo pe trigger.
Auto
be adjusted by “LEVEL” knob.
You can adjust “LEVEL A”,
“LEVEL B” or adjust them a t
the same time.
free-run in the absence of a valid
trigger; This mode allows an
untriggered, scanning waveform at 100
Mode
Normal
Single
Set up
only valid trig ger ed waveforms; when
you use this mode, the oscilloscope
does not display a waveform until after
acquire a single waveform, press the
73
Page 74

Figure 36 - Slope Trigger Menu 2
Operating Instructions:
Follow next steps if you select “Slope trigger”:
1. Input a signal to CH1 or CH2.
2. Press t he “AUTO” button.
3. Press t he “T RIG ME NU” button to e nter “Trigger men u”.
4. Press t he “Type” option button to select “Slope”.
5. Press t he “Source” option butto n to se le c t “CH1” or “CH2”.
6. Press t he “When” option button to select “ ”, “
”, “ ”, “ ”, “ ” or “
”.
74
Page 75

7. Press t he “Time” button and turn the “Universal” knob to
adjust slope time.
8. Press t he “Next Page - Page 1/2” option button to enter the
second page of the “Slope trigger menu”.
9. Press t he “Vertical” option button to select a trigger level
that can be adjusted.
10. Turn the “LEVEL” knob.
Alternative Trigger
The trigger signal comes from two vertical channels when you use
alternative trigger. In this mode, you can observe two irrelative signals at
the same time. You can select different trigger types for two vertical
signals. Different types include edge, pulse, video, and slope trigger.
Trigger info rmation for both chan nels will display on the bottom right of
the screen.
Figure 37 - Alternate Trigger Menu
75
Page 76

Option
Setting
Instruction
Type
Alternative
The trigger signal comes from two vertical
signals at the same time.
Enter the “T rigger setup menu” (See table 2-
14).
Option
Setting
Instruction
Type
The trigger signal comes from two
the same time.
Set trigger type information for CH1
signal.
Table 21 - Set Trigger Mode to Edge Trigger Function Menu 1
channels when you use alternative trigger. In
this mode, you can observe two irrelative
Source
CH1
CH2
Mode Edge
Slope
Set trigger type information for CH1 signal.
Set trigger type information for CH2 signal.
Set trigger type of the vertical channel signal
to Edge.
Triggering on rising edge.
Triggering on falling edge.
Triggering on rising edge and falling edge.
Set Up
Table 22 - Set Trigger Mode to Pulse Trigger Function Menu 1
Alternative
vertical channels when you use
alternative trigger. In this mode, you
can observe two irrelative signals at
Source
CH1
CH2
Mode Pulse
signal.
Set trigger type information for CH2
Set trigger type of the vertical
channel signal to Pulse trigger.
76
Page 77

Enter the second page of Alternative
trigger menu.
Option
Setting
Explain
Set Width
20.0 ns~10.0 s
Selecting this option ca n turn the
Set up
Enter the “Trigger Setup Menu”
(see table 2-14).
Next Page
Page 2/2
Press this button to return to the
first page.
Option
Setting
Instruction
Type
Alternative
The trigger signal comes from two
same time.
Set trigger type information for CH1
signal.
Select how to compare the trigger
pulse relative to the value selec te d in
the Set Pulse Width option.
When
Next Page Page 1/2
Table 23 - Set Trigger Mode to Pulse Trigger Function Menu 2
universal to set up the pulse width.
Table 24 - Set Trigger Mode to Video Trigger Function Menu 1
Source
CH1
CH2
Mode Video
vertical chan ne ls wh e n you us e
alternative trigger. In this mode, you can
observe two irrelative signals at the
signal.
Set trigger type information for CH2
Set trigger type of the vertical channel
signal to Video trigger.
77
Page 78

Option
Setting
Instruction
Sync
All lines
Select appropriate video sync.
Standard
NTSC
Select the video standard for sync and
Enter the second page of Alternative
trigger menu.
Option
Setting
Instruction
Type
Alternative
The trigger signal comes from two vertical
irrelative signals at the same time.
Set trigger type information for CH1
signal.
Set trigger type of the vertical channel
signal to slope trigger.
Polarity
Normal triggers on the negative edge of
(Normal)
(Inverted)
the sync puls e.
Inverted tr iggers on the positive edge of
the sync puls e.
Next Page Page 1/2
Enter the second page of Alternative
trigger menu.
Table 25 - Set Trigger Mode to Video Trigger Function Menu 2
Line Num
Odd field
Even Field
Pal/Secam
line number count.
Next Page Page 1/2
Table 26 - Set Trigger Mode to Slope Trigger Function Menu 1
channels when you use alte rnative trigge r.
In this mode, you can observe two
Source
CH1
CH2
Mode Slope
signal.
Set trigger type information for CH2
78
Page 79

Enter the second page of the alternative
trigger.
Option
Setting
Instruction
Time
(Set time)
Turn the “Universal” knob to set the slope
time. Time setup range is 20ns-10s.
Vertical
Select the trigger level that can be
Set up
Enter the “T rigger setup menu” (see table
2-14).
Next Page
Page 2/2
Return the first page of “Alternative
trigger menu”.
When
Select slope trigger condition.
Next Page Page 1/2
Table 27 - Set Trigger Mode to Slope Trigger Function Menu 2
adjusted by “LEVEL” knob. You can
adjust “LEV E L A”, “LEVEL B” or adjust
them at the same time. Selections depend
on slope trigger condition.
79
Page 80

Operation Instructions:
To observe two irrelative channel signals, follow these steps :
1. Input two irrelative signals to channel 1 and channel 2.
2. Pre s s the AUTO button.
3. Press the TRIG M E N U button to enter “trigger men u”.
4. Press t he “Type” option button to select “Alternative”.
5. Press t he “Channels” option button to select “CH1-CH2”
6. Press t he “Source” option butto n to se le c t “CH1”.
7. Pre s s the CH1 button a nd turn the “time/div” knob to
optimize waveform display.
8. Press “Mode” option button to select “Edge”, “Pulse”,
“Slope” or “Video”.
9. Set the trigger according to trigger edge.
10. Press the “Source” option button to select “CH2”.
11. Press the CH2 button and turn the “time/div” knob to
optimize waveform display.
12. Repeat steps 8 and 9.
80
Page 81

Coupling
Use “Coupling” to make sure the signal passes through the trigger circuit.
It is useful for obtaining a steady wave form.
If you use trigger coupling, you should press the “TRIGGER” button and
then select “Edge”, “Pulse”, “Video”, or “Slope” trigger. Then select the
“coupling” option in the “Set Up menu”.
Position
The horizontal position control establishes the time between the trigger
position and the screen center. You can adjust the horizontal “POSITION”
knob control to view waveform data before the trigger, after the trigger, or
some of each. When you change the horizontal position of a wavefor m, yo u
are changing the time between the trigger and the center of the display
actually. (This appears to move the waveform to the right or left on the
display.)
Slope and Level
The Slope and Level controls help to define the trigger. The Slope option
(Edge trigger type only) determines whether the oscilloscope finds the
trigger poi nt on the rising or the falling e dge of a signal.
81
Page 82

The TRIGGER LEVEL knob controls where on the edge the
Note: ● Press the SING LE but to n whe n yo u wa nt the oscilloscope to
horizontal sync pulses, use the I nverted Polarity selection.
trigger point occurs
.
Figure 38 - Rise and Fall Edge
acquire a single waveform.
● Trigger coupling affects only the signal passed to the trigger
system. It does not affect the bandwidth or coupling of the
signal displ ayed on the screen.
● Normal Polarity Sync triggers always occur on negat ive-going
horizontal sync pulses. I f t he video waveform has posit ive-going
Trigger Holdoff
You can use the Trigger Holdoff function to produce a stable display of
complex waveforms. Holdoff is time between when the oscilloscope
detects one trigger and when it is ready to detect another. The oscilloscope
82
Page 83

will not trigger during the holdoff time. F or a pulse trai n, you can adjus t the
Holdoff time
Trigger position
Trigger level
Note :● Use trigger holdoff to help stabilize the display of a periodic
holdoff time so the oscilloscop e tr iggers o nly on the first pulse in the train.
Figure 39 - Trigger Holdoff
If you want to change holdoff time, please follow the steps below:
1. Press the “TRIG MENU” but t on to sho w the “TRIG
Menu”.
2. Press the “Type” option button to selec t trigger type.
3. Press the “Set Up” option button to enter the
“Trigger setup menu”.
4. Press the “Holdoff” option button and turn the
“Universal” knob to change the holdoff time until the
wavefor m triggers steadily.
waveform.
83
Page 84

Acquiring Signals System
Option
Setting
Introduction
Acquisition
Sampling
Use for sampling and accurately display
Peak Detect
Detect the noise and decrease the
Average
Use to reduce random or uncorrelated
Averages
Sinx/x
On
Use sin interpolation.
Mode
Equ time
Set the Sampling mode to Equ time.
Sa Rate
Display system sampling rate.
Shown below is the “ACQUIRE” button for entering the menu for
“Acquiring Signals”.
Table 28- Acquiring Signals Function Menu
most of the wav eform.
possibility of aliasing.
noise in the signal display.
(4, 16, 32, 64,
128, 256)
off
Real time
When you acquire a signal, the osc illoscope converts it into a digital form
and displays a waveform. The acquisition mode defines how the signal is
digitized and the time base setting affects the time span and level of detail
in the acquisition.
Select number of averages.
Use linear interpolation.
Set the Sampling mode to Real time.
84
Page 85

• Sampling: In this acquisition mode, the oscillosco pe samples the
signal in evenly spaced intervals to c onstruct the waveform. This
mode accurately represents signals most of the time.
Advantage: You can use this mode to reduce random noise.
Disadvantage: This mode does not acquire rapid variations in the
signal that may occur between samples. T his can result in aliasing,
which may cause narrow pulses to be missed. In these cases, you
should use the Peak Detect mode to acquire data.
Figure 40 - Acquire Menu
• Peak Detect: Peak Detect mode capture the maximum and
minimum values of a signal Finds highest and lowest record points
over many acquisitions.
85
Page 86

Advantage: In this way, the oscilloscope can acquire and display
narrow pulses, which may have otherwise been missed in Sample
mode.
Disadvantage: Noise will appear to be higher in this mode.
Figure 41 - Peak Detect
• Average: The oscilloscope acquires several waveforms, averages
them, and displays the resulting waveform.
Advantage: You can use this mode to reduce random noise.
86
Page 87

Figure 42 - Acquisition Averaging Screen
• Equivalent Time Sampling: The equivalent time sampling mode
can achieve up to 10 GSa/s.
• Real Time Sampling: The oscilloscope’s maximum real-time
sampling rate is 500 MSa/s.
• “RUN/STOP” Button: Press the RUN/ST OP button when you
want the oscilloscope to acquire waveforms continuously. Pre s s
the button again to stop the acquisition.
• “SINGLE” Button: Press the SINGLE button to acquire a single
waveform. Each time you push the SINGLE button, the
oscilloscope begins to acquire another waveform. After the
87
Page 88

oscilloscope detects a trigger it completes the acquisition and
stops.
When you push the RUN/STOP or SINGLE buttons to start an
acquisition, the oscilloscope goes through the following steps:
1. Acquire enough data to fill the portion of the waveform
record to the left of the trigger point. This is also called the
pre-trigger.
2. Continue to acquire data while waiting for the trigger
condition to occur.
3. Detect the trigger co nd ition.
4. Continue to acquire data until the waveform record is full.
5. Display the newly acquired waveform.
• Time Base: The o scilloscope digitizes waveforms by acquiring
the value of an input signal at discrete points. The time base
allows you to control how often the values are digitized. To adjust
the time base to a horizontal scale that suits your purpose, use the
time/div knob.
• Time Domain Aliasing: Aliasing occurs when the oscilloscope
does not sample the signal fast enough to construct an accurate
waveform record. When this happens, the oscilloscope displays a
88
Page 89

wavefor m with a frequency lower than the actual input waveform,
Sampled points
Apparent low-frequency
waveform due to aliasing
Actual high-frequency waveform
or triggers and displays an unstable wa veform.
Figure 43 - Time Domain Aliasing
Operating Instructions:
Set up Sampling For mat
You can press the “Acquisition” optio n button or turn t he “Universal”
knob to select “Sampling” mode, “Peak Detect” mode or “Average” mode.
Set up Averages
When you select “Average” format, you can press the “Averages” option
button to select “4”, “16”, “32”, “64”, “128” or “256”.
Set up function interpola tion
You can also turn Sinx/x interpolation on or off. Press the corresponding
option button to turn Sinx/x on or off.
89
Page 90

Figure 44 - "On" for Sine Interpolation
Figure 45 - "Off" for Linear Interpolation
90
Page 91
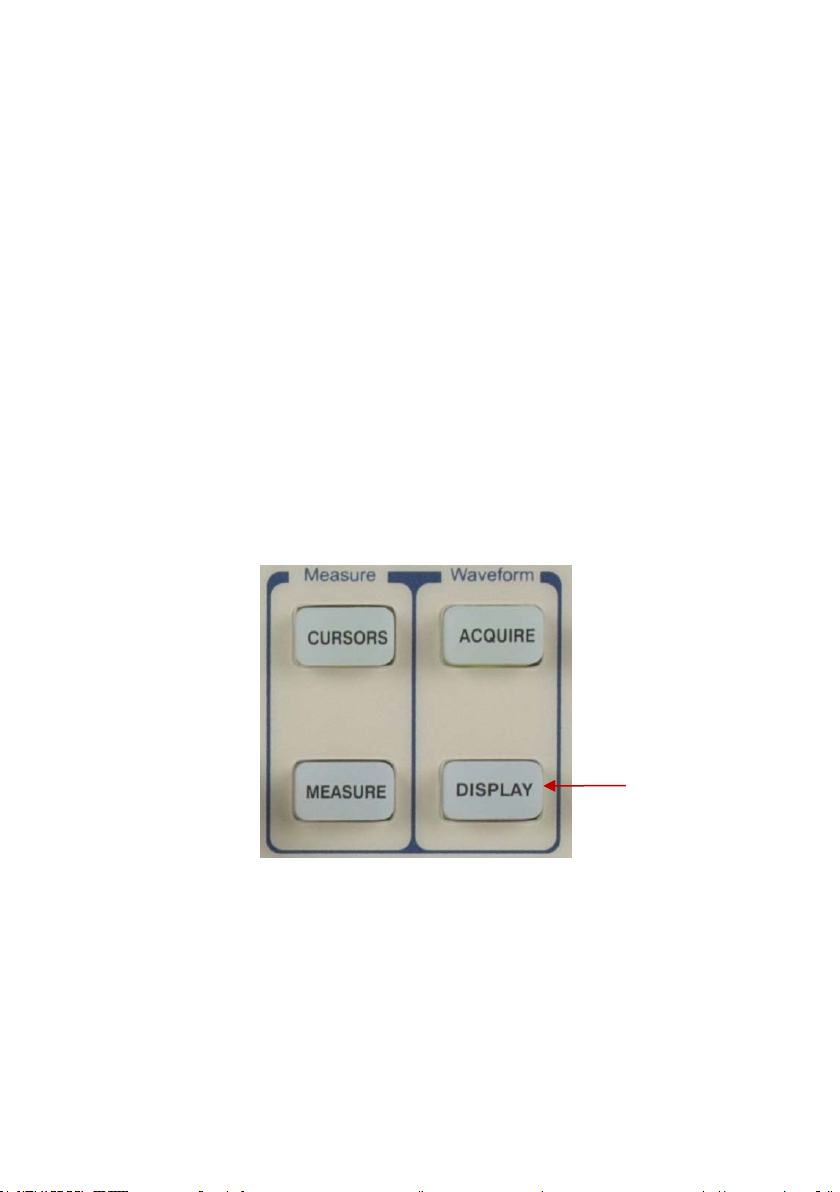
Set up Sampling mode
Press the “Mode” option button to select “Real Time” or “Equ Time”.
Set up Sampling rate
Adjust the sampling rate by pressing the “Sa Rate” option button and
turning the Time/div front panel knob. The sampling r ate is shown at the
corresponding timebase scale.
Display System
The display function could be expressed by the “DISPLAY” button.
91
Page 92

Option
Setting
Introduction
Type
Vectors
Vectors: Fills the space
points.
Persist
Off
Infinite
Sets the length of time
Intensity
<Intensity>
Set waveforms’
intensity.
Brightness
Set grid brightness.
Next Page
Page 1/3
Press this button to
Table 29- Display System Function Menu 1
Dots
between adjacent sample
points in the display.
Dots: There is no link
between adjacent sample
1 sec
2 sec
5 sec
each displayed sample
point remains displayed.
<Brightness>
enter second page.
92
Page 93

Option
Setting
Introduction
Format
YT
YT format displays the vertical
and channel 2.
Screen
Normal
Set to normal mode.
mode.
Grid
Display grids and axes on the
Menu
2sec
Set menu dis play time on screen.
Figure 46 - Display Menu Screen
Table 30 - Display System Function Menu 2
XY
Inverted
voltage in relation to time
(horizontal scale).
XY format displays a dot each time
a sample is acquired on channel 1
Set to invert color display
screen.
Turn off the grids.
Turn off the grids and axes.
93
Page 94

Display
5sec
10sec
Infinite
Next
Page
Page 2/3
Press this button to enter the second
page of “Display menu”.
Option
Setting
Introduction
Skin
Classical
Succinct
Set up screen style.
Next
Page
Page 3/3
Press this button to return the
first page.
20sec
Figure 47 - Display Menu 2
Table 31 - Display System Function Menu 3
Modern
Tradition
94
Page 95

Operate Introduction:
Setup waveform display type
1. Press the “DISPLAY” button to enter the
“Display” me nu.
2. Press the “T ype” o ption button to select
“Vectors” or “Dots”.
Set up Persist
Press the “Persist” option button to select “Off”, “1
Sec”, “2 Sec”, “5 Sec” or “Infinite”. You can use this
option to observe some special waveforms.
Figure 48 - Persist Screen
95
Page 96

Setup Intensity
Press the “Intensity” op t ion button and turn the
“Universal” knob to adjust waveforms’ intensity.
Setup Brightness
Press the “Brightness” option button and turn the
“Universal” knob to adjust grid brightness.
Setup Display Format
1. Press the “Next Page” option button to enter
second display menu.
2. Press the “Format” option button to select “YT” or
“XY”
Setup Grid
Press the “Grid” option button to select “ ”, “
display grid or not.
Setup Menu Display
Press the “Menu Display” option butto n to select “2
sec”, “5 sec”, “10 sec”, “20 sec”, or “Infinite” to set
menu display time on screen.
”or“ ”to set the screen whether to
96
Page 97

Note:The oscilloscope can capture a waveform in normal YT mode
Set Skin
Press the “skin” option button or turn the “Universal”
knob to select “Classical”, “Mo dern”, “Traditional”, or
“Succinct”.
X-Y Format
Use the XY format to analyze phase differences, such as those represented
by Lissajous patterns. The format plots the voltage on channel 1 against the
voltage on channel 2, where channel 1 is the horizontal axis and chan nel 2
is the vertical axis. The oscilloscope uses the untriggered Sample
acquisition mode and displays data as dots.
at any sampling rate. You can view the same waveform in XY mode.
To do so, stop the acquisition and change the display format to XY.
Operation steps:
● Channel 1 “Volt/div” a nd vertical “POSITION” set up
the horizontal scale and positio n.
● Channel 2 “Volt/div” a nd vertical “POSITION” set up
97
Page 98

the horizontal scale and positio n.
Note: When the display type is set to Vector, the oscilloscope
● Turn the “time/div” knob to adjust the sampling rate
● The following functions are forbidden at XY display
form:
● Benchmark waveform and wave mathematics
● Cursor
● Auto (resets display format to YT)
● Trigger Co ntrol
● Horizontal Position Knob
● Vector Display Type
● Scan Display
connects the sample points by using digital interpolation.
Interpolation mode contains linear interpolation and sin(x)/x
interpolation.
curved or irregular wave shapes, especially when the sample
rate is 3 to 5 times the system bandwidth
settings.
Sinx/x interpolation is suitable for reconstructing
or at faster time base
98
Page 99

Measure System
The oscilloscope displays the voltage in relation to time and test the
waveform displayed. There are scale, cursor, and auto measure modes.
Scale Measurement
This method allows you to make a quick visual estimate. For example, you
might look at waveform amplitude a nd determine that it is a little more than
100 mV. You can take simple measurements by counting the major and
minor graticule divisio ns involved and multiplying by the scale fa ctor. For
example, if you counted five major vertical graticule divisions between
minimum and ma xi mu m values of a waveform and knew you had a scale
factor of 100 mV/div, then you could easily calculate your peak-to-peak
voltage as follows:
5 divisions x 100 mV/div = 500 mV
Cursor Measurement
The cursor measurement has three modes: Manual, Track, and Auto
Measure.
99
Page 100

Manual Mode
Option
Setting
Instruction
Cursor
Mode
Manual
In this menu, set the manual
cursor measure.
Type
Voltage
Use cursor to measure voltage
parameters.
Source
CH1
REFB
Select input signal channel.
Cur A
Select this option, turn the
cursor A.
Cur B
Select this option, turn the
cursor B.
Table 32 - Manual Cursor Function Menu
Time
parameters.
Use cursor to measure time
CH2
MATH/FFT
REFA
“Universal” knob to adjust
“Universal” knob to adjust
In this mode, the screen displays two horizontal parallel cursors or vertic a l
parallel cursors to measure voltage or time. You can move the cursor by
turning the “Universal” knob. Before using cursors, you should make sure
that you have set the signal source as the channel for measuring.
• Voltage Cursor: Voltage cursors appear as horizontal lines on
the display and measure the vertical parameters.
• Time Cursor: Time cursors appear as vertical lines on the
display and measure the horizontal parameters.
• Cursor Moving: Use the “Universal” knob to move cursor 1 and
cursor 2. They will be moved when the corresponding cursor
options are selected, and the cursor value will display on the
bottom left and top left of the screen when you move the cursor.
To do manual cursor measurements, follow these steps:
100
 Loading...