

Page 1

SsoAdvanced™ Universal
SYBR® Green Supermix
Instruction Manual
For use with SYBR® Green–based real-time PCR applications
on all real-time PCR instruments
Catalog # 172-5270
172-5271
172-5272
172-5 2 74
172-5275
Page 2

Bio-Rad Technical Support
For help and technical advice, please contact the Bio-Rad Technical Support department. In the United
States, the Technical Support department is open Monday–Friday, 5:00 AM–5:00 PM, Pacific time.
http://www.bio-rad.com
Bio-Rad Laboratories
Life Science Research
2000 Alfred Nobel Drive
Hercules, CA 94547
Telephone: 510-741-1000
Telex : 335-358
Toll Fr e e: 1-800-4-BIORAD (1-800-424-6723)
Fax: 510-741-5800
Free Fax: 1-800-879-2289
Online technical support and worldwide contact information are available at www.consult.bio-rad.com.
Legal Notices
LightCycler is a trademark of Roche Diagnostics GmbH. Rotor-Gene is a trademark of Corbett Research. Mastercycler is a
trademark of Eppendorf AG. Mx is a trademark of Stratagene Corporation. Bioanalyzer is a trademark of Agilent Technologies.
FAM, StepOne, and StepOnePlus are trademarks of Applera Corporation.
SYBR is a trademark of Life Technologies Corp. Bio-Rad Laboratories, Inc. is licensed by Life Technologies Corporation to sell
reagents containing SYBR Green I for use in real-time PCR, for research purposes only.
Bio-Rad’s real-time thermal cyclers are licensed real-time thermal cyclers under Applera’s U.S. Patent Number 6,814,934 B1 for
use in research, human in vitro diagnostics, and all other fields except veterinary diagnostics.
These products are covered by one or more of the following U.S. patents or their foreign counterparts owned by Eppendorf AG:
U.S. Patent Numbers 6,767,512 and 7,074,367.
NOTICE TO PURCHASER: LIMITED LICENSE
Use of this product is covered by one or more of the following U.S. patents and corresponding patent claims outside the U.S.:
5,804,375; 5,538,848; 5,723,591; 5,876,930; 6,030,787; and 6,258,569. The purchase of this product includes a limited,
non-transferable immunity from suit under the foregoing patent claims for using only this amount of product for the purchaser’s
own internal research. No right under any other patent claim and no right to perform commercial services of any kind, including
without limitation reporting the results of purchaser’s activities for a fee or other commercial consideration, is conveyed expressly,
by implication, or by estoppel. This product is for research use only. Diagnostic uses under Roche patents require a separate
license from Roche. Further information on purchasing licenses may be obtained from the Director of Licensing, Applied
Biosystems, 850 Lincoln Centre Drive, Foster City, California 94404, USA.
Copyright © 2013 by Bio-Rad Laboratories, Inc. All rights reserved.
|
Page 3

Table of Contents
Sso7d Fusion Enzyme Technology iii
Educational Resources iv
Reagent Evaluation and Comparison Tutorials iv
Protocol 1
Sample Preparation Considerations 1
RNA Samples 1
RNA Integrity and Purity 1
DNA Samples 2
Plasmid Samples 2
Assay Design Considerations 3
Some Key Design Considerations 3
Procedure 4
Reaction Mix Preparation and Thermal Cycling Protocol 4
Real-Time PCR Validation for Gene Expression Experiments 5
Determining the Optimal Reference Gene 5
Determining the Dynamic Range of the Reverse Transcription Reaction 6
Determining the Real-Time PCR Performance Characteristics 9
Troubleshooting Guide 12
Ordering Information 21
SsoAdvanced™ Universal SYBR® Green Supermix Instruction Manual | i
Page 4

SsoAdvanced™ Universal SYBR® Green Supermix
Catalog # Supermix Volume Kit Size
172-5270 2 ml (2 x 1 ml vials) 200 x 20 μl reactions
172-5271 5 ml (5 x 1 ml vials) 500 x 20 μl reactions
172-5272 10 ml (10 x 1 ml vials) 1,000 x 20 μl reactions
172-5274 25 ml (5 x 5 ml vials) 2,500 x 20 μl reactions
172-5275 50 ml (10 x 5 ml vials) 5,000 x 20 µl reactions
Shipping and Storage
The SsoAdvanced universal SYBR® Green supermix is shipped on dry ice. Upon receipt, the
supermix should be stored at –20ºC in a constant temperature freezer and protected from
light. When stored in these conditions, the supermix is guaranteed for one year. When stored
at 4ºC, the supermix is guaranteed for three months. To avoid excess freeze-thaw cycles, we
recommend preparing aliquots for storage.
Kit Contents
SsoAdvanced universal SYBR® Green supermix is a 2x concentrated, ready-to-use reaction
master mix optimized for dye-based real-time PCR on any real-time PCR instrument (ROXindependent and ROX-dependent). It contains antibody-mediated hot-start Sso7d fusion
polymerase, dNTPs, MgCl2, SYBR® Green I dye, enhancers, stabilizers, and a blend of passive
reference dyes (including ROX and fluorescein).
Instrument Compatibility
This supermix is compatible with all Bio-Rad and ROX-dependent Applied Biosystems real-time
PCR instruments, and with the Roche LightCycler LC480, Qiagen Rotor-Gene Q, Eppendorf
Mastercycler ep realplex, and Stratagene Mx real-time PCR systems.
Product Use Limitations
The SsoAdvanced universal SYBR® Green supermix is intended for research use only, and is
not intended for clinical or diagnostic use.
Technical Assistance
Bio-Rad Laboratories takes great pride in providing best-in-class technical support through
our online, telephone, and field support. To obtain support, please visit www.bio-rad.com, call
1.800.4.BIORAD, or contact your local field applications scientist.
Quality Control
SsoAdvanced universal SYBR® Green supermix demonstrates high PCR efficiency and linear
resolution over a wide linear dynamic range. Stringent specifications are maintained to ensure
lot-to-lot consistency. This product is free of detectable DNase and RNase activities.
SsoAdvanced™ Universal SYBR® Green Supermix Instruction Manualii |ii |
Page 5
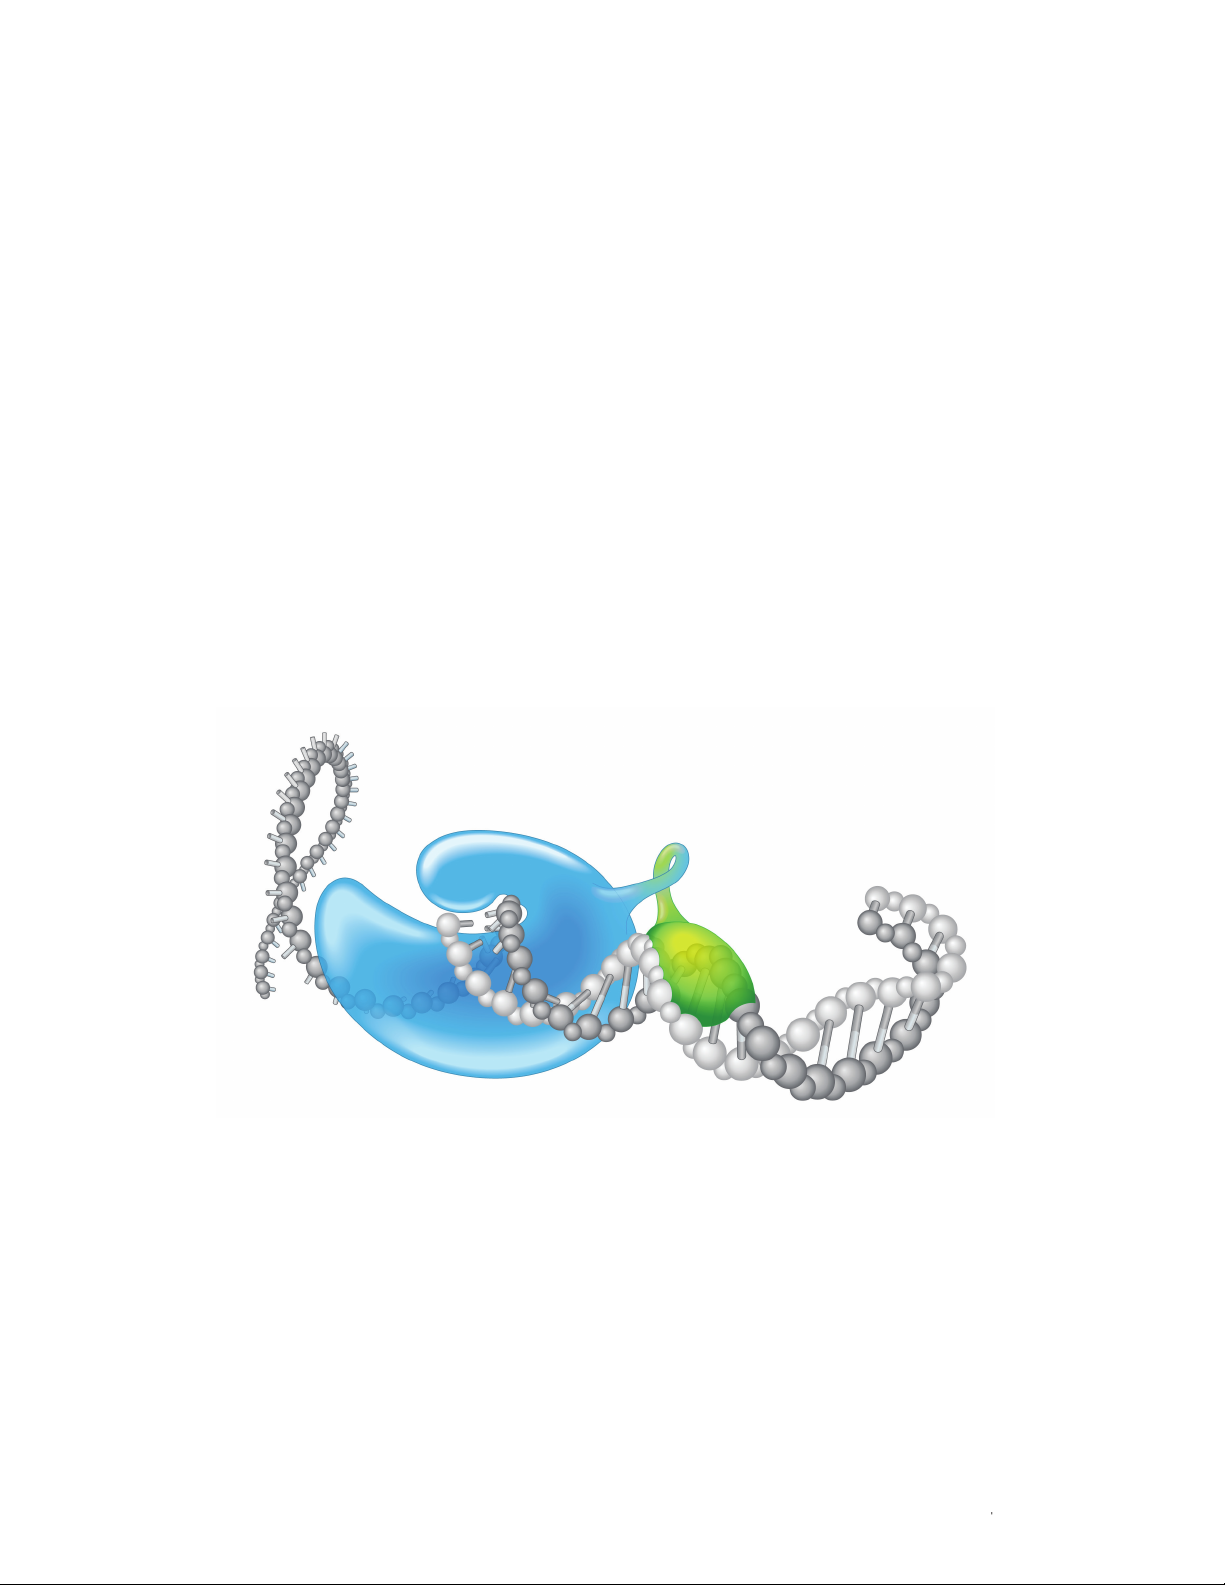
Sso7d Fusion Enzyme Technology
Bio-Rad introduced our next generation of real-time PCR supermixes using our patented
Sso7d fusion protein technology, delivering a reagent that provides effective performance
in a wide range of qPCR applications. The dsDNA-binding protein, Sso7d, stabilizes the
polymerase-template complex, increases processivity, and provides greater speed and
reduced reaction times compared to conventional DNA polymerases, without affecting PCR
sensitivity, efficiency, or reproducibility.
Key Features and Benefits
Fast qPCR results and high performance — the Sso7d fusion polymerase and optimized
buffer deliver fast reaction times via instant antibody hot-start polymerase activation and
rapid polymerization kinetics to generate exceptional qPCR results in less than 30 min
Minimal inhibition of PCR — the polymerase’s increased resistance to PCR inhibitors
ensures maximum efficiency, sensitivity, and reproducibility
Single copy detection — data illustrate high sensitivity with amplification and detection from
a single copy of target gene
Robust discrimination and reproducibility — efficient discrimination and reliable
quantification can be obtained from 1.33-fold serial dilutions of input template
GC-rich targets — ability to amplify targets where other Taq-based supermixes
may be challenged
| iiiSsoAdvanced™ Universal SYBR® Green Supermix Instruction Manual | iii
Page 6

Educational Resources
Understanding the Basics
To learn more about similarities and differences between PCR and real-time PCR, understand
how SYBR® Green and probe-based chemistries function, and see how data are collected and
interpreted, please view our interactive tutorial Understanding Real-Time PCR.
Reagent Evaluation and Comparison Tutorials
Reverse Transcription
When comparing two different reverse transcription kits, often not all characteristics of the
reverse transcription (RT) reaction are tested. The end result is that a decision is made using
a limited set of data and criteria. The following protocol and exercise have been written in an
effort to create a more robust, reliable, and reproducible method of testing sensitivity, efficiency,
and other critical characteristics when comparing reagent providers for reverse transcription
kits. Reagent Comparison Guide for Real-Time PCR
To view an interactive tutorial and learn about reverse transcription chemistry, enzymes,
and priming methods, as well as how to perform a reagent comparison, please click here.
Understanding Reverse Transcription
Supermixes
When comparing two different supermixes, often not all characteristics of the PCR reaction
are tested. The end result is that a decision is made using a limited set of data and criteria.
The Reagent Comparison Guide for Real-Time PCR was written in an effort to create a more
robust, reliable, and reproducible method of testing sensitivity, efficiency, and other critical
assay characteristics when comparing reagent providers for use on real-time PCR systems.
To view an interactive tutorial and learn about supermix chemistry and enzymes, as well as how
to perform a reagent comparison, please click here. Understanding Real-Time PCR Supermixes
SsoAdvanced™ Universal SYBR® Green Supermix Instruction Manualiv |iv |
Page 7

Protocol
This protocol is intended for use with SYBR® Green-based assays on all real-time PCR systems
using a broad range of cycling conditions, template and primer input concentrations, and fast or
standard run times.
Sample Preparation Considerations
RNA Samples
Isolate RNA using the appropriate method for the given sample type (Aurum™ total RNA mini
kit for cell lines, Aurum total RNA fatty and fibrous tissue kit for tissue samples)
Compare the expected yield to the actual yield to ensure the isolation method yielded the
appropriate RNA concentrations (5–30 pg per cell, 0.1–4 µg per mg of tissue). When the yield
is less than expected, this may lead to suboptimal qPCR data results, due to less than ideal
quality samples resulting from suboptimal sample prep workflow
When the RNA will be used for RT-qPCR, it is recommended that you treat the sample
with DNase to remove residual contaminating DNA. DNase treatment is also a good idea
when isolating RNA from tissues that are high in DNA, as the excess DNA may affect
downstream applications
Store the RNA in an appropriate solution
– 0.1 mM EDTA (in DEPC-treated ultrapure water)
– TE buffer (10 mM Tris-HCl, 1 mM EDTA, pH 7.0)
Store the RNA at –80ºC in single-use aliquots
RNA Integrity and Purity
Use the Experion™ automated electrophoresis system or the Agilent Bioanalyzer to evaluate
the integrity of the RNA sample. When using multiple samples in the comparison, ensure that
the RQI/RIN numbers are similar to ensure accurate qPCR results
Use an agarose gel to assess RNA integrity if the above systems are not available. Apply the
same analysis concepts. High quality RNA will yield two clean peaks, 18s and 28s. Degraded
RNA will appear as a smear on the gel
To assess purity, evaluate the following spectrophotometer readings:
– A260/A280 >2.0 for pure RNA
– A260/A230 ~2.0 for pure RNA
• Lower ratios are indicative of contaminants from salts, carbohydrates, peptides, proteins,
phenols, and guanidine thiocyanate
SsoAdvanced™ Universal SYBR® Green Supermix Instruction Manual | 1
Page 8

DNA Samples
Isolate DNA using the appropriate method for the given sample type (for example, column
purification for cell lines, phenol/chloroform or column purification for tissue samples)
Store the DNA in an appropriate solution
– 0.1 mM EDTA (in DEPC-treated ultrapure water)
– TE Buffer (10 mM Tris-HCl, 1 mM EDTA, pH 7.0)
Store the DNA at –80ºC in single-use aliquots
Assess DNA quality with an agarose gel; a single band indicates high integrity DNA, whereas
a smear indicates degraded DNA
Assess the DNA purity using a spectrophotometer for the following:
– A260/A230 >1.5 (lower ratios may be attributed to carryover guanidine, and/or inhibitors
– A260/A280 1.7–2.0 (lower ratios are indicative of contaminants from salts, carbohydrates,
– Higher ratios may be indicative of RNA contamination
Tips:
like humic acid and organics)
peptides, proteins, phenols, and guanidine thiocyanate)
Heat treating DNA may be required prior to qPCR to relax strong secondary structure
Using a restriction digest enzyme may be required for select qPCR applications, such as copy
number variation, to reduce signal-to-noise ratio.
Plasmid Samples
Prepare plasmids using an appropriate method
Store the stock plasmid in an appropriate solution
– TE buffer (10 mM Tris-HCl, 1 mM EDTA, pH 8.0)
Store the plasmid at –80ºC in single-use aliquots
Assess plasmid quality with an agarose gel; a single band indicates high integrity plasmid,
whereas a smear indicates degraded plasmid or excess enzymatic activity
Assess the plasmid purity using a spectrophotometer for the following:
– A260/A280 1.7–1.9 (lower ratios are indicative of contaminants from salts, carbohydrates,
peptides, proteins, phenols, and guanidine thiocyanate)
– Higher ratios may be indicative of RNA contamination
2 | SsoAdvanced™ Universal SYBR® Green Supermix Instruction Manual2 |
Page 9

Assay Design Considerations
When using custom designed assays, several important considerations should be noted:
Biological significance (correct isoform/splice variant chosen)
Sequence quality and secondary structure — evaluate using web-based tools to understand
the complexity of the structure, as it can impact the reaction performance
Sequence length — use the entire gene sequence, or a specific region of interest, to
optimally design an assay
Sequence masking — use web-based masking tools to mask low complexity and repetitive
regions to avoid assay design in these regions
Uniqueness of the sequence — use BLAST or BLAT to ensure no homology exists and help
avoid mispriming events
Uniqueness of the assay — use in silico PCR, or Primer-BLAST, to “blast” the primers against
the genome of interest to validate primer design specificity
Default settings in the software — ensure they are set correctly (for example, salt conditions,
oligo and amplicon sizes). The SsoAdvanced™ universal SYBR® Green supermix and the
qPCR cycling protocols have been optimized for assays with a primer melting temperature
(Tm) of 60ºC designed using the open source Primer3, Primer3Plus or Primer-BLAST, default
settings. For assays designed using other tools, the primer T
Primer3. Suggested settings: 50 mM Na+, 3 mM Mg++, 1.2 mM dNTPs, 250 nM annealing
oligo, SantaLucia/SantaLucia
should be recalculated using
m
Some Key Design Considerations
For optimal PCR efficiency, design the amplicon size between 70 and 150 bp (<70 bp may be
needed for degraded/FFPE templates)
Maintain primer lengths between 18 and 22 bp for good specificity and binding abilities
Annealing temperatures between 58 and 62ºC are optimal (greater range can be obtained
using Bio-Rad’s Sso7d-based supermixes); temperatures >60ºC may result in less binding
efficiency and <58ºC may result in less specificity
The optimal amplicon GC content should be within 40–60% (greater range can be obtained
using Bio-Rad’s Sso7d-based supermixes)
Avoiding primer secondary structures reduces potential primer-dimer issues
Avoid mispriming by ensuring there are no more than 2 Gs or Cs in the last 5 bases on the 3'
end of the primer
Design your assay such that at least one primer spans an exon:exon junction site to avoid
gDNA amplification
Alternatively, design the assay such that the primers are in separate exons and the intron
size is >1 kb
Tips to Get Started:
Always evaluate the performance of the supermix following the recommended reaction and
cycling conditions prior to modification
Be sure to set the activation time to 30 sec for cDNA and 2–3 min for genomic DNA
The 2x supermix has been optimized for 20 µl reactions in 96-well plates and 10 µl reactions
in 384-well plates
| 3SsoAdvanced™ Universal SYBR® Green Supermix Instruction Manual | 3
Page 10

Procedure
Reaction Mix Preparation and Thermal Cycling Protocol
1. Thaw SsoAdvanced™ universal SYBR® Green supermix and other frozen reaction
components to room temperature. Mix thoroughly, centrifuge briefly to collect solutions at
the bottom of tubes, and then store on ice protected from light.
2. Prepare (on ice or at room temperature) enough reaction setup for all qPCR reactions
by adding all required components except the template according to the following
recommendations (Table 1).
Table 1. Reaction setup.*
Volume per Volume per
Component 20 μl Reaction 10 μl Reaction Final Concentration
SsoAdvanced universal SYBR®
Green supermix (2x) 10 μl 5 μl 1x
Forward and reverse primers Variable Variable 250–500 nM each
Template (add at step 4) Variable Variable cDNA: 100 ng–100 fg
Genomic DNA: 50 ng–5 pg
Nuclease-free H2O Variable Variable —
Total reaction mix volume 20 μl 10 μl —
* Scale all components proportionally according to sample number and reaction volumes.
3. Mix the assay master mix thoroughly to ensure homogeneity and dispense equal aliquots
into each PCR tube or into the wells of a PCR plate. Good pipetting practice must be
employed to ensure assay precision and accuracy.
4. Add samples (and nuclease-free H2O if needed) to the PCR tubes or wells containing
the reaction setup (Table 1), seal tubes or wells with flat caps or optically transparent film,
and vortex 30 sec or more to ensure thorough mixing of the reaction components.
Spin the tubes or plate to remove any air bubbles and collect the reaction mixture in the
vessel bottom.
5. Program thermal cycling protocol on the real-time PCR instrument according to Table 2.
6. Load the PCR tubes or plate onto the real-time PCR instrument and start the PCR run.
7. Perform data analysis according to the instrument-specific instructions.
SsoAdvanced™ Universal SYBR® Green Supermix Instruction Manual4 |
Page 11

Table 2. Thermal cycling protocol.
Amplification
Polymerase Annealing/
Activation Extension +
Setting/ and DNA Denaturation Plate Read Melt-Curve
Real-Time PCR System Mode Denaturation at 95/98°C at 60°C** Cycles Analysis
Bio-Rad
CFX384™, CFX96 Touch™,
CFX384 Touch™,
CFX Connect™
Bio-Rad
Chromo4™, MyiQ™
ABI 7500, StepOne,
StepOnePlus, 7900HT
and ViiA7
Roche LightCycler 480 Fast 10–30 sec
Standard 60 sec
Qiagen Rotor-Gene and
Stratagene Mx series
* 98°C is highly recommended for genomic DNA template to ensure complete denaturation.
** Shorter annealing/extension times (1–10 sec) can be used for amplicons <100 bp. Longer annealing/extension
®
CFX96™,
SYBR® only
®
iQ™5, MiniOpticon™,
times (30–60 sec) can be used for amplicons >250 bp, GC- or AT- rich targets, crude samples, or for higher input
amounts (for example, 100 ng of cDNA or 50 ng of genomic DNA).
Standard
Fast
Standard
Fast
30 sec at
95°C for
cDNA
5–15 sec
or 5–15 sec
2–3 min at
98°C for
genomic
DN A*
10–30 sec
15–30 s ec
10–30 sec
60 sec
10–30 sec
65–95°C
0.5°C
increment
2–5
35–40 sec/step
35–40
(or use
instrument
default
setting)
Real-Time PCR Validation for Gene Expression Experiments
The following validation experiments are critical for obtaining valid and publishable real-time
PCR data following the MIQE guidelines. These simple-to-follow experiments should be
completed prior to starting a new real-time PCR project.
Determining the Optimal Reference Gene
To properly perform a gene expression experiment, it is imperative that an optimal
reference gene(s) is used. The reference gene(s) must maintain a consistent expression
level across all samples in the project regardless of treatment, source, or extraction
method. The variation in reference gene expression is somewhat dependent on the level
of fold change discrimination desired. For example, if a twofold change in expression is
important, then the reference gene should have little to no variation in expression. However,
if a 20-fold change in expression is important, then the reference gene expression can have
some variability. To validate a reference gene(s), follow these steps:
1. Begin searching for a candidate list of reference genes by searching publications, speaking
with researchers using similar model systems, and mining microarray data, if available.
Minimally, five reference genes should be selected for evaluation. For your convenience,
Bio-Rad offers pre-plated reference gene panels using our highly validated and optimized
PrimePCR assays.
2. From your experiment, randomly select a few samples from each group (for example,
treatments, time courses, sources) ensuring that you evaluate all variable sample groups.
3. Isolate the RNA and DNase-treat using the same protocol for all samples. Quantify and
normalize the RNA to the same concentration.
SsoAdvanced™ Universal SYBR® Green Supermix Instruction Manual | 5
Page 12

4. Perform a reverse transcription reaction for each sample using the same kit, volume, and
concentration. Dilute the cDNA, as needed, treating each sample the same to ensure there
are no differences from sample to sample in terms of volume and concentration from the
initial RNA input.
5. Perform a real-time PCR experiment using the samples and the candidate reference genes
using technical triplicates for each sample.
6. Evaluate the data for each reference gene by calculating a standard deviation for all
samples. For example, if you evaluated eight samples and seven reference genes, simply
calculate the standard deviation of those eight samples’ Cq values for each reference
gene. Thus, you will end up with seven standard deviation values. Compare the values
to determine which reference gene(s) have the lowest value. Although there is no precise
threshold for determining a good reference gene, a good rule of thumb is to ignore any
reference gene with a standard deviation higher than 0.5. If you are using a Bio-Rad CFX
real-time PCR system, you can utilize the software to automatically calculate an M-value to
assist in determining the optimal reference gene.
In this data set (Figure 1), TBP and PPIA are both below 0.5 and may be suitable reference
genes for the given project. Keep in mind there is no one good reference gene for all
projects, so the reference gene must be validated for every project.
1.6
1.4
1.2
1.0
0.8
0.6
0.4
0.2
0
HPRT
GAPDH
TBP
18S
ACTB
PPIA
RPL13A
Fig. 1. Seven reference genes evaluated using random samples from untreated and
treated sample groups. TBP and PPIA exhibited the lowest standard deviations with ~0.4 and
0.2, respectively. Note that GAPDH and ACTB exhibited the highest standard deviations, thus
would be unacceptable reference genes. If you are unable to find a single stable reference gene,
consider using multiple reference genes. This method involves calculating a geometric mean of
the reference gene quantities (not Cq values) prior to performing the normalization.
Determining the Dynamic Range of the Reverse Transcription Reaction
An optimal reverse transcription reaction is expected to generate a true representation of the RNA
converted into cDNA. However, it is imperative to determine the dynamic range of the reaction
to ensure that the initial RNA loaded does not fall outside the dynamic range. If it does, then the
downstream real-time PCR data may be invalid. To validate the dynamic range, perform the following:
1. Preparation of a serial dilution using a single RNA source (or a pooled RNA sample) is
required to prepare the cDNA synthesis reactions for the experiment. Ensure an adequate
amount of RNA is available; adjust concentrations and volumes accordingly.
2. Start with 1 µg of total RNA and perform a tenfold serial dilution covering at least 5 or 6 logs
of dynamic range.
3. Perform RT using 20 μl reactions. Transfer the RNA, as shown in Figure 2, to the respective
reaction tubes. For example, transfer 1 μg of RNA to Reaction 1 tube. Repeat transferring
RNA to the remaining reaction tubes.
6 | SsoAdvanced™ Universal SYBR® Green Supermix Instruction Manual6 |
Page 13

Serial dilution
of the RNA
0
10
–1
10
–2
10
–3
10
–4
10
–5
10
–6
10
1 µg RNA
100 ng RNA
10 ng RNA
1 ng RNA
100 pg RNA
10 pg RNA
1 pg RNA
Bio-Rad® iScript™ cDNA
Synthesis Kit
Reaction 1
Reaction 2
Reaction 3
Reaction 4
Reaction 5
Reaction 6
Reaction 7
Fig. 2. Tenfold serial dilution of RNA starting at 1 µg down to 1 pg,
thus covering six logs of dynamic range. Each RNA dilution was
transferred to the respective cDNA reaction tube for cDNA synthesis.
4. Dilute the cDNA as needed to perform real-time PCR reactions using a minimum of two
genes — reference and low expressing. However, it is recommended to evaluate four genes
— reference, low, medium, and high expressing.
5. Prepare the real-time PCR plate (Figure 3) and cycle according to the recommended protocol.
Reference
gene
Low
expressor
Fig. 3. A recommended plate layout.
Medium
expressor
High
expressor
| 7SsoAdvanced™ Universal SYBR® Green Supermix Instruction Manual | 7
Page 14

6. Evaluate the data. Follow the guidelines in this manual (page 14–15) for setting the baseline
and threshold prior to analyzing the data. Figure 4 illustrates the most common results from
the experiment and how to interpret the data.
A
1 pg
10 pg
100 p g
1 ng
Cq
10 ng
100 n g
1 µg
Initial RNA
C D
1 pg
10 pg
100 p g
1 ng
Cq
10 ng
100 n g
1 µg
Initial RNA
E
1 pg
10 pg
100 p g
1 ng
Cq
10 ng
100 n g
1 µg
B
1 pg
10 pg
100 p g
1 ng
Cq
10 ng
100 n g
1 µg
Initial RNA
1 pg
10 pg
100 p g
1 ng
Cq
10 ng
100 n g
1 µg
Initial RNA
Initial RNA
Fig. 4. The blue standard curve represents the target gene and the green
standard curve represents the reference gene. A, both assays demonstrate
equivalent performance in linearity and dynamic range covering 1 µg to 1 pg.
Thus, any RNA input going forward within this range will be acceptable; B, both
assays are either saturated at the 1 µg data point or the reverse transcription
reaction is inhibited due to carryover inhibitors from the RNA sample. Consider
using less RNA (≤100 ng) or re-purifying the RNA; C, the reference assay has a
broader dynamic range than the target assay, therefore, the dynamic range is
limited. Consider reevaluating the target assay design, using less RNA (≤100 ng),
or re-purifying the RNA; D, the target assay exhibits a high standard deviation at
the lowest concentration (1 pg) and should not be considered part of the dynamic
range. This is due to a lack of sensitivity or reproducibility, and may be alleviated
by using a carrier in the RNA sample such as glycogen or non-target gDNA
carrier; E, after considering all the data, the concentration points that define the
dynamic range from rejecting the variant 1 pg data and the saturated/inhibited
1 µg data point results in an effective dynamic range (RNA loading) is 1–100 ng.
8 | SsoAdvanced™ Universal SYBR® Green Supermix Instruction Manual8 |
Page 15

Determining the Real-Time PCR Performance Characteristics
Determining the PCR efficiencies of your reference gene and target gene(s) is critical before
starting any real-time PCR experiment. Knowing the PCR efficiency determines the appropriate
relative gene expression math model. Not knowing may affect and invalidate the results. To
determine the PCR efficiency among other key characteristics, prepare standard curves to
evaluate the following:
PCR efficiency
Dynamic range
Correlation coefficient
Sensitivity
Specificity
1. A serial dilution of the cDNA, gDNA, or plasmid template is required to prepare the standard
curve. Ensure an adequate supply of template and an adequate volume are available to
evaluate all the assays used in the experiment.
Serial dilution of the template
1 1:10 1:10 0 1:1,000 1:10,000 1:100,000 1:1,000,000
Fig. 5. Tenfold serial dilution covering six logs of dynamic range is prepared using a starting template
of your choice based on target expression levels.
2. Prepare the real-time PCR reactions using a fresh bottle of supermix, nuclease-free water,
and primer sets. Figure 6 is an example of a plate layout.
Reference
gene
Low
expressor
Fig. 6. Example of a plate layout with four seven-point
standard curves with NTCs in technical triplicates — one
for each gene of interest and the reference gene.
Medium
expressor
High
expressor
| 9SsoAdvanced™ Universal SYBR® Green Supermix Instruction Manual | 9
Page 16

3. Cycle according to the recommended protocol.
4. Analyze the data. Follow the guidelines in this manual for setting the baseline and threshold
prior to analyzing the data.
Tips for Success
Pipet a minimum of 5 µl for each sample. This ensures greater precision and a smaller standard
deviation for technical replicates. If the samples are too concentrated, simply dilute accordingly.
Use a calibrated pipet of the appropriate volume range and never plunge the tip more than several
millimeters below the surface of the sample. Pipet slowly and use the pipet tip demarcations to
visualize accuracy
Prepare individual master mixes for each sample by combining the real-time PCR supermix,
nuclease-free water, and primers along with the template and mix thoroughly. Then, pipet 20 µl
into the respective wells on the plate
A tenfold dilution series is recommended to cover the most logs of dynamic range; however,
depending on the expression level of the gene(s) evaluated and the total template amount
available, this can be reduced to a fivefold dilution series
PCR Efficiency
Calculate efficiency using the software or the following equation:
[–1/m]
E =10
30
25
Cq
20
15
–1. A PCR efficiency from 90–110% (slope values from –3.6 to –3.1) is preferred.
2 3 4 5
Log Star ting Quantity
Fig. 7. Reference gene has a PCR efficiency of 97.59% (–3.381) and six
logs of dynamic range. The target gene has a PCR efficiency of 99.17%
(–3.342) with six logs of dynamic range. Subtracting the slope values,
3.381 – 3.342 = 0.039, which is <0.1.
6 7 8
5. To determine which math model should be applied, simply subtract the slope value of the
reference gene from each target gene. If the ∆slope is ≤0.1, then the PCR efficiencies are
within accepted limits and the ∆∆C
math model can be used. If the ∆slope is ≥0.1, then the
T
efficiency correction math model (Pfaffl method) must be applied.
Linearity
Calculate the R2 statistic for each standard curve using the qPCR analysis software; the R2
should be ≥–0.980. However, if the R2 is <0.980, remove outliers. If there are too many outliers,
then reevaluate the experiment to determine the cause of the lower R2 value.
10 | SsoAdvanced™ Universal SYBR® Green Supermix Instruction Manual10 |
Page 17

Dynamic Range
Determine the general trend of the slope where linearity (R2) and efficiency are within acceptable
ranges, as specified above.
Sensitivity
Determine the lowest concentration of the serial dilution where replicate reproducibility is high
and the R2 of the standard curve is ≥0.980.
Specificity
Evaluate the melt profiles when using SYBR® Green–based assays. A single sharp peak with a
Tm close to the calculated Tm should be present.
1,2 0 0
1,000
800
600
400
–d (R FU )/d t
200
0
60 70 80
Fig. 8. Example of a highly specific SYBR® Green assay where the melt cur ve exhibits a single
melt peak around 85–87°C indicating a single PCR amplicon present.
90
| 11SsoAdvanced™ Universal SYBR® Green Supermix Instruction Manual | 11
Page 18

Troubleshooting Guide
Poor Nucleic Acid Yields
Review Tables 3 and 4 to determine if you are within an acceptable range of nucleic acid yield.
If your yields of RNA are considerably less than is typical for your sample type, reevaluate
your isolation method. For reference, typical yields from some mammalian tissues are listed in
tables 3 and 4.
Table 3. RNA yields.
Total RNA per Cell Total DNA per Cell
5–30 pg Varies by genome
Table 4. RNA yields per mg of tissue.
Sample Type Yield
Liver 4 µg
Spleen 4 µg
Heart 3 µg
Kidney 2 µg
Lung 2 µg
Brain 1.5 µg
Bone 50 ng
Adipose <10 ng
PCR Inhibitors/Oversaturation
If you suspect that your sample(s) contains PCR inhibitors, consider the following
corrective actions:
1. Evaluate your sample type to determine if any of the common inhibitors listed in the
following list may be present in your sample as carryover. If you suspect contamination,
re-purify the samples using a commercially available post-isolation cleanup kit.
2. Evaluate the A260/280 and A260/230 ratios. Refer to the RNA/DNA isolation section
(page 1) in this manual for further information.
SsoAdvanced™ Universal SYBR® Green Supermix Instruction Manual12 |
Page 19

Common PCR Inhibitors*
From the Sample From the Isolation Method
Melanin EtOH >1% v/v
Polysaccharides Proteinase K
Polyphenolics DMSO >5%
Hemoglobin EDTA >50 mM
Chlorophyll SDS >0.01% w/v
Heparin Sodium Acetate >5 mM
Humic acid Mercaptoethanol
Hematin Guanidinium
Phenol >0.2% v/v
DTT >1 mM
* Not an inclusive list.
3. If the most concentrated sample in the dilution series is showing compression, as seen in
Figure 9, where the tenfold dilution series ∆Cq value is <3.3 compared to the more diluted
points, then PCR inhibitors are most likely present in the sample. However, compression
may also be due to an overloaded amount of template, error in the dilution series, or
pipetting error.
a. Re-purify the sample(s) using a different isolation method, or post-isolation column cleanup
b. Remove the highest dilution point
c. Increase the annealing/extension time
Amplification
4
10
3
10
RFU
2
10
0
0
Fig. 9. Presence of PCR inhibition at the
highest dilution point, as indicated by
delayed amplification.
10
∆ Cq 2
∆ Cq 3.3
20
Cycles
30 40
| 13SsoAdvanced™ Universal SYBR® Green Supermix Instruction Manual | 13
Page 20

Low Template Input, Low Expression, High Cq Values
If your Cq values are higher than expected or you are concerned about Cq values >30,
consider the following corrective actions:
1. Confirm the expected expression level, if known, to ensure that the target of interest is
present in your given sample. Additionally, consider higher input concentrations of sample
for low expressing targets. Remember that for every twofold increase in starting sample
concentration, the Cq value shifts one cycle earlier (assuming 100% PCR efficiency).
2. Confirm the template input amount using a fluorescence-based quantification method to
ensure the cDNA input range is 100 ng to 100 fg or the genomic DNA input range is 500 ng
to 5 pg. (cDNA will require purification prior to quantification analysis.)
3. Increase the volume of template pipetted into the PCR reaction. For the highest accuracy
and precision, pipet a minimum volume of 5 µl for each sample.
4. Consider adding a carrier to your sample stock to increase homogeneity — examples
include tRNA, glycogen, and unrelated gDNA.
5. Consider using nonstick polypropylene tubes for sample stock storage to prevent nucleic
acid from binding to the tube walls.
6. Confirm that the reverse transcription reaction was successful. A simple-to-follow protocol is
outlined in Reagent Comparison Guide for Real-Time PCR
Setting the Baseline and Threshold
If you notice that any data point(s) in your amplification plots exhibit a sigmoidal shape in
the log view (Figure 10, left), this is typically due to an incorrect baseline setting. Consider
the following corrective actions:
1. Deselect automatic baseline setting and assign manual baseline. Adjust the baseline begin
and end cycles so that the amplification plot matches the others on the plot. Sometimes this
takes a few tries, but a general rule of thumb is to set the end cycle about two cycles before
the start of true amplification, as seen in Figure 11.
6
10
4
10
3
10
RFU
2
10
1
10
Fig. 10. Incorrect baseline is exhibited in the left graph indicated by the arrow pointing to the first
dilution point where the amplification plot is more sigmoidal in shape. As a result, an artificially lower
Cq value is obtained. Corrected baseline is shown in the graph on the right.
Amplification
Cycles Cycles
Incorrect Baseline
RFU
4
10
3
10
2
10
1
10
Amplification
10 20 30 400 010 20 30 40
Correct Baseline
14 | SsoAdvanced™ Universal SYBR® Green Supermix Instruction Manual14 |
Page 21

16
14
12
3)
^
10
8
(RFU )(10
6
4
2
0
0
Cq 6
Cq 8
10 40
Amplification
20
Cycles
30
Fig. 11. Baseline setting is best completed in the linear view. In this example,
the amplification starts around cycle 8; therefore, setting the end baseline two
cycles prior at cycle 6 is best.
2. Either remove this data point or dilute your sample so that it does not show amplification earlier
than cycle 15. This ensures that the software’s algorithm has enough background to subtract
from the signal. Early amplification may cause the algorithm to fail due lack of background data.
If you notice high standard deviations for technical replicates or inconsistent gene
expression data, this could be due to the threshold being positioned either too high or
too low. Consider the following corrective action:
When setting the threshold, you should choose a position that is in the middle of the geometric
(exponential) phase of PCR. Setting the threshold too high or too low places the threshold in a less
than ideal region of amplification where greater noise is present and PCR is not 100% efficient.
A B
3
10
RFU
2
10
0 10 20 30 40 50
C
3
10
RFU
2
10
0
10
Amplification
Cycles
Amplification
30
20
Cycles
Amplification
3
10
RFU
2
10
0
40
50
Cycles
20
10
30
40 50
Fig. 12. Illustrations of baseline settings. A, when the threshold is set too high, the data collected are often
from the linear phase of PCR, where the reaction is not the most efficient; B, the threshold is set too low. When
set too low, the data collected are often within the background noise of the reaction; C, a correct threshold
setting where the data collected are within the geometric (exponential) phase of PCR.
| 15SsoAdvanced™ Universal SYBR® Green Supermix Instruction Manual | 15
Page 22

PCR Performance Not 100% Efficient
If you have already ruled out your samples as a source for poor efficiency, then the assay may
be the cause of the problem. Please review the section on assay design in this manual for
further information (page 3).
Also, consider the following corrective action:
Perform a temperature gradient experiment to determine the optimal annealing temperature.
Set up the gradient as follows:
a. Use several representative samples in your project.
b. Set the temperature range 10ºC above and 6ºC below the calculated annealing temperature.
c. Choose the final annealing temperature based on overall performance related to specificity.
If the PCR efficiency is >100%, and you have additional peaks in your melt profile around
the mid-70s (see Figure 13), this is most likely primer dimer. Consider the following
corrective action:
Compare the NTC well melt curve profile to all other wells that contain samples. If the sample
wells and NTC wells exhibit primer dimer, then the melting temperatures will align. Simply
stated, a balance of primer to template is required when using SYBR® Green assays. When
too high a primer concentration is used and the primers are prone to dimers, primer dimers will
form at low and no sample concentration inputs.
Melt Peak
300
200
-d(RFU)/dT
100
0
65
Temperature, Celsius
Fig. 13. Primer dimers at –79ºC.
80 85 90 957570
To correct this, perform a primer matrix analysis for every primer pair prior to the first time you
use them in your project to ensure the correct final primer concentration is selected. Table 5
illustrates a sample plate layout for a primer matrix, where the forward and reverse primers
are plated at various final concentrations. (Note that you can build a matrix as large as you
prefer.) Load the plate with a small amount of sample (expression-dependent) into every well
and perform a real-time PCR run. Choose the primer concentration that exhibits the following:
lowest Cq value, highest fluorescent signal, and no primer dimers. Note that the final primer
concentrations do not have to be equamolar.
16 | SsoAdvanced™ Universal SYBR® Green Supermix Instruction Manual16 |
Page 23

Table 5. Primer matrix.
Forward Primer, nM
Reverse Primer, nM 100 150 200
100 100/100 150/100 200/100
150 10 0/150 15 0/150 20 0/150
200 100/200 150/200 200/200
If your melt profiles exhibit additional peaks at higher melting temperatures than your
product of interest (see Figure 14), this is most likely due to nonspecific binding of the
primer(s). To correct, please consider the following:
3,500
3,000
2,500
2,000
1,500
1,000
–d (R FU )/d t
500
0
65
70
75
Temperature, °C
80
Fig. 14. Mis-priming event around 90ºC.
85
90
95
1. Evaluate the assay design by following the bioinformatics workflow outlined in the beginning
of this manual (page 3). This will help ensure that the primers are highly specific to your
target of interest, and no other target region(s).
2. Perform a temperature gradient to determine the optimal annealing temperature of the
primers. Load your plate with the same reaction setup and sample for each primer set in a
column format so that you can evaluate the annealing temperatures. Set the gradient 10ºC
above and 6ºC below the calculated annealing temperature to ensure a proper temperature
range is covered. Choose the best temperature based on the melt profiles (no extra peaks),
keeping in mind that lower temperatures may reduce specificity and higher temperatures
may reduce primer binding efficiency.
A 70.0
B 68.9
C 66.9
D 64.0
E 59.8
F 57.1
G 55.2
H 54.0
Primer
Set 1
Primer
Set 2
Primer
Set 3
Primer
Set 4
10°C above
Annealing T
6°C below
= 60°C
m
Fig. 15. Temperature gradient layout.
| 17SsoAdvanced™ Universal SYBR® Green Supermix Instruction Manual | 17
Page 24

If your melt profile exhibits a broad peak, this could be due to the presence of a
pseudogene, one product with two melt domains or other target sequence with a similar
melting temperature. Due to the nature of SYBR® Green, the lack of ability to discriminate
a few base pair differences and very close melting temperatures for two or more
amplicons results in this type of melt profile. Consider the following correction action:
500
400
300
200
–d (R FU )/d t
100
0
Fig. 16. Broad melt curve profile where potentially more
than one product or pseudogene exists around the same
melting temperature.
Melt Peak
90807060
Temperature, °C
Review the bioinformatics steps taken to design the assay to ensure that all design
considerations were taken into account. Please visit the assay design section in this manual for
further details.
If you suspect the standard curve and dilution points are not within the MIQE guidelines
2
of 90–110% PCR efficiency with an R
of 0.99 or greater, consider the following
corrective actions:
1. Ensure that the standard curve covers at least 5–6 logs of dynamic range. When the
standard curve is too small, the variability of the true efficiency greatly increases.
2. If the R2 is <0.98, review the standard curve data points for outliers. Remove any outliers
where the ∆Cq is >0.5 for the group. For example, if your 100 pg dilution point has Cq
values of 29.2, 29.6, and 30.5, you should remove the Cq value of 30.5. If there are too
many outliers, it may be a sign of other technical issues.
3. Evaluate the most dilute points of the standard curve to ensure they are not out of range.
In Figure 17, you can see that the most dilute points are yielding Cq values similar to
less dilute points. This is usually due to primer dimers, which can be resolved through
primer concentration optimization (see the primer matrix discussion on page 17 for
more information).
18 | SsoAdvanced™ Universal SYBR® Green Supermix Instruction Manual18 |
Page 25

100 p g
1 ng
Cq
Fig. 17. Serial dilution of template where the
lowest dilution point (100 pg) has lower Cq values
than expected due to primer dimer amplification.
10 ng
100 n g
1 µg
Initial DN A
Control Samples/Wells Are Not Performing as Expected
If your non-template control (NTC) wells indicate amplification, you need to determine the
source. If primer dimers are not the cause (please review the prior section), then the most likely
cause is nucleic acid contamination. This can result from the following, but is not limited to:
Pipetting template into the NTC well
Sample from adjacent wells being aerosolized while pipetting or removing the plate seal after
samples have been loaded
Contaminated plate, water, primers, or supermix
Use of non-filtered pipet tips
1. Evaluate your current workflow and adjust as needed. If you suspect your reagents are
contaminated, the best method to determine the source is to replace them one at a time
starting with the water, which is a common source of contamination. Next, make a fresh
dilution of primers from the stock solution. And finally, use a new aliquot of the supermix.
Discard any identified contaminated reagent from the lab.
If your no-RT control wells indicate amplification, you need to determine the amount
of gDNA contamination present in your cDNA sample(s) to understand the impact on
your data.
| 19SsoAdvanced™ Universal SYBR® Green Supermix Instruction Manual | 19
Page 26

1. Using Table 6, determine the percent of gDNA contamination present. For example, if the
∆Cq (no-RT control Cq – cDNA Cq) for a given sample is seven or greater, then <1% of the
DNA present in the sample is gDNA, which would be considered insignificant.
Table 6. Determining percent of gDNA contamination.
∆Cq Percent Contribution, %
1 50.00
2 25.00
3 12.50
4 6.25
5 3.12 5
6 1.5625
7 0.78125
2. Evaluate the assay design and note the location of the primers. To avoid gDNA amplification,
at least one primer must span an exon:exon junction site. Alternatively, the primers can be
designed in two different exons that are separated by an intronic region >1 kb.
If you are using an internal positive control (IPC) and the standard deviation of the Cq values
across all samples is >0.167, then consider the following:
When the IPC for a given sample(s) is higher than the group, this is most likely due to the
presence of a PCR inhibitor. Review the sections on sample preparation for more information.
20 | SsoAdvanced™ Universal SYBR® Green Supermix Instruction Manual20 |
Page 27

Ordering Information
Catalog # Description
SsoAdvanced Universal SYBR Green Supermix
172-5270 2 ml (2 x 1 ml vials), 200 x 20 μl reactions
172-5271 5 ml (5 x 1 ml vials), 500 x 20 μl reactions
172-5272 10 ml (10 x 1 ml vials), 1,000 x 20 μl reactions
172-5274 25 ml (5 x 5 ml vials), 2,500 x 20 μl reactions
172-5275 50 ml (10 x 5 ml vials), 5,000 x 20 µl reactions
Two-Step Reverse Transcription Reagents
170-8842 iScript Advanced cDNA Synthesis Kit for RT-qPCR, 50 x 20 μl reactions
170-8843 iScript Advanced cDNA Synthesis Kit for RT-qPCR, 250 x 20 μl reactions
170 - 8 890 iScript cDNA Synthesis Kit, 25 x 20 μl reactions
170-8891 iScript cDNA Synthesis Kit, 100 x 20 μl reactions
170-8840 iScript Reverse Transcription Supermix for RT-qPCR, 25 x 20 μl reactions
170-8841 iScript Reverse Transcription Supermix for RT-qPCR, 100 x 20 μl reactions
170 - 8 896 iScript Select cDNA Synthesis Kit, 25 x 20 μl reactions
170 - 8 897 iScript Select cDNA Synthesis Kit, 100 x 20 μl reactions
PCR Plate Sealers
MSA-5001 Microseal 'A' Film, package of 50 seals
MSB-10 01 Microseal 'B' Adhesive Seals, optically clear, 100 seals
MSC-10 0 1 Microseal 'C' Optical Seals, 100 seals
Description Clear Wells White Wells Black Wells
Hard-Shell Low-Profile 96-Well Skirted PCR Plates
White shell, 50 HSP-9601 HSP-9655 —
Red shell, 50 HSP-9611 — —
Yellow shell, 50 HSP-9621 — —
Blue shell, 50 HSP-9631 HSP-9635 —
Green shell, 50 HSP-9641 HSP-9645 —
Black shell, 50 HSP-9661 HSP-9665 HSP-9666
White shell, bar-coded, 50 HSP-9901 HSP-9955 —
Hard-Shell High-Profile 96-Well Semi-Skir ted PCR Plates
Clear shell, 25 HSS-9601 — —
Green shell, 25 HSS-9641 — —
Black shell, 25 — HSS-9665 —
Clear shell, bar-coded, 25 HSS-9901 — —
Hard-Shell 384-Well Standard PCR Plates
Clear shell, 50 HSP-3801 HSP-3805 —
Red shell, 50 HSP-3811 — —
Yellow shell, 50 HSP-3821 — —
Blue shell, 50 HSP-3831 — —
Green shell, 50 HSP-3841 — —
Black shell, 50 — HSP-3865 HSP-3866
Clear shell, bar-coded, 50 HSP-3901 HSP-3905 —
Hard-Shell 384-Well 480 PCR Plates with Bar Code on Row A Side
Clear shell, 50 HSR-4801 HSR-4805 —
Clear shell, 100 (2 packs) HSR-4801K HSR-4805K —
PrimePCR Assays and Panels
®
Bio-Rad
performance. Bio-Rad offers a complete workflow solution for real-time PCR, including RNA isolation kits, reverse
transcription kits, and real-time PCR supermixes, as well as real-time PCR detection systems and data analysis software.
Wet-Lab Validated for Guaranteed Performance
Wet-lab validation of every assay provides confidence in results while eliminating time-consuming assay design
and optimization steps. Assays are validated for use with iScript™ advanced cDNA synthesis kit for RT-qPCR and
SsoAdvanced™ SYBR® Green supermix for superior performance. Validation information is available for every assay.
PrimePCR™ assays for real-time PCR are expertly designed and wet-lab validated to ensure optimal assay
| 21SsoAdvanced™ Universal SYBR® Green Supermix Instruction Manual | 21
Page 28

Bio-Rad
Laboratories, Inc.
Life Science
Group
Web site ww w.bio-rad.com USA 800 424 6723 Australia 61 2 9914 2800 Austria 01 877 89 01 Belgium 09 385 55 11 Brazil 5 5 11 5044 5699
Canada 905 364 3435 China 86 21 6169 8500 Cze ch Repu blic 420 241 430 5 32 Denm ark 44 52 10 00 Finland 09 804 2 2 00
France 01 47 95 69 65 Germany 089 31 884 0 Greec e 30 210 9532 220 Hong Ko ng 852 2789 3300 Hungary 36 1 459 6100 India 91 124 4029300
Israel 03 963 6050 Italy 39 02 2160 91 Japan 03 6361 7000 Korea 82 2 3473 4460 Mexico 52 555 4 88 7670 The Netherlands 0318 540666
New Zealand 64 9 415 2280 No rway 23 38 41 30 Poland 48 22 3 31 99 99 Portugal 351 21 472 7700 Russia 7 495 721 14 04
Singapore 65 6415 3188 South Africa 27 861 246 723 Spain 34 91 590 52 00 Swed en 08 555 12700 Switzerland 026 674 55 05
Taiwan 886 2 2578 7189 Thailand 800 88 22 88 United Kingdom 020 8328 2000
13-0570 0313 Sig 121210031339 Rev A US/EG
 Loading...