

Page 1
S3™ and S3e™ Cell Sorters
Instruction Manual
Catalog #145-1001
#145 -1002
#14 5 -10 05
#14 5 -10 0 6
#145-1008
Page 2

Page 3

Bio-Rad Technical Support
For help and technical advice, please contact the Bio-Rad Technical Support department. In the United
States, the Technical Support department is open Monday–Friday, 5:00 AM–5:00 PM, Pacific time.
http://www.bio-rad.com
Bio-Rad Laboratories
Life Science Research
2000 Alfred Nobel Drive
Hercules, CA 94547
Telephone: 510-741-1000
Tele x: 335-358
Toll Fre e: 1-800-4-BIORAD (1-800-424-6723)
Fax: 510-741-5800
Free Fax: 1-800-879-2289
Online technical support and worldwide contact information are available at www.consult.bio-rad.com.
Legal Notices
Agilis is a trademark of Newport Corporation.
Kimwipes is a trademark of Kimberly-Clark Corporation.
Windows is a trademark of Microsoft Corporation.
No part of this publication may be reproduced or transmitted in any form or by any means, electronic
or mechanical, including photocopy, recording, or any information storage or retrieval system, without
permission in writing from Bio-Rad Laboratories.
Bio-Rad reserves the right to modify its products and services at any time. This instruction manual is subject
to change without notice.
Although prepared to ensure accuracy, Bio-Rad assumes no liability for errors, or for any damages resulting
from the application or use of this information.
Copyright © 2014 by Bio-Rad Laboratories, Inc. All rights reserved.
Instruction Manual | i
Page 4

Bio-Rad Laboratories Resources
Bio-Rad provides many resources for scientists. Table 1 lists available resources and how to locate what you need.
Table 1. Bio-Rad resources.
Resource How to Contact
Local Bio-Rad Laboratories Find local information and contacts on the Bio-Rad Laboratories website by selecting your country
representatives on the homepage (www.bio-rad.com). Find the nearest international office listed on the back of
this manual
Technical support scientists Bio-Rad’s technical support scientists provide our customer with practical and expert solutions.
To find local technical support on the phone, contact your nearest Bio-Rad office. For technical
support in the United States and Canada, call 1-800-424-6723 (toll-free), and select the technical
support option
Service support engineers Maintenance and repairs should be carried out only by authorized service support engineers
For service support in the United States and Canada, call 1-800-424-6723 (toll-free), and select
the technical support option to request service support
Technical notes and literature Go to the Bio-Rad website (www.bio-rad.com). Type a term in the Search box and select
Documents tab to find links to literature
Writing Conventions Used in This Manual
This manual uses the writing conventions listed in Table 2.
Table 2. Conventions used in this manual.
Convention Meaning
Note: Provides helpful information and instructions, including information explained in further detail elsewhere in this manual
WARNING! Explains very important information about something that might injure the researcher, damage the instrument, or
cause data loss
X > Y Instruction to select X and then select Y from a toolbar, menu, or software window
Highlights area of interest on a screenshot
IMPORTANT! Provides important information about necessary actions or common mistakes
ii | S3 and S3e Cell Sorters
Page 5

Safety and Regulatory Compliance
For safe operation of the S3 and S3e Cell Sorter systems, we strongly recommend that you follow the safety specifications listed in
this section and throughout the manual.
Safety Warning Labels
Warning labels posted on the instrument and in this manual warn you about sources of injury or harm. Refer to Table 3 to review the
meaning of each safety warning label.
Table 3. Meaning of safety warning labels.
CAUTION: Shock hazard! This symbol draws attention to a possible injury or danger to life if the associated
directions are not followed correctly
CAUTION: Risk of danger! This symbol identifies components that pose a risk of personal injury or damage to
the instrument if improperly handled. Wherever this symbol appears, consult the manual for further information
before proceeding
CAUTION: Laser hazard! This symbol draws attention to a possible injury or danger to life due to laser radiation
if the associated directions are not followed correctly
CAUTION: Biohazard! This symbol identifies components that may become contaminated with biohazardous material
Instrument Warning Labels
The warning labels shown in Table 4 are displayed on the instrument and refer directly to the safe use of the S3 and
S3e Cell Sorter systems.
Table 4. Instrument safety warning labels.
Warning about risk of shock.
Only qualified, trained technicians should carry out service work on electronic components due to potential
shock hazard
Warning about electronic components.
Electronic components are sensitive to electrostatic charges and can be destroyed by a discharge
Warning about weight of the system.
Lifting should be accomplished with a minimum of two people and only by the inset handles on the instrument
base. Use caution to keep instrument level and handle gently
Warning about handling biohazardous materials.
When handling biohazardous samples or the S3 or S3e System’s waste container, adhere to the recommended
precautions and guidelines in this manual, and comply with any local guidelines specific to your laboratory
and location
Instruction Manual | iii
Page 6

Safe Use Specifications and Compliance
Laser Product Hazard Classification
The intent of the laser hazard classification is to identify hazards to users posed by the laser, and provide appropriate protective
measures. The S3 or S3e laser is a Class 1 laser product that complies with 21 CFR 1040.10 and 1040.11, except for deviations
pursuant to Laser Notice No. 50, dated June 24, 2007 stating that operators are not exposed to harmful levels of laser radiation
during normal operation, maintenance and/or service. During times of repair and/or major service by a trained technician, laser safety
controls for Class 3B lasers must be followed.
WARNING! Use of controls or adjustments or performance of procedures other than those specified herein may result in hazardous
laser radiation exposure.
Electrical Safety Information and Classification
The S3 and S3e Systems conform to international regulations encompassing the accessibility of high voltages by the user. Use all
protective housings, interlocks, and shields as identified in this manual. Further information about specific electrical hazards is listed in
the hardware description.
AC Fuse Requirements
Remove power cord before replacing fuses.
Fuses are 5 x 20 mm and must be rated to 250 VAC, 4 A slow blow such as Schurter 0034.3123
AC Power Cord Requirements
Power cord must be IEC 60320-1 compliant with a C13 plug on the instrument end. The power cord must be rated at minimum
250 VAC, 10 A at 60ºC minimum. In the U.S. and Canada, the power cord must be rated at minimum 125 VAC, 10 A at 60ºC minimum.
Position the instrument for easy access to the power switch and the power cord.
Regulatory Compliance
This instrument has been tested and found to be in compliance with all applicable requirements of the following safety and
electromagnetic standards:
n
IEC 61010-1:2010 (3rd Ed.), EN61010-1:2010 (3rd Ed). Electrical Equipment for Measurement, Control, and Laboratory Use - Part 1:
General Requirements.
n
UL/CSA 61010-1:2012 (3rd Ed.), Standard for Safety Electrical Equipment for Electrical Safety (USA, Canda, NRTL)
n
IEC 60825-1:2007(2nd Ed.), EN 60825-1:2007(2nd Ed). Safety of laser products - Part 1: Equipment classification and requirements
n
Class 1 laser product per CDRH requirements and regulations
n
IEC 61010-2-081:2001+A1, EN61010-2-081:2002+A1. Safety requirements for electrical equipment for measurement, control and
laboratory use. Part 2-081: Particular requirements for automatic and semi-automatic laboratory equipment for analysis and other
purposes (includes Amendment 1)
n
EN 61326-1:2006 (Class A) Electrical equipment for measurement, control and laboratory use. EMC requirements, Part 1: General
requirements
This equipment generates, uses, and can radiate radio frequency energy and, if not installed and used in accordance with the
instruction manual, may cause harmful interference to radio communications. Operation of this equipment in a residential area is likely
to cause harmful interference, in which case the user will be required to correct the interference at his own expense.
Hazards
The S3 and S3e Cell Sorters are designed to operate safely when used in the manner prescribed by the manufacturer. If the S3 or
S3e Cell Sorter or any of its associated components are used in a manner other than prescribed, or if modifications to the instrument
are not performed by a Bio-Rad or other authorized agent, then the warranty on the system will be voided. Service of the S3 or
S3e Cell Sorter should be performed only by Bio-Rad personnel.
Biohazards
The S3 and S3e Cell Sorters are laboratory products. However, if biohazardous samples are present, adhere to the following
guidelines and comply with any local guidelines specific to your laboratory and location.
General Precautions
n
Always wear laboratory gloves, coats, and safety glasses with side shields or goggles
n
Keep your hands away from your mouth, nose, and eyes
n
Completely protect any cut or abrasion before working with potentially infectious materials
iv | S3 and S3e Cell Sorters
Page 7

n
Wash your hands thoroughly with soap and water after working with any potentially infectious material before leaving the laboratory
n
Remove wristwatches and jewelry before working at the bench
n
Store all infectious or potentially infectious material in unbreakable leak-proof containers
n
Before leaving the laboratory, remove protective clothing
n
Do not use a gloved hand to write, answer the telephone, turn on a light switch, or touch anything that other people may touch
without gloves
n
Change gloves frequently. Remove gloves immediately when they are visibly contaminated
n
Do not expose materials that cannot be properly decontaminated to potentially infectious material
n
Upon completion of the operation involving biohazardous material, decontaminate the work area with an appropriate disinfectant
(for example, a 1:10 dilution of household bleach)
n
No biohazardous substances are exhausted during normal operations of this instrument
Disposal of Biohazardous Material
The S3 and S3e Systems include a waste container that may potentially contain hazardous biological materials, depending on the
sample used. Dispose of the following potentially contaminated materials in accordance with laboratory, local, regional, and
national regulations:
n
Content in waste container
n
Reagents
n
Used reaction vessels or other consumables that may be contaminated
Chemical Hazards
The S3 and S3e Systems include a waste container that may potentially contain hazardous chemical materials depending on the
sample used.
Explosive or Flammability Hazards
The S3 and S3e Systems pose no uncommon hazard related to flammability or explosion when used in a proper manner as
specified by Bio-Rad Laboratories.
Electrical Hazards
The S3 and S3e Systems pose no uncommon electrical hazard to operators if installed and operated properly without physical
modification and if connected to a power source of proper specification.
Transport
Moving the S3 and S3e Systems is not recommended after installation. If the system needs to be moved, follow the decontamination
procedure in this manual and remove all bulk fluidics. A QC procedure will be required after a move to ensure instrument is
functioning properly.
Lifting should be performed with a minimum of two people. Lift with the inset handles on the instrument base. Use caution to keep
instrument level, and handle the instrument gently.
Storage
The S3 or S3e System can be stored under the following conditions:
n
Temperature range 5–35°C
n
Relative humidity 20–70%
Disposal
The S3 and S3e Systems contain electronic or electrical materials; it should be disposed of as unsorted waste and must be collected
separately, according to European Union Directive 2002/96/CE on waste and electronic equipment — WEEE Directive. Before
disposal, contact your local Bio-Rad representative for country-specific instructions.
Warranty
The S3 and S3e Cell Sorters and associated accessories are covered by a standard Bio-Rad warranty. Contact your local Bio-Rad
Laboratories office for details of the warranty.
Instruction Manual | v
Page 8

vi | S3 and S3e Cell Sorters
Page 9

Table of Contents
Chapter 1: Introduction 1
1.1 System Components 2
1.2 Installation Requirements 2
Chapter 2: Hardware Description 3
2.1 System Overview 3
2.2 Fluidics System 5
2.3 Optics 9
2.4 Electronics 11
Chapter 3: ProSort™ So ftwar e 13
3.1 Main Software Window 14
3.2 Control Panel 20
3.3 Administrator Tab Toolbar 22
Chapter 4: Getting Started 33
4.1 Checking Bulk Fluidics 33
4.2 Logging In 34
4.3 Daily Startup 35
4.4 Quality Control 36
4.5 Protocols and Workspace 42
Chapter 5: Acquisition 51
5.1 Acquisition Setup 51
5.2 Compensation 55
5.3 Checking or Swapping Fluidics 60
5.4 Optical Filters 62
Chapter 7: Additional Software Features 73
7.1 Debubble 73
7.2 Unclog 73
7.3 Swap Tip 73
7.4 Clean System 74
7.5 Instrument Status Box 75
7.6 Status Bar 75
7.7 Printing 76
7.8 Quality Control Reports 76
7.9 User Reports 77
7.10 Biosafety System 78
Chapter 8: Shutdown 79
8.1 Daily Shutdown 79
Chapter 9: Automatic Startup 83
9.1 Scheduling an Automatic Startup 83
9.2 Previously Scheduled Automatic Startups 84
Chapter 10: Maintenance 87
10.1 General Maintenance 87
10.2 Dealing with Clogs 88
10.3 Cleaning or Replacing Nozzle Tip 88
10.4 Swap Nozzle Tip Wizard 89
10.5 Optical Filter Cleaning 105
10.6 Disinfectants 105
10.7 Decontamination 105
Chapter 6: Sorting 65
6.1 Sort Setup 65
6.2 Sort Modes 69
6.3 Sort Statistics 69
6.4 Sort Plots 71
Troubleshooting 111
References 115
S3 and S3e Cell Sorter Specifications 117
Ordering Information 119
Instruction Manual | vii
Page 10

viii | S3 and S3e Cell Sorters
Page 11

1
Introduction
The S3™ and S3e™ Cell Sorters are designed to offer affordable, dependable, and simplified
cell sorting. As benchtop cell sorters, the S3 and S3e Cell Sorters are equipped with one or
two lasers and up to four fluorescent detectors, plus forward and side scatters. Samples are
analyzed using the traditional jet-in-air technology, and events can be sorted at high speeds
while maintaining sensitivity and high purity.
Sorting is typically accomplished by breaking the stream of fluid containing particles into
droplets and applying a charge to the stream when a particle passes the criteria to be sorted.
The charged droplet containing the particle is then deflected by an electric field into a collection
vessel. To ensure proper deflection of the correct droplets, proper instrument setup is integral to
achieving high-purity sort results.
By automating the complex presort setup with a unique technology, the S3 and S3e
create a more efficient and consistent workflow.
Key automated features:
n
Startup/shutdown
n
Stream-to-laser alignment
n
Drop delay calculation
n
Droplet break-off monitoring and feedback
n
Phase and deflection adjustments to sort stream
n
Daily QC reporting and trending
n
Collection volume monitoring to prevent overfilling
The S3 and S3e
system. The instrument uses a unique internal buffer chamber system for dilution of 8x sheath
fluid with deioinized (DI) water, allowing users to swap fluids without the need to shut down the
system. This process is known as a “hot swap,” and allows uninterrupted sorting. For more
information, refer to Section 5.3, Checking or Swapping Fluidics.
Cell Sorters include a complete internalized fluidics and temperature control
Cell Sorters
Instruction Manual | 1
Page 12

Introduction
1.1 System Components
The S3 or S3e Cell Sorter complete system includes the following components:
n
S3 or S3e Cell Sorter Instrument, 1 each
n
S3 or S3e Installation Kit, 1 each
S3 cap assembly, white, sheath fluid, 1 each
S3 cap assembly, blue, DI water, 1 each
S3 cap assembly, red, waste, 1 each
S3 fluidics container 4 L size, empty, 2 each
S3 individual filter holder, black, empty, 5 each
S3 forward scatter (FSC) filter holder
with neutral density filter, 2.0, 1 each
S3 filter block A with preset filter
configuration, 1 each
S3 filter block B with preset filter
configuration, 1 each
n
S3 Accessory Kit (optional), 1 each (catalog #145-1065)
S3 nozzle tip, 100 µm, 1 each
S3 nozzle O-rings, 2 each
S3 nozzle alignment disk, 2 each
Neutral density filter, 1.0, 2 each
5 ml tubes, 12 x 75 mm, 1 pack
S3 collection adaptor set, 1 each
Bulk fluidics tray, 3 each
USB cord, 1 each
Ethernet cord, 1 each
Power cord, 1 each
USB drive with ProSort
™
software
Instrument and software manual
Instrument quick guide
2 mm hex driver, 1 each
S3 spanner wrench, 1 each
1 ml syringe, 1 each
Plastic box, 1 each
n
Computer CPU and 24 inch monitor, 1 each (catalog #145-1066)
n
ProFlow
n
ProLine
™
8x Sheath Fluid, preservative free, 5 x 4 L, 1 case (catalog #145-1082)
™
Calibration Beads, 3 x 5 ml, 1 pack (catalog #145-1081) or
ProLine Universal Calibration Beads, 3 x 5 ml, 1 pack (catalog #145-1086)
1.2 Installation Requirements
The S3 and S3e Cell Sorters should be installed by a trained service engineer to ensure proper
operation and calibration of the instrument. If any items are missing or damaged, contact your
local Bio-Rad office for assistance.
Before the S3 and S3e
chosen. The instrument should be located on a sturdy bench or table top, away from any other
instruments that may interfere electrically or mechanically by causing vibration. The bench or
table top must be able to accommodate 198 lb (90 kg), the weight of the instrument. The area
should be free of excessive dust or moisture.
Table 5. Dimensions for instrument alone or with computer and monitor.*
Instrument only (W x D x H) 70 x 65 x 65 cm
Instrument wiith computer and monitor, 116 x 65 x 65 cm
(W x D x H) 46 x 25.5 x 25.5 in
* An additional 61 cm (24 in) of height clearance is needed for service.
Cell Sorters can be installed by a service engineer, a site must be
27.5 x 25.5 x 25.5 in
2 | S3 and S3e Cell Sorters
Page 13
2
Hardware Description
This chapter describes the hardware of the S3™ and S3e™ systems. Understanding the
system’s hardware is essential for proper operation.
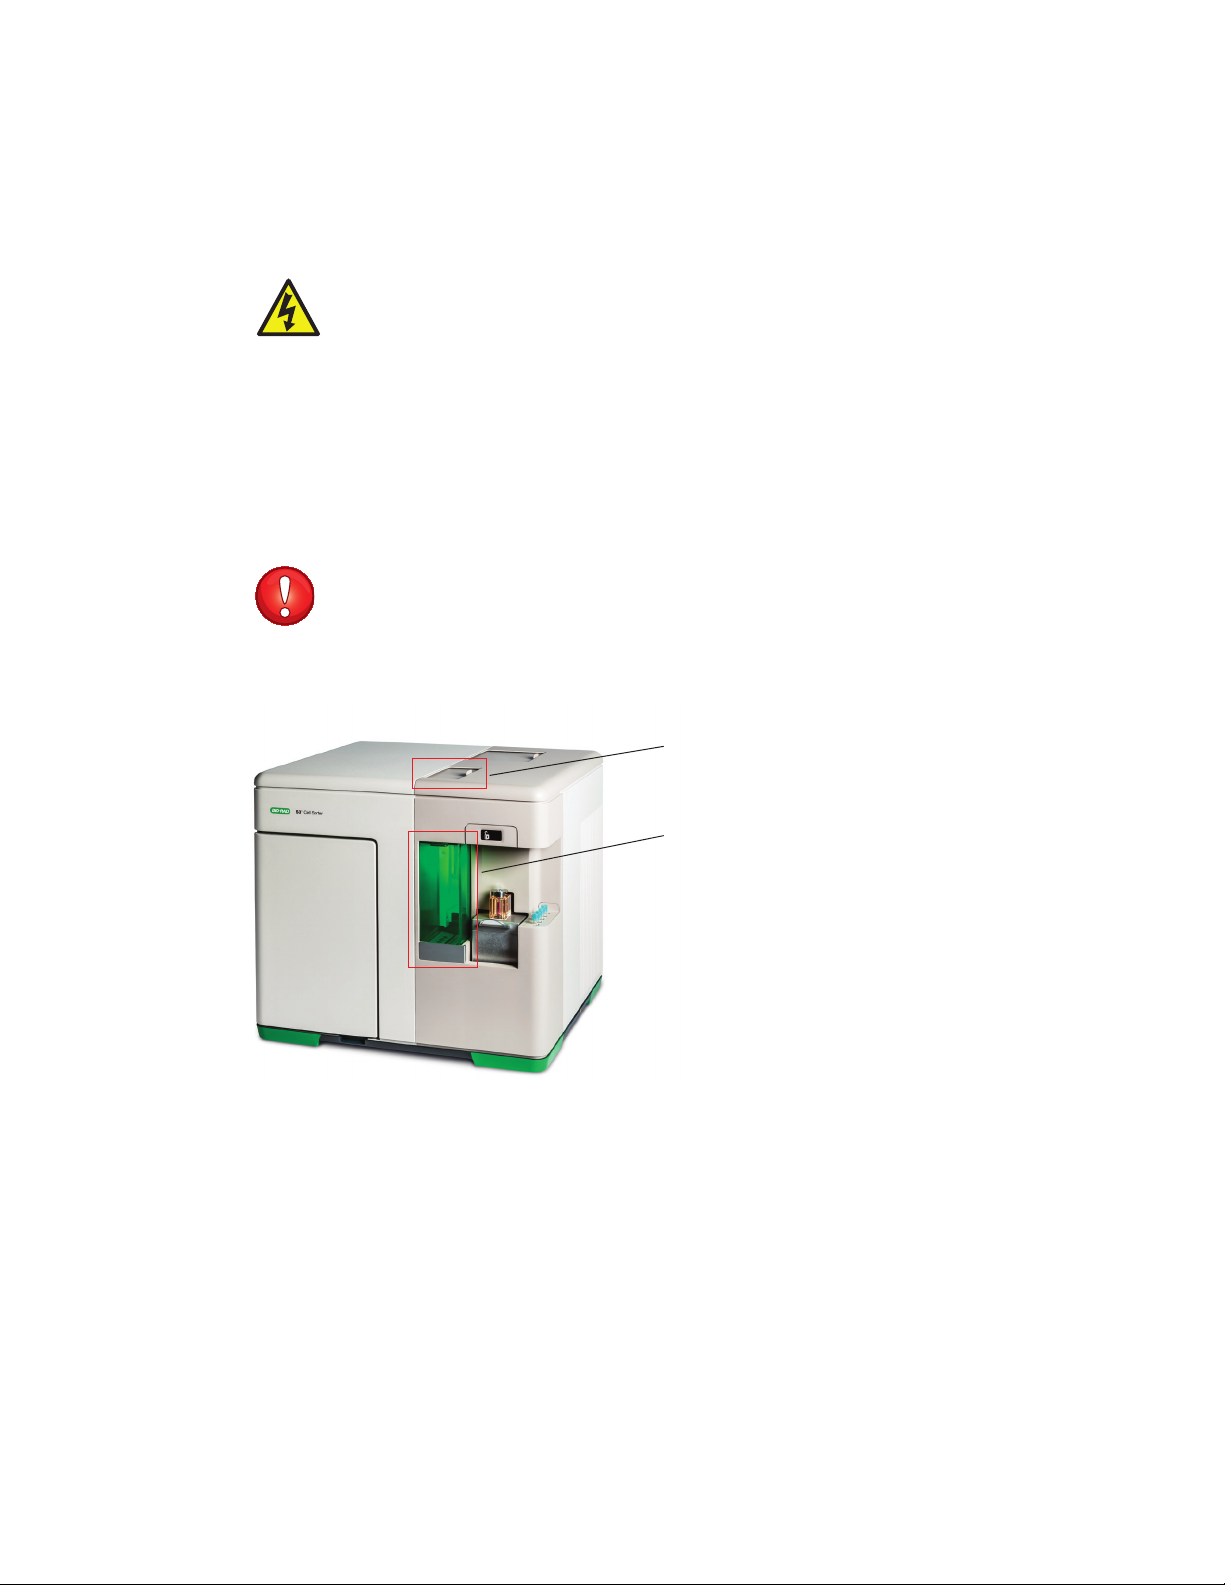
2.1 System Overview
The S3 and S3e Systems consist of fluidics, optics, electronics, and software. These can be
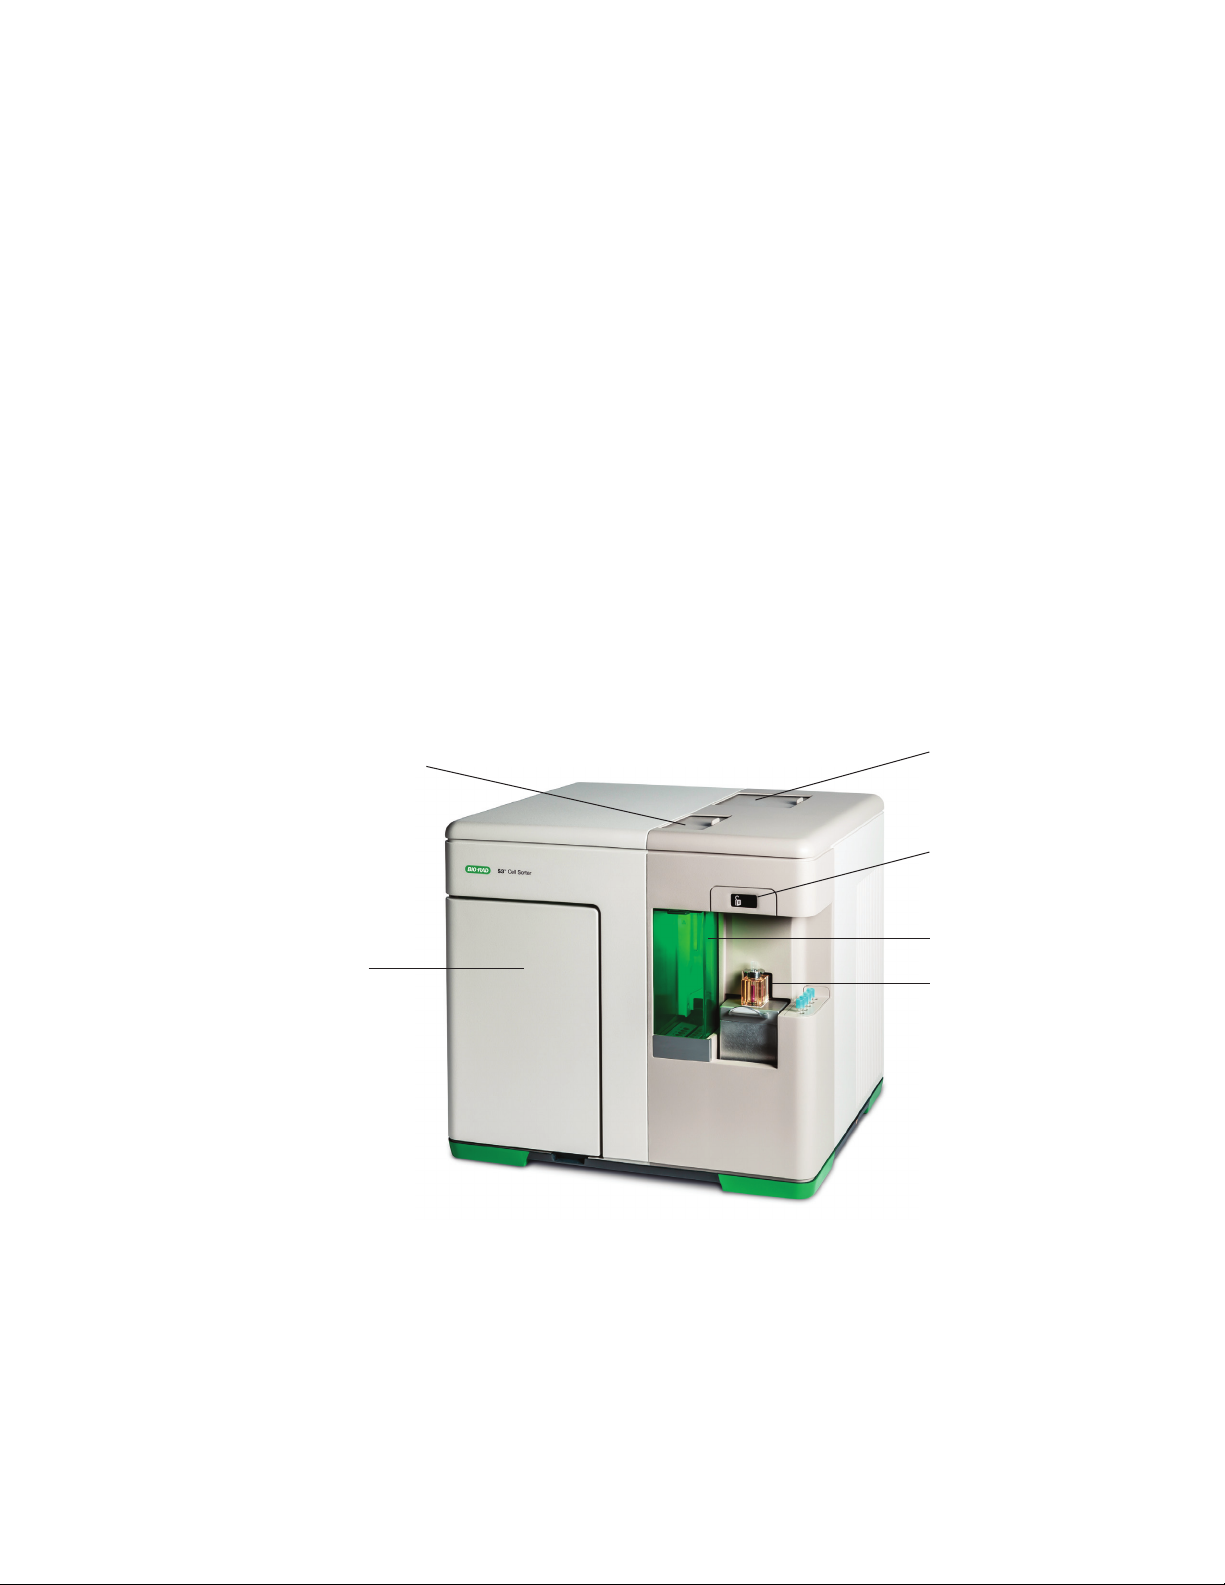
broken down into several subsystems (Figure 1).
Access to nozzle assembly
Access to internal
fluidics system
Fig. 1. Front view of the S3 system.
Access to filters
Touch locking system
Sort collection area
Loading stage
Instruction Manual | 3
Page 14
Hardware Description
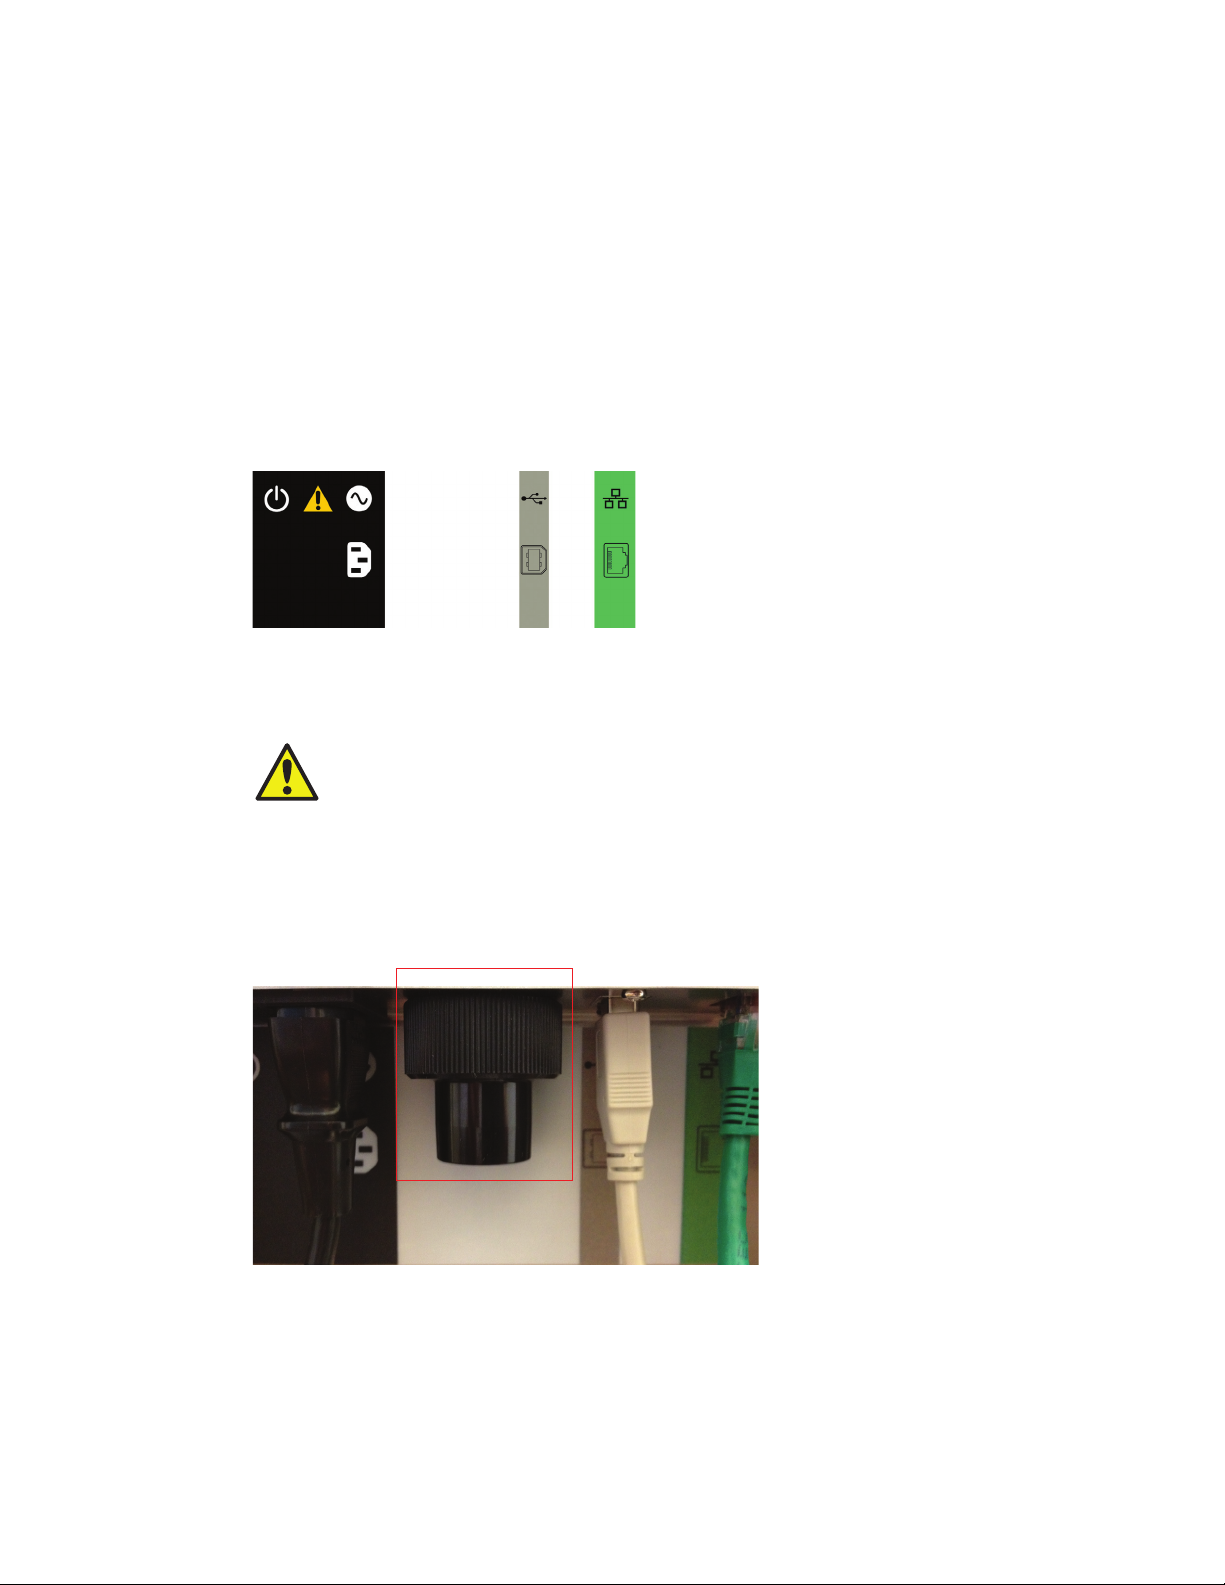
2.1.1 Instrument Back Panel
The rear connector panel of the S3 or S3e system includes these features:
n
Main power switch (black) — press the main power switch to turn on power to the system.
WARNING! The main power switch should not be used to shut down the system.
Perform system shutdown from the ProSort™ software. For more information, refer to
Chapter 8, Shutdown
n
Power input (black) — plug in the power cord here. The system requires 100 or 240 VAC outlet
n
USB port (gray) — use this port to connect the system to the computer for communication
n
Ethernet port (green) — use this port to connect the system to the computer for communication
There is a color-coded guide for proper connection location and orientation (Figure 2).
Fig. 2. Instrument rear connector panel.
CAUTION: Three cords connect the instrument to the computer for power and
communication. Be cautious when walking around the instrument, as these cords
can become a tripping hazard.
2.1.2 Aerosol Evacuation Port
The S3 and S3e systems also include an aerosol evacuation port used to directly evacuate the
sort collection chamber when connected to a biosafety system. This port can be covered when
not in use.
Fig. 3. Aerosol evacuation port.
4 | S3 and S3e Cell Sorters
Page 15

2.2 Fluidics System
The S3 and S3e fluidics system consists of the bulk fluidics, loading stage, nozzle, and sort
collection chamber. The fluidics system supplies sheath fluid, DI water, and sample to the
nozzle, and then collects the waste for proper disposal.
CAUTION: Biohazard! Biosafety is of utmost importance while operating this
instrument. Consult with your local safety officer or review local, state, and federal
regulations to ensure proper handling and disposal of biohazardous substances.
2.2.1 Bulk Fluidics
The S3 and S3e system includes two empty containers as part of the bulk fluidics. Table 6
describes the function of each container.
Table 6. Containers and their functions.
Label Container Function
Biohazardous The waste container holds the system’s fluid after it has run through the nozzle
Waste and waste lines. This container has a red cap and holds 4 liters of fluids.
Sheath Fluid The sheath fluid container holds the 8x sheath fluid for the system. This container
Deionized water The DI water container holds deionized water for mixing with the 8x sheath fluid to
(DI water) create a 1x sheath fluid. This container has a blue cap and holds 4 liters of DI
2.2 Fluidics System
Approximately 9 hours of run time can be performed until the empty container
is filled. The fluid collected in this container should be decontaminated as
appropriate to the application and samples being run on the instrument. Please
verify proper treatment and disposal with your safety officer or local health and
safety bodies
has a white cap and holds 4 liters of fluid. If preferred, 1x sheath fluid may be used
instead. In this case, the DI water container will not be used to dilute the sheath,
but only for rinsing and cleaning. If 1x sheath fluid is used, ensure the option is
checked in the Global Preferences of the software. This setting will apply globally
to the system when set by an administrator. A full container of 8x sheath fluid
has approximately 50 hours of run time, while a full tank of 1x sheath fluid has
approximately 9 hours of run time
water with a run time of approximately 9 hours between refills when using 8x
sheath fluid. The DI water is also used for cleaning at the end of the day and to
rinse the sample probe between samples
Note: The ProFlow™ 8x sheath fluid is diluted with the DI water using an internal fluidics chamber.
Each container uses a quick disconnect
Sheath fluid cap assembly
Sheath fluid container
system for easy swapping (Figure 4).
Both the DI water and the sheath fluid
containers have one connector, while
the waste container has two connectors
for waste fluid from the sorting chamber
and the washing station. Located above
the containers inside the instrument
is a magnetic holder for each quick
disconnect. The magnetic holder will
keep the quick disconnect away from
exchange area.
Fig. 4. Fluidics container highlighting the quick
disconnect system for the sheath fluid container.
Instruction Manual | 5
Quick disconnect
Page 16

Hardware Description
The sheath fluid and DI water are both filtered through a 0.2 µm filter to remove any particulates
from the fluid before circulating through the system. Fluidic levels are monitored by the software
using a weight measurement system. Below each fluidic container is a bulk fluidics tray. Each
tray contains a sensor that translates volume weight into fluidic run time and helps to keep the
system dry while swapping fluidics.
IMPORTANT! Replace filter cartridges on a regular basis. Filter replacement is part
of the annual service preventative maintenance visit. For additional information, refer
to Chapter 10, Maintenance.
2.2.2 Loading Stage
The loading stage consists of two functional stations; sample input and washing. The sample
input station is located in the front position of the loading stage and it supports a 5 ml,
12 x 75 mm tube (Figure 5).
Note: Polypopylene tubes for sample acquisition are recommended, but not required.
When a sample is loaded and ready to run, the loading stage can be moved into the run position.
To move the loading stage into the run position:
1. Push the handle on the loading stage down.
2. Push the loading stage inward.
3. Gently raise the loading stage into the run position.
The locking mechanism automatically engages when the tube is in the run position (Figure 6).
After the tube is locked, the entire sample chamber is pressurized and a short pressure boost is
applied to push the sample to the nozzle. After the boost, the sample line is pinched to prevent
sample flow until acquisition or sorting is selected in the software.
Fig. 6. Loading stage in the run position.Fig. 5. Loading stage in the wash position.
The washing station is located in the back of the loading stage and is not accessible to users.
When the sample input station is accessible, the washing station is automatically engaged.
The washing station is used during startup, shutdown, and in between samples. This will help
to reduce carryover since the sample line is cleared and the outside of the line is washed. The
loading stage is locked in position while washing and sampling.
6 | S3 and S3e Cell Sorters
Page 17
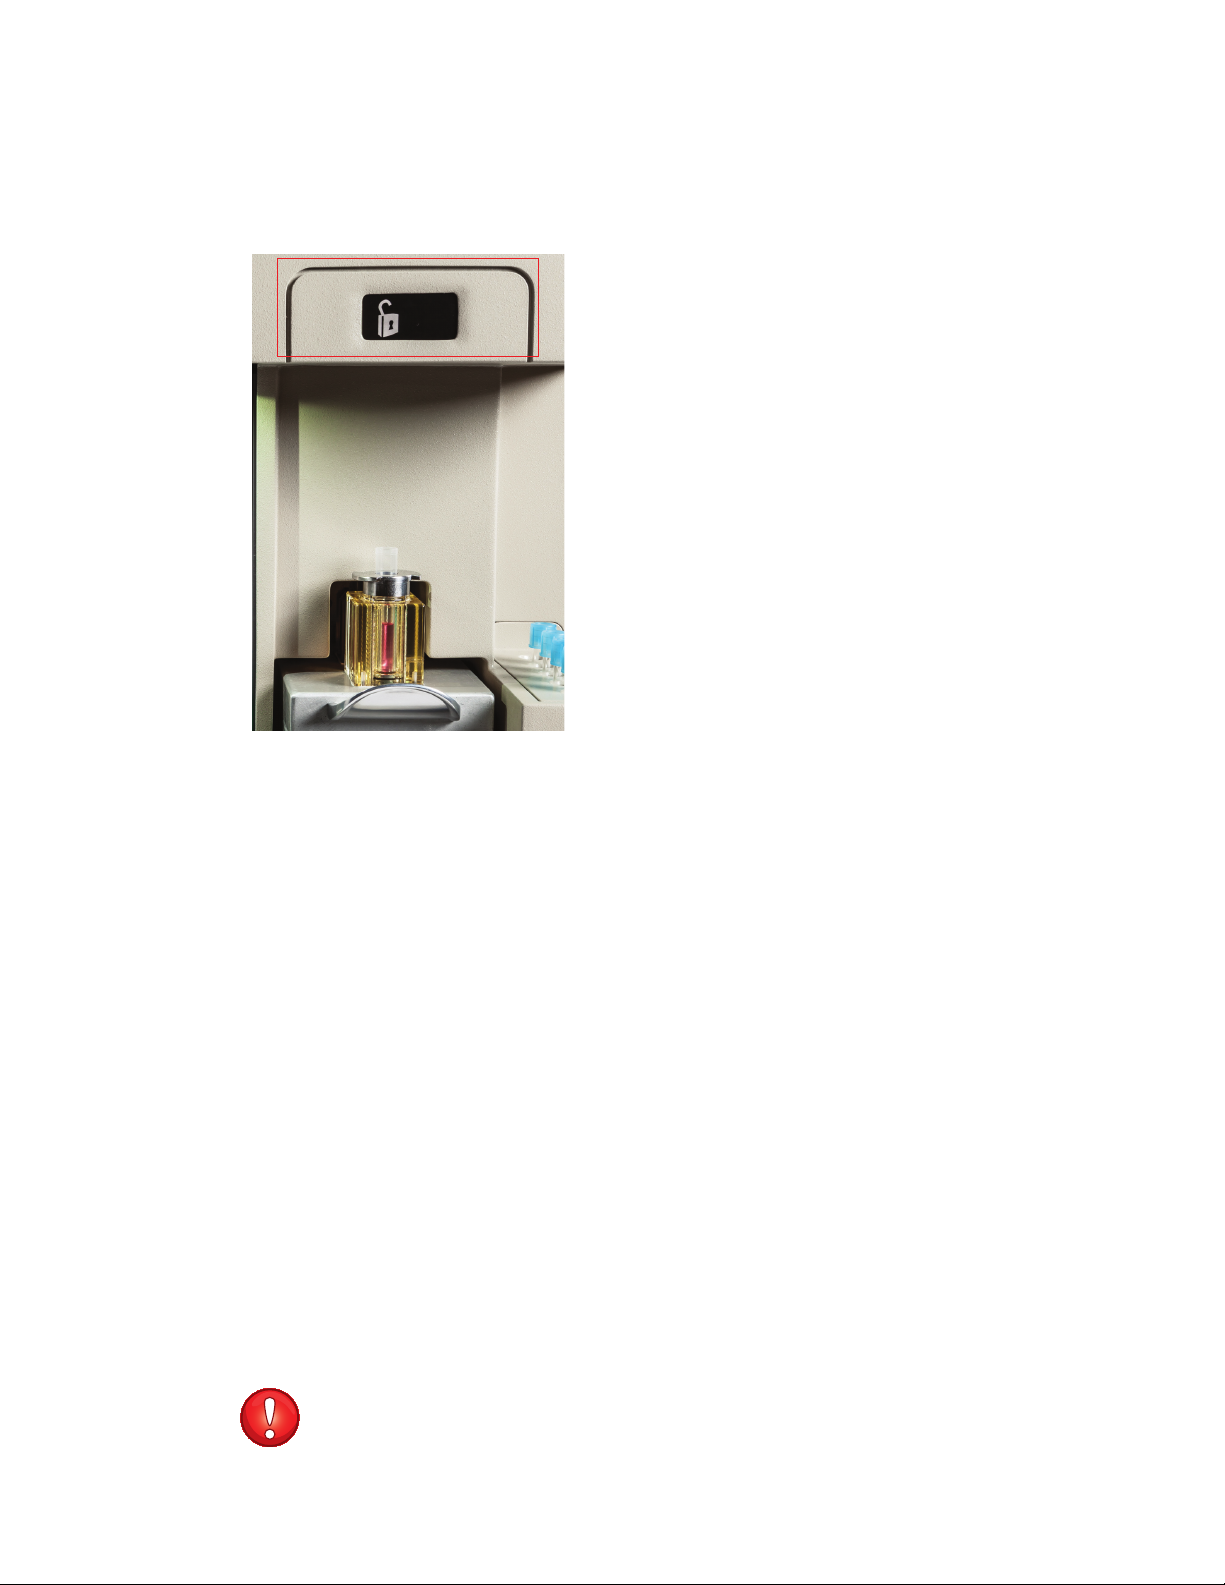
2.2 Fluidics System
During washing, a new sample can be loaded into the sample input station. The status of
the loading stage is displayed by a locked or unlocked padlock symbol located on the touch
locking system screen (Figure 7).
Fig. 7. Touch locking system screen.
To move the loading stage from the run position to the wash position:
1. Press the touch locking system screen until the padlock displays as unlocked. This will
depressurize and unlock the sample station.
2. Push the loading stage handle down, pull forward, and lift up.
WARNING! The loading stage uses a spring to push up into the run or wash position. To prevent
the loading stage from over-springing into position and possibly damaging the instrument,
guide the loading stage into the run or wash position by holding onto the handle for a smooth
movement into position.
Note: If the loading stage is in the wash position and another wash is required, press the touch
locking system screen to perform washing again.
The temperature of the sample input station and the sort tube holder can be controlled from the
ProSort Software via a single Peltier solid state system. The temperature range can be set from
4–37ºC in 1ºC intervals.
The sample input station is capable of mixing the sample. Sample mixing is performed by
vortexing. Users can set the vortexing speed to high, low, or off, depending on the sample type.
Note: It is recommended that resuspended adherent samples are mixed at the high speed to
prevent clumping.
IMPORTANT! It is highly recommended that samples are filtered prior to running. This
will minimize clogs in the sample tube and nozzle tip.
Instruction Manual | 7
Page 18

Hardware Description
2.2.3 Nozzle
The nozzle controls many crucial aspects associated with sorting such as:
n
Creating a stable vibration to generate droplets
n
Hydrodynamically focusing the sample
n
Removing air from the nozzle (debubbling)
The nozzle compartment (Figure 8) can be accessed through the top, front sliding door. The
nozzle tip is a 100 µm orifice for centering the sheath stream to the laser interrogation point. The
tip may be removed for cleaning or to remove a clog from the nozzle stage.
Note: If the nozzle door is opened, lasers will be shuttered, sample will be stopped, and the
stream will be disabled.
IMPORTANT! Refer to Chapter 10, Maintenance, for a detailed procedure on
removal, cleaning, and replacement of the nozzle assembly and nozzle tip. This is
performed using the Swap Nozzle Tip wizard.
CAUTION! Shock hazard! The nozzle door is interlocked and will disable stream
charge when opened. Only qualified and trained personnel can override this interlock.
A B
Fig. 8. Nozzle compartment containing the nozzle stage. A, Agilis System; B, AutoGimbal System.
2.2.4 Sort Collection Chamber
The deflection plates are located in the sort collection chamber (Figure 9). When these plates
are electrostatically charged they direct the sorted droplets into the appropriate tubes. These
plates should remain clean and dry for optimal deflection.
IMPORTANT! Both plates should be cleaned on a regular basis. If a significant
amount of sheath fluid builds up on the plates due to a clog or misalignment, arcing
between the plates can occur. When arcing is sensed by the system’s electronics, the
plates will be disabled and a message will appear in the software. Using a cotton
swab, clean the plates and remove any stray fluid before attempting to sort.
Sorted samples can be collected into three collection vessels listed below.
n
1.5 ml tubes
n
5 ml tubes, 12 x 75 mm
8 | S3 and S3e Cell Sorters
n
8-well strips
n
Microscope glass slides
Page 19

Deflection plates
Fig. 9. Sort collection chamber and deflection plates.
2.3 Optics
The sort positions for each collection vessel are numbered and will correlate to the position
numbering in the software when the sort logic and limits are set. When placing tubes in the
sort chamber for sorting, it is recommended to add media or buffer to the tube to help prevent
sorted cells from drying out and to cushion their collection. The minimum recommended
volume is 0.5 ml of media or buffer for each 5 ml tube. Quick-attaching adaptors are available
for the 8-well strips or microscope slides. Adaptors are part of the accessory kit and they can
be kept inside the fluidics door for storage.
2.3 Optics
The S3 and S3e optics include the laser(s), mirrors, filters, and lenses, which guide the laser
light to the stream of sample and collect scattered and emitted light for detection.
CAUTION! Biohazard! When running samples and sorting, hazardous aerosols may be
created depending on the sample type. To prevent hazardous aerosols from spreading,
keep the green containment door closed as often as possible. Consult with your local
safety officer or review local, state, and federal regulations to ensure proper handling and
disposal of biohazardous substances including samples, sorted fractions, and waste.
CAUTION! Shock hazard! The sort deflection plates in the sort chamber are
charged while sorting. An interlock on the sort chamber door will disable the plates
when opened. Only qualified personnel should override this interlock.
CAUTION! Laser hazard! Laser radiation can be hazardous. Please do not override
optical interlocks or remove light shields, as they are in place for your safety. Only
trained personnel should access the exposed laser beam.
2.3.1 Laser
The S3 and S3e Cell Sorters are installed with a 488 nm, 100 mW laser for cell and particle
interrogation that passes through the system in the sample core. The laser power and shutter
can be controlled through the software interface. An optional 561 nm or 640 nm 100 mW laser
are available as a second excitation source.
Instruction Manual | 9
Page 20

Hardware Description
2.3.2 Beam Shaping Optic (BSO)
The beam shaping optic sits in between the laser(s) and the interrogation point. This serves to
shape and focus the laser beam(s) to optimize the illumination of the cell.
2.3.3 Interrogation
The interrogation point is the point at which the laser beam(s) intercepts the core stream of
the sample. At this point, light is scattered around each individual particle and the particle
fluoresces if any fluorophores are attached.
2.3.4 Light Collection
Light is collected from two directions, forward and side angle. The light can be categorized into
two types — scattered and fluorescent. Scattered light refers to the wavelength of light coming
from the laser, which is scattered when a particle is encountered. Fluorescent light refers to the
light emitted by the fluorophores or dyes attached to the particle or cell after excitation from the
laser. This emitted light is of a higher wavelength than the excitation light and therefore can be
separated and detected using optical filters.
2.3.5 Forward Scatter
Light coming around the particle in the forward direction (same plane as the laser beam) is
collected to give an indication of particle size. By default, the scattered laser light is collected,
but fluorescent light could be collected by changing the filter.
2.3.6 Optical Filters
Optical filters are coated pieces of glass used to divide the spectrum of light into bands for
analysis. By separating and detecting different bands of light, it is possible to understand
multiple properties of each particle.
IMPORTANT! When removing or replacing filters, wear gloves to avoid depositing
smudges and fingerprints on the glass surfaces. Please see Section 10.5, Optical
Filter Cleaning, for specific instructions on cleaning optical filters.
2.3.7 Photomultiplier Tubes (PMTs)
The PMTs are used to detect and amplify the light signals coming from each particle. They are
located behind the optical filters to detect specific bands of light based on the fluorophores that
are attached to the cell.
2.3.8 Cameras
The S3 and S3e Cell Sorters contain several cameras for system alignment and calibration. The
function of each of these cameras is detailed below.
Note: Cameras do not require adjustments by users.
n
Pinhole camera — aligns the stream and laser to the optical detection path. This camera is
viewable only by service personnel and during the nozzle tip swap process
n
Droplet camera — calibrates the droplets and maintains the drop delay. The image of the
break-off can be visualized in the software through the Droplet Monitor option on the home tab
n
Streams camera — calibrates the side streams and aligns them with the collection tubes. This
camera can be visualized in the software through the View Streams option on the home tab
10 | S3 and S3e Cell Sor ters
Page 21
2.4 Electronics
The S3 and S3e electronics process and deliver the emitted light signals to the software for
user analysis. Also included in this subsystem are the deflection plates in the sort chamber and
the safety interlocks.
CAUTION! Shock hazard! Only qualified, trained technicians should carry out
service work on electronic components due to potential shock hazard.
2.4.1 Interlocks
To prevent exposure to laser light and shock hazards, the S3 and S3e systems are equipped
with safety interlocks (Figure 10). On the instrument control panel of the software, the
instrument status box will show visual indicators if these interlocks have been disengaged.
Note: When opened, the nozzle door will close the laser shutters to prevent laser light
exposure. This interlock will also turn off the drop drive and the stream.
IMPORTANT! Open this door only if required to clear a clog or change the nozzle tip.
The QC procedure must be repeated to readjust the alignment and reset the drop
delay if this door is opened.
2.4 Electronics
The sort door interlock will disable the plate voltage. In addition, if sample is running it will
be stopped.
Fig. 10. S3 and S3e safety interlocks.
2.4.2 Pre-Amplifier
The pre-amplifiers are used to boost the signal coming from the PMT.
Laser shutter interlock
Sort door interlock
2.4.3 ADCs
Analog to digital converters (ADCs) convert the electrical signal coming from the pre-amplifier
into a digital signal and transfer that signal to the software for visualization of the data.
Instruction Manual | 11
Page 22

12 | S3 and S3e Cell Sorters
Page 23

3
ProSort™ Software
This chapter describes the features of the ProSort Software. The software is the main interface
for the S3™ or S3e™ Cell Sorter System, giving overall status and providing control.
To start the software, double click the ProSort icon (Figure 11) on the desktop.
Fig. 11. ProSort Sof tware icon.
The login window will appear (Figure 12). This window will also appear when switching users.
Enter your user name and password to log in. Session notes may be added and will be logged
with the user session in the user report for administrative use. These notes will appear in the
user report when viewed.
Note: If an automatic startup has been scheduled, the login and startup windows will appear
different. Please refer to Chapter 9, Automatic Startup for details.
Fig. 12. User login window.
ProSort offers two modes of user control, administrator and user. The administrator mode
provides additional control and access over user mode. Differences between the two modes
are shown in Table 7. For more information on administrator privileges, refer to Section 3.3,
Administrator Tab Toolbar.
Instruction Manual | 13
Page 24
ProSort Software
Table 7. Control differences between administration and user modes.
Control Administrator User
Startup • •
Shutdown • •
RunQC • •
PrintQCreports • •
PrintQCtrendingreports • •
EditQCcriteria •
Viewdroplets • •
Viewdropletsettings • •
Editdropletsettings •
Viewstreamscamera • •
Editstreamsettings •
Acquisition • •
Sort • •
Printanalysisreports • •
Printsortreports • •
Printuserreports •
Changeuserpassword • •
Changeuserrights •
Deleteusers •
Createusers •
Editusers •
Resetotheruserpasswords •
3.1 Main Software Window
The main software window contains tools for system operation and data analysis. Depending
on user control mode, the main software window will either display more or fewer features.
Features available in the main software window for user mode are shown in Figure 13.
Title bar
File menu and tabs
Instrument control
PMT control
Instrument status
box
Workspace
Fig. 13. Main software window for user mode.
14 | S3 and S3e Cell Sorters
Status bar
Page 25

3.1.1 Title Bar Buttons
The title bar of the main software window provides the items listed in Table 8.
Table 8. Title bar buttons in the main software window.
Button Command Function
Save Saves FCS file after acquiring sample
Sign out/ Signs out the current user and returns the software to the login window. If
Switch user the shutdown procedure was not performed prior to sign out, the system will
Undo Certain commands can be undone and reverted to the previously existing
3.1.2 File Menu
The dropdown file menu provides the items listed in Table 9.
Table 9. File menu buttons and their function.
Button Command Function
3.1 Main Software Window
maintain startup and QC. The next user will need to log in to start a new run
state. Examples of functions that can be undone are: deleted region, deleted
gate, deleted histogram or density plot, moved region or gate, creation of a
plot or region, compensation adjustment
New protocol Opens a new protocol tab in the workspace
Open protocol Opens an existing protocol. An FCS file may also be selected at this time. The
protocol used to acquire the data will be loaded from the FCS file
Load instrument Opens an existing protocol’s settings and loads them into the current protocol.
settings The current protocol must be saved
Save protocol Saves the current protocol
Open FCS with Opens FCS file and will load data into the embedded protocol. All contents of
protocol the protocol (such as plots, regions, sort logic, notes) will be displayed
Save FCS file Saves the current FCS file
Save partial Saves the last user defined number of events from the acquired sample. The
FCS file number of events to be saved is entered by the user before saving the file
Print Opens the print window.
Note: Use the print preview option to see where page breaks occur
Page orientation Changes between a printable landscape or portrait workspace
Preview Opens the print preview window
number, serial number, etc.)
Recent Protocols
protocols for the
Recent F CS File s
files for the user
About Displays software information (software, hardware, firmware version
About...
List of recent Lists the recent protocols used by the logged-in user
user that is logged in.
List of recent FCS Lists the recent FCS files used by the logged-in user
that is logged in.
Instruction Manual | 15
Page 26
ProSort Software
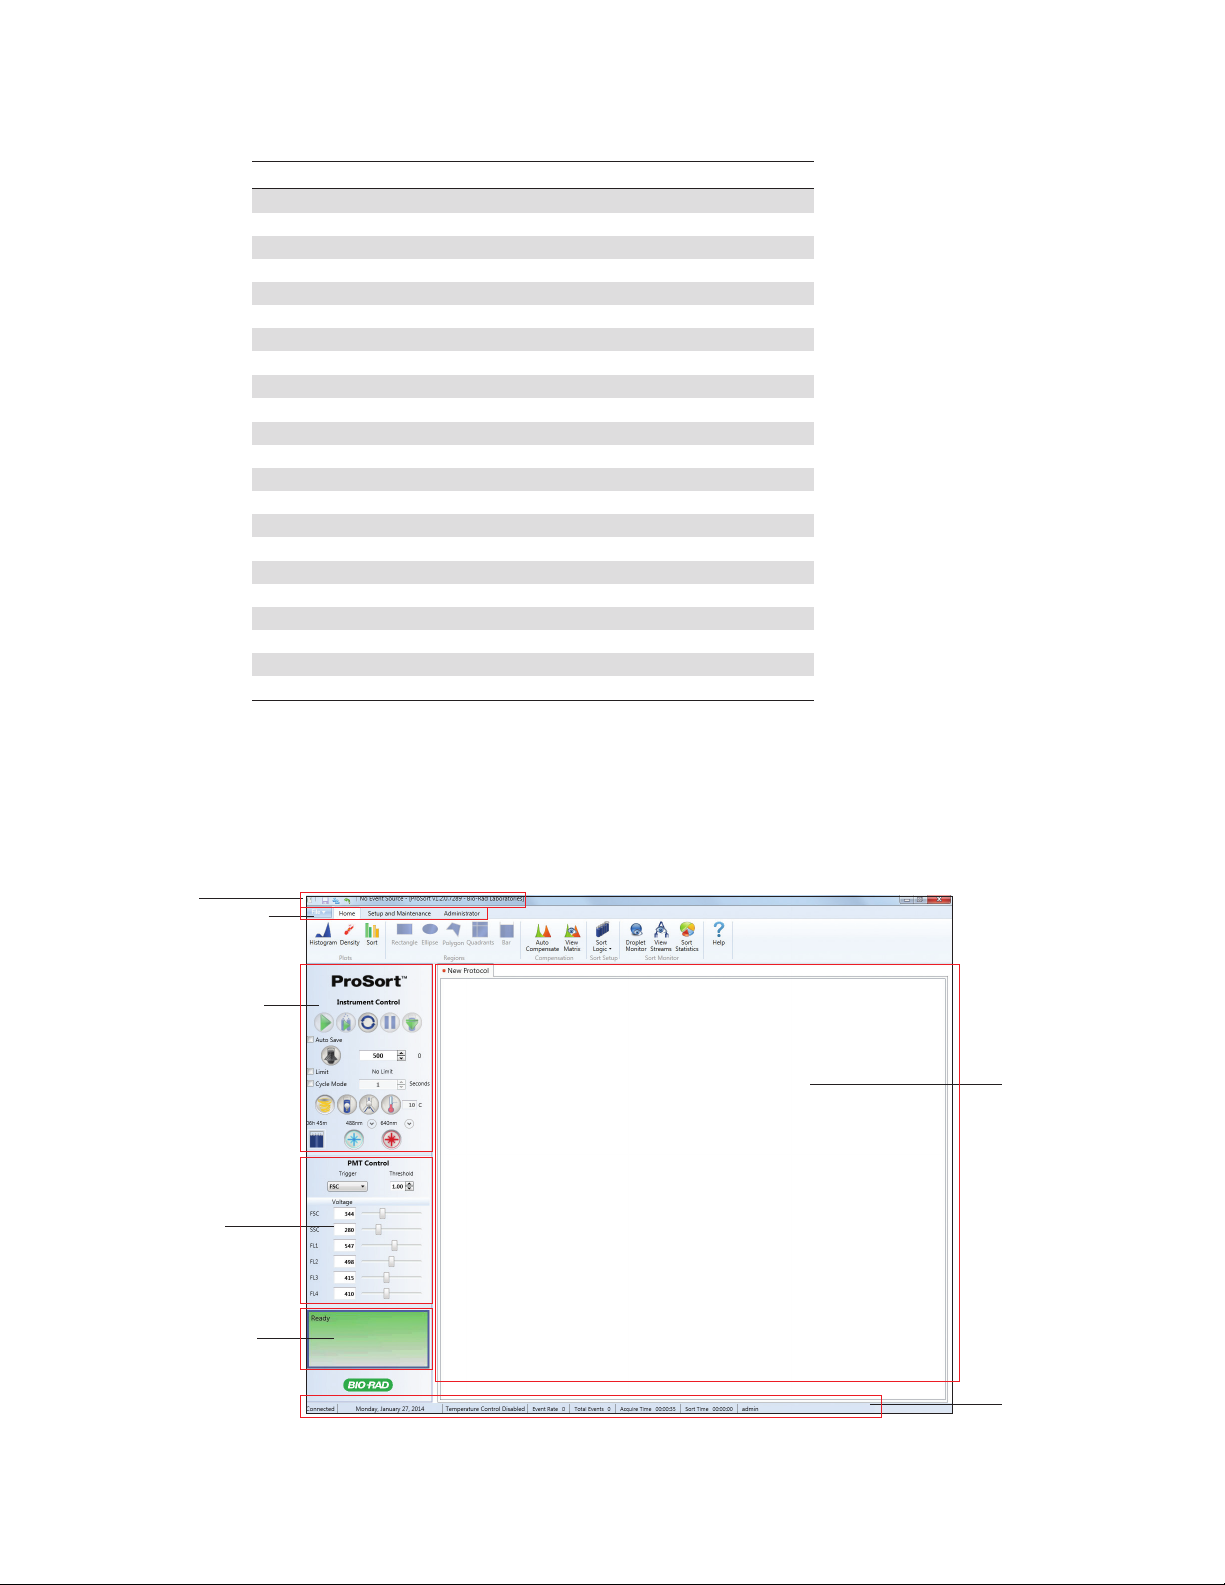
3.1.3 Home Tab Toolbar
The Home tab toolbar consist of six sections for basic workspace functions and sort options
(Figure 14):
n
Plots — available plots for viewing data. Table 10 describes the plots and their functions
n
Regions — different shapes for selecting region of interest. Table 11 describes the regions
and their functions
n
Compensation — perform fluorescence compensation. Table 12 describes the
compensation buttons and their functions
n
Sort Setup — collection vessel and sort logic criteria for a run. Table 13 describes the sort
setup buttons and their functions
n
Sort Monitor — monitor the sort of a run. Table 14 describes the sort monitor buttons and
their functions
n
Help — opens the user manual in PDF format
Fig. 14. Home tab toolbar.
Table 10. Plot buttons and their functions.
Button Name Function
Histogram Adds a new histogram to the current protocol. The histogram can be resized
by dragging the bottom right corner
Density Adds a new density plot to the current protocol. The density plot can be
resized by dragging the bottom right corner
Sort Adds a sort plot to the current protocol. The sor t plot can be resized by
dragging the bottom corner. The sort plot graphically shows the sorts and
aborts in each sort position.
Table 11. Region buttons and their functions.
Button Name Function
Rectangle Adds a rectangular region to the selected density plot. If a density plot is not
selected, this region will be grayed out. The region can be moved, resized,
rotated, and/or deleted
Ellipse Adds an ellipse region to the selected density plot. If a density plot is not
selected, this region will be grayed out. The region can be moved, resized,
rotated, and/or deleted
Polygon Adds a polygon region to the selected density plot. If a density plot is not
Select each desired point and move the mouse cursor outside the density plot
16 | S3 and S3e Cell Sorters
selected, this region will be grayed out
to complete. The region can be moved, resized, and/or deleted
continues
Page 27

3.1 Main Software Window
Table 11. Region buttons and their functions (continued).
Button Name Function
Quadrant Adds a quadrant region to the selected density plot. If a density plot is not selected,
this region will be grayed out. The region can be moved, resized, and/or deleted
Bar Adds a bar region to the selected histogram. If a histogram is not selected, this region
will be grayed out. The region can be moved, resized, and/or deleted
Table 12. Compensation buttons and their functions.
Button Name Function
Auto Opens the Automatic Compensation Calculation Wizard window. This wizard will
Compensation assist in establishing the proper compensation matrix coefficients. Single control
FCS files must be acquired and saved prior to using this feature.
View Matrix Opens the Compensation Matrix window. Users can view and edit the compensation
matrix in this window
Table 13. Sor t Setup buttons and their functions.
Button Command Function
Sort Logic Opens the Sort Logic window. By default, 5 ml tube is selected for the Sort Logic
window. Users can click on the Sort Logic dropdown arrow to select 1.5 ml tube,
8-well strip, or glass slide
5 ml tube Indicates that 5 ml tube is selected as the collection vessel. Individual mode and
limits may be set for each 5 ml tube in each direction
1.5 ml tube Indicates that 1.5 ml tube is selected as the collection vessel. Individual mode and
limits may be set for each 1.5 ml tube in each direction
8-well strip Indicates that 8-well strip is selected as the collection vessel. Sort limits or mode can
be set for each well in an 8-well strip
Glass slide Indicates that glass slide is selected as the collection vessel. Sort limits or mode can
be set for each microscope slide. A maximum of 500 events can be sorted onto each
location on the slide
Table 14. Sort Monitor and help buttons and their functions.
Button Name Function
Droplet Monitor Opens the Droplet Monitor window. Droplets will be visible in this window after
performing a QC procedure. The status of droplet maintenance is shown in this window.
The currently set drop delay and drop drive amplitude are also shown in this window
View Streams Opens the View Streams window. This camera shows the sort streams at a point just
above the collection vessel
Sor t Statistics Opens the Sort Statistics window. The window displays sort count, sort rate,
percentage abort count, rate and %, efficiency, etc. Sort Statistics can be added to the
print window for reporting. This window will open automatically when a sort is started
Help Opens a PDF file of the user manual as a reference
Instruction Manual | 17
Page 28
ProSort Software
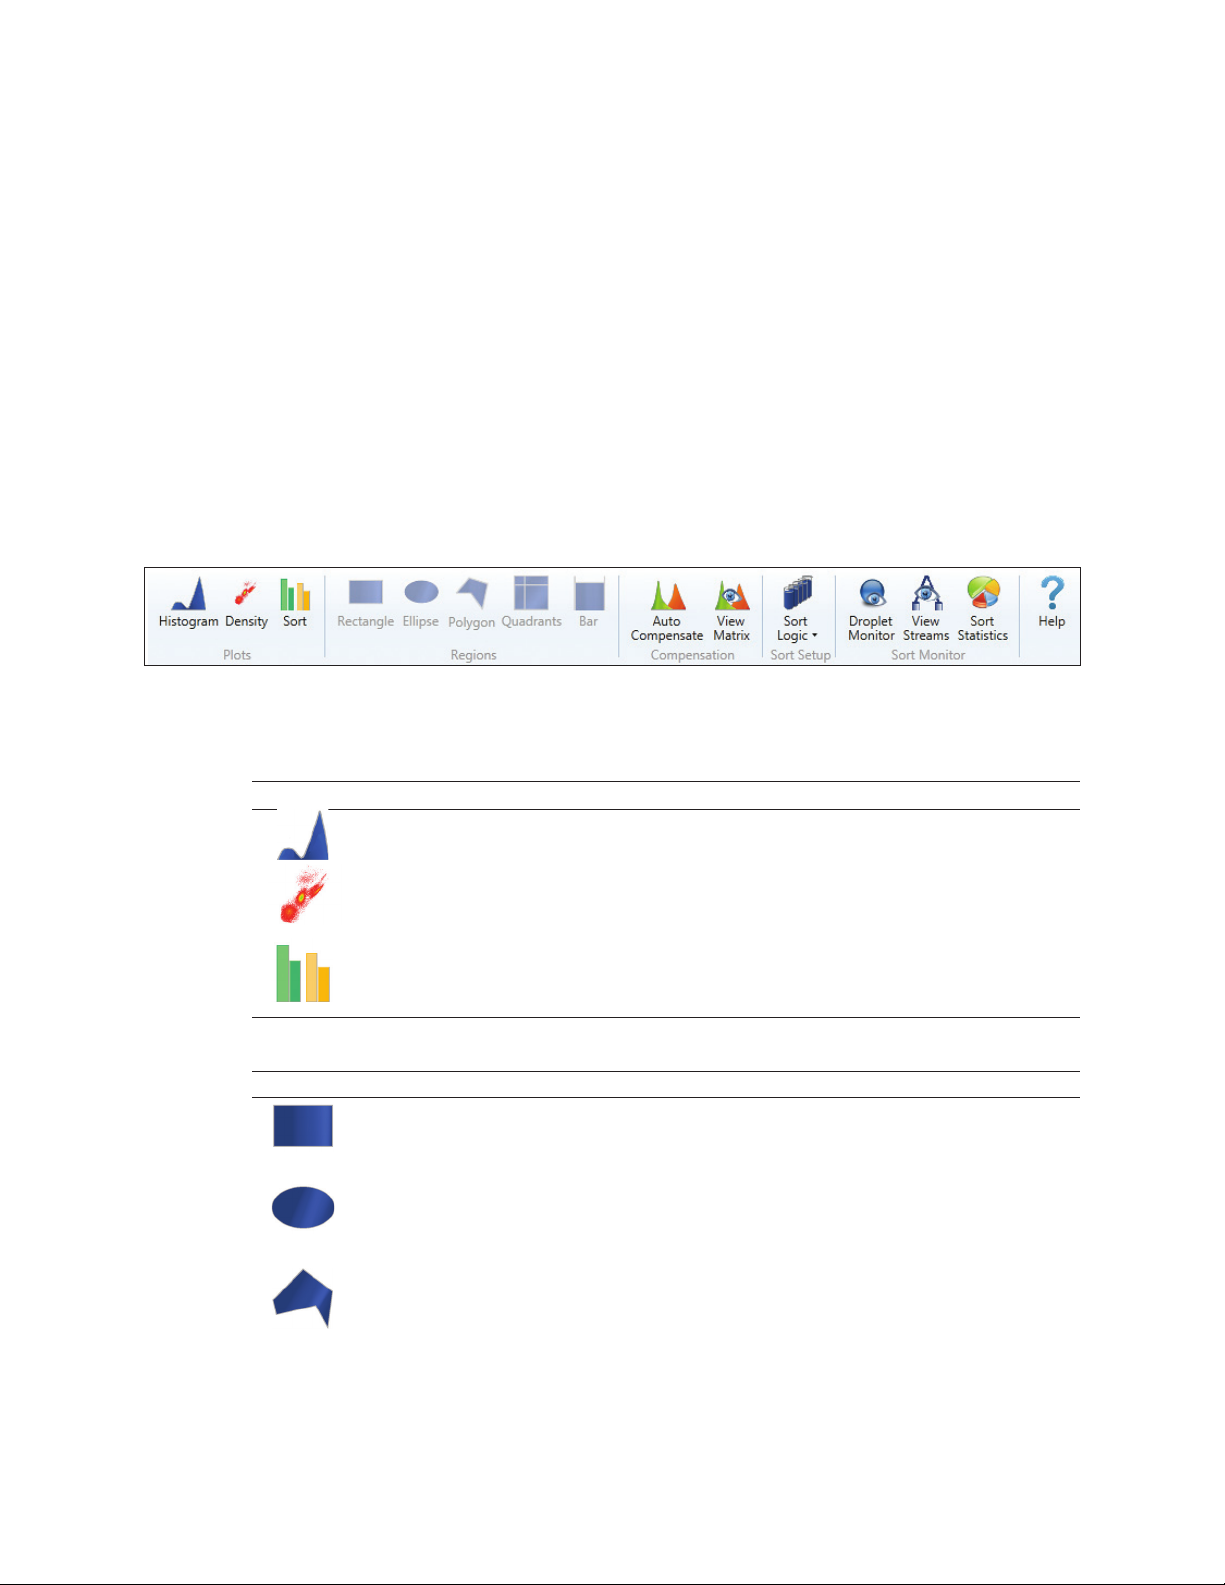
3.1.4 Setup and Maintenance Tab Toolbar
The Setup and Maintenance tab toolbar consists of five sections (Figure 15):
n
System — startup or shutdown the instrument from the software. Table 15 describes the
system buttons and their functions
n
Quality Control (QC) — perform or review QC runs. Table 16 describes the QC buttons and
their functions
n
Fluidics — access common fluidic functions. Table 17 describes the buttons and their functions
n
Other — additional features. Table 18 describes the additional features and their functions
n
Publish — features for supporting publications. Table 19 describes the publish features and
their functions as well as the toolbar’s remaining user buttons and their functions
Fig. 15. Setup and maintenance tab toolbar.
Table 15. System buttons and their functions.
Button Name Function
Start-Up Starts up the system by starting the sheath flow, turning on the laser(s), and
backflushing the sample line
Use this button to start up the system if auto startup has not been selected
Shutdown Shuts down the system. The shutdown button is not active unless the loading
stage is in the wash position. The shutdown button will prompt to clean system
and schedule an auto startup
Table 16. Quality control buttons and their functions.
Button Name Function
Run QC The daily QC procedure ensures optimal system performance and should
be completed every day prior to running samples. The procedure consists of
placing a tube of ProLine
break-off, setting up side streams, adjusting event rate, aligning nozzle,
adjusting PMTs, checking the coefficient of variation (CVs) and voltages,
calculating drop delay, and placing the system in droplet monitor mode. The
progress of this procedure will be displayed on screen
Trending Daily QC data are compiled into trending reports. These reports show trending of
CVs, PMT voltages, drop delays, etc. over a range of dates. This date range may
be selected in the report screen. These reports may be saved and/or printed
QC Report This button shows and allows saving and/or printing of the daily QC report.
This report includes date, user, CV/PMT/droplet info, etc
™
calibration beads on the system, setting the droplet
18 | S3 and S3e Cell Sorters
Page 29

3.1 Main Software Window
Table 17. Fluidics buttons and their functions.
Button Name Function
Debubble Removes bubbles from nozzle
Unclog Allows user to pull vacuum in the case of a nozzle clog. Use this option before
removing the tip for sonication or replacing with a new nozzle tip
Swap Tip Stops the sheath flow to allow nozzle tip replacement. A wizard will appear to
walk the user through a nozzle change. Once the tip has been replaced, QC
needs to be rerun to verify alignment and set the drop delay
Swap Fluidics Allows fluidic containers to be swapped without shutting the system down.
Prepare a full replacement or empty container prior to pressing this button, as
a three-minute timer starts after the button is pressed
Clean Cleaning can be done at low or high pressure. High pressure cleaning will cause
the system to stop maintaining droplets and a QC procedure must be run before
sorting. If cleaning between samples, the low pressure option is recommended
Table 18. Other buttons and their functions.
Button Name Function
Annotation Adds an annotation window to the workspace. Annotations added prior to
saving will be saved to the FCS file’s embedded protocol
Image Allows an image to be added to the workspace. The image can be moved
or deleted. If added prior to saving, this image will be saved to the FCS file’s
embedded protocol
Basic Adds basic information to the print page in the form of a header. This information
Information includes date, time, user login, serial number, filename, event source. If added
prior to saving, this information will be saved to the FCS file’s embedded protocol
Filter Configuration Adds the optical layout to the print page showing PMT and optical filter setup.
This can be modified to match the actual filters if they have been changed. If
added prior to saving, this will be saved to the FCS file’s embedded protocol
Table 19. Publish and user buttons and their functions.
Button Name Function
Preview Displays a preview of the page layout(s) setup prior to printing
Page Orientation Changes between a printable landscape or portrait workspace
Print Opens the print dialog to select printer, number of copies, etc. and print.
Note: Use the print preview option to see where page breaks occur
Print Options Adds additional windows or instrument settings to the page layout for printing.
Change Password Allows the currently logged-in user to change password
System Log Opens window for system log. Displays date, time, error, error details. This
option is helpful when working with technical support and service engineers
for troubleshooting
Instruction Manual | 19
Page 30
ProSort Software
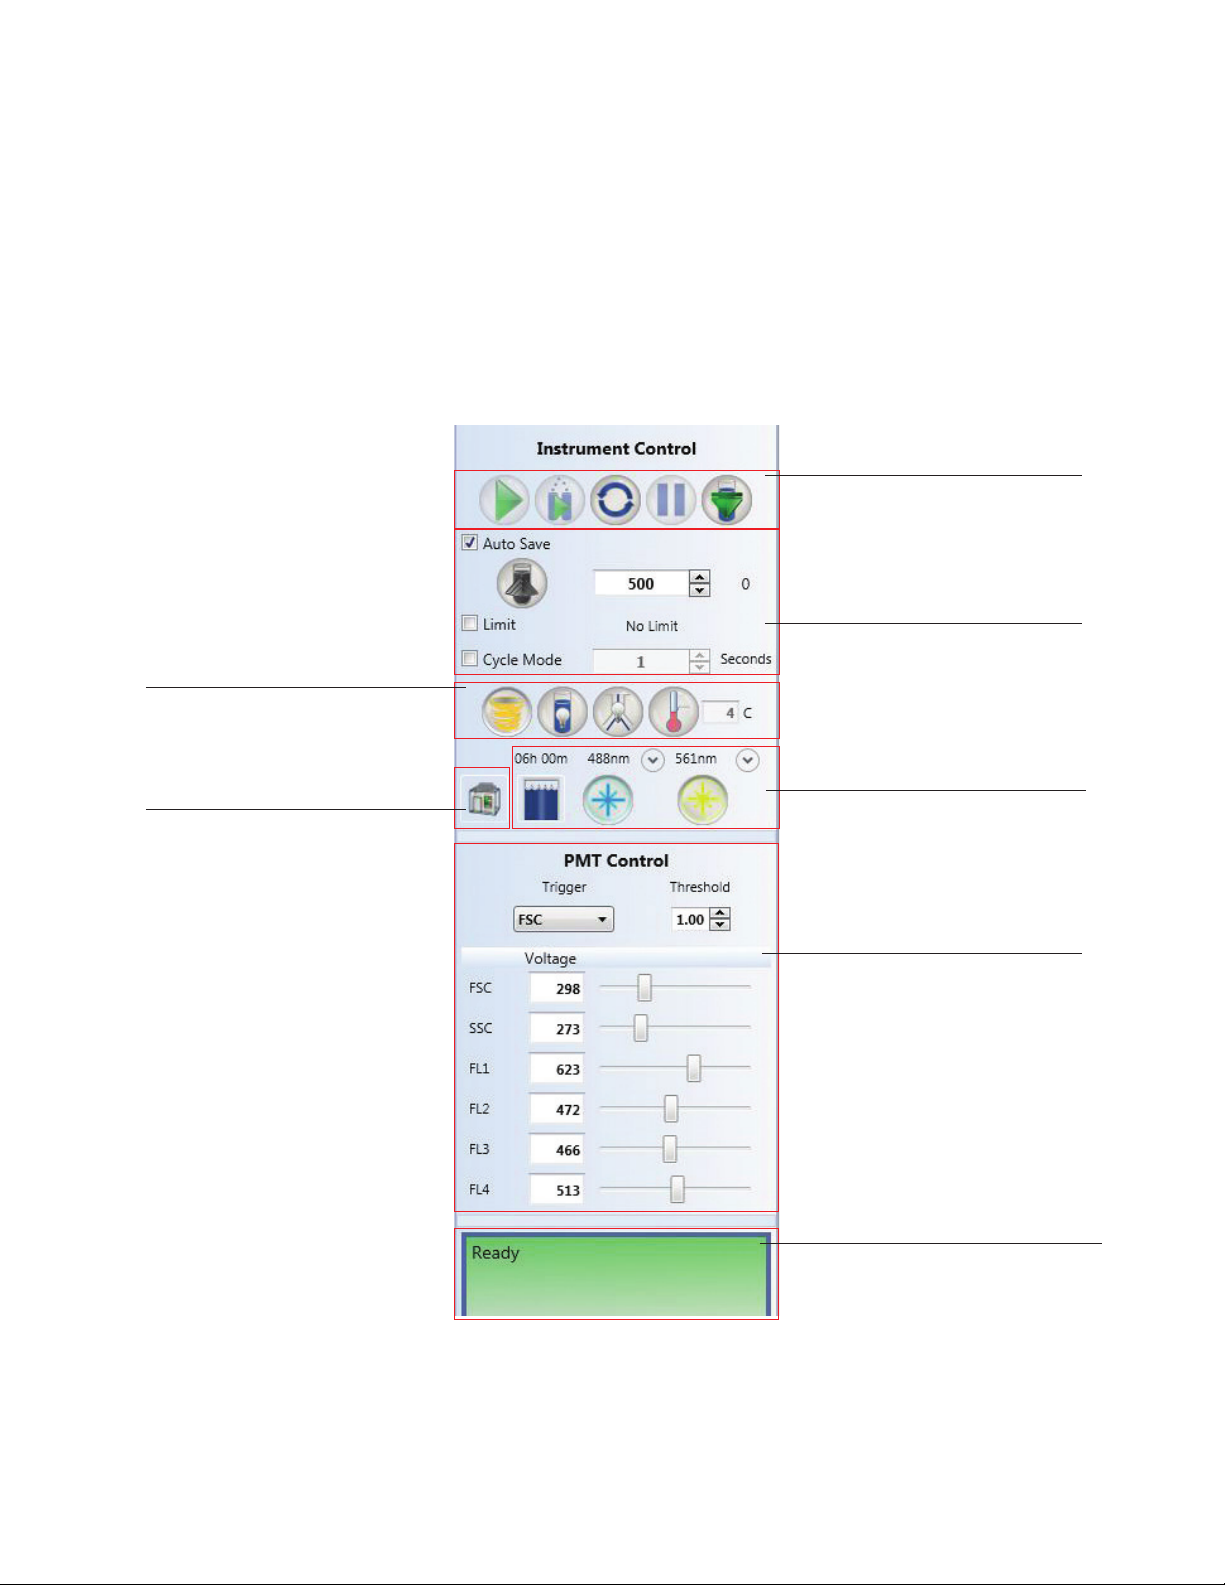
3.2 Control Panel
System operation is performed and monitored with the control panel (Figure 16). The control
panel consists of three parts:
n
Instrument control — controls for performing a run
n
PMT control — controls for modifying the PMTs
n
Instrument status box — displays the status of your instrument
Instrument control buttons are described in Table 20 and PMT control buttons are described in
Table 21.
Sample agitation high/low button
Sample station light on/off button
Sample collection area light on/off button
Temperature control on/off button
Temperature control option
Biosafety System serial number
Biosafety System firmware version
Biosafety System status
Time remaining on filter life
Temperature inside the system
Start/Stop acquisition button
Start/Stop sort button
Refresh data button
Pause/Restart sample acquisition
button
Eject sample tube button
Auto save sample upon reaching limit
Preset sample event rate button
Enter sample event rate
Event limit option
Cycle mode option
Gate limit option
Time remaining with fluidic volume
Fluidics Status window button
Laser on/off button
Laser power options
Fig. 16. Overview of instrument and PMT control panel.
20 | S3 and S3e Cell Sorters
Trigger channel
Threshold value
Alter PMT voltages
Assign values for detection channels
Instrument status box
Indicator of actions required or
needing attention
Page 31
3.2 Control Panel
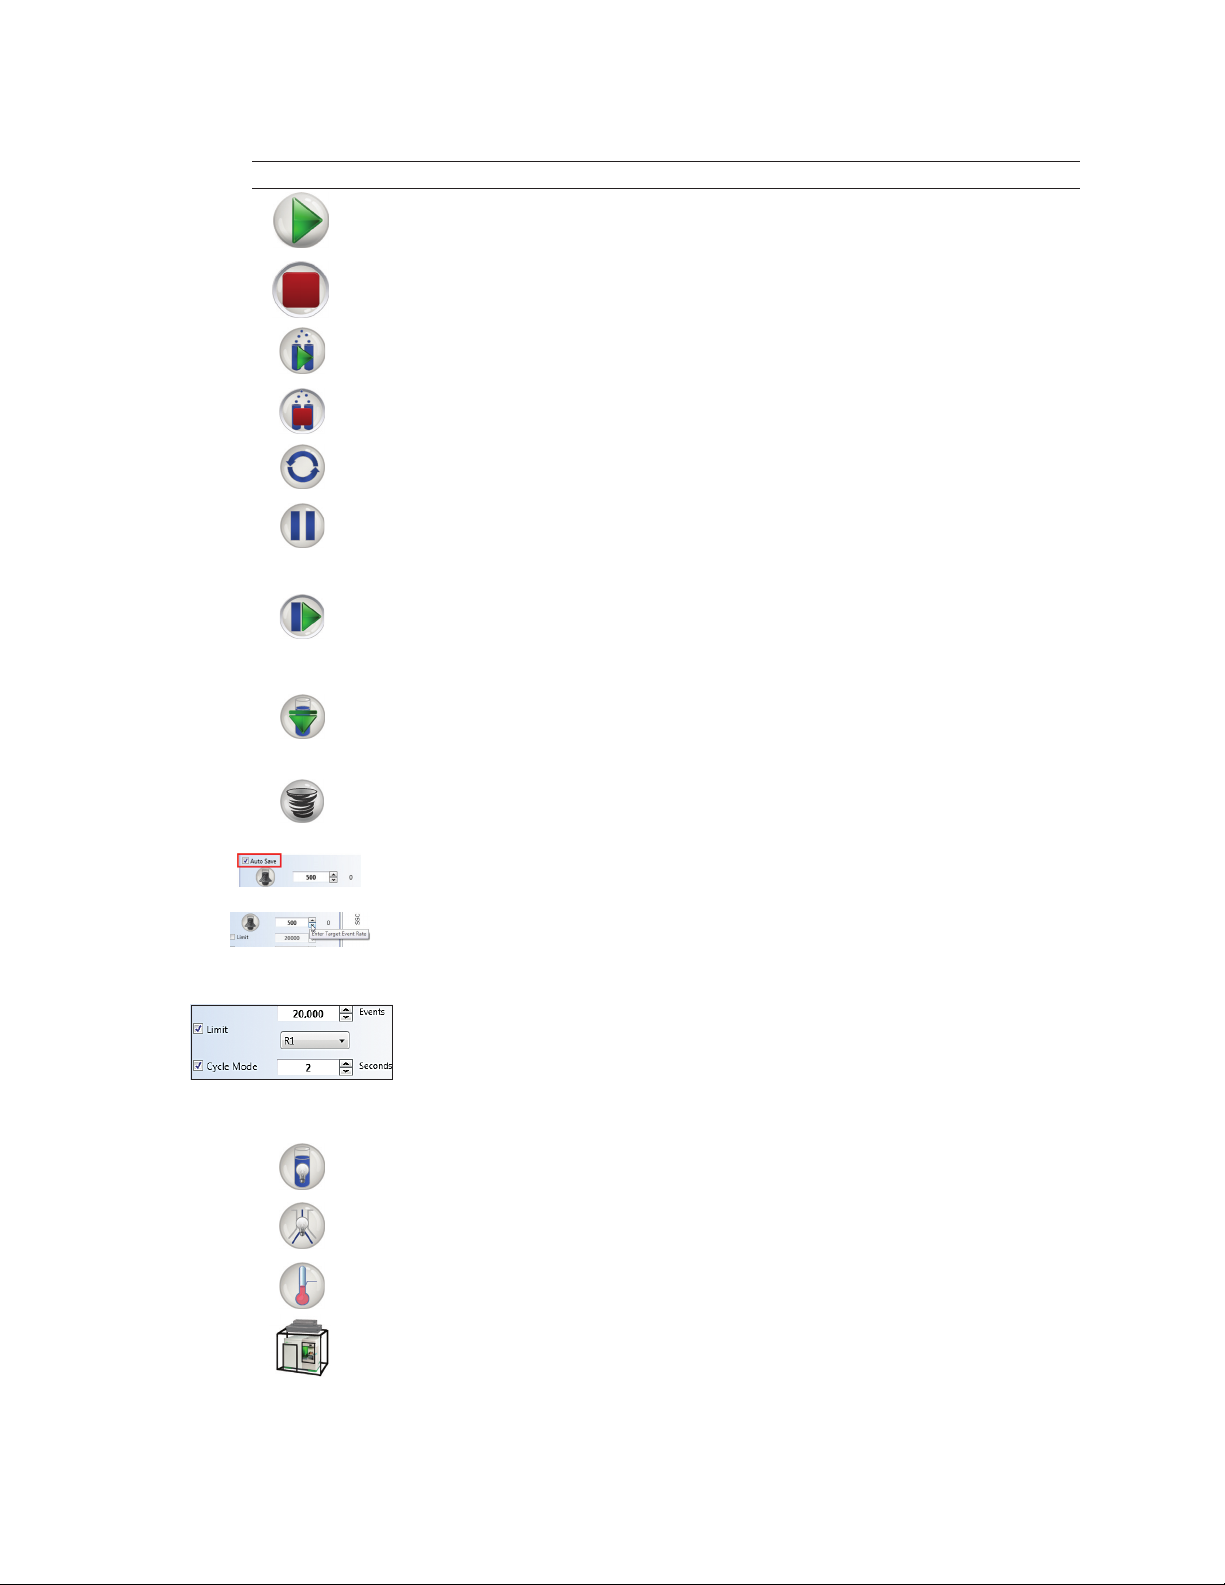
Table 20. Instrument controls and their functions.
Button Name Function
Start Sample Starts sample acquisition. If a data file is loaded and it has been saved,
Acquisition the data will clear and acquisition will start
Stop Sample Stops acquisition and sample flow. Regions, gates, and annotations may
Acquisition be modified before saving the FCS file
Start Sorting Starts sorting. If a data file is loaded and it has been saved, the data will
clear and sorting will start
Stop Sorting Stops sorting and sample flow. Regions, gates, and annotations may be
modified before saving the FCS file
Clear Acquired Data Clears acquired data. All plots and statistics will be refreshed.
Pause Sample Pauses sample acquisition and sample flow. The data at this point may be
appended (by the Resume function) or saved as is. Saving after pausing will
disable the Resume function. To remove sample tube, unlock the touchscreen
locking system located above the loading stage after pausing acquisition
Resume Sample Resumes acquisition when a sample has been paused. Resuming will
append the paused FCS file and the time paused can be seen on a time
histogram. If you have removed the sample tube it must be returned and
relocked before acquisition can be resumed
Eject Sample Tube Depressurizes and unlocks the sample. The loading stage can be moved
into wash position to access sample. The touchscreen locking system can
also be used to unlock the sample
Adjust Sample Starts or stops agitation of the sample. There are three levels of agitation:
Agitation low, high, and off. Click this button once to set to low, twice to set to high,
and three times to turn off agitation
Auto Save When checked, automatically prompted to save a data file after
acquisition stops.
Target Event Rate Allows selection of target event rate for sample acquisition or use of preset
sample rates low/med/high based on sample concentration
Limit When checked, stops data acquisition after the number of events entered
has been reached
Gate Limit When checked, data acquisition stops after the number of events entered
has been reached within the selected gate
Cycle Mode When checked, automatically refreshes the data displayed according to
the entered time. The acquired data set continues to accumulate in the file
Sample Chamber Turns the sample chamber light on and off
Light
Enable/Disable Sort Illuminates entire sort collection chamber for easy viewing of deflection
Chamber Light plates, sort stream, and collection vessels
Enable/Disable Enables or disables temperature control of the sample station and sort
Temperature Control collection vessel
Biosafet y Indicates the status of the biosafety system and gives information on filter life.
System Status If the biosafety system loses connection, cannot connect, or if the filter life is
at 0% an error will occur and not allow the user to sort or acquire.
continues
Instruction Manual | 21
Page 32

ProSort Software
Table 20. Instrument controls and their functions (continued).
Button Name Function
Fluidics System Indicates the status of the fluidics system and run time information. When
Status the fluidics system is down to an hour of run time, the fluidics status
window will automatically open to show which container needs attention.
If the run time reaches 5 min, the fluidics will automatically shut down
Toggle 488 nm Controls the 488 nm laser shutter. The shutter is interlocked for safety. When
Laser Shutter this button is grayed out, either the laser is off or the interlock is open
Toggle 561 or 640 nm Controls the 561 or 640 nm laser shutter. The shutter is interlocked for safety.
Laser Shutter When this button is grayed out, either the laser is off or the interlock is open
Adjust Laser The dropdown arrows next to each laser adjust the laser power. Actual
mWatt Power power is shown by hovering over the 488 nm, 561 nm, and 640 nm labels
Table 21. PMT controls and their functions.
Button Name Function
Editable The name for each parameter is editable and will be saved with the
parameter acquired FCS data. The edited parameter name will be applied to all
name plot axes, compensation controls, and filter configurations
PMT Voltage Adjusts the PMT voltage for the given detector
Select trigger The trigger parameter is used to alert the system to the presence of
parameter an event over the threshold. The default for this is Forward Scatter
Adjust threshold Threshold is a percentage of the trigger signal. The default value is 1.0%
setting
3.3 Administrator Tab Toolbar
The administrator tab is available only for administrator users. To change a user’s privileges,
refer to Section 3.3.5, Managing Users.
The toolbar for the administrator tab (Figure 17) consists of:
n
System and User Control — edit system controls and manage users
Table 22 describes the buttons in this section.
IMPORTANT! Adjusting any of these settings will impact the overall performance of
the system. Only knowledgeable users should make any changes to these settings.
All changes made here will apply globally to the system.
Fig. 17. Administrator tab toolbar.
22 | S3 and S3e Cell Sorters
Page 33

3.3 Administrator Tab Toolbar
Table 22. Administrator tab toolbar buttons and their functions.
Button Name Function
Edit QC Criteria View and edit the CV and PMT voltage criteria for the quality control
procedure. This may be done as a result of a bead lot change
Edit Droplets Edit the settings for droplet creation. These settings include drop drive amplitude,
drop drive frequency, charge phase, defanning, and drop delay. These settings are
automatically adjusted as part of the QC procedure and will result in sort changes.
These settings are grayed out while the system is maintaining
Edit Streams View sort streams and edit the settings for stream creation. These settings
Settings include deflection, charge plate voltage, defanning, phase, and test pattern
adjustment
Print User Report View usage reports including times, dates, and duration of system use for
all users
Manage Users Create new users, reset passwords for existing users, set rights, and
delete users
Decontaminate Run a decontamination wizard that will walk user through a complete fluidic
system decontamination. This will take approximately 2–3 hr
Calibrate Sample Reset the differential offset sample pressures, which returns the preset
Pressure Offset buttons (low, med, high) to their correct ranges
Global preferences Change global instrument options for sheath concentration used, idle
3.3.1 Editing QC Criteria
An administrator can edit the QC criteria used to pass or fail the instrument during the daily QC.
This should be performed only by an experienced user who has verified system performance.
The rewind arrow on the middle bottom of Edit QC Criteria window will reset the QC criteria to
the factory defaults for the system (Figure 18).
When receiving a new lot of ProLine calibration beads:
1. Download the bead lot file from the S3 or S3e Cell Sorter website,
www.bio-rad.com/cellsorter.
2. Click the green plus button (Figure 18).
3. Navigate to the new bead lot file.
4. Select the file and click Open.
The software will automatically update the QC criteria for the new lot of calibration beads.
Values in red indicate values that are not used for pass/fail criteria for QC. If you plan to enter
the bead lot information manually:
shutdown time limit, and boost adjustment, plot default options and file save
default location
1. Verify the acceptance criteria on the certificate of analysis.
2. Compare the old lot to the new lot.
3. Enter the new lot information into the Edit QC Criteria window.
IMPORTANT! Changes to these criteria will apply globally to the system.
Instruction Manual | 23
Page 34

ProSort Software
Fig. 18. Edit QC Criteria window with green plus
button and rewind arrow highlighted.
3.3.2 Edit Droplets
Droplet controls are available to the administrator for troubleshooting purposes. While the
system is maintaining, the drop delay, drop drive amplitude, and drop drive frequency cannot
be adjusted (Figure 19). If any of these settings is adjusted, use ProLine calibration beads to
recalculate the drop delay before running samples. The verify drop delay button at the bottom
of this screen will sort three puddles onto a slide which can be examined under a microscope
to confirm drop delay. These puddles will sort 100 events at the current drop delay – 1, the
current drop delay, and the current drop delay + 1.
CAUTION! Optimal settings are calculated automatically after performing a quality
control procedure. Adjusting any of these values will change the settings and will
affect the drop delay, including the break-off point.
3.3.3 Edit Streams
Streams controls are available to the administrator for troubleshooting purposes. While the
system is maintaining, these settings can be adjusted. Side streams can also be turned on or
off by checking the Enable Test Pattern box (Figure 20).
CAUTION! Optimal side stream settings are calculated automatically after performing
a quality control procedure. Adjusting any of these values will change the settings
and will affect the side streams and sort.
24 | S3 and S3e Cell Sorters
Page 35

Calibrate droplets
Recalculate drop delay
Verify drop delay
Close window
3.3 Administrator Tab Toolbar
Fig. 19. Droplet Controls window with drop settings highlighted.
Fig. 20. Streams Control window with Enable
Test Pattern highlighted.
Instruction Manual | 25
Page 36

ProSort Software
To check for stream defanning:
1. Locate the center stream. The stream is visualized as a small bright spot that is illuminated
by the stream laser.
2. Check the Enable Test Pattern check box the system will charge the side streams to
simulate a sort.
Fanning of the streams can be seen more easily with the center stream than the two side
streams. The test pattern will make the center stream slightly broader.
3. Determine if the center stream is one solid stream.
If the center stream spreads into several streams, the fanning should be adjusted.
4. Use the defanning slider until the center stream is as focused as possible (Figure 21).
5. Click the checkmark when completed to save the settings.
A
B
Fig. 21. Examples of a good center stream, A and a defanned center stream, B.
3.3.4 User Reports
User reports can be viewed, saved,
printed, and exported for analysis of
system usage and for billing purposes.
To display a user’s usage information,
select the date range of interest and
click Update (Figure 22).
26 | S3 and S3e Cell Sorters
Fig. 22. User Report window with date range highlighted.
Page 37

3.3.5 Managing Users
The Manage Users button opens the Manage Users window. This window allows an
administrator to add, delete, or edit users (Figure 23). Passwords can be reset and users can be
notified to reset their passwords from this window.
3.3 Administrator Tab Toolbar
Fig. 23. Manage Users window.
To edit a user’s information:
1. Click the pencil icon next to the
user’s name.
2. Modify user information in the Edit User
window (Figure 24).
3. Click Save.
Note: In the event that all administrator
passwords are lost or forgotten, call your
local technical support team to receive a
temporary password.
Fig. 24. Edit User window.
Instruction Manual | 27
Page 38

ProSort Software
3.3.6 Decontaminate
An administrator can run the decontaminate procedure if the system shows signs of heavy
background, noticeable debris when running water, or contamination. The complete
internal fluidic system will be decontaminated. Follow the wizard procedure located in
Section 10.7, Decontamination.
3.3.7 Calibrate Sample Pressure Offset
If the system shows an event rate of 0 when running calibration beads in the low setting, or if
it shows 500+ events, the offset will need to be reset. Using this tool will reset the differential
offset sample pressure, which will return the preset sample flow rates (low/med/high) back to
their correct ranges.
1. Load calibration beads into the sample station and move loading stage to the run position.
2. Click Calibrate Sample Pressure Offset.
A warning window will appear asking if the user wants to continue (Figure 25). ProLine
calibration beads must be running for this calibration process.
The system will automatically begin the calibration process (Figure 26). Once complete the
system offset pressure has been calibrated.
Fig. 25. Sample Calibration Warning dialog box.
Fig. 26. Calibration Sample Offset window.
28 | S3 and S3e Cell Sorters
Page 39
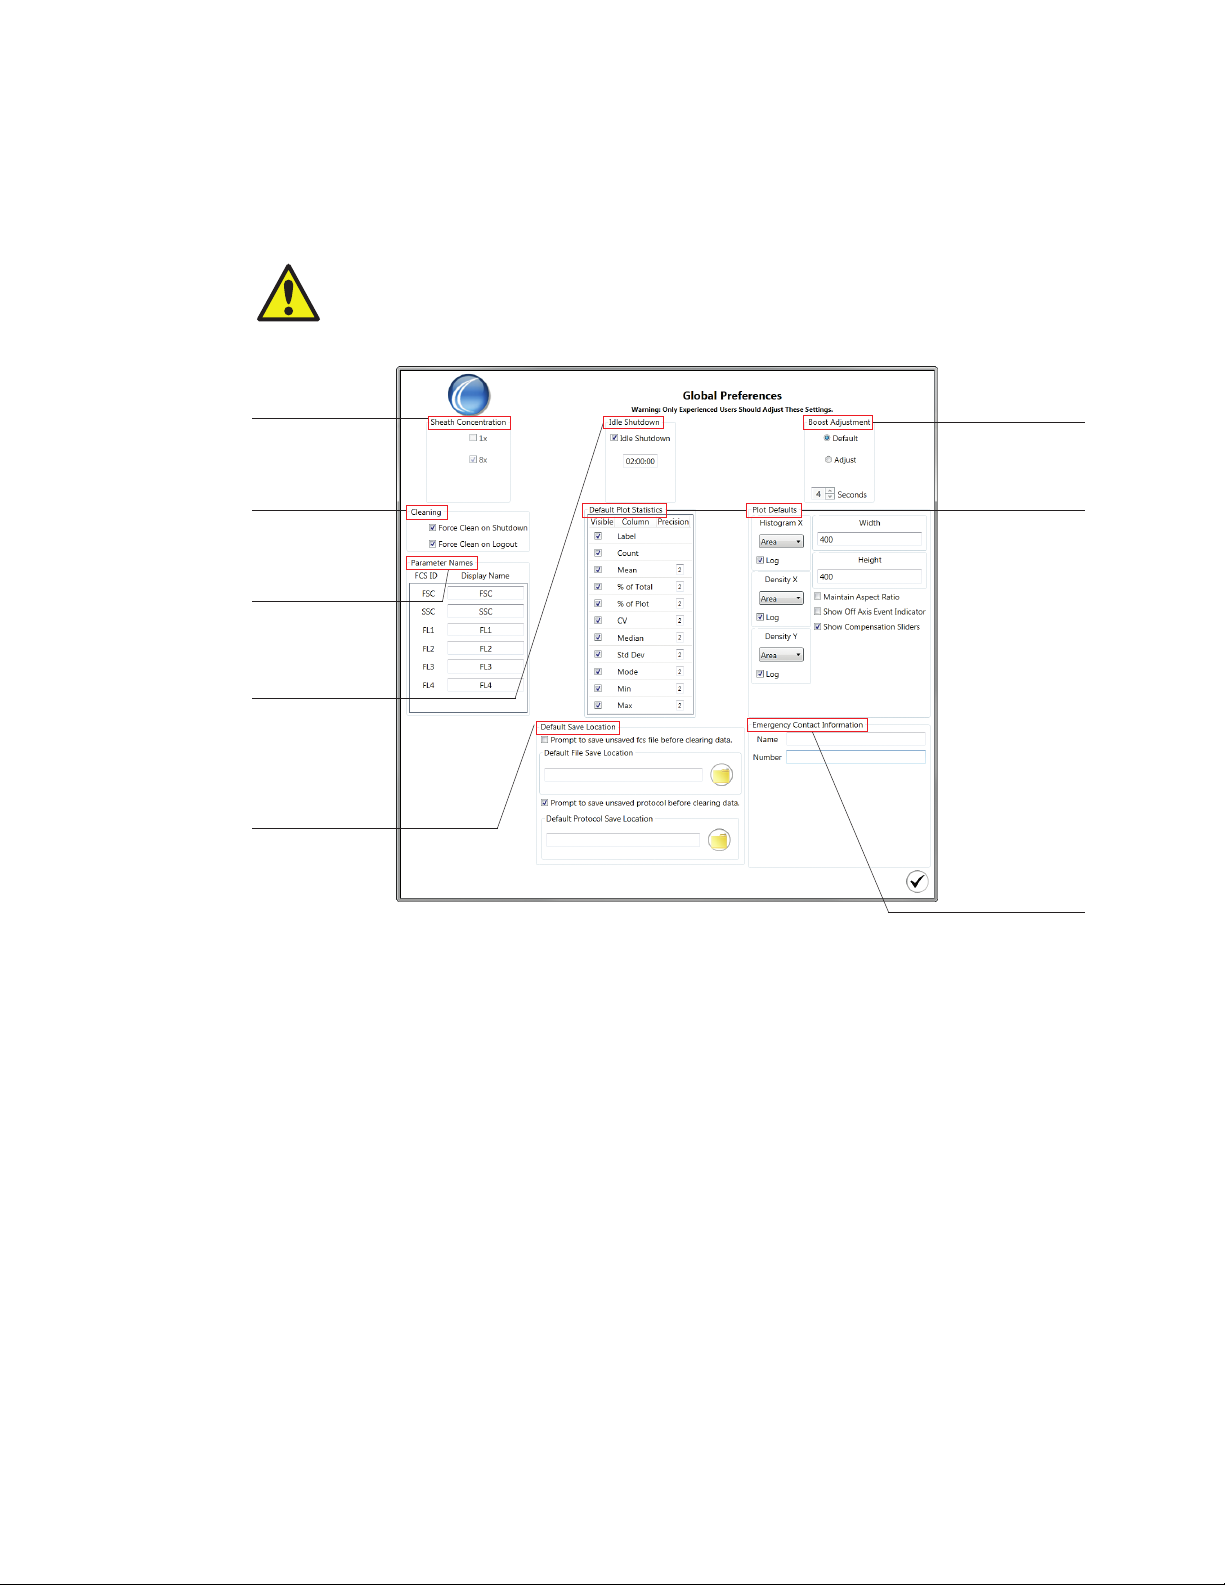
3.3.8 Global Preferences
Users with administrator privileges have the ability to change global settings for the instrument.
Changes to global preferences will become effective upon accepting the changes. Preferences
specific to plots will be displayed when new plots are created.
CAUTION! These settings are global and may influence other users’ experiments.
Adjusting any of these values will change the optimal settings for the instrument.
3.3 Administrator Tab Toolbar
Sheath can be
used at 8x or at 1x
concentration
Option to enable
mandatory cleaning
upon shutdown
or logout
Parameter names
can be preset to
have user-defined
names displayed
Define idle
shutdown option
and countdown time
n
Choose to prompt
user to save
unsaved FCS and
protocols
n
Define default
save file locations
Fig. 27. Global Preferences window.
Boost duration
can be increased
or decreased
Plot default options:
n
Define which plot
statistics to be
displayed and
number of digits
after the decimal
n
Choose which
axis parameter
will be displayed
and log verses
linear axis values
n
Define plot
display size,
maintain aspect
ratio of plots
n
Display and
highlight events
that are off axis
n
Display
compensation
sliders on plots
Define emergency
contact information
Sheath Fluid Options
The system can use 8x or 1x sheath solution. The default concentration is 8x. The 8x sheath
fluid will mix automatically with DI water prior to running through the system. One container of
8x sheath fluid will provide up to 50 hours of run time compared to 9 hours of run time for one
container of 1x sheath solution.
If a 1x sheath solution will be used, select 1x in the sheath concentration section prior to running
the system to avoid diluting the solution.
Idle Shutdown Time
The system has the ability to shut down automatically and start the shutdown procedure after
sitting idle for a designated time period. The system has a default setting of 2 hours.
This option helps to preserve laser lifetime and prevent the system from running overnight.
Instruction Manual | 29
Page 40

ProSort Software
Boost Adjustment
The default boost duration is optimized to bring the sample into position for interrogation by
the laser once acquisition is started. Default values can be restored by selecting Default. If this
value is adjusted, test the boost duration with a known sample to optimize the duration before
running the unknown samples.
Force Cleaning
There are two methods to end a user session in the software — log out or shut down. For both
methods, a Force Cleaning option is available to promote cleaning and maintenance of the
system. Force cleaning can help to avoid unnecessary clogs that can happen when the system
is not cleaned regularly or left overnight with sample in the lines.
Default Plot Statistics
Each plot can be displayed with statistics for all events or regions drawn on the plot. Each
statistic can be displayed or can be hidden by setting the preference. In addition, the number
of significant figures for each statistic can be defined. Once this parameter is changed the
subsequent new plots will reflect the new statistics defaults.
Plot Defaults
In this section there are several options that can be chosen.
n
Histogram and Density Plot axis parameters can be defined and set in the global
preferences. The user can choose the default axis parameter type: Area, Height, or Width. In
addition, the axis can be displayed in log or linear scales. Log can be selected as the default
by checking the box. Once these parameters are changed, subsequent new plots will reflect
the new parameter defaults
n
The width and height of the plot can be defined specifically. The default number of pixels
is 400 x 400. In addition, the aspect ratio can be maintained if the box is checked for this
option. This option applies to both histograms and density plots. Once this parameter is
changed, subsequent new plots will reflect the new size default
n
Events may fall off scale and be displayed on or below the axis. A preference can be chosen
to show an arrow indicator when events are off scale. This will help to raise awareness that
some settings may need to be adjusted
n
Auto compensation is the recommended method to compensate samples properly and in a
statistically correct method. Compensation sliders can be selected to be displayed or hidden
on the density plot axes when the compensate box is checked. Compensation bars can also
be used to make compensation adjustments, however proper gating and match medians
must be used to compensate correctly
30 | S3 and S3e Cell Sorters
Page 41
3.3 Administrator Tab Toolbar
Parameter Names
Each parameter is defaulted to its channel name (FSC, SSC, FL1, FL2, FL3, and FL4). The
default parameter name can be entered by the user. This will be the parameter name for all new
protocols created once the preferences have been changed.
Note: Parameter names can also be changed on the instrument panel but they will revert to
default names when a new protocol is opened. Refer to Section 5.1.6, PMT Voltages, to see
how to change names on the instrument panel.
Default Save Location
The software can autosave after each file has finished acquiring. Files can be saved to a default
destination folder on the computer. This can be set for both protocols and for FCS files. In
addition, there is an option to require a prompt prior to clearing data.
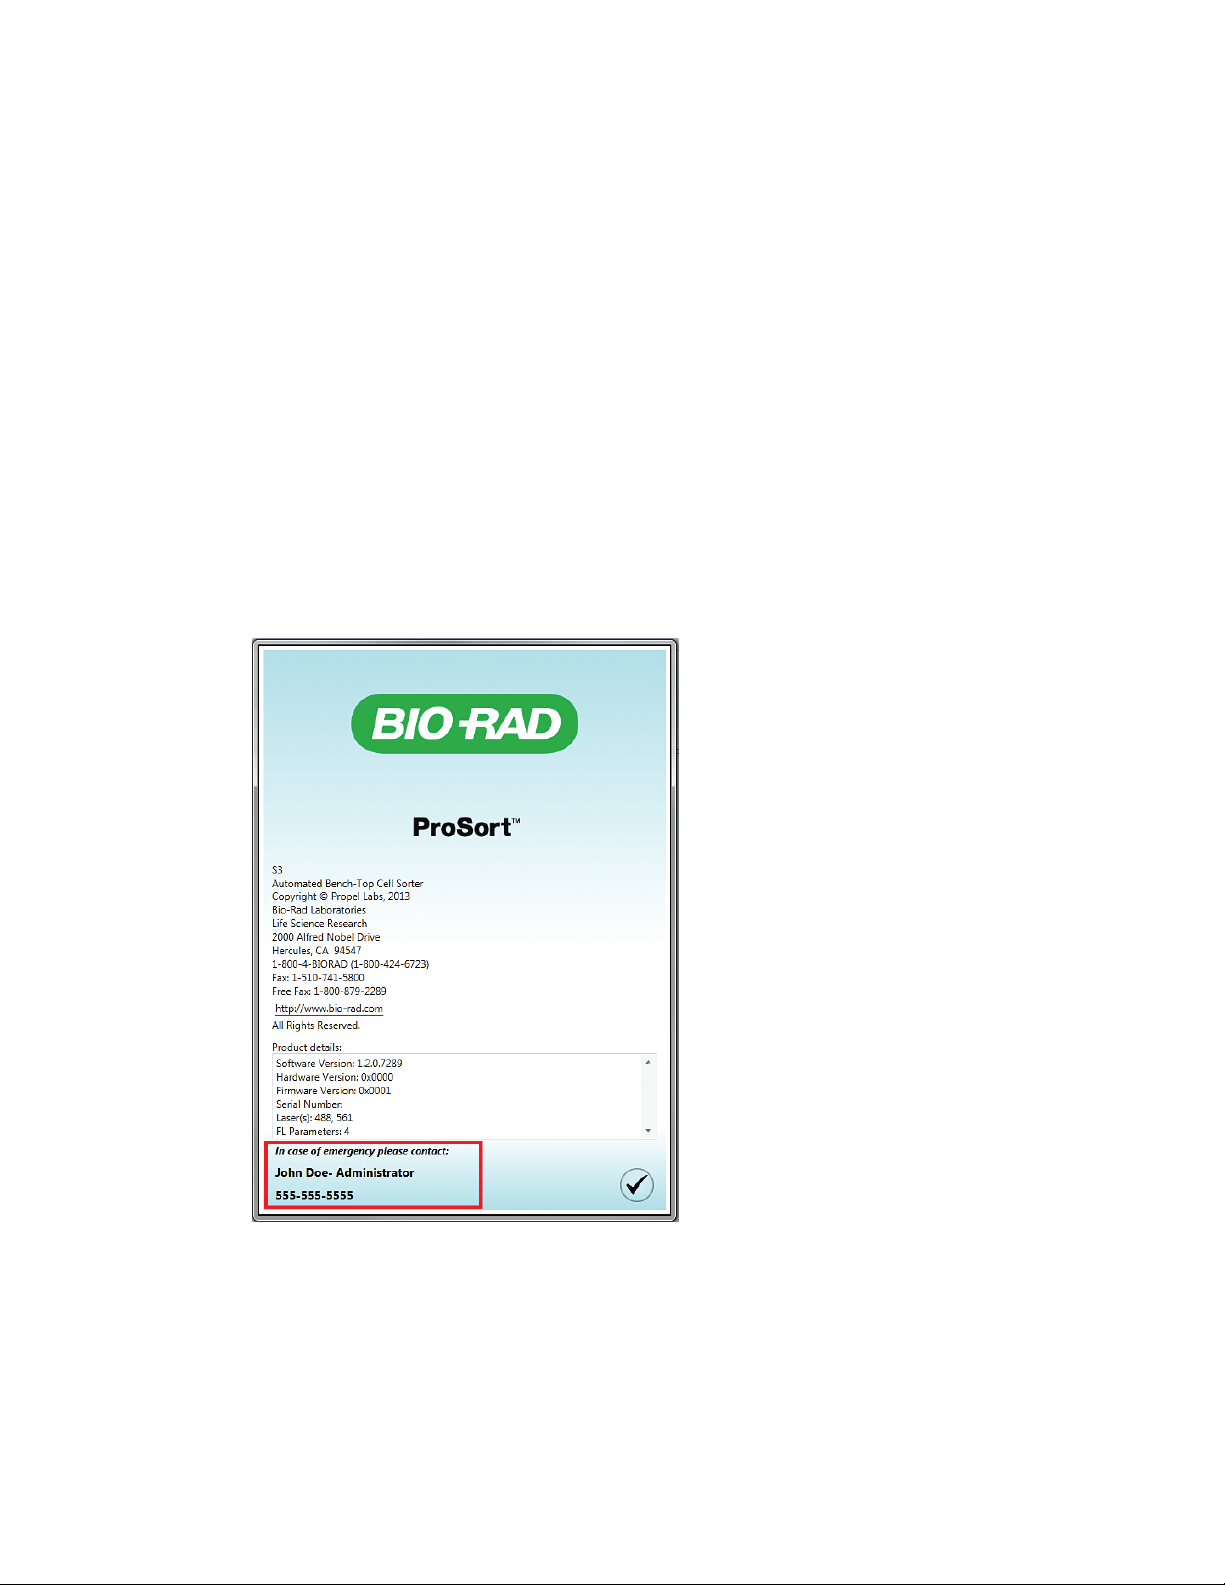
Emergency Contact Information
An emergency contact name and phone number can be entered into these fields. The
information will be displayed in the File > About window. This will let all users of the
instrument know what person within the lab or institution to contact for any emergency help
with the S3 or S3e System.
Fig. 28. About window displaying emergency contact information.
Instruction Manual | 31
Page 42

32 | S3 and S3e Cell Sorters
Page 43

4
Getting Started
After system installation by a Bio-Rad certified service engineer, the S3™ or S3e™ System should
not be turned off via the main power switch. The system is safe in standby mode after performing
a software shutdown of the system. This will help facilitate quick or automated startup.
If the system is shut off via the main power switch, always power the instrument on before
starting the ProSort
running in order to communicate with the software.
IMPORTANT! Powering the system on or off incorrectly can cause the instrument to
not run properly.
™
Software. The internal computer system of the instrument must be
4.1 Checking Bulk Fluidics
Prior to starting the ProSort Software, open the bulk fluidics door and check the volume
of each container. Ensure that the waste container is empty, and the sheath fluid and DI
containers are full.
Note: To change the bulk fluidics after starting the software or during a run, refer to Section 5.3,
Checking or Swapping Fluidics.
To refill or change a container (Figure 29):
1. Detach the quick disconnect from the cap assembly by pushing in the metal button and
lifting up the quick disconnect until it engages the magnetic holder.
2. Slightly lift and pull out the container.
3. Remove the cap assembly from the container.
4. Refill or change the container.
5. Carefully place the cap assembly onto the container and tighten the cap.
6. Place the container into position.
7. Attach the quick disconnect to the cap assembly. An audible click should be heard.
Instruction Manual | 33
Page 44

Getting Started
Sheath fluid cap assembly
Fig. 29. Bulk fluidics with sheath fluid components noted.
Sheath fluid container
Quick disconnect
IMPORTANT!
n
When handling sheath fluid and DI water containers, minimize air exposure to help
avoid contamination
n
While transferring cap assemblies to a new container, avoid touching the
assembly to the outside surfaces of the containers. If it is necessary to place the
cap assembly down, only use pre-sterilized surfaces
n
Treat all waste as bio-hazardous for safety
4.2 Logging In
To use the S3 or S3e system, ProSort Software is required. The software is preinstalled on the
computer that came with the instrument.
1. Double click the ProSort Software icon located on the desktop.
2. Log into the ProSort Software.
Fig. 30. Login window.
Note: If the system has been scheduled for an automatic startup, a startup counter will be visible in
the Login window (Figure 31). Please refer to Chapter 9, Automatic Startup, for startup options.
34 | S3 and S3e Cell Sorters
Page 45

Fig. 31. Automatic startup message in login window.
4.3 Daily Startup
On a daily basis, the system requires approximately 20 min of warmup time before running
quality control or any samples. To warm up the system:
1. Move the loading stage into the wash position.
2. Click on the Setup and Maintenance tab.
3. Click Startup.
Automatically the Startup Settings window will pop up (Figure 32). Using the startup button, the
instrument can either be started up at the moment or a scheduled startup can be designated.
Startup Now is the default option.
4.3 Daily Startup
Fig. 32. Startup Settings window.
4. Choose startup option in the Startup Settings window.
5. Click the checkmark box to proceed.
Note: If scheduling an auto startup, the software will return to the main window and will not
start up the system until the scheduled time.
The Startup Status window will display the status of the startup process (Figure 33). The startup
process includes initializing the system, filling the fluidics lines, and warming up the lasers.
Fig. 33. Startup Process windows.
Instruction Manual | 35
Page 46

Getting Started
During the startup process, the fundamental alignment window will also open to initiate
cameras, maintain droplets, and align streams to the lasers. The startup process also includes
a warm up period (Figure 34).
Fig. 34. Startup Process window.
After startup completion, both windows will close automatically and buttons in the toolbars will
become available to use.
Note: Automated startup is an option for this instrument. At shutdown, a startup time can be
designated. If this option is selected, be sure to empty the waste container and fill the sheath
fluid and DI containers at the end of the day.
Note: To change the fluidic containers after the software has been initiated or during a run, refer
to Section 5.3, Checking or Swapping Fluidics, for instructions on performing a hot swap.
4.4 Quality Control
The quality control (QC) procedure must be run every day to ensure optimal system
performance. This procedure requires the ProLine™ calibration beads to adjust alignment, verify
system against the QC criteria, set up droplet creation, adjust side streams, calculate drop
delay, and maintain the droplet break-off.
Note: ProLine Universal calibration beads must be used on a system with a 488/640 nm lasers.
These beads can also be used on the 488 nm or 488/561 nm systems.
To perform the quality control procedure:
1. Vortex a bottle of ProLine calibration beads.
2. Place at least 10 drops (approximately 0.5 ml) into
a 5 ml tube. Do not dilute these beads.
3. Place the tube with beads into the sample input
station.
4. Move the loading stage into the run position.
5. Click Run QC on the Setup and Maintenance tab.
6. Choose the correct bead lot from the dropdown
menu in the Event Based Alignment Settings
window (Figure 35).
Fig. 35. Event Based Alignment
Settings window.
36 | S3 and S3e Cell Sorters
Page 47

4.4 Quality Control
Note: If the bead lot is not available in the dropdown menu, refer to Section 3.3.1, Editing
QC Criteria.
A series of windows will open during the QC procedure to perform alignment and calculate
drop delay settings. User interaction is not required for these windows. These steps are
described later in this section.
7. After completion, the Drop Delay Alignment Status window will open with the optimal drop
delay settings (Figure 36A).
A
B
Fig. 36. A , Drop Delay Alignment Status window and B, Daily QC Report.
8. Click the checkmark to open the QC Report.
9. Review the QC report (Figure 36B).
n
If the QC status passed, exit the window. The system is now ready for sample acquisition
and sorting.
n
If the QC status failed, rerun the QC procedure up to two more times.
4.4.1 Droplet Setup
The first step in the QC process is droplet setup. Droplet setup is performed automatically and
the droplets will be optimized to a stable break-off. The droplet camera image may be viewed
by clicking Droplet Monitor on the Home toolbar. The Droplet Monitor window will display the
drop delay, drop drive amplitude, and status of the drop delay (Figure 37).
Users with administrator privileges may access and modify these settings in the administrator
tab. For more information, refer to Section 3.3, Administrator Tab Toolbar.
Instruction Manual | 37
Page 48
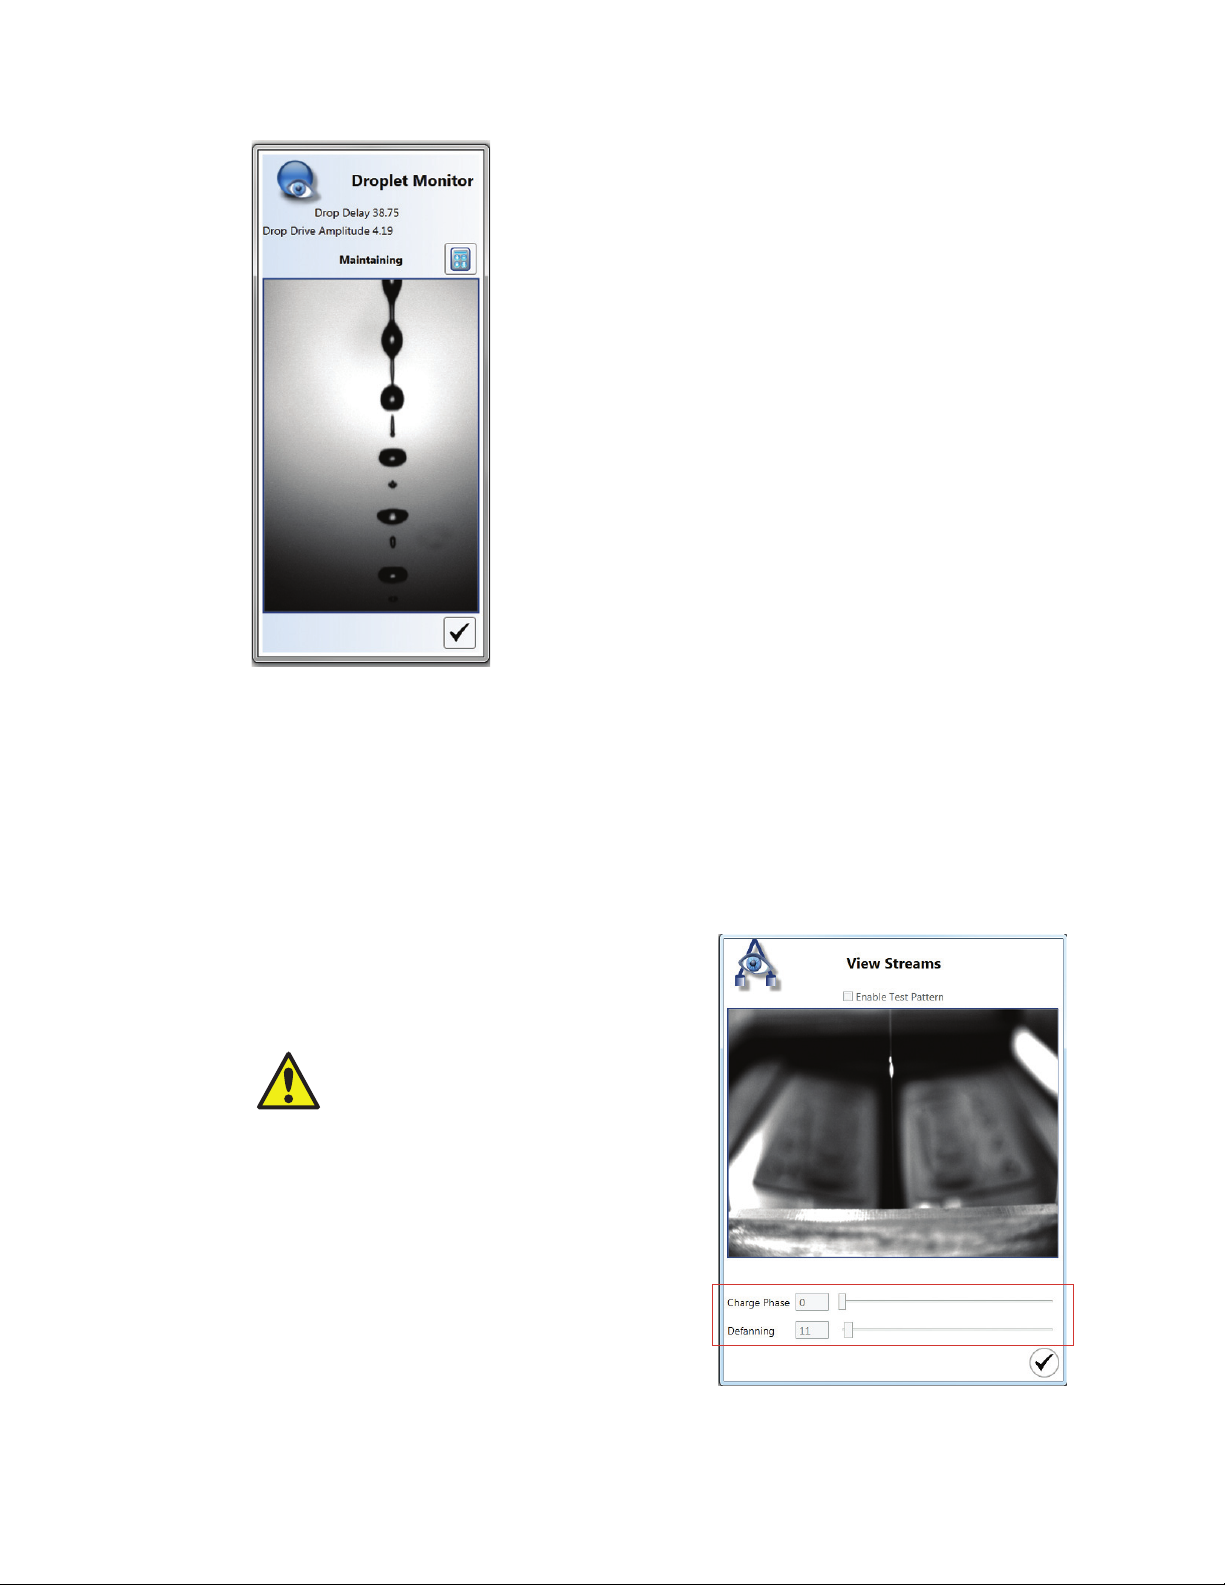
Getting Started
Fig. 37. Droplet Monitor window.
4.4.2 Side Streams
Following droplet setup, the side streams are adjusted to align with the sort tube positions and to
ensure they are not fanning. The streams may be viewed by clicking View Streams on the Home
tab. The View Streams window displays a charge phase and defanning slider bar (Figure 38).
Users can manually adjust the charge phase and defanning values by moving the slider bar. The
Enable Test Pattern button should be selected in order to apply a charge to the stream.
Users with administrator privileges may access
and modify these settings in the Administrator
tab. For more information, refer to Section 3.3,
Administrator Tab Toolbar.
CAUTION! Optimal side stream
settings are calculated automatically
after performing a quality control
procedure. Adjusting any of these
values will change the optimal
settings and will affect the side
streams and sort.
38 | S3 and S3e Cell Sorters
Fig. 38. View Streams window with charge
phase and defanning slider bars highlighted.
Page 49

4.4.3 Alignment
During the alignment phase, automated micro-motors sweep the fluidic stream through the
laser beams to find the point of optimal illumination. This automated process requires the
stream and laser(s) to be running. After alignment, the CVs and voltages are compared to the
QC criteria. During the QC procedure, a calibration protocol will open and run automatically.
Upon completion, the data are saved as an FCS file. This file may be opened and viewed by
opening the daily QC report, selecting the desired date and time, and clicking the open FCS file
button at the bottom of the report.
4.4 Quality Control
Fig. 39. QC histograms displayed in the workspace.
4.4.4 Drop Delay Determination
After the droplet and side stream formations have been optimized and the system is optically
aligned, drop delay will be determined using ProDrop™ technology and set using the same
ProLine Calibration Beads used for the alignment.
ProDrop technology accurately calculates the drop delay on the S3 and S3e Systems by
analyzing the waste stream while running calibration particles. Events are detected normally at the
nozzle and then again in the waste stream below. The drop delay setting is adjusted automatically
through a set range, first coarsely then finely, while sorting is enabled. The correct drop delay
value is determined when the calibration particles are deflected from the center stream and
therefore no longer present in the waste stream. This technology allows accurate measurement
of the drop delay value without requiring the user to count beads under a microscope.
While the ProDrop technology is running, the Drop Delay Alignment Status window will open.
The yellow line indicates the best drop delay during the process and this value will be set as
the drop delay once completed. The green points, light green for coarse adjustments and dark
green for fine adjustments, indicate the number of beads detected in the waste stream. After
completion, three buttons will appear in the lower right corner. These buttons, from left to right,
recalculate drop delay, run a verify drop delay test, or confirm and close the window (Figure 40).
Instruction Manual | 39
Page 50

Getting Started
Fig. 40. Drop Delay Alignment Status window.
Recalculate drop delay
Verify manually
Accept
4.4.5 Drop Delay Maintenance
After drop delay determination, the system will be automatically placed into a droplet monitor
mode to maintain the break-off during use. The changes required for this are completed
automatically. To verify that the drop delay is being maintained, use the Droplet Monitor button
on the tool bar. This window will note if the system is maintaining (Figure 41).
Fig. 41. Droplet Monitor window with status
and recalculate button highlighted.
40 | S3 and S3e Cell Sorters
Page 51

4.4.6 Recalculate Drop Delay
To recalculate the drop delay using ProLine calibration beads, click the Recalculate button
(Figures 40 and 41). This button will not align the streams or verify CVs. This button will only
calculate the drop delay.
During the drop delay calculation in the QC procedure, the same recalculate button on the
Drop Delay Alignment Status window will be available in the Drop Monitor window. During the
QC procedure, recalculation can be performed until values are acceptable, prior to clicking the
checkmark box.
4.4.7 QC Criteria
Data collected during the QC procedure are checked against the QC criteria after the system
has been aligned. Users with administrator privileges may access and modify these settings in
the Administrator tab. For more information, refer to Section 3.3, Administrator Tab Toolbar.
CAUTION! Adjusting any of these values will affect the overall system performance.
For each fluorescent parameter, two criteria may be set:
n
PMT voltage — the PMT voltage required to bring the population to channel 128 must be
below the set point for each parameter
n
Coefficient of variation (CV) — the CV is measured in each parameter and must be under
the set point
4.4 Quality Control
4.4.8 QC Report
A QC Report window will open after
completing the alignment and drop
delay settings. This window displays the
QC status and whether the system has
passed or failed the QC requirements.
This report can be saved or printed
(Figure 42).
To view a previous QC Report, on the
Setup and Maintenance tab select QC
Report > Date.
IMPORTANT! These values may need to be changed to account for lot-to-lot
variation of the ProLine calibration beads.
Print report
Open FCS file
Save data file
Fig. 42. QC Report window with QC status highlighted.
Instruction Manual | 41
Page 52

Getting Started
4.5 Protocols and Workspace
Before acquiring samples, a protocol with at least one histogram or density plot is required
to visualize the events. The last used protocol will automatically open with the software. A
protocol consists of histograms, gates, regions, trigger, threshold, PMT settings, sort logic,
compensation settings, and all other information required for a run. Protocols can be used as a
template for future runs.
To add a new protocol:
1. Click File.
2. Select New Protocol from the dropdown menu. A new protocol will open as a new tab in
the workspace.
3. From the Home tab, add a histogram or density plot to your workspace. Plots will
automatically open in the workspace in the order they were added.
4. Click on a plot to activate the window. A blue frame will appear indicating items within the
window can be changed.
5. Change the parameters; resize window; add regions, bars or quadrants; apply gates; or
show statistics within this window.
6. Repeat for other plots.
To close a protocol, use the X symbol alongside the Protocol tab (Figure 43).
Fig. 43. Creating new protocols.
A protocol can be saved using the File dropdown menu. Protocols that have not been saved
are marked with a dot in the title. After a protocol is prepared, samples can be acquired
using the protocol or an existing FCS file can be embedded into the current protocol. Refer to
Section 4.5.4, Opening FCS Files, to view existing data files.
4.5.1 Opening Protocols
Protocols can be opened from the File menu (Figure 44). When selected, the Open Protocol
option will bring up a Windows prompt to locate and open the desired protocol. To the right of
the file name field is a dropdown box for protocol or FCS file. By selecting the FCS file option, a
protocol can be opened directly from a saved FCS file.
42 | S3 and S3e Cell Sorters
Page 53
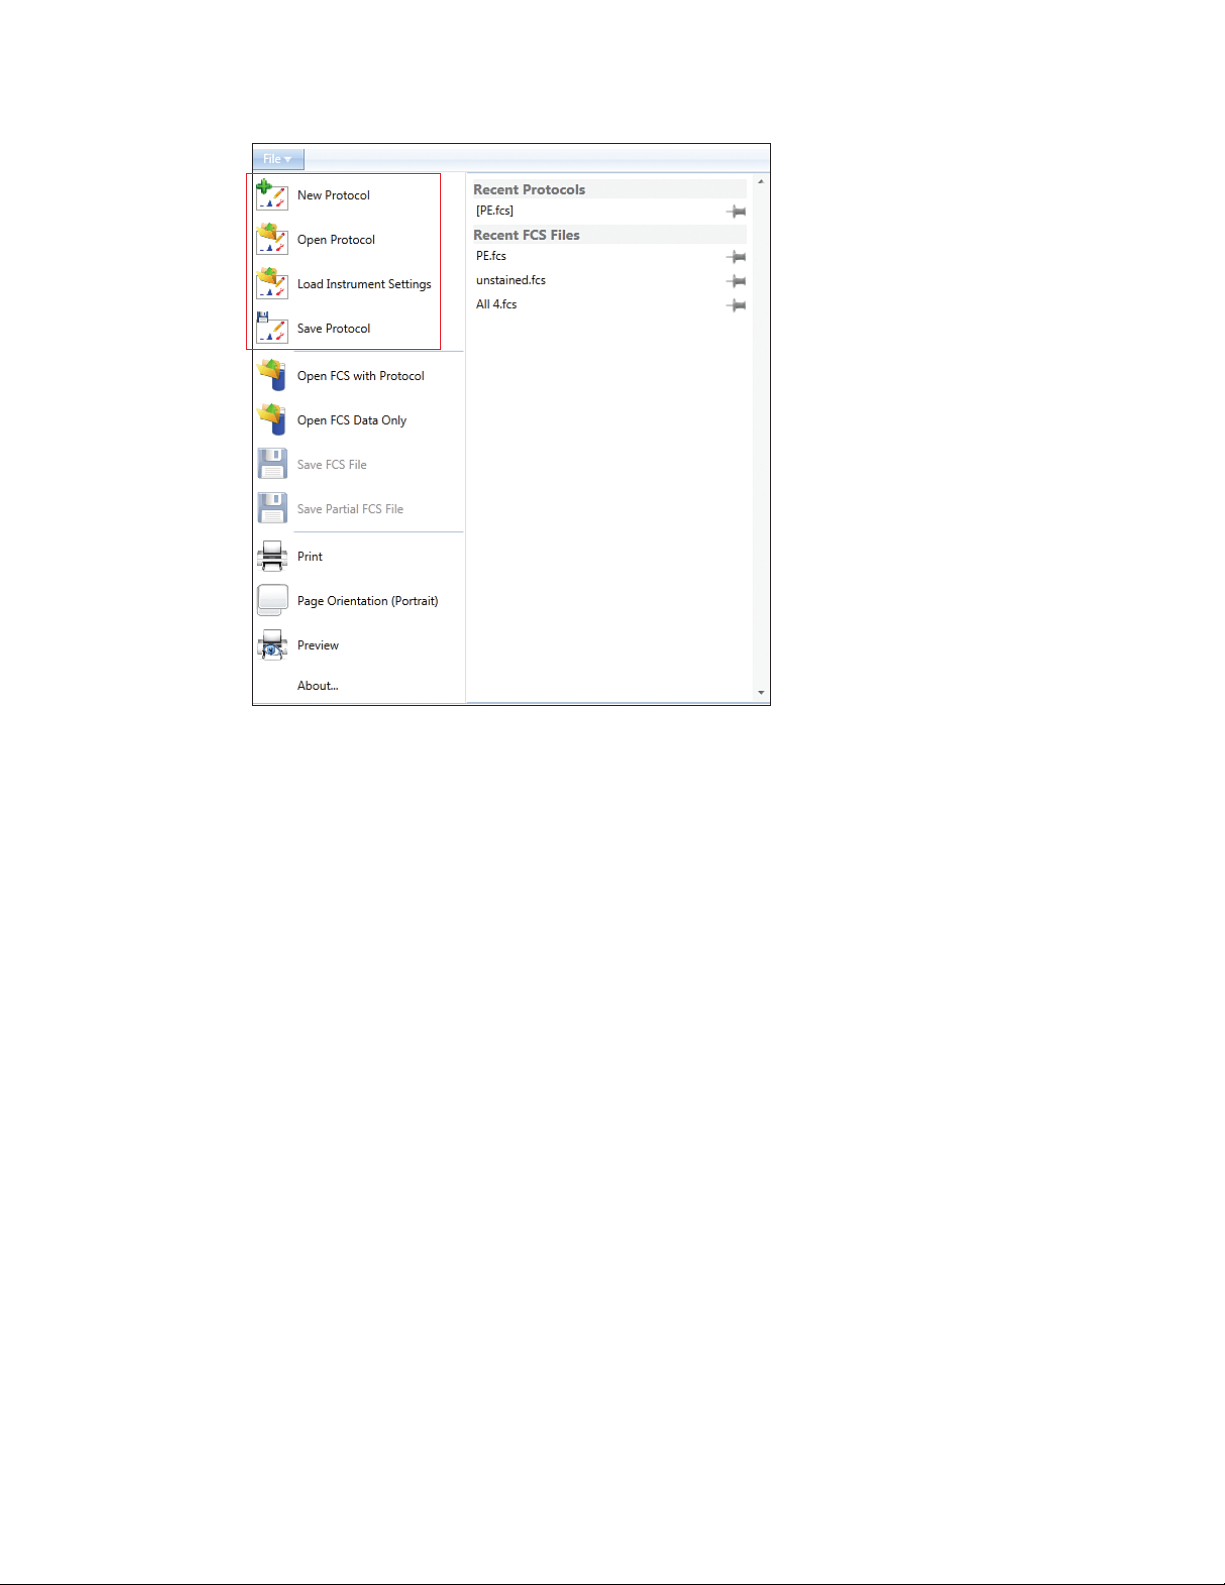
4.5 Protocols and Workspace
Fig. 44. File dropdown menu with New, Open, Load Instrument Settings,
and Save Protocol highlighted.
4.5.2 Loading Instrument Settings
Protocols can be saved for future use. Each protocol is saved with the following information:
plots, regions, gates, trigger, threshold, PMT voltages, sort logic, sort limits, sort modes,
compensation settings, and filter configuration.
To load a previously saved instrument setting:
1. Open the protocol to be used or create a new protocol and save.
2. Click File > Load Instrument Settings.
3. Choose the protocol that contains the settings to be loaded.
The preexisting settings will be loaded into and displayed in the current protocol and will be
ready to use for acquisition or sorting.
4.5.3 Saving Protocols
Protocols can be saved for future use. Each protocol is saved with the following information:
plots, regions, gates, trigger, threshold, PMT voltages, sort logic, sort limits, sort modes,
compensation settings, and filter configuration.
To save a protocol (Figure 44), click File > Save Protocol.
Refer to Section 3.3.8, Global Preferences, for information on how to assign default folders for
saving both protocols and FCS files.
Instruction Manual | 43
Page 54

Getting Started
4.5.4 Displaying Multiple Protocols
Multiple protocols can be opened at the same time by opening an existing protocol or a new
protocol from the file menu. When multiple protocols are opened, they will be displayed as tabs
along the top of the workspace (Figure 45). Selecting between each tab will update instrument
settings with the information contained in each protocol.
Fig. 45. Workspace with protocol tab highlighted.
4.5.5 Opening FCS Files
The ProSort Software allows an FCS file to open into two different types of protocols (Figure 46).
The data can be embedded into the currently opened protocol by using the Open FCS Data
Only option. The FCS file can
also be opened into the
original protocol in which it
was acquired by using the
Open FCS with Protocol
option. The existing gates
and plots associated with
that protocol will be recalled
to the workspace.
44 | S3 and S3e Cell Sorters
Fig. 46. Opening and saving FCS files.
Page 55
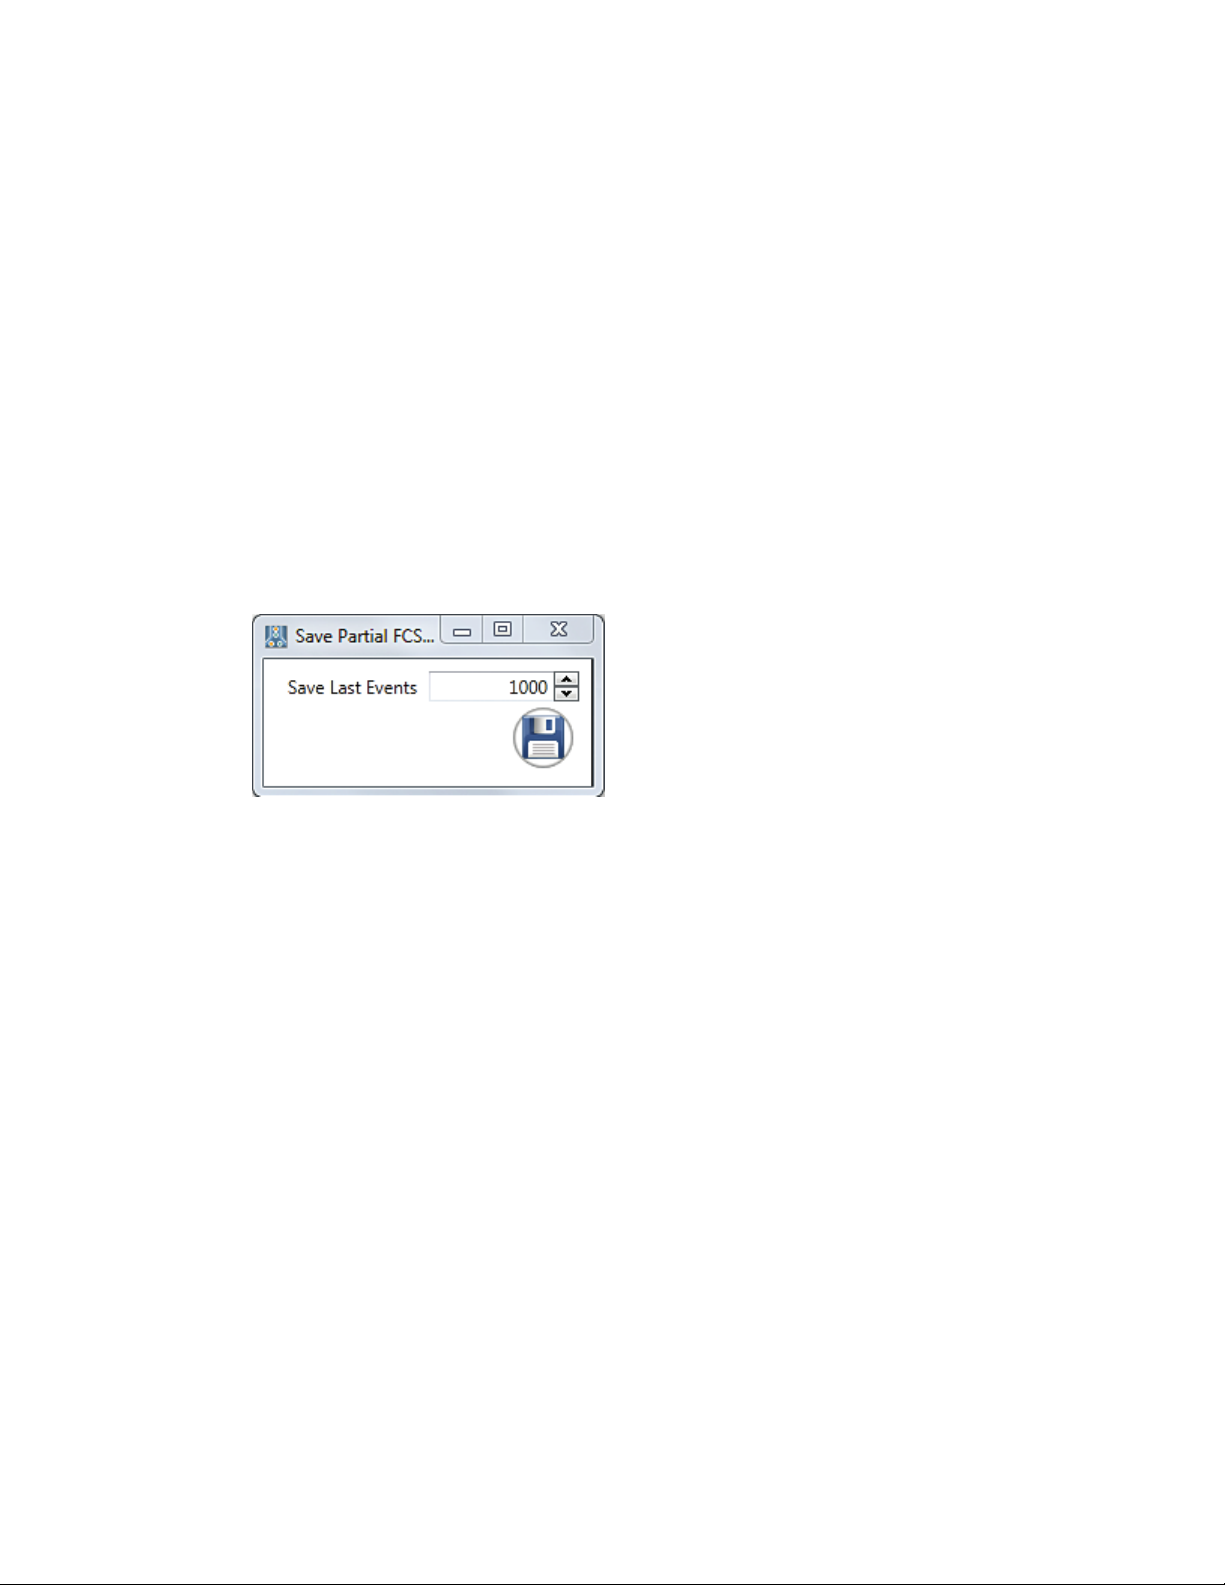
4.5.6 Saving FCS Files
When the AutoSave box is not checked, the FCS file can be saved after acquisition or sort. The
protocol used during the acquisition or sort is embedded in the FCS file. The file can be opened
at a later time for analysis or to be used as a template for a subsequent acquisition.
4.5.7 Saving Partial FCS Files
There may be instances when a large number of events will be acquired during a sort. These
FCS files can become very large and potentially can cause the software to run more slowly
when reopening for analysis. In addition, it may be difficult to view populations with large
numbers of events displayed at one time. It is possible to save a partial FCS file during a sort by
saving only a set number of events (Figure 47). Click File > Save Partial FCS File. A window
will appear to select how many events to save. The selected number of events will be saved
from the end of the sort. Sort statistics from the entire sort will be saved regardless of the partial
of the FCS data saved.
For example, if 500,000 events are sorted and 20,000 events are saved as a partial FCS file,
then the last 20,000 events sorted (480,001–500,000) will be saved to the file.
4.5 Protocols and Workspace
Fig. 47. Save Partial FCS File Events window.
4.5.8 Histograms and Density Plots
Histograms and density plots can be created from the Home tab. Clicking on each button will
create the plot and add it to the protocol workspace. Each plot will be added to the right of
the prior plot and will wrap to the next row as needed. Plots will be created with the default
parameters of FSC for histograms, and FSC and SSC for density plots. Refer to Section 3.3.8,
Global Preferences, for information on how to change plot defaults for axis, log vs. linear, plot
size, and plot display options.
4.5.9 Resizing, Moving, and Deleting Plots
When plots are added to the workspace they are tiled automatically based on the size of the screen.
To resize histograms or density plots:
1. Hover over the desired plot.
2. Hold down the handle in the lower right corner and drag the plot to the desired size.
Instruction Manual | 45
Page 56

Getting Started
Plots can be moved within the workspace by grabbing the bar at the top and dragging to the
desired position. The remaining plots will shift accordingly. To delete a plot, click the red X in the
upper right corner. This will delete the selected plot (Figure 48).
Fig. 48. Density plot with resizing, moving, and
deleting functions highlighted.
4.5.10 Changing Parameters
To change the parameters displayed in a plot, click the dropdown arrow and select a parameter
(Figure 49). If a log or compensated parameter is desired, check the appropriate box.
Fig. 49. Density plot with parameters displayed.
46 | S3 and S3e Cell Sorters
Page 57

4.5.11 Viewing Statistics
To view the statistics on a plot, highlight the plot and select the Statistics dropdown arrow in
the lower left corner (Figure 50). To hide the statistics, click the same button.
4.5 Protocols and Workspace
Fig. 50. Density plot with statistics.
4.5.12 Editing and Reordering Statistics
There are several options for displaying statistics. Changes in the settings will be saved with
the protocol (Figure 50). Refer to Section 3.3.8, Global Preferences, for information on how to
change the default statistics.
To remove statistic headings:
1. Right click in the Statistics panel.
2. Check or uncheck statistics to display in the statistics table.
3. Check Apply to all to apply to all plots in the protocol.
To reorder statistic headings:
1. Click the statistic name in the Statistics title bar.
2. Drag and drop to the desired location.
or
Instruction Manual | 47
Page 58

Getting Started
1. Right click on the Statistics panel.
2. Click on the statistic name and drag and drop to the new location.
3. Check Apply to all to apply to all plots in the protocol.
To alter number of digits after the decimal:
1. Right click in the Statistics panel.
2. Find statistic of interest and change the value in the Precision box.
3. Check Apply to all to apply to all plots in the protocol.
4.5.13 Creating Regions
Regions can be created in a histogram or density plot to further identify populations of interest.
A bar region is the only option on a histogram and all other regions will be unavailable. Density
plots may have ellipses, rectangles, quadrant, or polygon regions. There are two ways to create
a region on the plot — by using the Home tool bar or by right clicking on the graph.
To create a region using the Home toolbar:
1. Click on the desired plot.
2. Select the region from the Home toolbar.
To create a region using the right click on the mouse:
1. Click on the desired plot.
2. Right click within the plot and choose a region type (Figure 51).
The selected region will appear in the desired plot. Region buttons will be grayed out if the
incorrect plot is selected.
Fig. 51. Right-click option for creating regions.
48 | S3 and S3e Cell Sorters
Page 59
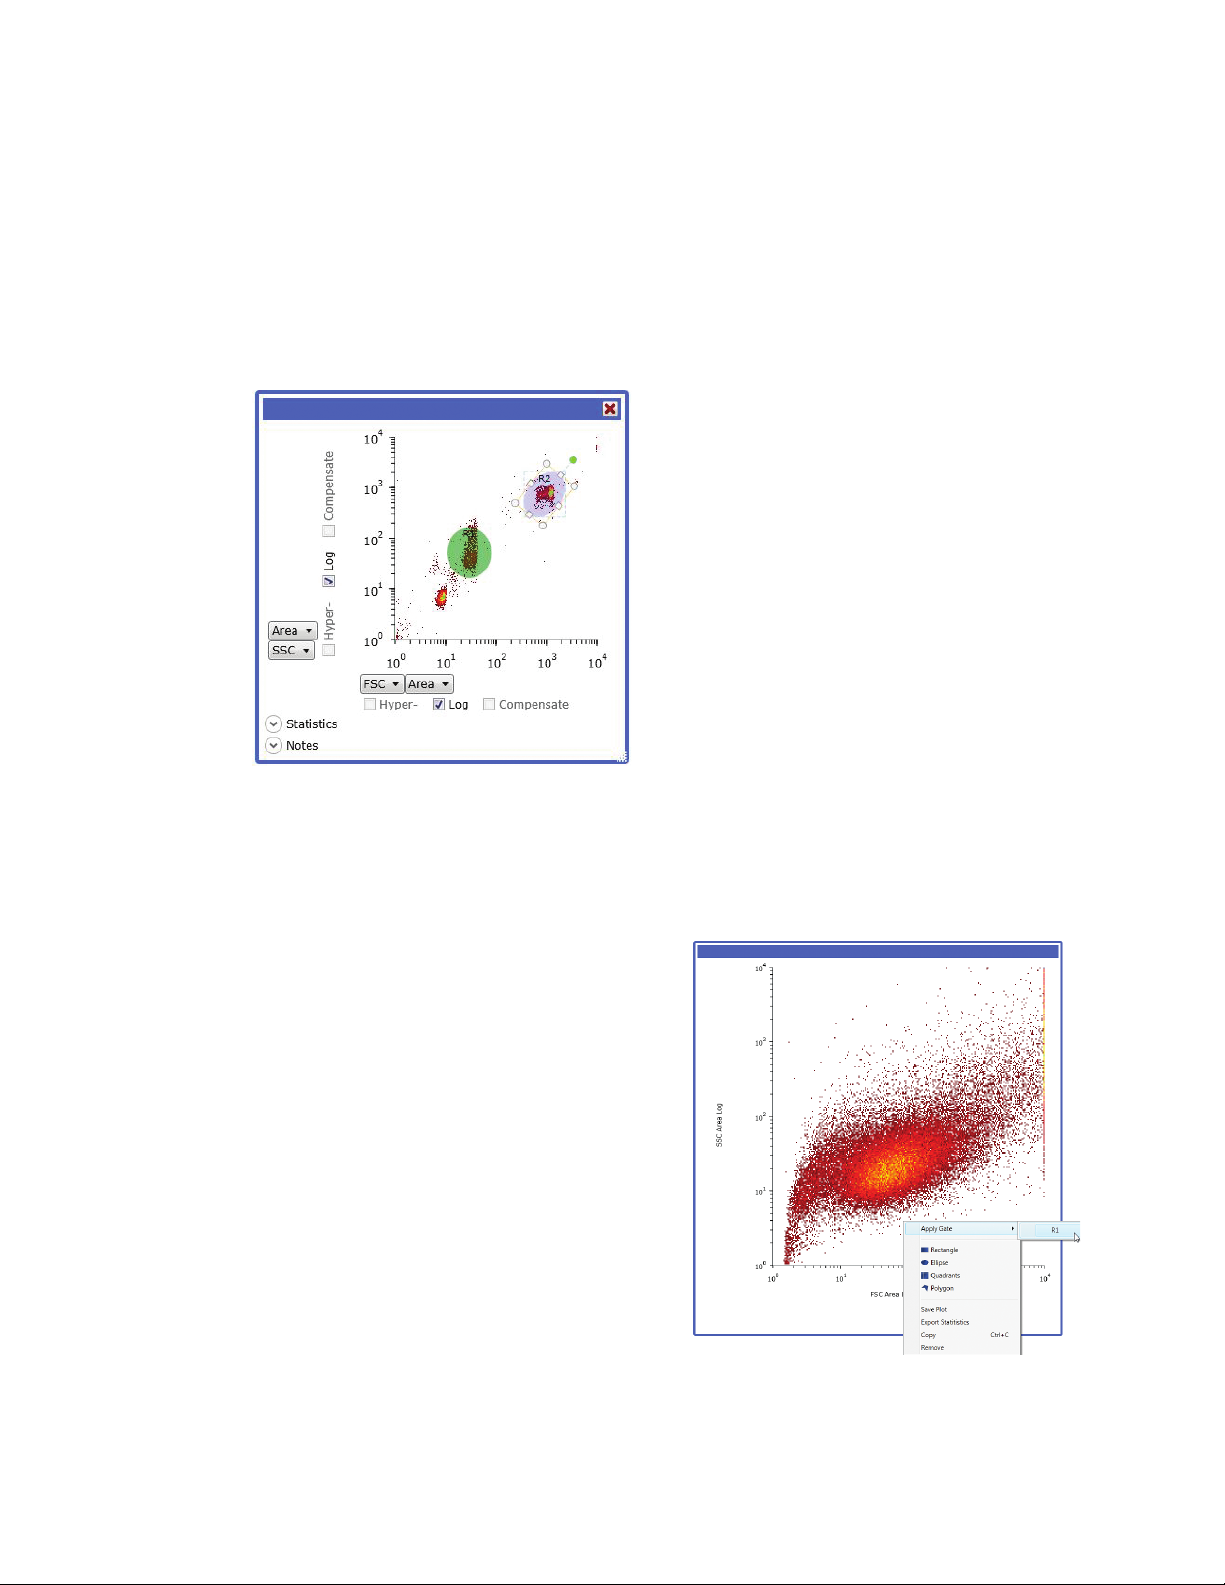
4.5 Protocols and Workspace
A region can be moved, tilted, resized, and deleted (Figure 52).
1. Click the desired region.
2. To move region, hover till the crosshairs icon appears. Click and drag to new location.
3. To tilt, click the green circle indicator above the region and drag to change the angle.
4. To resize, click the circle or square indicators around the region and drag to the
appropriate size.
5. To delete, right click within the region and choose Remove region.
Fig. 52. Moving or tilting a region within a plot.
4.5.14 Creating Gates
Gates can be used between plots once
regions have been created. The purpose of
gating is to limit the events shown in one plot
by a region in another plot.
To create a gate (Figure 53):
1. Select the plot to be gated.
2. Right click within the plot.
3. Select Apply Gate to the region or
regions of interest.
The regions on the gated plot will appear in
the title bar of the plot. To ungate a plot, right
click in the gated plot and select Clear Gate.
Fig. 53. Density plot with Apply Gate selected.
Instruction Manual | 49
Page 60

50 | S3 and S3e Cell Sorters
Page 61

5
Acquisition
Sample acquisition can be done independent of sorting. As a sample is run through the system,
data are gathered and can then be saved in FCS 3.1 format. These files can be loaded and
analyzed using third party software compatible with FCS 3.1 files. Often, setup samples — for
example, unstained samples or single-color compensation samples — are acquired prior to
sorting the actual sample of interest.
5.1 Acquisition Setup
Prior to running a sample, a protocol must be loaded or created. At least one histogram or
density plot is required to begin acquisition. Protocols can be created new or loaded using
a protocol file or from a previously acquired FCS file. Refer to Section 4.5, Protocols and
Workspace, for information on how to create or open protocols. Access all instrument controls
via the ProSort™ instrument control panel.
To set up an acquisition or sort:
1. Create or open a protocol.
Note: At least one histogram or dot plot must be created to continue.
2. Load the sample onto the sample input position and move the loading stage into the
run position.
3. Detectors can be renamed for each parameter based on fluorophores or markers used.
4. Check cycle mode to allow refresh of the data displayed.
5. Define target event rate, trigger parameter, and threshold value.
6. From the instrument control panel, click the Start Sample Acquisition button.
7. Adjust PMT voltages to place populations.
8. Adjust target event rate, the trigger parameter, and threshold value.
9. Stop sample acquisition by pressing the same button.
10. Check and define event limit. Gate Limit can be chosen. Cycle mode can be unchecked at
this time.
Note: Data can be displayed in hyperlog if the compensation box is checked.
Optional: AutoSave can be enabled to automatically prompt to save file after event limit is reached.
11. Re-collect sample and save FCS file if AutoSave is not enabled.
12. Unlock and remove sample tube. Move the loading stage into the wash position before the
next sample is run.
Instruction Manual | 51
Page 62
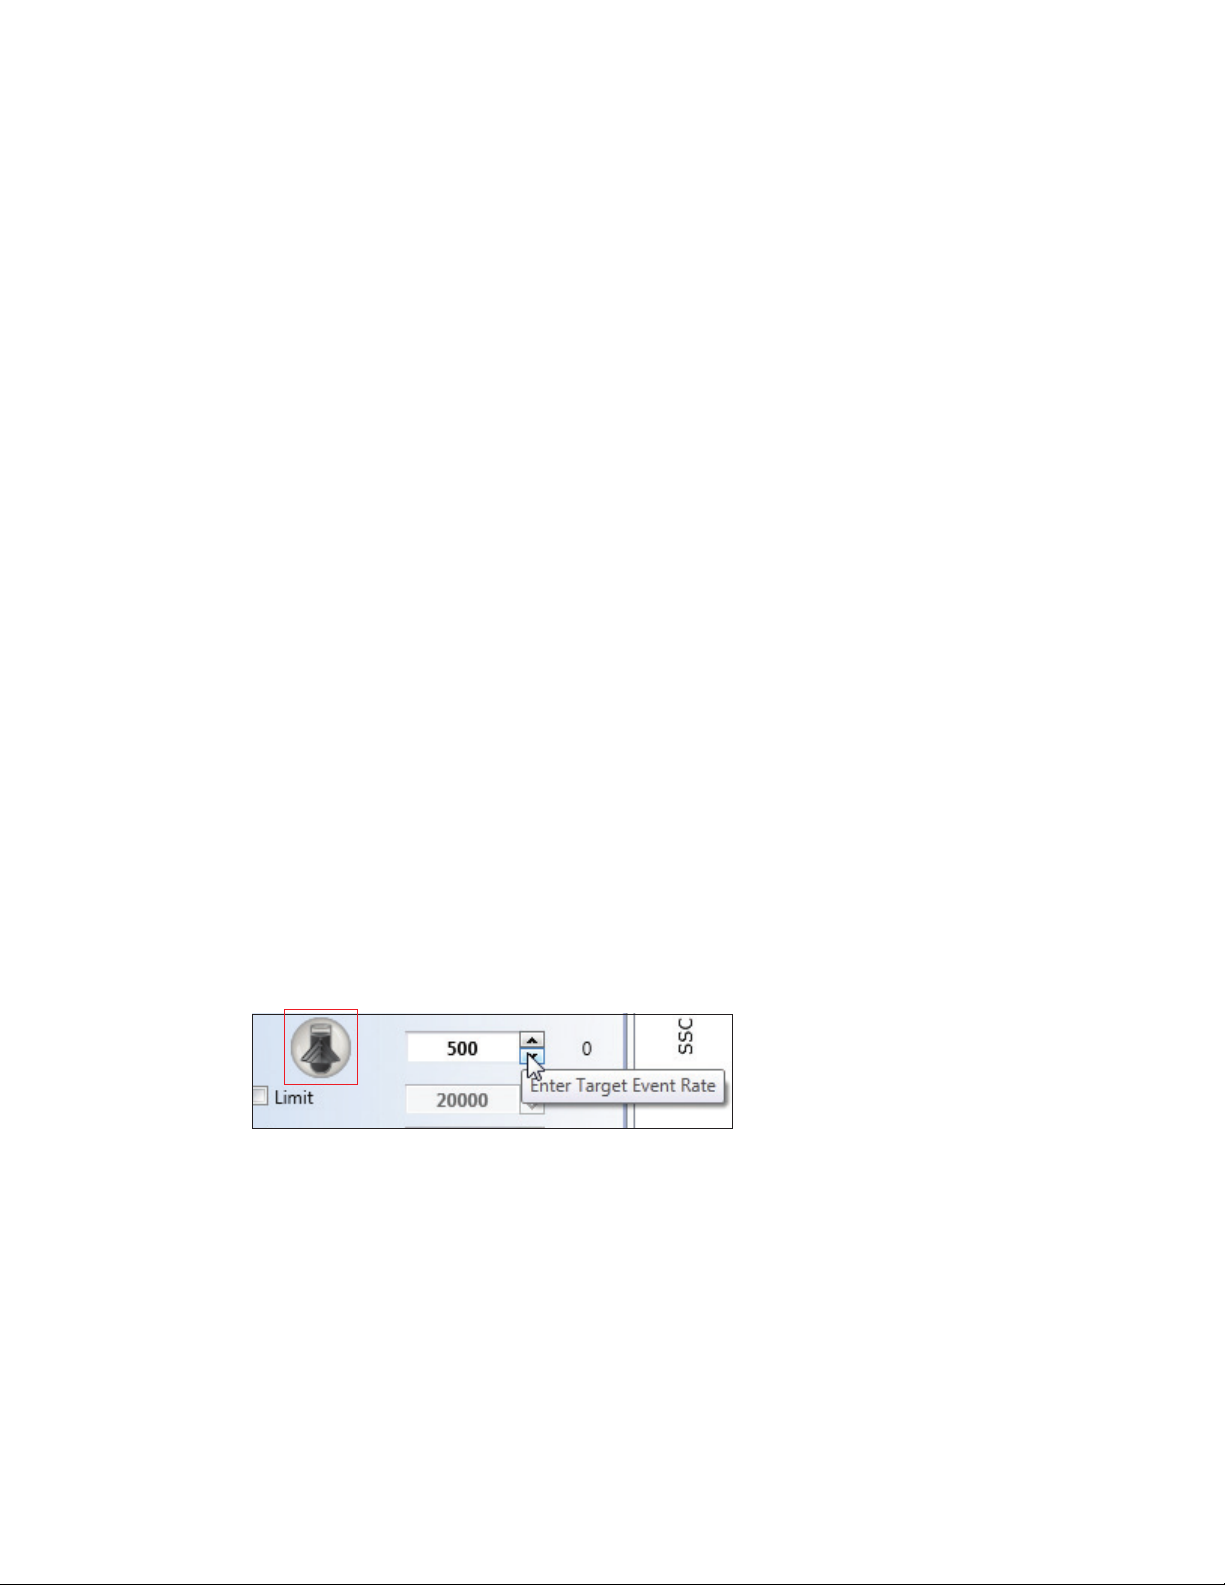
Acquisition
Note: Cycle mode can be enabled or the refresh button can be used to refresh the data
displayed on the screen as adjustments are being made.
When running multicolored experiments, compensation is necessary. In order to use the Auto
Compensation wizard, single stained compensation control samples must be saved in addition
to the multicolored stained samples.
13. Run single stained compensation control for first parameter.
14. Set event limit high enough to visualize positive population; collect and save file.
15. Repeat and collect samples for each parameter.
16. Use the Auto Compensation wizard to set compensation for multicolored samples.
Refer to Section 5.2.1, Auto Compensation Wizard, for instructions on compensation methods.
Depending on the fluorophores used in the experiment, filters may need to be optimized in
order to capture signal properly. Please refer to Section 5.4, Optical Filters, for information on
how to create custom filter configurations.
Refer to Section 3.2, Control Panel, for an overview of the instrument control functions.
5.1.1 Target Event Rate
The event rate is related to the sample concentration. Generally, for every 1,000,000 cells per
ml sample concentration, the event rate may be increased by 1,000 events per second. As an
example, if the sample is concentrated to 10,000,000 cells per ml, the maximum event rate
should be 10,000 events per second.
The target event rate is dependent on the trigger and threshold settings. A target event rate
can be entered into the event rate box in the instrument control panel (Figure 54). The software
will maintain the entered rate throughout the acquisition or sort if the sample concentration is
appropriate for the target event rate. The actual target event rate is shown to the right of the
target event rate and on the status bar at the bottom of the software screen. The maximum
target event rate while acquiring is 100,000 events per second.
The button for preset sample event rate can also be used. The sample pressure is preset for
low/med/high rates. The sample rate will be dependent upon the concentration of the sample.
Fig. 54. Target event rate.
52 | S3 and S3e Cell Sorters
Page 63
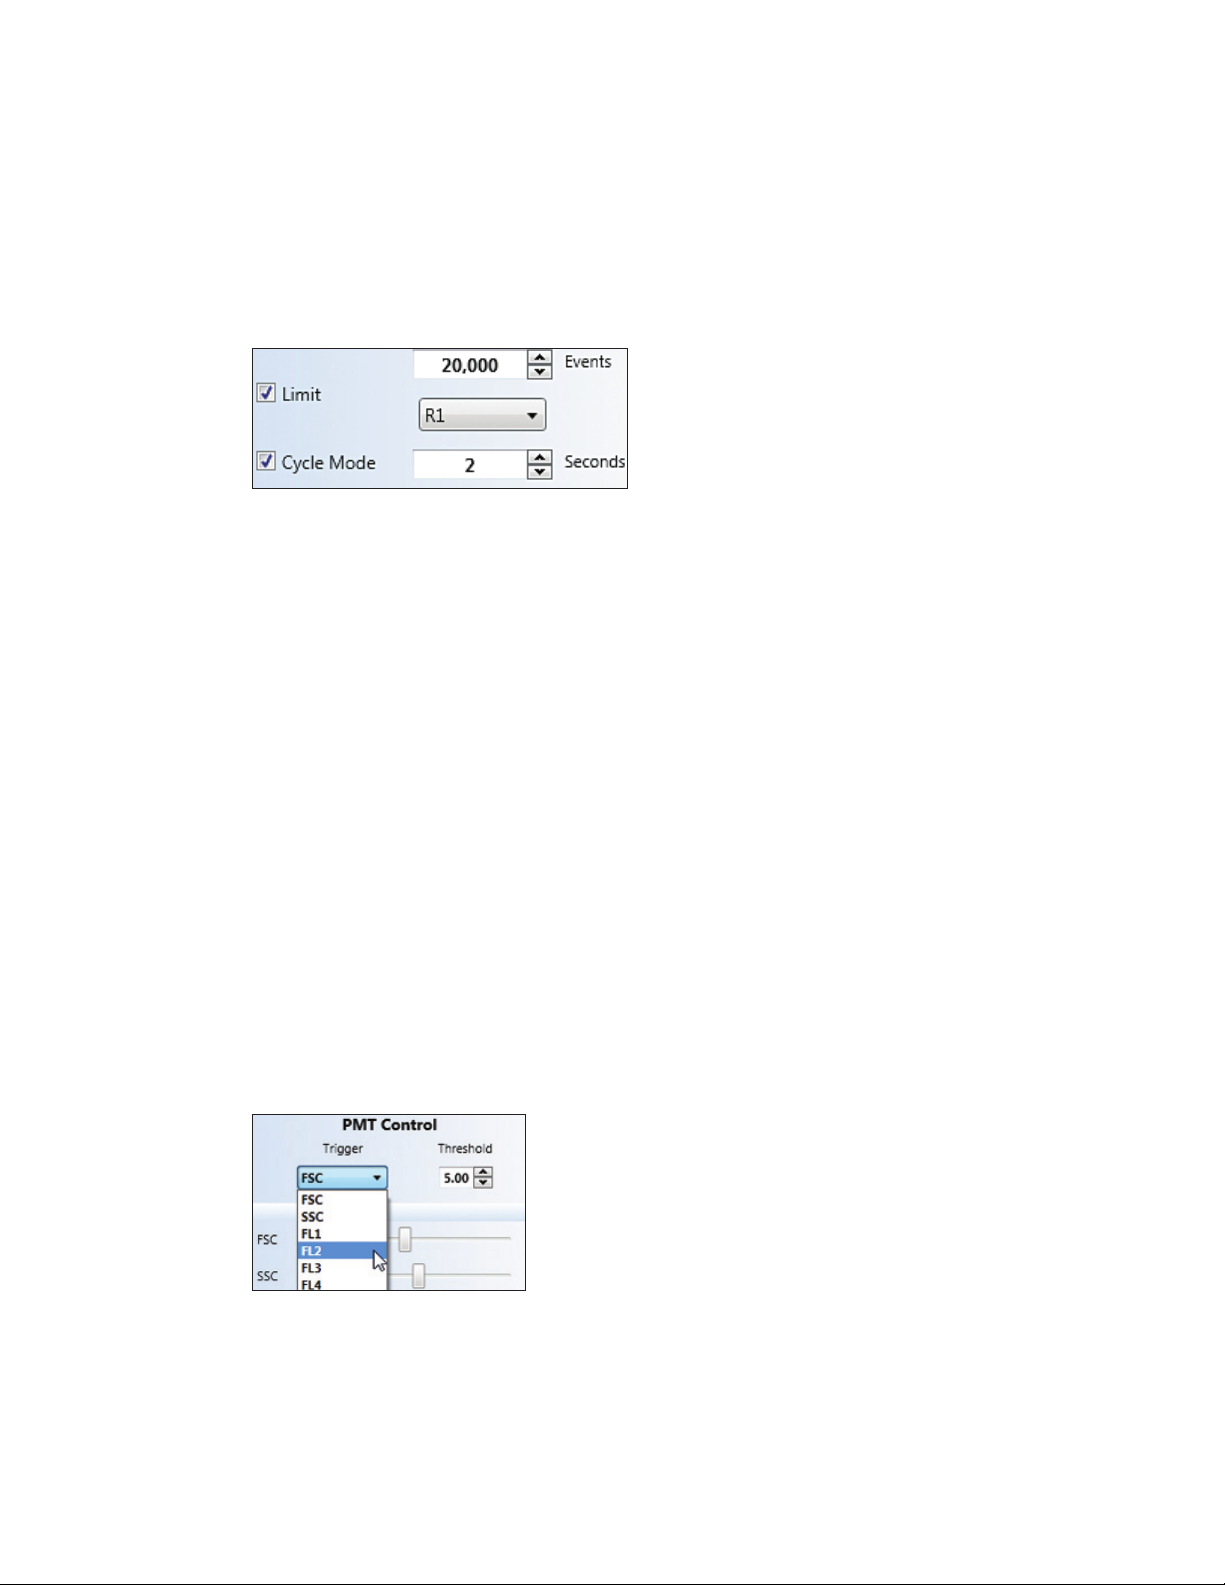
5.1.2 Event Limit
An event limit may be set on the acquisition (Figure 55). This limit will be based on the total
events collected. The gate default is All. When this event limit is reached, the acquisition will
stop and the FCS file can be saved. The maximum number of events acquired in a single FCS
file is 100,000,000.
Note: Large FCS files may take time to save, load, and display.
Fig. 55. Event limit and cycle mode.
A gate limit can be used to define the event limit. Each gate created on the plots will be listed on
the dropdown menu. Once a gate is chosen, the acquisition will continue until the event limit is
reached within the gate.
5.1 Aquisition Setup
5.1.3 Cycle Mode
At the beginning of an acquisition, it may be helpful to utilize the cycle mode for a quicker
refresh of the data displayed while changing the settings (Figure 55). Cycle mode is set in units
of seconds and will progressively display events that fall within that period of time. Older data
will be not be displayed.
Use this function when adjusting PMT voltages and/or threshold and trigger settings. After data
and populations of interest appear where desired on your plots, disable this mode and restart
acquisition for normal cumulative acquisition.
5.1.4 Trigger
The trigger parameter is the initial parameter of detection to signal the system that a particle
of interest is present. Combined with the threshold setting, the trigger parameter defines real
events which should be detected and analyzed (Figure 56). Typically, a scatter parameter
is selected for the trigger, as it will identify all particles above a given size regardless of the
fluorescent signal, though any parameter can be used for this function.
Fig. 56. Target event rate and threshold level.
Instruction Manual | 53
Page 64

Acquisition
5.1.5 Threshold
The threshold level is set using the trigger parameter with a range of 0.1–100% (Figure 56).
The purpose of the threshold is to set an intensity level to eliminate any background noise and
debris while still allowing real events to be detected and analyzed.
5.1.6 PMT Voltages
Each parameter is collected by a photo multiplier tube (PMT). Independent voltage control is
available for each PMT. These voltages can be adjusted to bring the populations of interest
on the histogram or density plot scale (Figure 57). Custom names for each parameter can
be entered by clicking on the parameter of interest on the PMT control panel. Changing this
name will update the names on all plot axes, in the filter configuration window, and on the
compensation matrix. Refer to Section 3.3.8, Global Preferences, for information on how to set
default parameter names.
Fig. 57. PMT control panel with name
changed on the FL1 parameter.
5.1.7 Auto Save
An auto save option is available as a check box on the instrument control panel. If this box is
checked (Figure 58), a prompt will appear to name and save the FCS file after an acquisition or
sort is completed.
Fig. 58. Checked auto save box.
54 | S3 and S3e Cell Sorters
Page 65

5.1.8 Pausing and Resuming
Acquisition may be paused and resumed while in progress using buttons on the instrument
control panel. Pausing will stop the sample flow. During the pause, the time parameter within
the data file will continue, and will show a time gap when resumed.
If you wish to replace the sample tube during the pause:
1. Press the touch locking system screen above the loading stage until the padlock is
displayed as unlocked.
2. Move the loading stage into the wash position.
3. Replace the sample.
4. Move the loading stage into the run position.
To resume, click the Resume button on the instrument control panel.
IMPORTANT! If the loading stage is not placed in the wash position after a sample is
removed and before a new one is loaded, the system will not provide a pressure
boost. Without washing the sample line, contamination in the new sample may occur.
5.1.9 Stopping and Saving
When the desired data have been collected, acquisition can be stopped and the data saved.
The data are saved in FCS 3.1 format and will include the protocol used for acquisition. The
stop button will depressurize and unlock the sample. Before running another sample, place the
loading stage in the wash position to backflush and clean the sample line.
5.2 Compensation
5.1.10 Backflushing and Washing
After the sample is unlocked, the loading stage can be moved to the wash position. The wash
process includes a backflush and an exterior wash of the sample line. This process is crucial to
reducing carryover and for overall cleanliness of the system. After washing, the loading stage
will automatically unlock, and the next sample may be placed into the run position.
If an additional wash is desired, you have two options:
n
Lower the loading stage for >2 sec then bring it back to the wash position. An additional
wash cycle will run after returning to the wash position
n
Press the touch locking system screen above the loading stage until the padlock displays as
locked. This will initiate an additional wash
5.2 Compensation
Compensation is the process by which spectral overlap (spillover) is removed from other
detectors. The inherent overlap of emission spectra from fluorescent labels and probes makes
compensation necessary. This is of particular importance when simultaneously measuring
fluorescence from several labeled antibodies or probes. During acquisition, compensation can
be adjusted to eliminate this spectral overlap between fluorophores (Figure 59).
The density plot shown displays an FL1 control data file (Figure 59). The FL1 positive population
is higher on the FL2 scale than the negative population, though it has no FL2 fluorescence.
When compensation has been applied, the positive FL1 population has the same median value
as the FL1 negative population in the FL2 parameter.
Instruction Manual | 55
Page 66
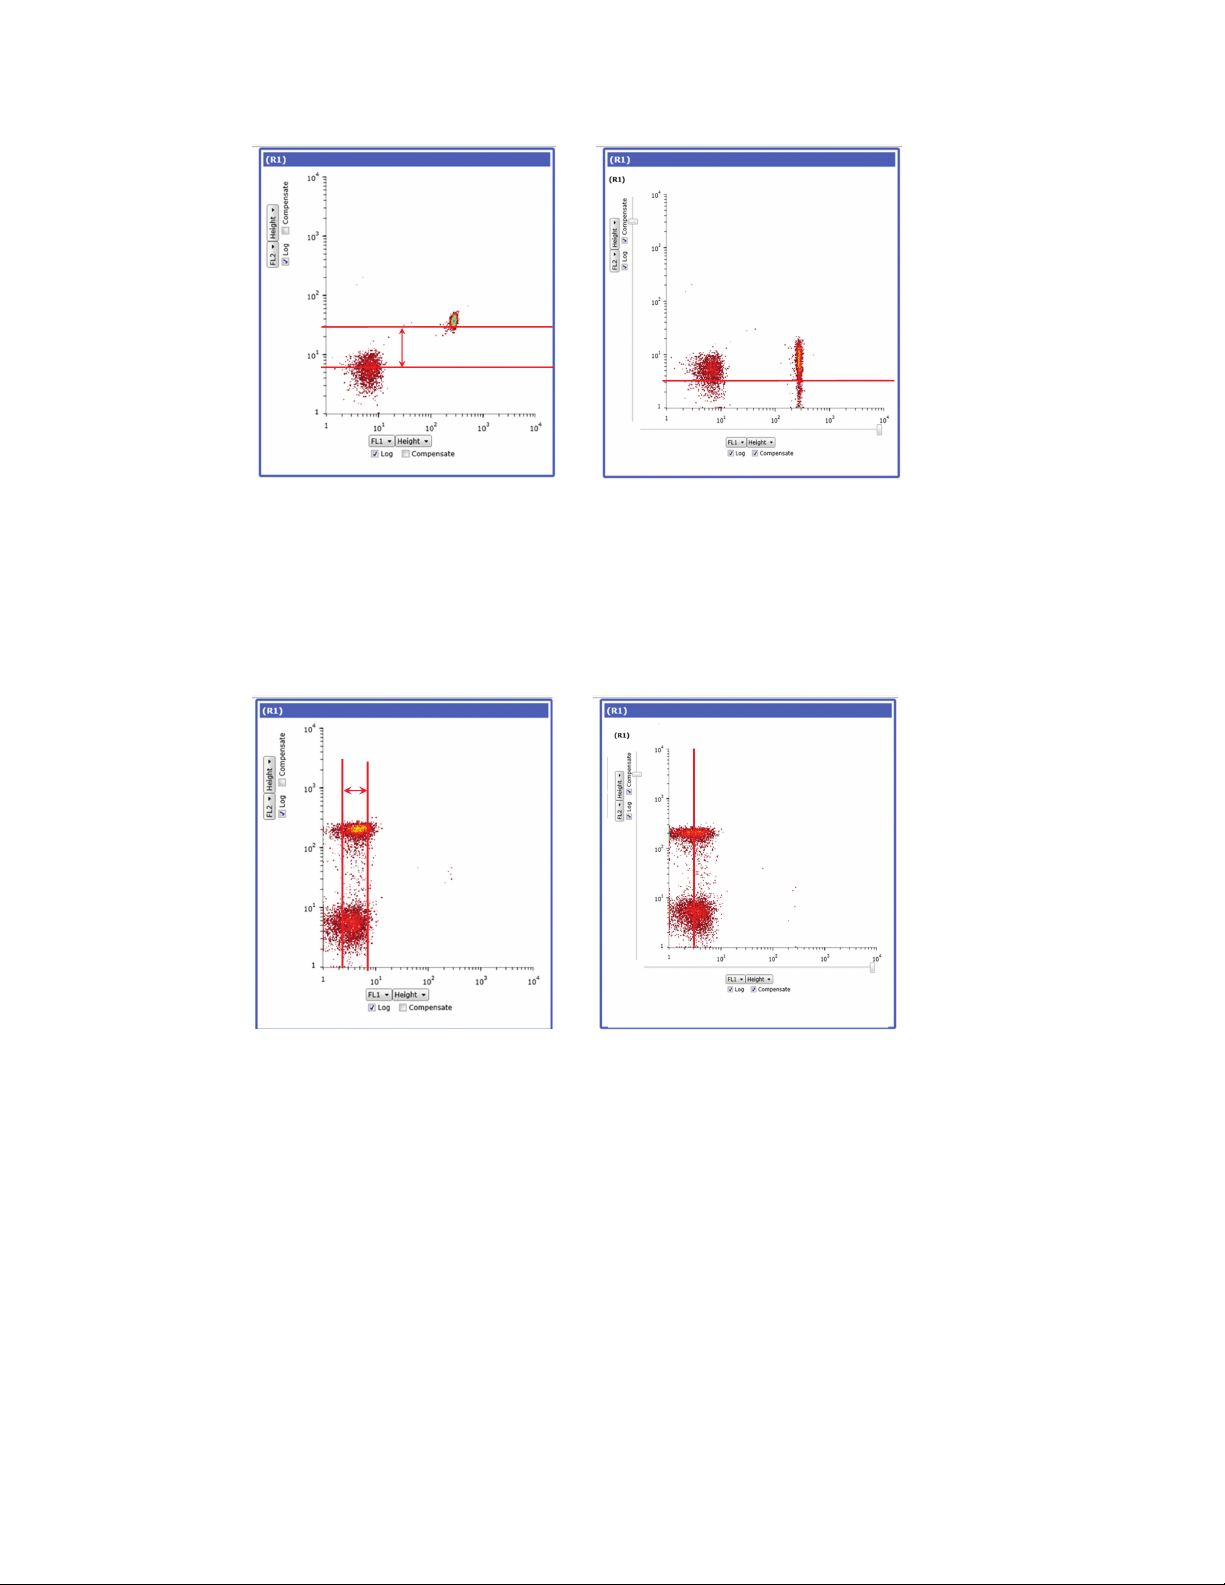
Acquisition
Fig. 59. Density plot showing uncompensated (left) and compensated data (right).
The same can be done for the FL2 positive control, though the compensation required is
much less (Figure 60).
Fig. 60. Same data plots showing incorrectly compensated file (left) and correctly
compensated file (right).
As compensation is adjusted, the compensation matrix will be updated. At any time the
compensation matrix can be viewed using the button on the toolbar (Figure 61).
56 | S3 and S3e Cell Sorters
Page 67

Fig. 61. Compensation matrix.
5.2.1 Auto Compensation Wizard
The compensation wizard assists with establishing the proper compensation matrix coefficient
for each parameter. Single controls for each parameter and the associated FCS files must be
saved prior to compensation.
5.2 Compensation
To use the compensation wizard:
1. Run single controls for each parameter and your multi-stained sample.
2. Save FCS files.
3. Select Home > Compensation Wizard.
4. Select the parameters for compensation (Figure 62).
5. Click the file icon for each selected parameter (Figure 62).
Fig. 62. Use the auto compensation wizard to select individual parameter FCS files and adjust regions.
Instruction Manual | 57
Page 68

Acquisition
6. Locate and select the single control FCS file for each parameter.
7. Select whether to use height or area for all parameters.
8. Click the forward blue arrow to open the Automatic Compensation Calculation Wizard
window (Figure 63).
9. Adjust the scatter, negative, and positive regions as necessary.
Note: The positive and negative population gates must not overlap.
Fig. 63. Using the auto compensation wizard to adjust positive and negative gates.
10. Click the blue forward arrow to go to the next control.
11. Repeat steps 9 and 10 for remaining controls.
12. After all controls are adjusted, click the checkmark button. This will complete the automatic
compensation calculation.
13. Check the compensation box on the axis of the desired histogram or density plot to display
the compensated data and acquire or sort.
14. The compensation matrix may be viewed at this point if desired.
The hyperlog feature allows data that have values <0 to be correctly displayed. This data display
format is used only for compensated data (Figure 64). It converts a small portion of the scale
around zero to linear, and adds a small amount of negative log scaling to each access, preventing
negative events from piling up on the axis. This allows better visualization of compensated data.
Note: The area parameter is grayed out and cannot be changed because compensate is
checked. Compensation can only be applied to area or height depending on which selection
was chosen during auto compensation.
58 | S3 and S3e Cell Sorters
Page 69

Fig. 64. Density plot showing hyperlog, log, and compensation options.
5.2 Compensation
5.2.2 Manual Compensation
It is advised to use the auto compensation feature of the software, however it is possible
to alter the compensation matrix manually (Figure 65). This process, although historically
used, is difficult to set correctly and the process of compensation should only be performed
using the wizard unless knowledgeable and statistically correct adjustments can be done
by manual compensation. Compensation controls for each fluorochrome you will be using in
your experiment. The process is most accurate if you have both positive and negative events
in each sample, and it is advisable to acquire at least 5,000 positive events. After the sample
is acquired, load each sample one by one into the software, setting the histogram axes to the
parameters you would like to adjust, and checking the Comp box on the histogram axes. By
applying quadrants it is possible to attempt to match the median of the negative population to
the positive population (Figure 64). When the value in the matrix is changed, the populations will
move. Alter until the median values are correct and matched.
Fig. 65. Compensation matrix.
Instruction Manual | 59
Page 70

Acquisition
5.3 Checking or Swapping Fluidics
The bulk fluidic containers are located inside the system and can be accessed by the fluidics
door on the left front of the instrument. These fluidic containers require changing on a regular
basis. As recommended in Chapter 4, Getting Started, fluidic containers should be changed prior
to initiating the software or after shutting down the system. If the fluidic containers need to be
swapped after startup or during a run, the S3™ and S3e™ Cell Sorters are designed to easily allow
this without the need to shut down the system. This is considered as a hot swap of the fluidics.
The fluidics status indicator on the instrument control panel provides information regarding the
levels and approximate run times remaining for these containers (Figure 66). This window will pop
up when the approximate run time is down to an hour and will continue to alert every 15 min until
a swap is performed. A hot swap can be done when the limiting fluid is highlighted. The alert may
be snoozed at this point if desired.
WARNING! When the remaining run time is down to 5 min, the system will automatically shut
down. The fluidics will need to be refilled and the startup procedure must be performed to
ensure the lines contain no air and the system is properly QC’d.
Fig. 66. Fluidics Status window.
5.3.1 Hot Swap
A hot swap is defined as the process of changing a fluidic container after initial instrument
startup or during a run without the need to shut down the instrument. Unlike other cell sorters,
the S3 and S3e Systems maintain the fluidics pressure internally to enable a hot swap for
uninterrupted sort collection and eliminates the need for additional repressurization time.
IMPORTANT! New containers should be prepared before beginning a hot swap, as
the swap time is limited to three min before the system will automatically shut down
due to low fluid levels.
60 | S3 and S3e Cell Sorters
Page 71

5.3 Checking or Swapping Fluidics
To perform a hot swap:
1. On the Setup and Maintenance tab select Swap Fluidics.
2. A countdown timer will automatically start. This is the amount of time left to swap the
containers before the system will automatically shut down (Figure 67).
WARNING! The system contains a limited amount of reserve fluids to continue running the
system during the swap. If the timer reaches zero, the system will automatically shut down.
Work quickly and carefully during these swapping steps. If the system shuts down, perform the
QC procedure prior to running a sample.
Fig. 67. Swap Fluidics window with swap time remaining highlighted.
3. Open fluidics door.
4. Detach the quick disconnect from the cap assembly by pushing the metal button.
5. Lift the quick disconnect until it engages the magnetic holder. This will hold the quick
disconnect away from exchange area.
For sheath fluid or DI water:
6. Slightly lift and pull out the empty container.
7. Remove the cap assembly from the empty container.
8. Uncap and remove the seal from a new 4 L container.
9. Carefully place the cap assembly onto the new 4 L container and tighten the cap.
10. Proceed to step 11.
For Waste:
6. Slightly lift and pull out the waste container.
7. Remove the waste cap assembly.
8. Empty the waste container following lab procedures for liquid biohazardous and chemical
waste removal.
9. Place the waste cap assembly into a new designated waste container or recap emptied
waste container.
10. Proceed to step 11.
Instruction Manual | 61
Page 72

Acquisition
11. Place the container back into position.
12. Attach the quick disconnect to the cap assembly. An audible click should be heard.
13. Click the play button in the Swap Fluidics window to finish the swapping procedure.
IMPORTANT!
n
When handling sheath fluid and DI water containers, minimizing air exposure will
help to avoid contamination
n
While transferring cap assemblies to a new container, avoid touching the
assembly to outside surfaces of the containers. If it is necessary to set the cap
assembly down, use only sterilized surfaces
n
Treat all waste as biohazardous for safety
5.4 Optical Filters
The optical filters separate and direct the fluorescent light to the PMTs for detection. These filters
are located behind a sliding panel on the top and toward the rear of the S3 or S3e System.
5.4.1 Standard Filter Configuration
The standard filter configurations for the S3 or S3e Systems are shown in Figure 68. The filter
configuration can be viewed and edited in the ProSort™ Software.
To view or edit the filter configuration:
1. On the Setup and Maintenance tab select Filter Configuration.
2. Click inside each area to modify the filter name or wavelength.
3. Click the checkmark button to save the changes.
WARNING! Changes to the filter configuration will be set as the default.
Fig. 68. Different filter configurations. A, 488/561 nm system; B, 488/640 nm system; C, 488 nm system.
62 | S3 and S3e Cell Sorters
Page 73

In front of each PMT is a holder for a neutral density filter or bandpass filter. Each filter holder
contains a screw-in retaining ring that can be removed or replaced with the provided red S3
spanner wrench.
5.4.2 Optical Filter Blocks
The S3 and S3e Systems include two preset filter blocks. The filter set depends on the
instrument configuration. The optical filter blocks can be changed to accommodate dectection
of different fluorophores. These blocks can be easily removed with the silver handle (Figure 69).
5.4 Optical Filters
Fig. 69. Lifting an optical filter block.
The filter blocks contain the dichroic and bandpass filters. The optical filters within the block
are user changeable and will accommodate multiple filter sizes as described in Table 23. The
dichroic filter holders are locked from the bottom of the block. Once unlocked, they can be
removed and replaced from the top of the block.
Table 23. Description of filter sizes for use with optical filter blocks.
Filter Descripiton
Normal incidence filters 25.4 mm (1 in) round, up to 2 mm thick
12.7 mm (0.5 in) round, up to 2 mm thick
11 x 11 mm square, up to 2 mm thick
12 x 25.4 mm rectangle, up to 2mm
Dichroic holders 25.4 mm (1 in) round, up to 2.7 mm thick
12 x 25.4 mm rectangle, up to 2.7 mm thick
Neutral Density (ND) holders 25.4 mm (1 in) round, up to 10 mm thick
Instruction Manual | 63
Page 74

64 | S3 and S3e Cell Sorters
Page 75

6
Sorting
Sorting cell populations is highly dependent on several factors such as cell type, population
frequency in the starting sample, cell concentration, sample preparation, and sort logic
definitions. It is very important to start with a single cell suspension with minimal amount of
dead cells or debris contamination.
6.1 Sort Setup
The majority of sort setup procedure is automatic and is completed during daily QC. When
ready to sort, the desired populations must be selected using regions and gates. At this time
sort logic definitions must be set.
To start a sort:
1. Click File > New Protocol or Open Protocol.
2. Click Home > Histogram or Density to add plots to the workspace.
3. Adjust temperature control for sample input station and sort collection area if desired.
4. Place filtered sample into the sample input station.
5. Move the loading stage into the run position.
6. Click Start on the instrument control panel to acquire a small amount of the sample.
7. Set sorting regions and gates on plots with populations of interest.
8. Right click on the desired region to be sorted and select sort direction.
9. Repeat with a second region if two-way sorting is desired.
10. Click the Sort Logic dropdown menu to select the collection vessel of choice.
11. Define the sort logic parameters in the Sort Logic window (Figure 70) by setting the sort
mode (purity, enrich, or single) and event limit for each collection position.
12. Define sort collection tube volume if you want to track collected volume to prevent
collection overflow.
13. Place sort collection vessel in the sort collection device at positions 1, 2, etc.
Note: 5 ml tubes should have at least 0.5 ml media and 1.5 ml tubes should have at least
0.1 ml filtered media to collect and cushion the sorted cells.
Instruction Manual | 65
Page 76

Sorting
Fig. 70. Sor t Logic window.
14. Close the sort chamber door.
15. Click Start Sort on the instrument control panel. The Sort Statistics window will open
and sorting will begin (Figure 71). The Sort Statistics window can be reopened using the
Sort Statistics button on the Home toolbar. Click on the arrow in the upper right corner to
expand the window and show the statistics table.
16. If no limits have been set, click the same sort button to stop the sort when desired.
17. Return loading stage to the washing position.
18. Open sort chamber door and remove sorted cells.
Fig. 71. Sort Statistics window.
66 | S3 and S3e Cell Sorters
Page 77
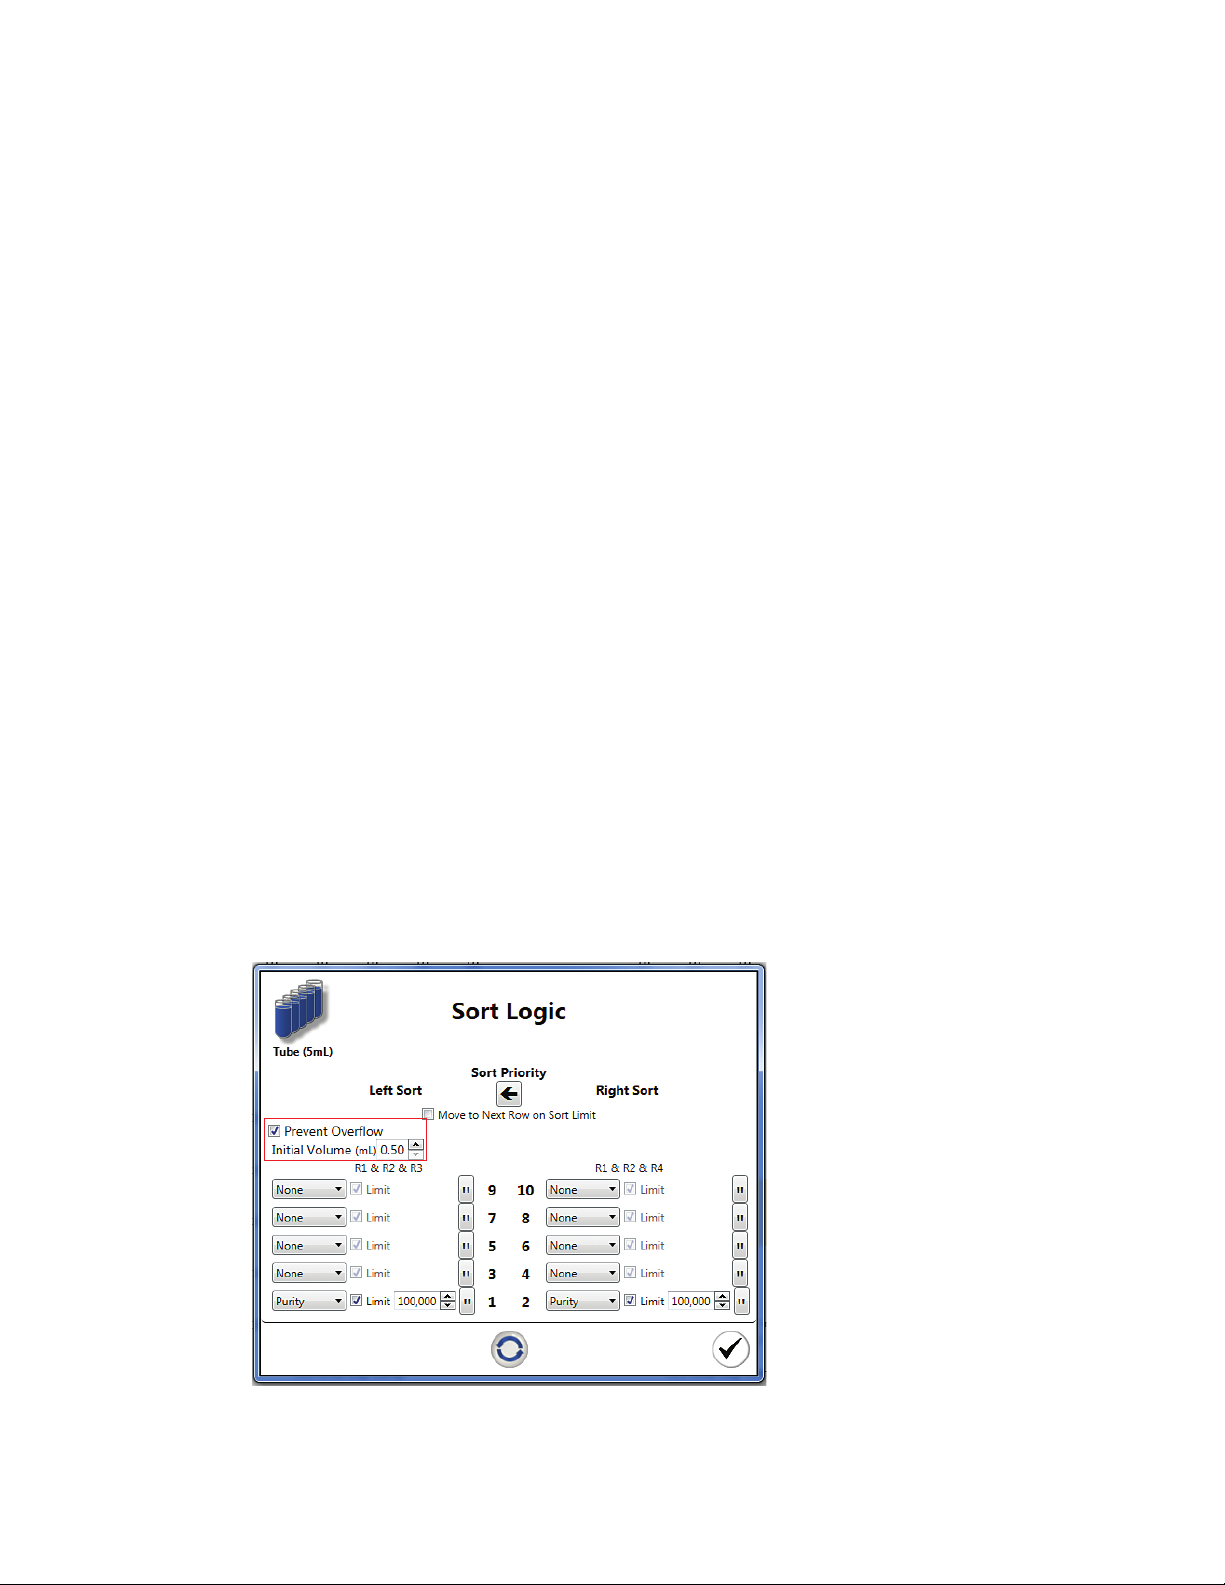
6.1.1 Sort Collection
The S3™ and S3e™ Systems offer four types of sort collection vessel options:
n
5 ml tubes
n
1.5 ml tubes
n
8-well strips
n
Microscope glass slides
Each sort direction has the capability of sorting into 5 ml tubes and 1.5 ml tubes up to a quantity
of 5 tubes in each direction. Using the quick-attaching adaptors, sorted cells can be collected
into 8-well strips (up to a quantity of 8) or onto a microscope slide (up to a quantity of 20). Each
tube and well may have different sort modes and limits assigned.
It is highly recommended that media, buffer, or serum is added to the sort tubes or wells prior
to sorting to give the cells a cushion, avoid evaporation of droplet volumes, and to help preserve
cell viability during the sort collection period. The minimum recommended volume is 0.5 ml of
filtered buffer or media for each 5 ml tube. The minimum starting volume for 1.5 ml tube is 0.1 ml.
Note: The sort output may be temperature controlled to the same temperature as the sample input
station. This temperature can be enabled/disabled and adjusted on the instrument control panel.
6.1 Sort Setup
6.1.2 Volume Tracker
During a sort, the system has the ability to track the volume and number of droplets deflected
into each sample collection tube. Volume tracking can be enabled to automatically stop a sort
or move to the next tube position before a tube overflows.
To enable this feature:
1. Click the Prevent Overflow checkbox in the Sort Logic window (Figure 72).
2. Enter the starting volumes for the sort collection tubes.
Note: The minimum starting volume for a 5 ml tube is 0.5 ml and the maximum is 2 ml. The
minimum starting volume for 1.5 ml tube is 0.1 ml and the maximum is 0.5 ml.
Fig. 72. Sort Logic window with Prevent Overflow highlighted.
Instruction Manual | 67
Page 78
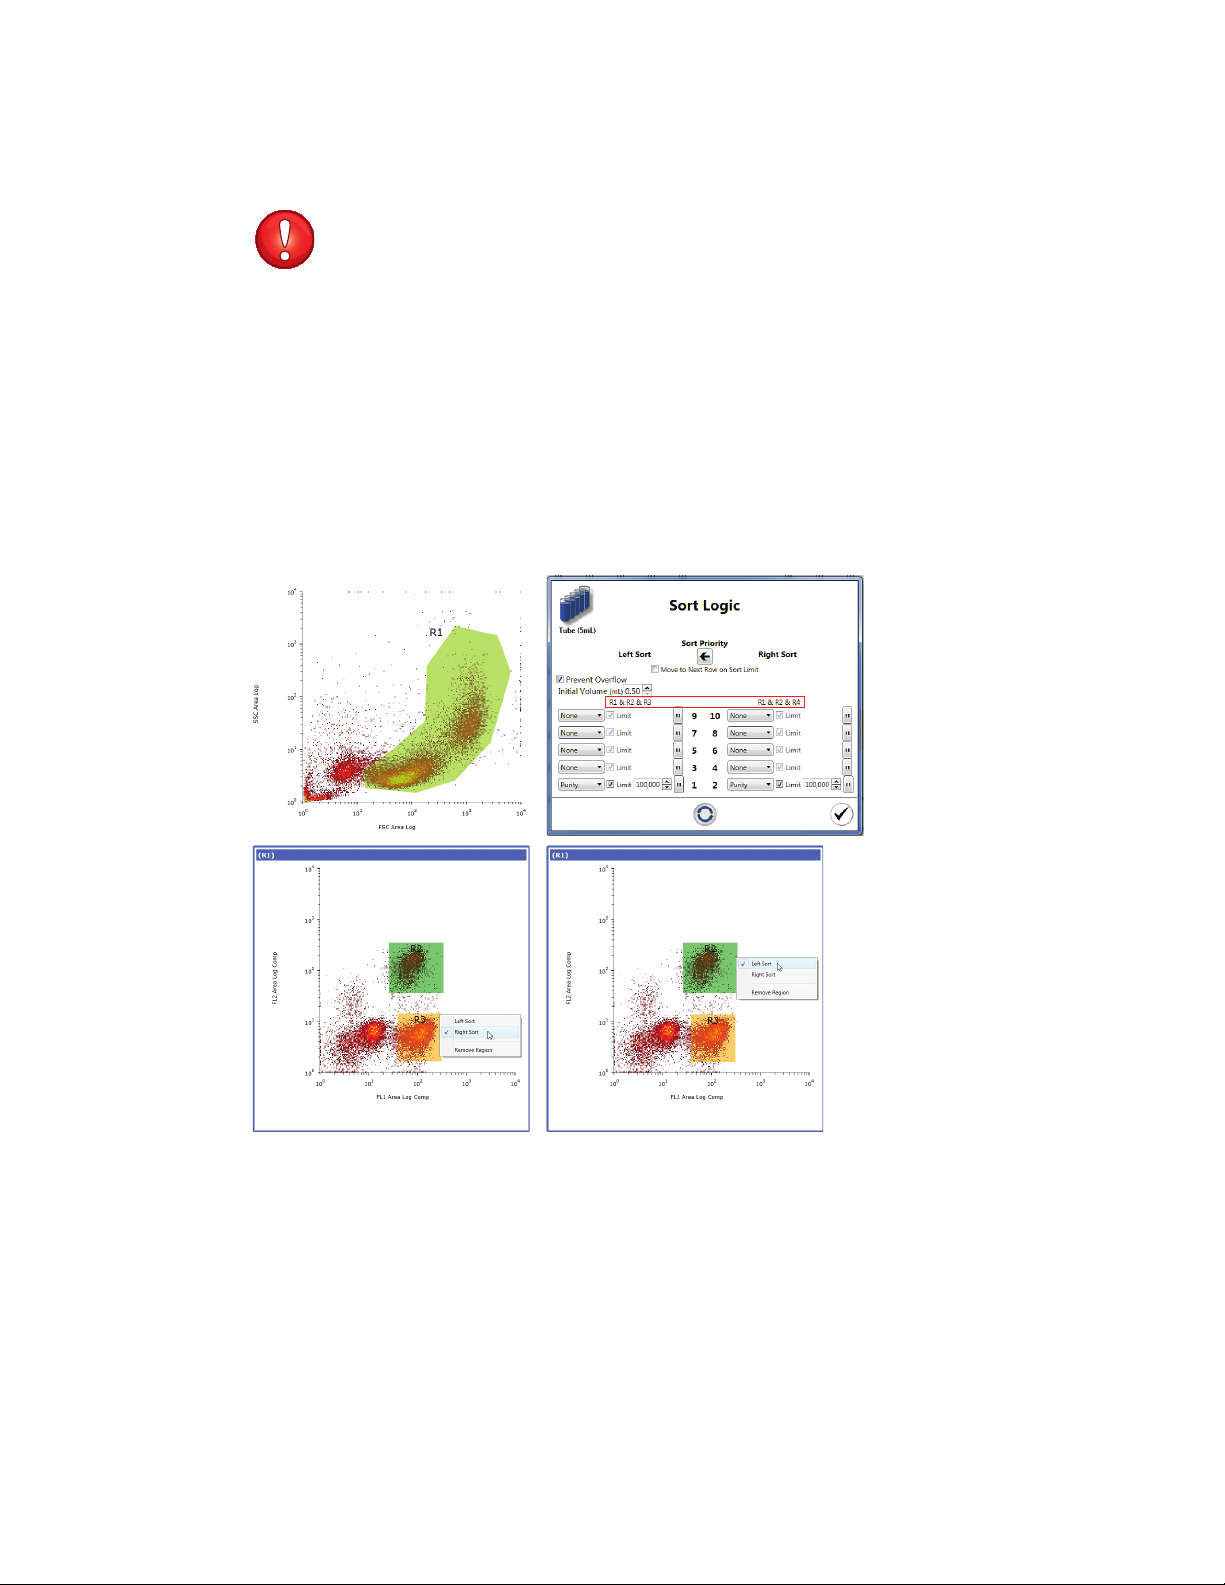
Sorting
Note: If a sort limit is selected and volume tracking enabled, whichever criterion (limit or full
tube) is met first will stop the sort.
IMPORTANT! The maximum total volume for a 5 ml collection tube is considered to
be 4 ml. The maximum total volume for 1.5 ml tube is 1 ml. Going above these
maximum volumes will cause spraying and risk contamination.
6.1.3 Setting Regions to Sort
Regions and gates in the histograms and dot plots are used to create sort logic. Multiple
regions can be used to establish the sort logic (Figure 73).
To set the sort logic:
1. Identify the population of interest with regions and gates.
2. Right click in the region to sort and select Right Sort or Left Sort. That region will change
color and any regions used in the gating of that plot will change as well. Regions used in
sort criteria may be confirmed in the Sort Logic window and sort statistics panel.
Fig. 73. Choosing sort definitions.
6.1.4 Sort Logic and Collection Vessel
After regions and gates have been assigned to sort left or right, the sort collection vessel must
be selected. The Sort Logic window can be used to review sort logic, set sort modes and
limits, and set priority (Figure 74). The selected collection vessel will be displayed as the icon to
show the sort type selected. If there is overlap between the logic of the two streams, the left
sort direction will take priority unless changed. The numbers shown in this window represent
the numbers in the sort output area.
68 | S3 and S3e Cell Sorters
Page 79
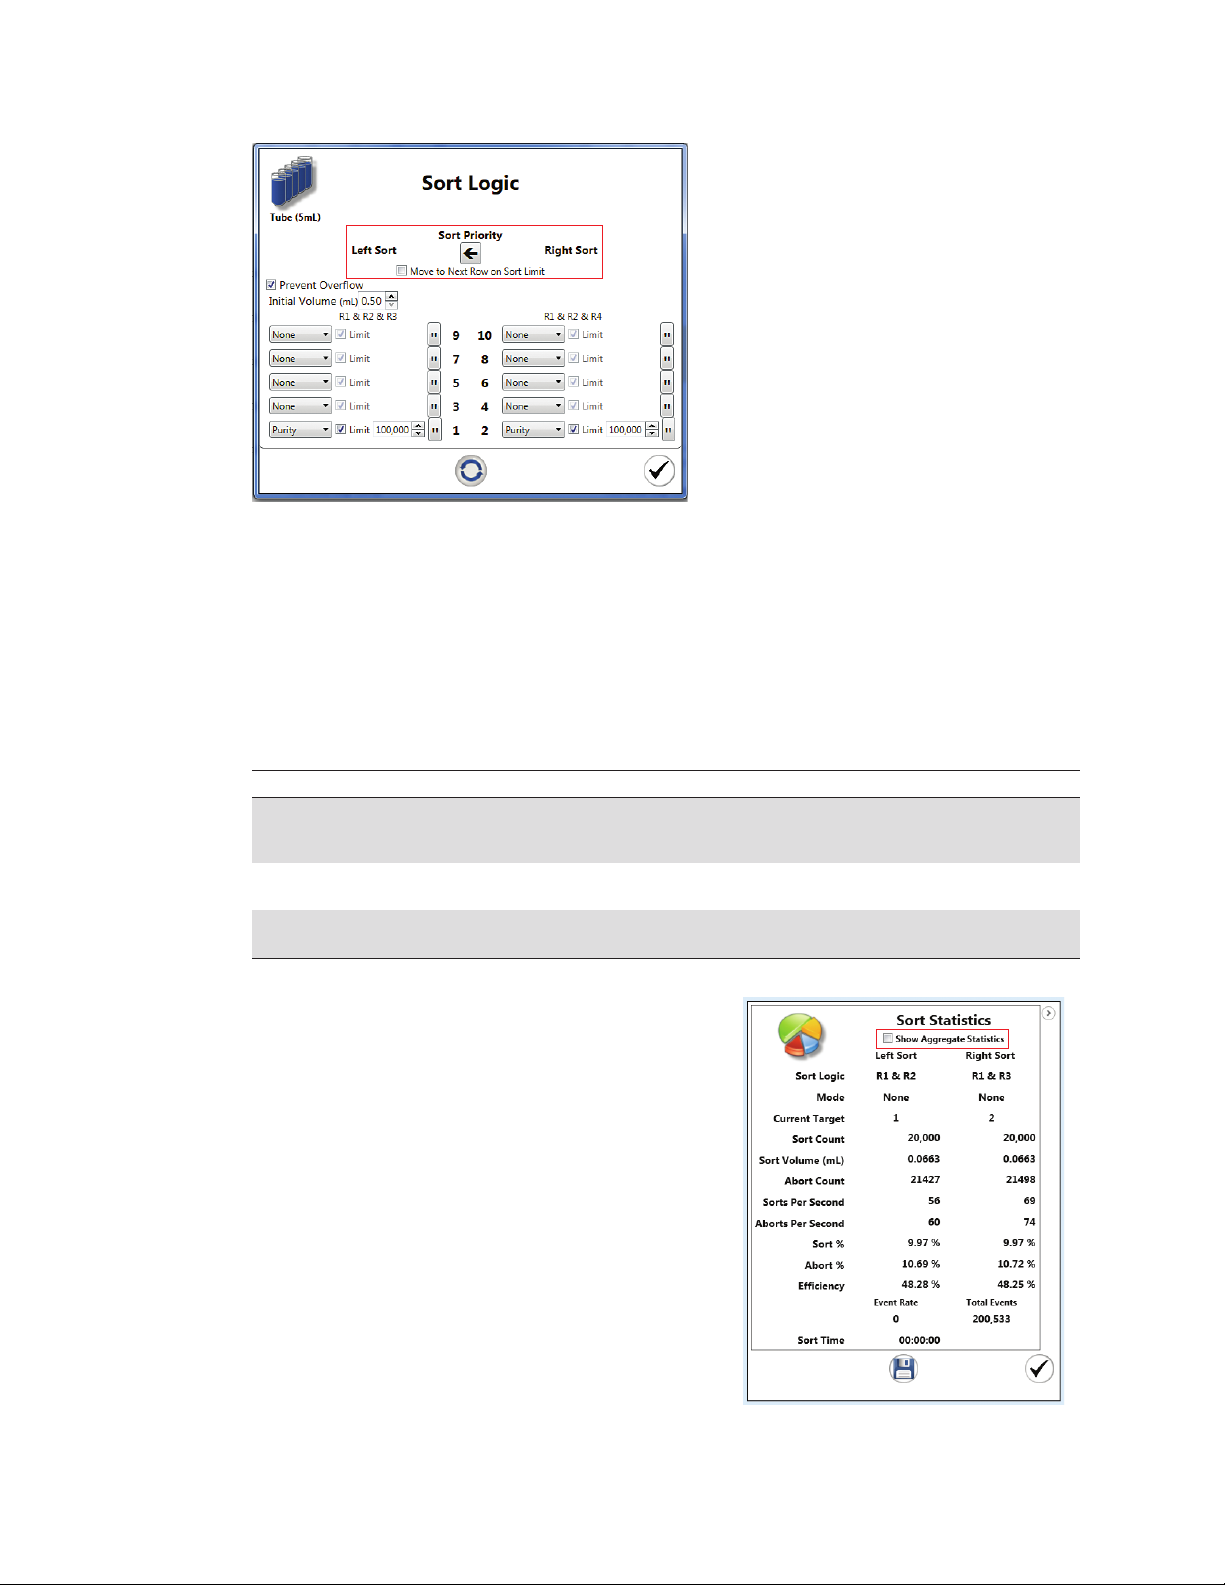
Fig. 74. Sort Logic window with sort priority and sort modes highlighted.
6.2 Sort Modes
6.2 Sort Modes
Table 24 describes the three sort modes available when setting up a sort. Sort modes can be
selected for each sort direction.
Table 24. Sort mode definitions.
Sort Mode Definition When to Use
Single Cell This mode requires that one and only one positive event be in the Single cell deposition
center of the droplet without any negative events nearby. Recovery
will be reduced due to the sort restrictions
Purity This mode will sort as long as no negative events are present in the General sorts where both purity
droplet. If multiple positive events are present, sorting will still occur and recovery are important
Enrich This mode will sort all positive events regardless if negative events Sorts when recovery is critical
are nearby. Purity will be reduced to maintain high recovery and purity is not as important
6.3 Sort Statistics
The sort statistics window can be viewed during
a sort and added to a print page for reporting
(Figure 75). This window will automatically open
when a sort is started.
If a saved partial FCS file is opened, aggregate
statistics can be shown:
1. File > Open FCS File with Protocol.
2. Click on the Home tab and click Sort
Statistics.
3. Check the Show Aggregate Statistics box
to view statistics from all sorted events.
Fig. 75. Sor t Statistics window.
Instruction Manual | 69
Page 80

Sorting
Table 25 describes the available sort statistics. Each statistic is sort-stream specific. The Sort
Statistics window can be placed in the workspace for printing. Sort statistics are saved within
the FCS file.
Table 25. Description of sor t statistics.
Statistics Definition
Sor t logic The regions used to identify the populations to sort
Mode The sort mode used for sorting left or right
Current target The sort target position used during the sort
Sort count The current number of positive events sorted
Sor t volume (ml) The volume sorted into each tube/well. This does not include the media placed
in the tube prior to sorting
Abort count The current number of positive events aborted
Sor ts per second The sort count per second as a rate
Aborts per second The abort count per second as a rate
Sort % Number of sorted events divided by total events x 100
Abort % Number of aborted events divided by total events x 100
Efficiency Number of sorted events divided by the sum of sorted and aborted events x 100
Event rate Real-time events per second during the sort
Total events Total events acquired during the sort
Sor t time Sort time elapsed
Additional information can be shown in the Sort Statistics window by using the arrow on the
upper right hand side of the window. This will expand the window to show a table listing the
data for each tube during the run. There are up to ten outputs equivalent to five tubes in two
directions. This information can be saved as a tab-delimited file using the save button located
in the lower right corner of the window. This information is automatically stored in the FCS file.
Fig. 76. Sort Statistics window expanded to reveal additional information.
70 | S3 and S3e Cell Sorters
Page 81

6.4 Sort Plots
During a sorting experiment a sort plot can be created in the current protocol. This plot
displays graphically the counts of events (sorts and aborts) per tube/well/slide spot in the sort
run. The data on this sort plot (Figure 77) correspond to the Sort Statistics window (Figure 76).
The numbers 1–10 are the sort position designations as assigned in the Sort Logic window
(Figure 74). Regions can be applied to the sort plot. These regions can be applied to other
histograms or density plots.
6.3 Sort Statistics
Fig. 77. Sort Plot window.
Instruction Manual | 71
Page 82

72 | S3 and S3e Cell Sorters
Page 83

7
Additional Software Features
The ProSort™ software is an acquisition and sorting software package with the additional
features described in this chapter.
7.1 Debubble
During the startup procedure, a debubble step will occur to clear the system of air. At times,
a bubble may enter the nozzle and cause problems with the stream. On the Setup and
Maintenance tab select Debubble to rinse the system and attempt to debubble the nozzle. The
stream can also be monitored at this time to see any changes.
7. 2 Un c log
A clog can easily be introduced and can cause multiple problems with the fluidics. When a
clog occurs, the software will display an error, stop the sample, stop the sort, and eject sorted
samples for protection.
Use the Unclog button on the Setup and Maintenance tab toolbar as a first-line action. The
™
and S3e™ Systems have the ability to backflush the nozzle, potentially releasing the clog
S3
and flushing it into the waste. If successful, run a couple of debubble cycles to remove any air
that may have been pulled into the nozzle body.
7.3 Swap Tip
There will be occasions when the unclog function will not be able to clear a clog in the system.
Use the Swap Tip button on the Setup and Maintenance tab toolbar to run the Swap Tip
wizard. This wizard will walk through each step of the nozzle tip swap. Use the same Swap Tip
button when nozzle adjustments are necessary or the nozzle needs cleaning.
Please refer to Section 10.4, Swap Nozzle Tip Wizard, for step-by-step instructions on
swapping the nozzle tip, or contact Technical Support if any of these solutions do not resolve
the problems.
IMPORTANT! To avoid clogs when working with cells, resuspend cells into single
cell suspension and always use a 40 µm or smaller filter prior to cell sorting.
Instruction Manual | 73
Page 84

Additional Software Features
7.4 Clean System
In between samples or users, cleaning can be done at low or high pressure. High pressure
cleaning will cause the system to stop maintaining droplets and a QC procedure must be run
before sorting. If cleaning between samples, the low pressure option is recommended. The
fluidics lines will be flushed thoroughly with cleaning solution, similarly to the cleaning protocol
used during the shutdown or logout procedure.
To clean the system:
1. Fill a 5 ml tube with a minimum of 3 ml of cleaning solution.
2. Load tube into the sample station and move in to run position.
3. Click the Set Up and Maintenance tab.
4. Click Clean System.
The cleaning protocol will automatically begin. A prompt will appear to warn the user that the
clean function will begin and that the contents within the sample tube will be used rapidly.
Fig. 78. Cleaning protocol warning box.
5. Select the cleaning mode to run (Figure 79).
6. Click Ye s to proceed with mode (Figure 80).
7. Move the loading stage into wash position (Figure 81).
Fig. 79. Clean System modes.
Fig. 80. Warning for high pressure cleaning protocol.
74 | S3 and S3e Cell Sorters
Page 85

Fig. 81. Cleaning protocol final stage.
The cleaning protocol will be completed when the window disappears. If a high pressure
cleaning has been chosen, run a QC using ProLine™ calibration beads before sorting.
7.5 Instrument Status Box
The instrument status box is located at the bottom of the instrument control panel. The
notification and the color of the box will change depending on the state of the instrument. Table
26 describes the notifications and colors.
7.5 Instrument Status Box
Table 26. Instrument Status Box notifications and colors.
Color Notification Action Example
Gray Off Nothing Off
Green Ready Can begin acquisition or sort Acquiring sorting
Yellow Information Perform requested action Require QC
before proceeding Fluids Low/High
Orange Warning Nothing, system is running Calibrating
Red Error Perform required maintenance Not maintaining droplets
7.6 Status Bar
The status bar is located at the bottom of the ProSort Software window with nine status
indicators (Figure 82). Table 27 describes the status indicators.
Fig. 82. Status bar with the status indicators numbered.
Table 27. Description of each status indicator.
Number Description
1 Software connectivity to instrument
2 Current date
3 Temperature control status
4 Event rate (events per second)
5 Total event number
6 Acquisition time elapsed
7 Sort time elapsed
8 Current user
Instruction Manual | 75
Page 86

Additional Software Features
7.7 Printing
Print and print preview buttons are available in the File dropdown menu and on the Setup
and Maintenance tab (Figure 83). Use the print preview function to move histograms and
density plots in your print layout. Regions can also be modified in this view and will apply to
the protocol displayed. Once arranged, click the print button to bring up the print dialog where
the printer and paper may be selected. Sort statistics, filter configuration, annotations, and
compensation matrix may also be printed on the page. Select the desired print options on the
Setup and Maintenance tab.
Fig. 83. Printing options available.
7.8 Quality Control Reports
Two different reports are available to track the daily performance of the S3 and S3e Systems. One
is the daily QC report which will show pass/fail and droplet information for the selected day (Figure
84). Past days can be viewed using the date select option. If QC has been run multiple times in a
given day, select the daily QC report of interest from the Time dropdown list. To open the FCS file
for the QC data shown in the report, select the Open FCS File button at the bottom of the report.
This report may also be printed if desired.
Fig. 84. Daily QC report.
76 | S3 and S3e Cell Sorters
Page 87

7.9 User Reports
The second QC report is a trending report in which a range of dates can bev viewed for PMT
voltages, CVs, and drop drive amplitude and frequency (Figure 85). When viewed, comments
can be added and the reports may be printed for reference.
7.9 User Reports
User reports are accessible by
administrators and can be used to track
system usage over time (Figure 86). These
reports can be printed for reference and
will include the session notes entered when
users were logged into the software.
Fig. 85. QC trending report.
Fig. 86. User report.
Instruction Manual | 77
Page 88

Additional Software Features
7.10 Biosafety System
The S3™ Biosafety System is a Class I aerosol containment hood designed to work with the
S3 and S3e Cell Sorter, which works in conjunction with ProSort™ Software, providing users
and the environment protection from aerosols created during the cell sorting process.
The S3 Biosafety System is fully integrated with and monitored by the S3 and S3e Cell Sorter’s
ProSort Software, so users have real-time information about HEPA filter life and the temperature
of the system inside. To maintain containment, the fan speed is regulated based on the cell
sorter operation mode and the airflow rate through the HEPA filter.
The S3 Biosafety System functionally meets airflow requirements from the National Institutes of
Health (NIH) standards for Class I biosafety and the International Society for Advancement of
Cytometry (ISAC) guidelines.
For more information please see the S3 Biosafety System Class I manual.
Fig. 87. S3 Biosafety System Class I status window.
IMPORTANT! The S3 Biosafety System must remain on at all times when the S3 or
S3e Cell Sorter is inside the system. The cell sorter should be left with the main
system power on and will enter into idle mode when not in use.
Should the S3 Biosafety System be turned off when the S3 or S3e Cell Sorter power
is on inside, there could be risk of overheating and it may become a fire hazard.
If any of the following occur, the S3 and S3e Cell Sorters will stop sample acquisition or sort
and alert the user:
n
Airflow through HEPA filter drops below required limit
n
Filter life reaches 0%
n
ProSort Software loses communication with the enclosure
Until resolved, the software will not allow running samples or sorting.
When performing the swap tip procedure, the front panel may be lifted and attached via magnet
to the upper filter housing to allow nozzle access. Note that in this state, the S3 Biosafety
System’s airflow is reduced and the system is not considered to be in Class I containment.
IMPORTANT! If the airflow through the HEPA filter falls below required limits
for containment, the software will alert the user and stop the sort or
acquisition immediately.
78 | S3 and S3e Cell Sorters
Page 89

8
Shutdown
8.1 Daily Shutdown
The S3™ and S3e™ System should be shut down at the end of the day. This will turn off all
droplet formation and charging, lasers, and streams. A flush will be completed with the DI
water container to rinse the system.
IMPORTANT! Always follow the personal protective equipment (PPE) guidelines
relevant to your laboratory’s safety procedures for dealing with ethanol or bleach.
Note: At any time, the shutdown procedure can be canceled by clicking the X icon on the
dialog windows.
Note: If a user chooses to log off from the software, the force cleaning procedure option can
be run. Similar to the shutdown procedure, windows will appear with the exception of the
automatic startup window.
To shut down:
1. Ensure that the sample loading stage is in the wash position.
2. On the Setup and Maintenance tab select Shutdown. The software will confirm with a
dialog box that you intend to shut down the system (Figure 88).
Fig. 88. System shutdown check.
Instruction Manual | 79
Page 90
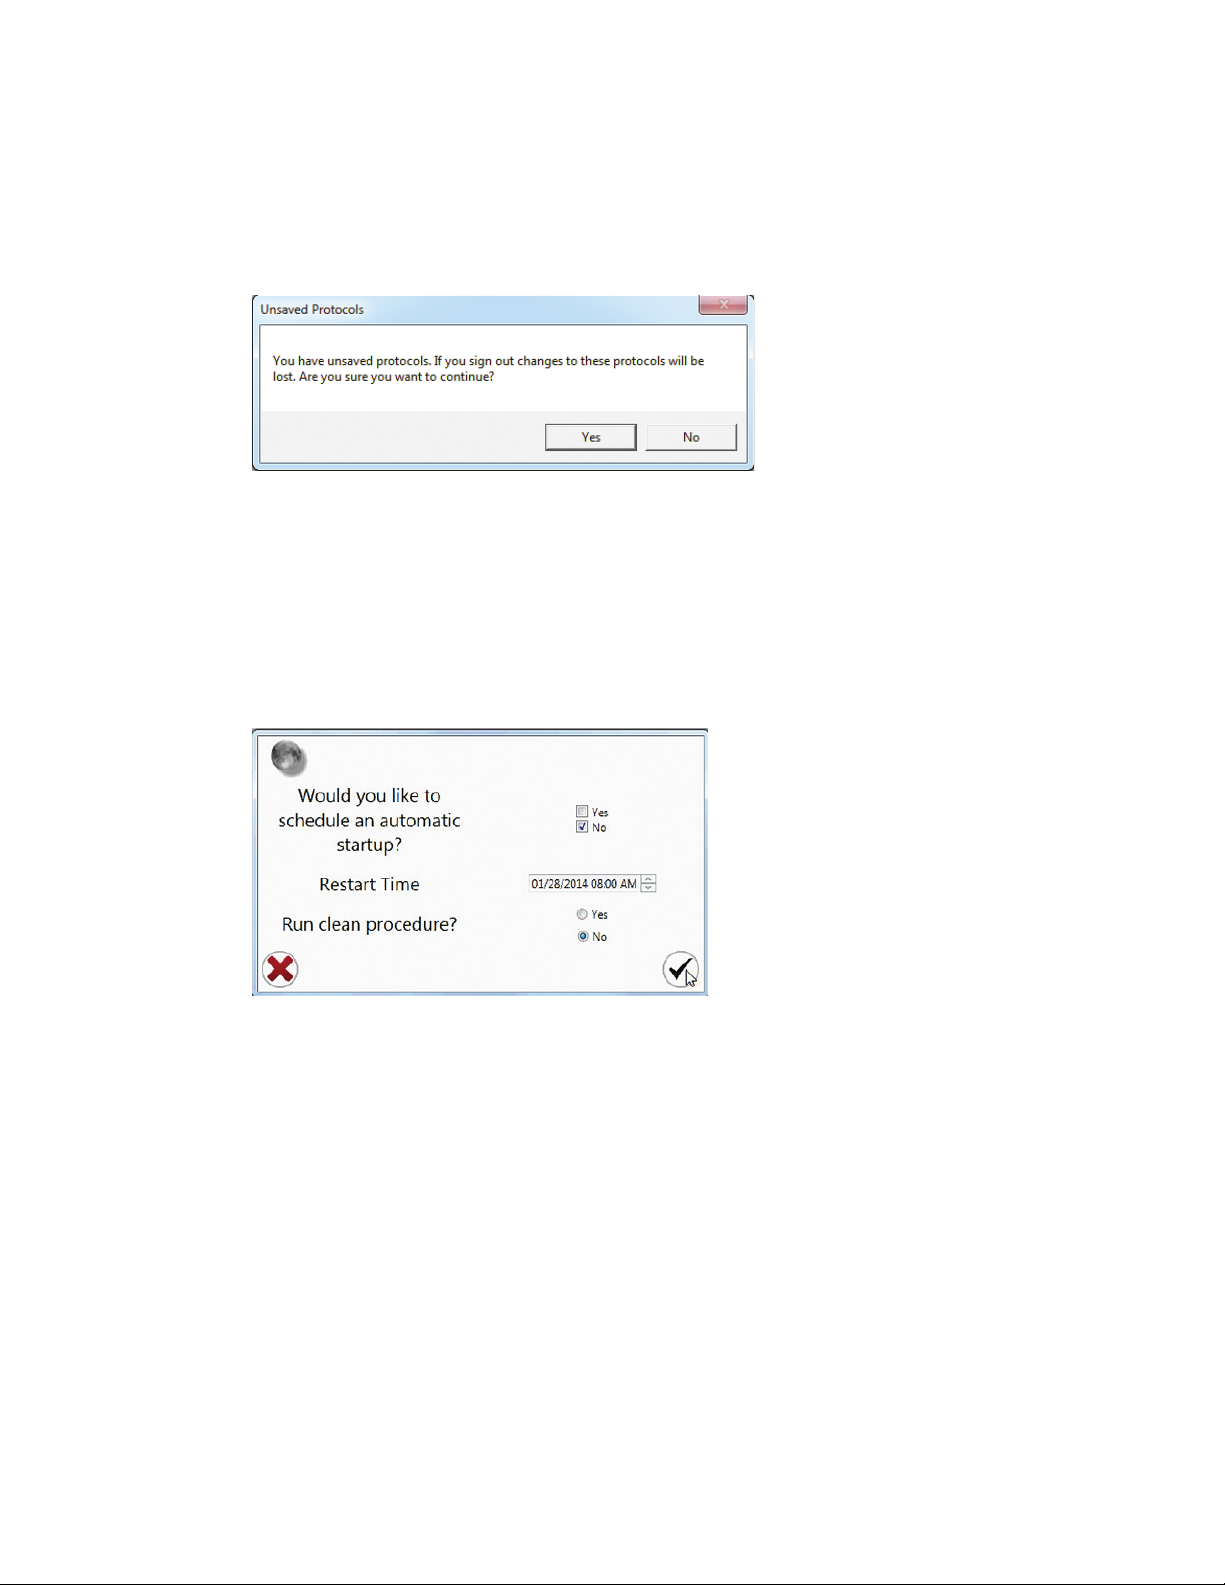
Shutdown
3. Click Yes to confirm shutdown.
Note: If there are any unsaved protocols, the software will warn you that unsaved changes will
be lost (Figure 89).
4. Click Yes to continue or No to abort shutdown procedure.
Fig. 89. Unsaved protocols check.
The shutdown procedure will display an automatic startup option. For ease of use and efficient
workflow, the system can be automatically started the next day (Figure 90).
5. If using the automatic startup option, select Yes and set the restart date and time.
Fig. 90. Automatic Restart window with shutdown icon highlighted.
80 | S3 and S3e Cell Sorters
Page 91

8.1 Daily Shutdown
A window will open requesting a tube of cleaner to be used to clean the system (Figure 91).
6. Load a tube of cleaning solution.
7. Move the loading stage into the run position.
Fig. 91. Star t the clean system option by following the prompt to load a tube of cleaner.
8. The system will automatically run through the cleaning procedure, which takes
approximately 2 min, while displaying status windows (Figure 92).
9. Put the Loading Stage into the wash position.
Fig. 92. Cleaning status windows.
Instruction Manual | 81
Page 92

Shutdown
Once the system is clean, the shutdown procedure will shutdown hardware, fluidics, air will be
purged, rinsing and backflushing of the sample line, rinsing and backflushing the sample probe
and lastly clearing the waste catcher (Figure 93).
The user will then be logged out and if automatic startup has been entered the countdown
will begin.
Fig. 93. Shutdown Status windows.
.
IMPORTANT! It is advised to clear waste and refill fluidic containers at the end of
the day’s use.
For automatic startup, waste must be empty and 8x sheath fluid and DI water must
have a supply sufficient for a 2 hr run time, minimum, in order to start up the system
properly without errors.
Once the shutdown procedure is completed the software will return to the opening login screen.
At this time the system is fully shut down and can be left in standby mode till the next use.
82 | S3 and S3e Cell Sorters
Page 93
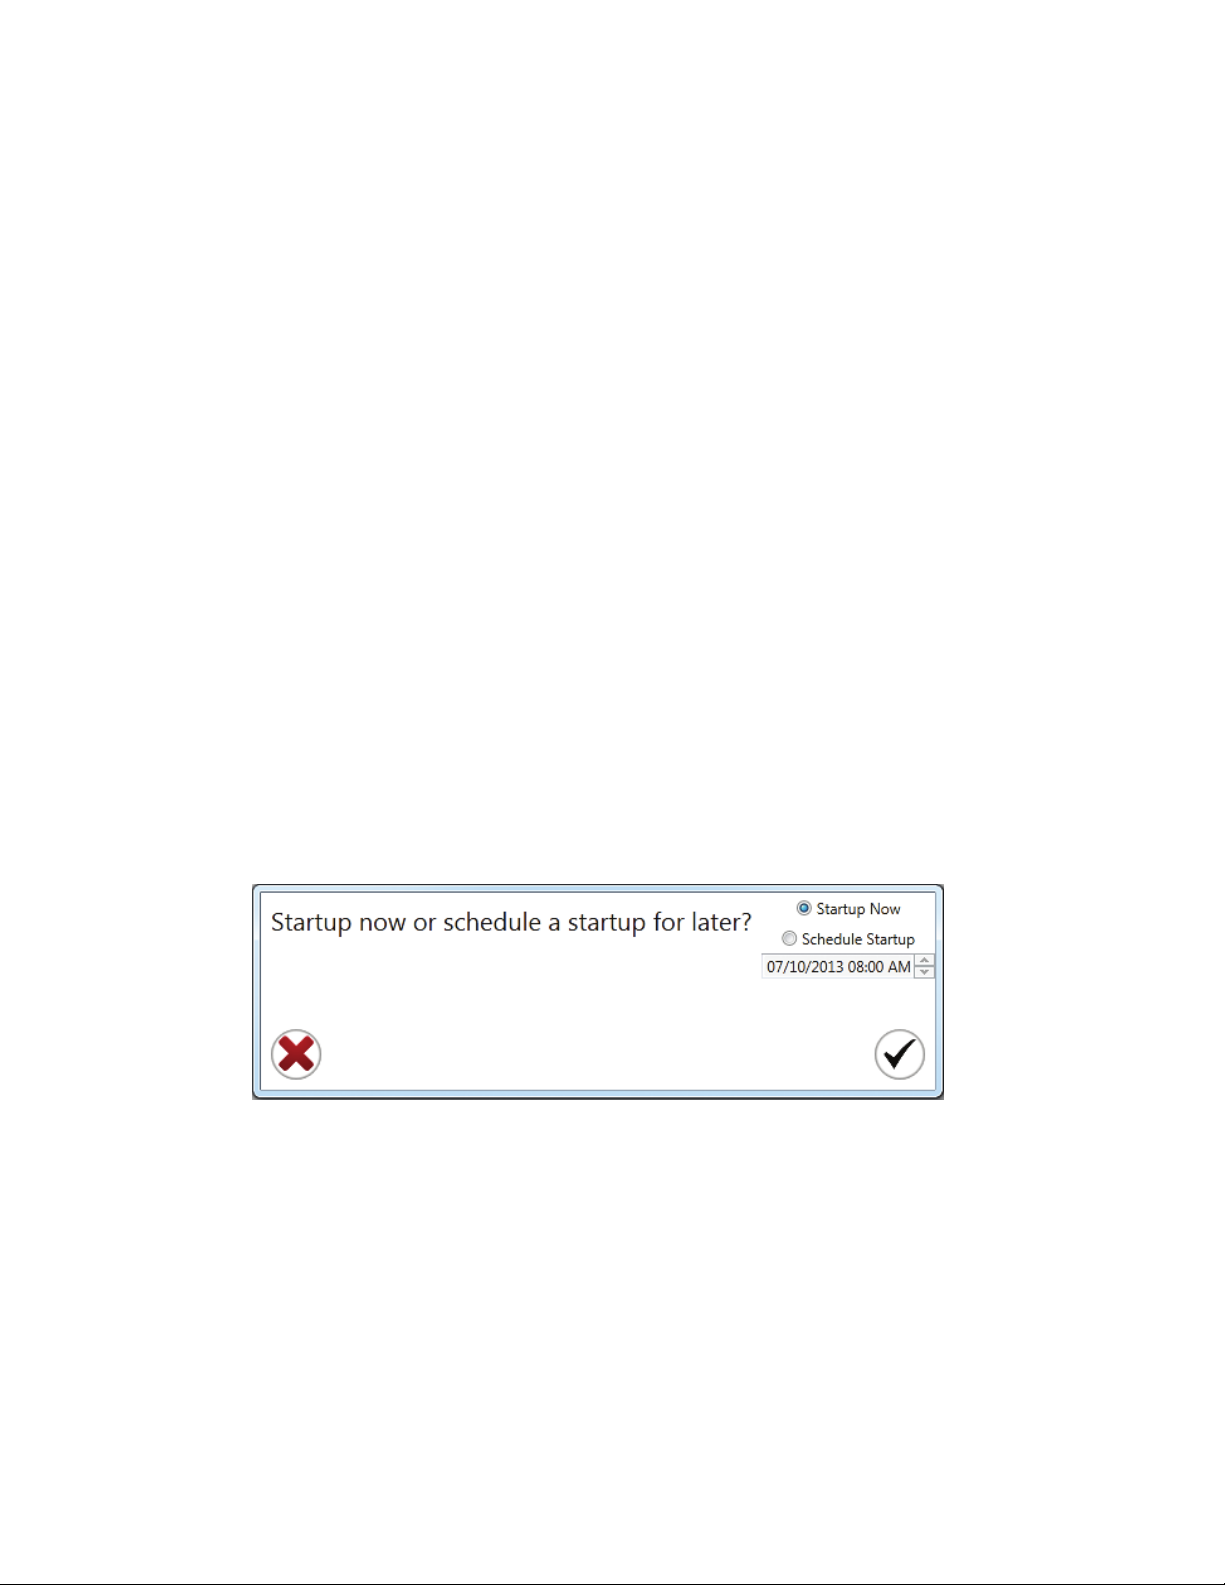
header
9
Automatic Startup
The ProSort™ can schedule an automatic startup of the system. Upon automatic start up, the
system will verify the stream is coarsely aligned and no clogs are present. If these conditions are
not met, the stream will be shut off automatically to avoid spraying or flooding. A warning will
appear and the system may be manually started to resolve the issue.
9.1 Scheduling an Automatic Startup
There are three ways to schedule an automatic startup.
1. Using the Startup button (provided no scheduled startup has been set). Please refer to
Section 4.3, Daily Startup.
2. During the shutdown procedure. Please refer to Section 8.1, Daily Shutdown.
3. During the decontamination procedure. Please refer to Section 10.7, Decontamination.
Fig. 94. Startup settings.
Instruction Manual | 83
Page 94
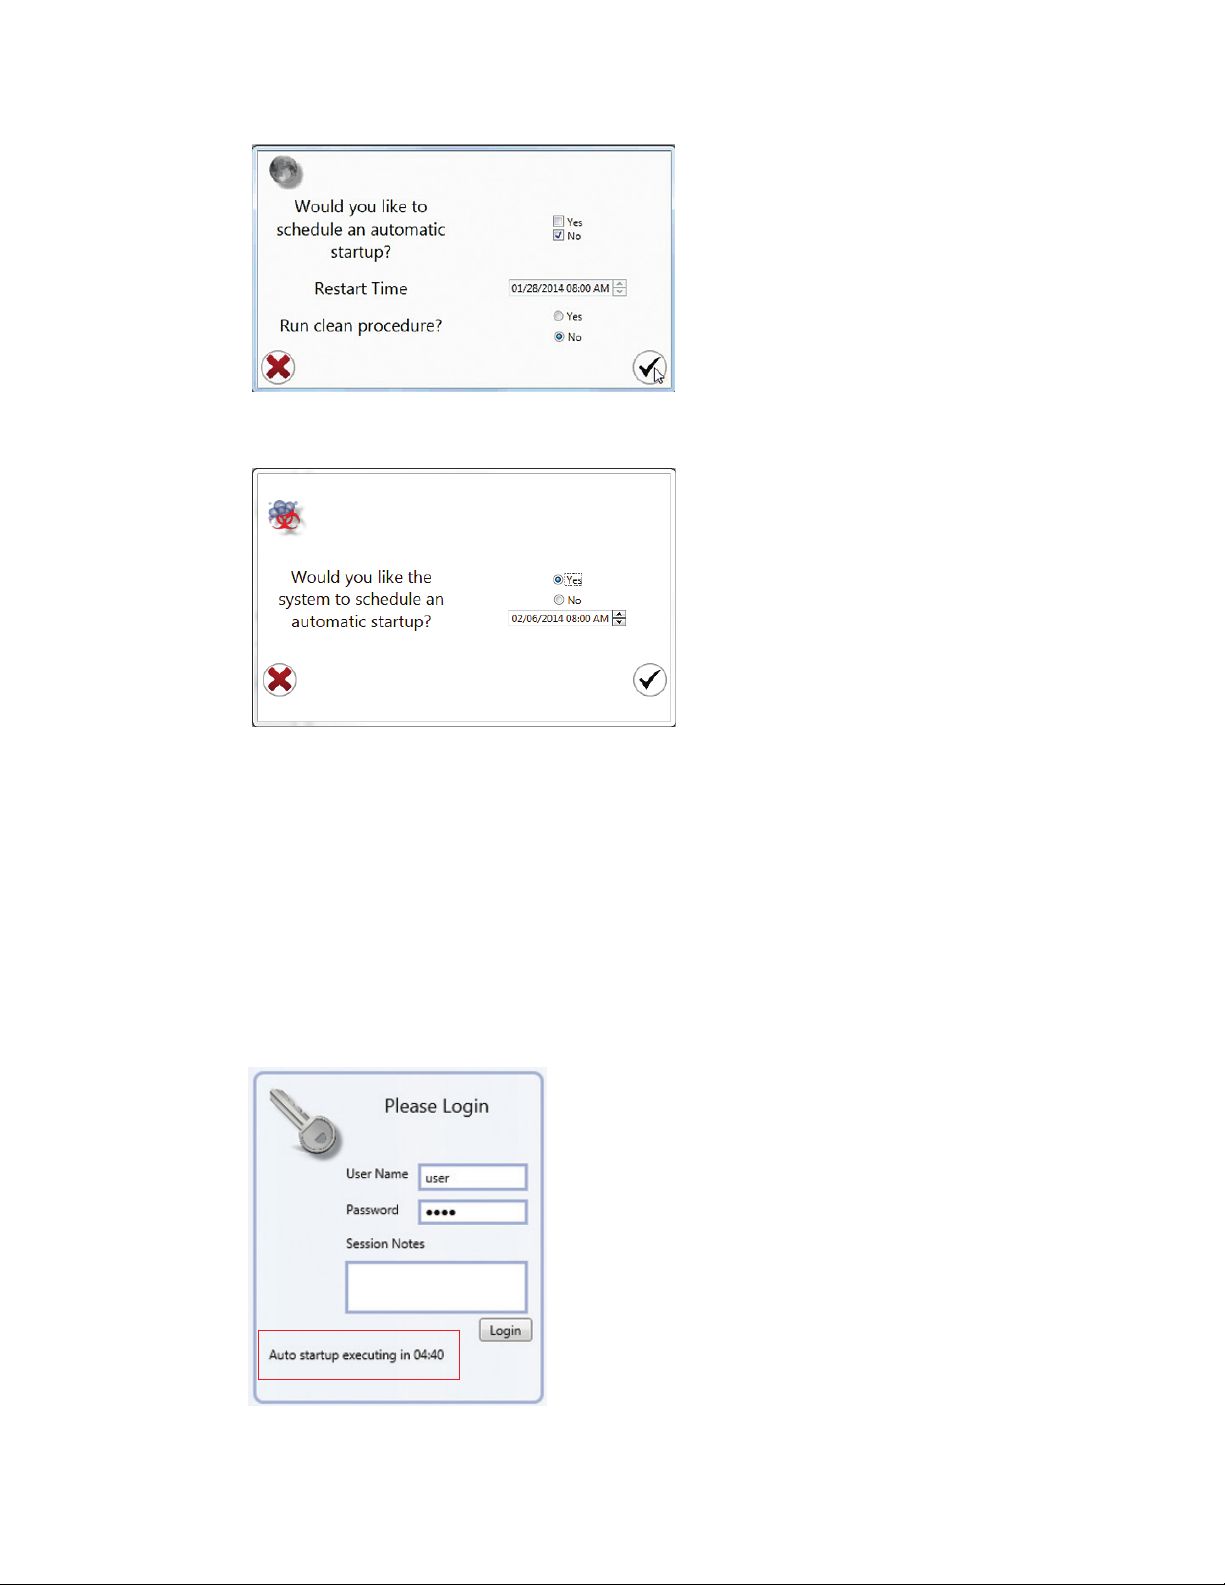
Automatic Startup
Fig. 95. Automatic Restart window during the shutdown procedure.
Fig. 96. Automatic restart window during the decontamination procedure.
9.2 Previously Scheduled Automatic Startups
After double clicking the ProSort Software icon on the desktop, a login window will appear. If
a previous user has scheduled an automatic startup of the system, a countdown will appear
at the bottom of the login window (Figure 97). This countdown indicates how much time is left
before the startup procedure will begin.
Note: The software must be opened to the login screen for the auto startup to occur.
Fig. 97. User login window with auto startup countdown.
84 | S3 and S3e Cell Sorters
Page 95
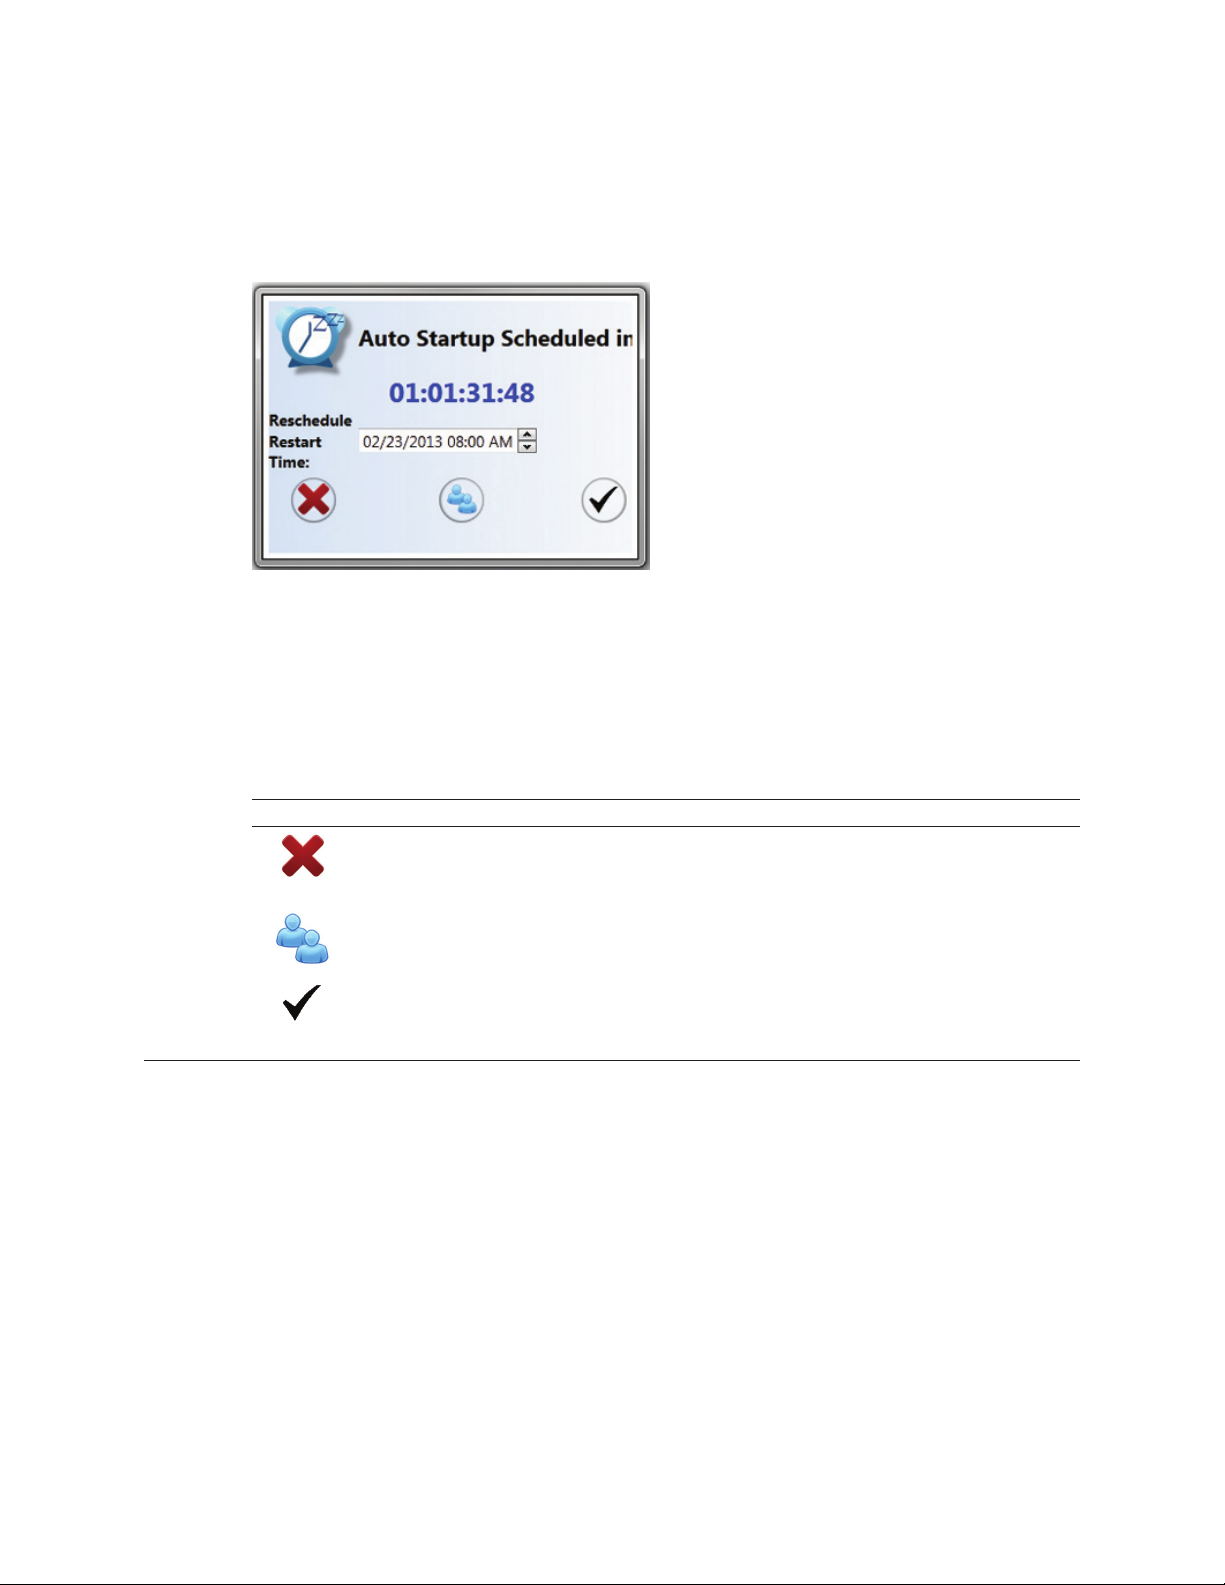
9.2 Previously Scheduled Automatic Startups
When a user logs onto the system and an automatic startup time is designated, the software
will display the Auto Startup Scheduled window (Figure 98).
There are three options that can be performed at this time. These options determine whether
the automatic startup will proceed as scheduled or be canceled.
Fig. 98. Auto Startup Scheduled window.
WARNING! Canceling a previously scheduled automatic startup may influence other users’
plans. Be sure to check with others when choosing this option.
Table 28. Auto star tup buttons.
Button Command Function
Cancel Cancels the previously scheduled automatic startup. A message will
appear in the login screen indicating that a user has cancelled the
automatic starup
Accept and Logs current user out of system and continues with scheduled
sign out automatic startup
Allow auto startup Keeps scheduled automatic startup time but allows the user to start
up the system and run experiments in the meantime. The user can also
alter the startup time
Instruction Manual | 85
Page 96

86 | S3 and S3e Cell Sorters
Page 97

10
Maintenance
Always follow the PPE guidelines relevant to your laboratory’s safety procedures for dealing
with the chemicals recommended below.
10.1 General Maintenance
10.1.1 Daily
It is recommended that the sample line is cleaned every day prior to shutdown. See Section
10.6, Disinfectants, for details regarding approved cleaners for this tubing.
The system must be shut down through the software on a daily basis. If the system is not shut
down properly, it may be prone to software-instrument communication problems, and the
sample lines, nozzle, and fluidics may be prone to contamination.
If using the automated startup option, be sure to clear the waste and fill the fluidics at the end
of use to ensure no errors will occur.
10.1.2 Weekly
Each week, wipe down the system with a mild disinfectant. Clean any salt crystal buildup in
the sort chamber or on the deflection plates.
Inspect the camera windows for any debris or salt. Clean them with a swab and mild
disinfectant as needed.
10.1. 3 Ye a r l y
It is recommended to purchase the annual preventative maintenance (PM) plan offered with
the S3™ and S3e™ Cell Sorter. The PM includes but is not limited to an annual onsite visit by a
service engineer to:
n
Replace the inline sheath filter
n
Replace the inline DI filter
n
Replace the bulk fluid filters in the
n
Replace the air pump filter
n
Replace the inline filters
sheath and DI bottles
n
Replace the rinse filters
n
Clean the optical filters
n
Replace the nozzle assembly
n
Examine tubing and connectors
n
Perform system check
n
Verify and adjust optical alignment
Instruction Manual | 87
Page 98

Maintenance
10.2 Dealing with Clogs
A clogged or partially clogged nozzle tip can occur while analyzing or sorting and it is usually
a result of an unfiltered sample delivering clumps of cells to the tip. When this happens, the
stream will be unable to spray straight or will be blocked completely. Several things can be
done to remove this clog. These options, in order of severity are listed below. Once complete,
click the startup button and allow the system to verify that the clog has been removed.
10.2.1 Unclog Option in Software
A clog can easily be introduced and can cause multiple issues with the fluidics. Resuspend
cells into a single cell suspension and always use a 40 µm or smaller filter prior to cell sorting
to help avoid clogs. If a clog does occur, use the Unclog button on the Setup and Maintenance
tab toolbar as a first-line action. The S3 and S3e Cell Sorters have the ability to backflush the
nozzle, potentially releasing the clog and flushing it into the waste.
If successful, a couple of debubble cycles are required to remove any air that may have been
pulled into the nozzle body.
If unsuccessful, see Section 10.2.2, Run Sample of Cleaner, or Section 10.4, Swap Nozzle
Tip Wizard.
10.2.2 Run Sample of Cleaner
Running a sample with 70% ethanol or 10% sodium hypochlorite could help free the clog. This
is run through the sample input station. Cleaning solution can dislodge or loosen clogs to free
up the line or the nozzle tip.
If successful, run at least two rinse cycles prior to running any test samples.
If unsuccessful, swap nozzle tip (Section 10.4).
10.3 Cleaning or Replacing Nozzle Tip
The nozzle is the main fluidics component of the system and provides stable sheath flow,
focused sample introduction, and droplet creation and charging. The nozzle tip is fixed at
a 100 µm tip orifice that provides centered sheath stream for laser interrogation. The tip may
be removed to clean or to remove a clog. The nozzle can be accessed through the top, front
sliding cover.
Note: The cover is interlocked and lasers will be turned off if it is opened.
Note: When performing any of the following instructions, use the Swap Nozzle Tip button to
open the wizard, which will assist in swapping or cleaning the tip. The wizard will also walk
through restarting and aligning the system.
88 | S3 and S3e Cell Sorters
Page 99

10.4 Swap Nozzle Tip Wizard
The Swap Tip wizard will walk through each step necessary to perform a successful nozzle tip
swap. Read through the wizard windows carefully and follow instructions on each screen as you
proceed with the protocol.
Clear an area around the instrument to have adequate working space. At times, adjustment to
the nozzle stage is necessary. Handle the nozzle with clean gloves.
First, determine which nozzle system is installed in your cell sorter (Table 29).
Table 29. Cell sorter and nozzle systems.
Catalog # Cell Sorter Nozzle System Proceed to Section
145-1001, 145-1002 S3 Cell Sorter Agilis 10.4.1
145-1001, 145-1002 S3 Cell Sorter (upgraded
with AutoGimbal
145-1005, 145-1006, 145-1008 S3e Cell Sorter AutoGimbal 10.4.2
10.4.1 Nozzle Tip Wizard with the Agilis System
The Agilis system uses two axis-motorized positioners that are controlled by the software.
These piezo-driven micromotors help align the stream to the pinhole and to the collinear lasers.
In addition, there are three gimbaling screws that are used to make manual adjustments to the
nozzle stage for nozzle height in relation to the pinhole and to the streams laser.
™
feature)
10.4 Swap Nozzle Tip Wizard
AutoGimbal 10.4.2
The nozzle tip must still be removed, cleaned, and reseated manually prior to alignment. The
stream must be hitting the waste hole to ensure successful results.
To swap the nozzle tip:
1. On the Setup and Maintenance tab select Swap Tip. The Swap Nozzle Tip wizard will open
(Figure 99). Follow the instructions indicated by the wizard.
2. Open the nozzle chamber door.
3. Press on the left side of the black metal light protection device and lift out of the way.
4. Locate the thumb screw hinge.
5. Loosen the thumbscrew until the nozzle body rises up and the tip can be seen.
6. Click the blue arrow.
Fig. 99. Nozzle swap wizard window.
Instruction Manual | 89
Page 100
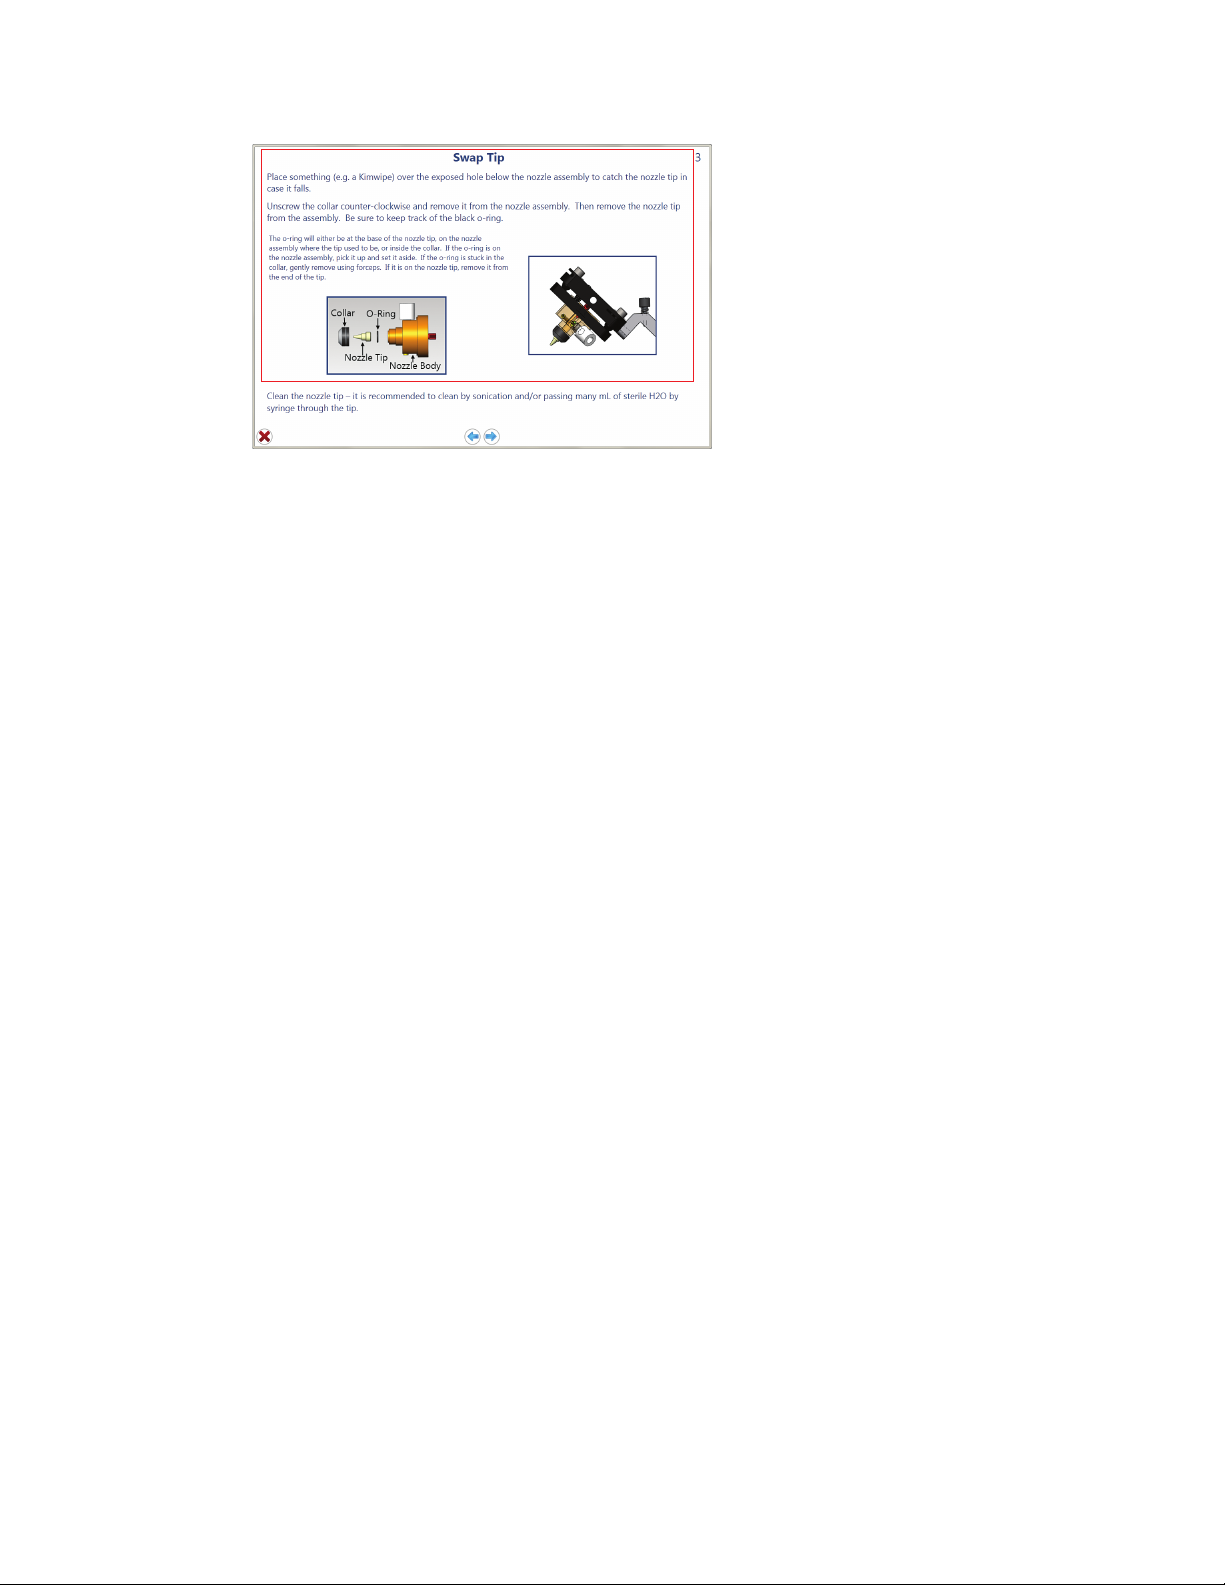
Maintenance
Fig. 100. Nozzle swap wizard window.
7. Place a lint-free cloth in the nozzle chamber under the nozzle tip to prevent dropping the
nozzle into the instrument.
8. Rotate the black collar holding in the nozzle until it comes loose.
Note: There is a small O-ring that will be removed as well.
9. Pull out the small white nozzle tip.
If sonication is desired or necessary:
10. Place the tip into a tube containing DI water.
11. Cap the tube.
12. Place the tube into a sonicator for several minutes.
13. Proceed to step 14.
If sonication of the tip is not performed:
10. Using a 1 ml syringe filled with ethanol, press against the top and eject ethanol through the
nozzle tip, rotating between the 100 µm tip and the larger opposite end to free clog.
11. Watch the resulting stream. The fluidic stream should be coming out straight from the tip.
12. Repeat if necessary until the stream is coming out straight.
13. Proceed to step 14.
14. Place the O-ring at the point on the nozzle where the bottom of the black collar will be.
15. Place the nozzle tip back onto the nozzle assembly by pushing it up using the sides of the
tip. Avoid touching the end.
16. Secure the black retaining collar until finger tight.
17. Remove the lint-free cloth from nozzle chamber.
18. Press the stage back down and tighten the thumb screw.
19. Click the blue forward arrow.
90 | S3 and S3e Cell Sorters
 Loading...