

Test Equipment Depot - 800.517.8431 - 5 Commonwealth Ave, MA 01801
TestEquipmentDepot.com
Operation Manual V1.0
NS1020


Thank you for purchasing the SmartDrop™ XF Nano Spectrophotometer. This
user manual details the instrument’s features, specifications, as well as complete
operating instructions; please read it carefully before operation. Keep this user
manual for later use.
Important:
Please keep the box and packaging material for this instrument. If service is
required, the box will be needed to ship the instrument to our Service
Department.
Initial Inspection
Please inspect the instrument as well as all included accessories when you first
open the packaging. If you find anything damaged or missing, please contact
Benchmark Scientific or your local distributor immediately.
Safety Warnings and Guidelines
1. Important information for safe use
Users should understand how to use this instrument before operating.
Please read this manual carefully prior to operation.
Any improper operation may cause injury. Please read this
manual carefully and operate safely according to the guidelines.
2. Operation and Maintenance
The operation and maintenance of the instrument should comply with the basic
guidelines and warnings below. Incorrect operation or maintenance will have
detrimental effects on the life, performance, and safety features of the instrument.
The instrument is a normal indoor instrument which conforms to
classⅠof the GB 4793.1 standard.
This instrument is designed for use in a laboratory
environment. The device must be operated by skilled
laboratory personnel with appropriate training.
To prevent injury or voiding the warranty, the operator should not
attempt to repair the instrument without explicit guidance from
Accuris Instruments. If service is required, please contact Accuris
Instruments or your local distributor for repair.
Before powering on, confirm that the voltage used meets the
electrical requirements of the instrument as stated on the rating
plate. If the electric cord is damaged, replace it with the same type
of cord. Hold the socket firmly before pulling the plug from an outlet.
Do not pull the electric cord.
The instrument should be installed in an environment of standard
room temperature, low dust, low humidity, and away from direct
sunlight, electromagnetic interference, and heat sources. Do not
block the vents on the instrument.

Always power off the instrument when you are finished using it.
Unplug the power cord and cover the instrument with a cloth or
plastic sheet to prevent excessive dust from entering the housing.
Pull the connector plug from the electrical outlet immediately and
contact the vendor in the event of:
• Liquid entering the housing.
• Abnormal operation: such as any abnormal sound or
smell.
• The instrument is dropped or there is any damage to the
housing.
• Any malfunction.
3. Maintenance
The pedestal should be cleaned regularly using a soft cloth dampened with
deionized water. The instrument housing should be cleaned regularly using a soft
cloth dampened with a small amount of alcohol.

Table of Contents
Chapter 1 Introduction ....................................................................................... 1
1.Key Features ............................................................................................... 1
Chapter 2 Specifications .................................................................................... 2
1.Required Installation Environment ............................................................... 2
2.Specifications............................................................................................... 2
Chapter 3 Instrument Overview ......................................................................... 4
1.Structure ...................................................................................................... 4
2.Sample Size Requirements ......................................................................... 5
3.Dispensing Samples onto The Lower Pedestal ........................................... 5
4.OD600 Measurement .................................................................................. 6
Chapter 4 Programming & Operation ................................................................ 7
1.Start-up Interface ......................................................................................... 7
2.Main Menu Interface .................................................................................... 7
3.Nucleic Acids Interface ................................................................................ 8
4.Protein A280 Interface ............................................................................... 13
5.Colorimetry Interface ................................................................................. 17
6.Fluorometer Interface ................................................................................ 21
7.UV-Vis Interface ......................................................................................... 28
8.OD600 Interface ........................................................................................ 30
9.System Settings Interface .......................................................................... 32
Chapter 5 Troubleshooting .............................................................................. 34

Chapter 1 Introduction
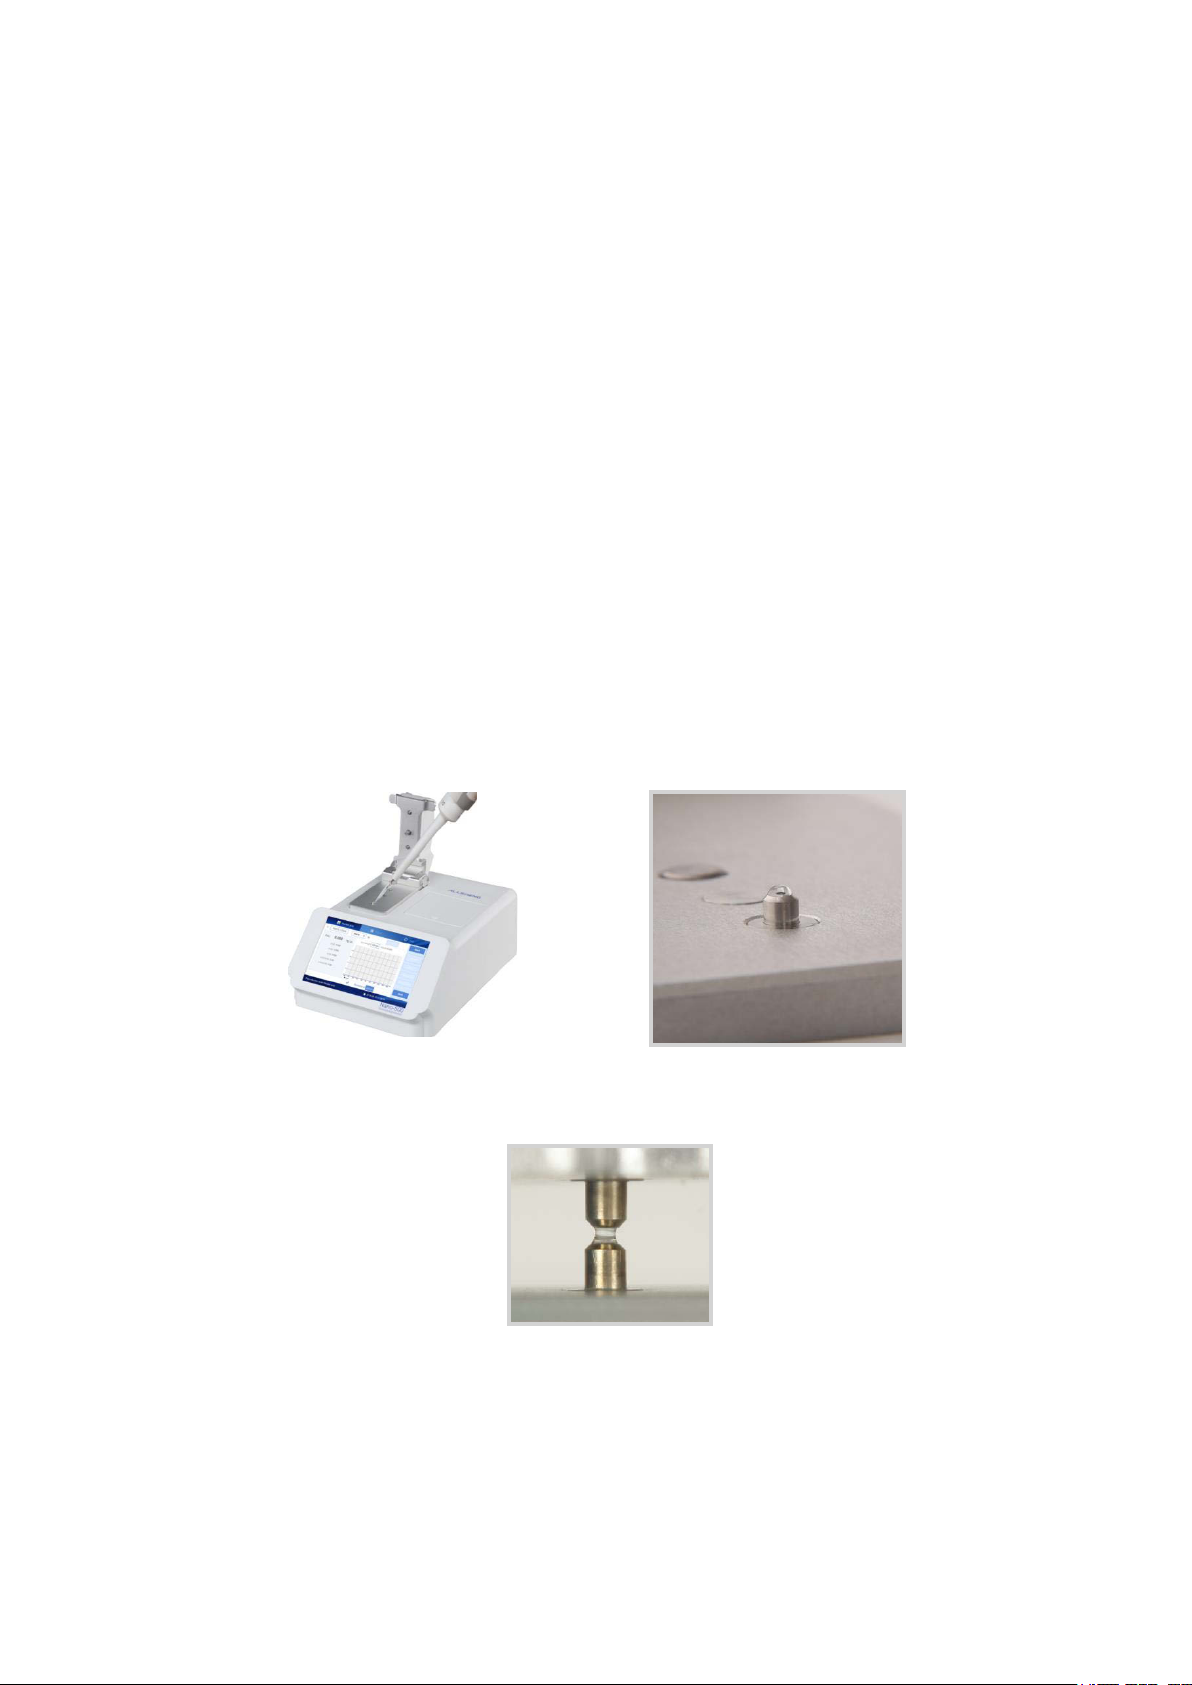
The SmartDrop™ XF nano spectrophotometer measures 0.5µL – 2.0µL samples with
high accuracy and reproducibility. This full spectrum (200nm – 800nm)
spectrophotometer employs surface tension to position the sample for measurement.
The system includes a cuvette slot for OD600 readings & a built-in printer for printing
results. The SmartDrop XF can measure highly concentrated samples without dilution
(100X concentration of samples measured by a standard cuvette spectrophotometer).
1. Key Features
➢ User-Friendly Input & Operation – Touch screen for programming and operation (a
mouse can also be connected).
➢ Multifunctional software for Nucleic Acids, Protein A280, Colorimetry, Fluorometer,
UV-Vis & OD600 measurements.
➢ dsDNA detection range from 2ng/µL – 15,000ng/µL.
➢ Fast & accurate measurements (< 6 seconds, ± 1%).
➢ 2 cuvettes included (optical glass) for OD600 measurements.
1
Model
SmartDrop™ XF (NS1020)
Minimum Sample Size
0.5μL - 2μL
Path Length
0.05 mm, 0.2 mm, 1.0 mm
Light Source / Life
Xenon flash lamp / >109 flashes
Detector Type
2048 element linear silicon CCD array
Wavelength Range
200nm - 800nm
Wavelength Accuracy
± 1 nm
Spectral Resolution
≤ 3nm(FWHM@Hg 253.7nm)
Absorbance Precision
0.003Abs(1mm path length)
Absorbance Accuracy
± 1%(7.332Abs, at 260nm wavelength)
Absorbance Range
0.04 — 300(at 260 wavelength, 10mm equivalent)
Detection
Concentration Range
2ng/μL dsDNA - 15,000ng/μL dsDNA
Detection Time
< 6 seconds
OD600
Abs range
0~4.000 Abs
Abs stability
[0,3)≤0.5% [3,4)≤2%
Abs
repeatability
[0,3)≤0.5%, [3,4)≤2%
Abs Precision
[0,2)≤0.005A, [2,3)≤1%,[3,4)≤2%
Fluorometer
Linearity
R² ≥ 0.995
Repeata
bility
≤ 1.5%
Stability
≤ 1.5%
Chapter 2 Specifications
1. Required Installation Environment
Environmental Temperature: 5°C~35°C
Relative Humidity: ≤ 70%
Input Voltage: DC 24V, 2A ( Adapter CSA, UL, CE marked)
2. Specifications
2

Voltage input
DC 24V, 2A
Power
25W
Dimensions(W×D×H)
20.8cm × 32.0cm ×18.6cm / 8.2in x 12.6in x 7.3in
Weight
3.6 kg / 7.9 lbs
3
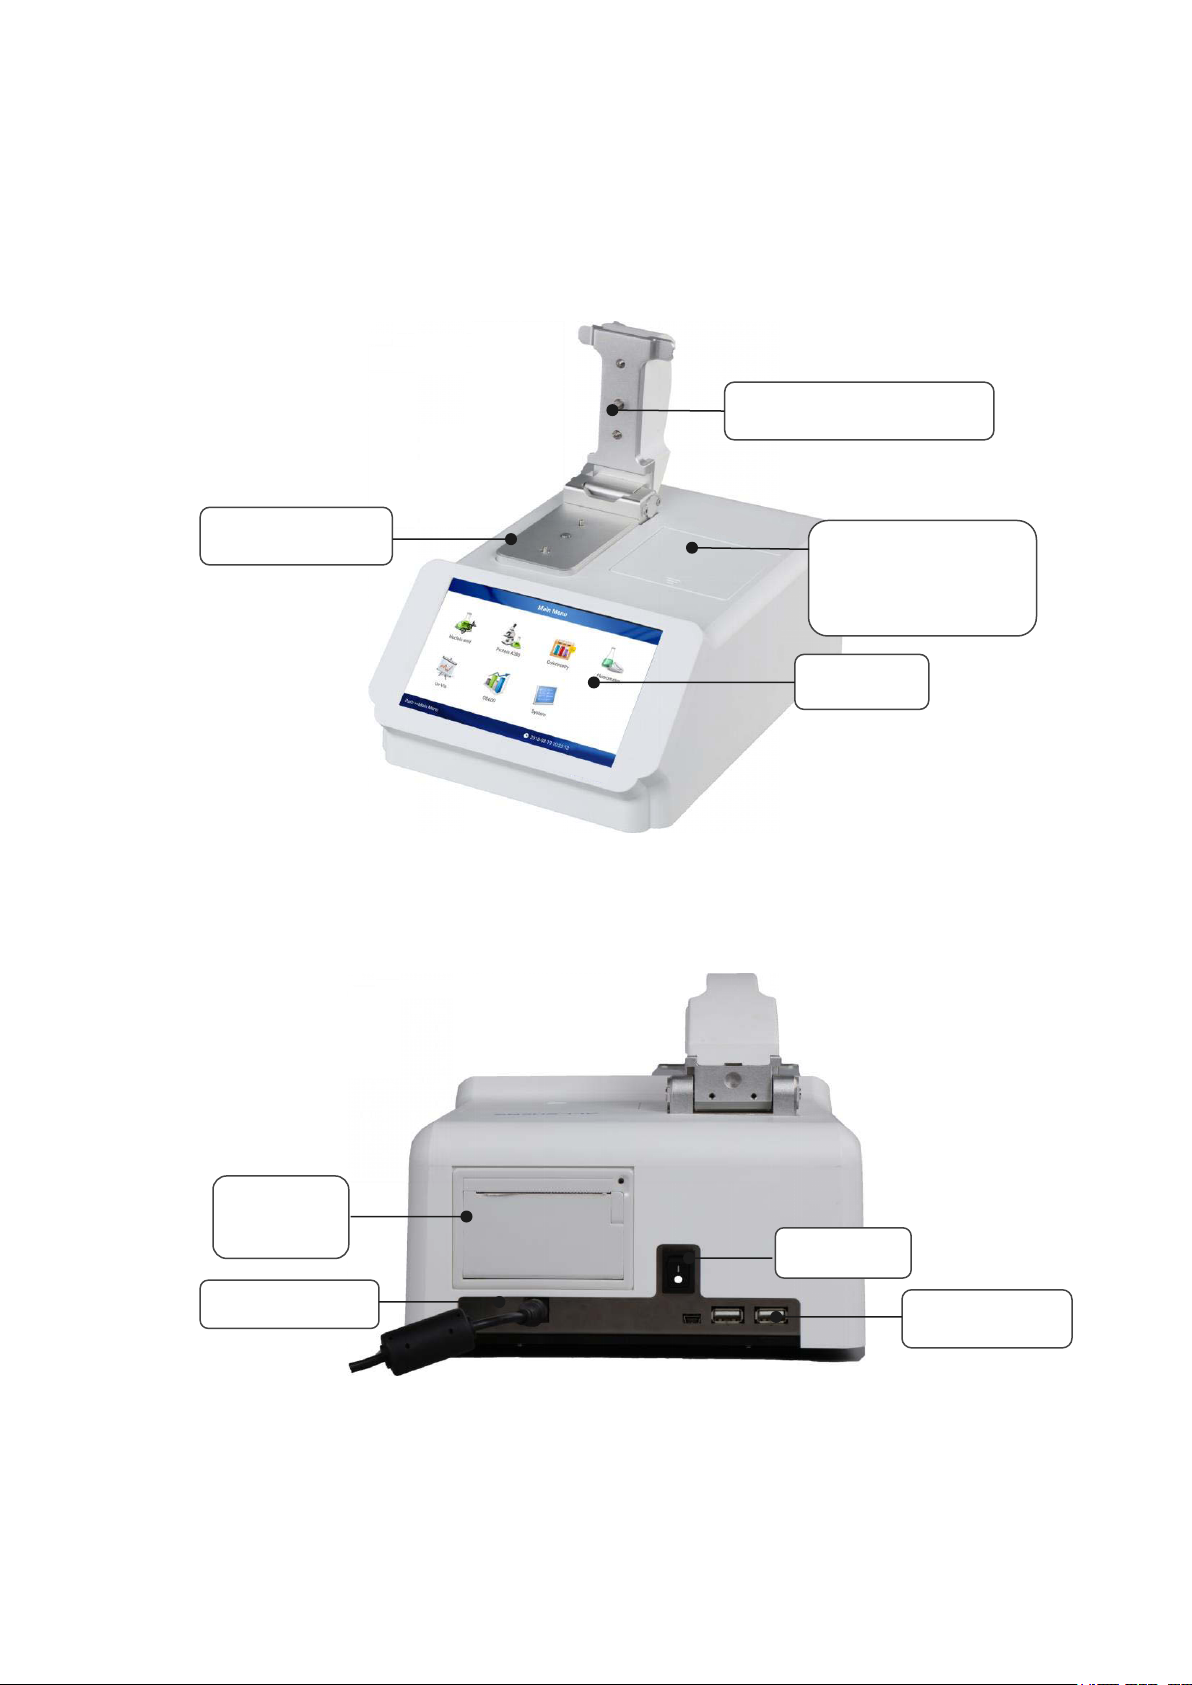
USB ports
Switch
Power Socket
Upper pedestal
Display
OD600 &
Fluorometer
chamber
Lower pedestal
Built-in
printer
1. Structure
Front
Chapter 3 Instrument Overview
Back
Fig. 1 Front
Fig. 2 Back
4
2. Sample Size Requirements
Surface tension is a critical factor in the formation of the sample column for
measurement. The hydrophobic interactions between water molecules in a sample
solution is key in creating & maintaining surface tension. The presence of solutes
(proteins, DNA, RNA, salt ions, detergent molecules) significantly reduces surface
tension and hinders the formation of the sample column. For most samples, a 1μL
sample size is enough; however, to ensure accurate and precise measurements, a 2μL
sample size is recommended to allow the formation of the sample column for
measurement.
To ensure precise and accurate measurements, it is essential that a complete liquid
column forms between the upper pedestal and lower pedestal. It is recommended that
a precision pipettor (0-2μL) be used to dispense samples.
3. Dispensing Samples onto The Lower Pedestal
Lift the upper pedestal and pipette the sample (0.5µL – 2.0μL) onto the lower
pedestal (Fig. 3).
Fig. 3 Dispense Sample Fig. 4 Sample Drop
Lower the upper pedestal onto the sample to form the sample column (Fig. 5).
Fig. 5 Sample Column
Note: Please exercise caution when lowering the upper pedestal onto the sample.
5
Frosted
Transparent
surface
To prevent sample carryover, use a soft laboratory wipe and deionized water to clean
both pedestals in between sample measurements (Fig. 6).
Fig. 6 Clean & Wipe Pedestal
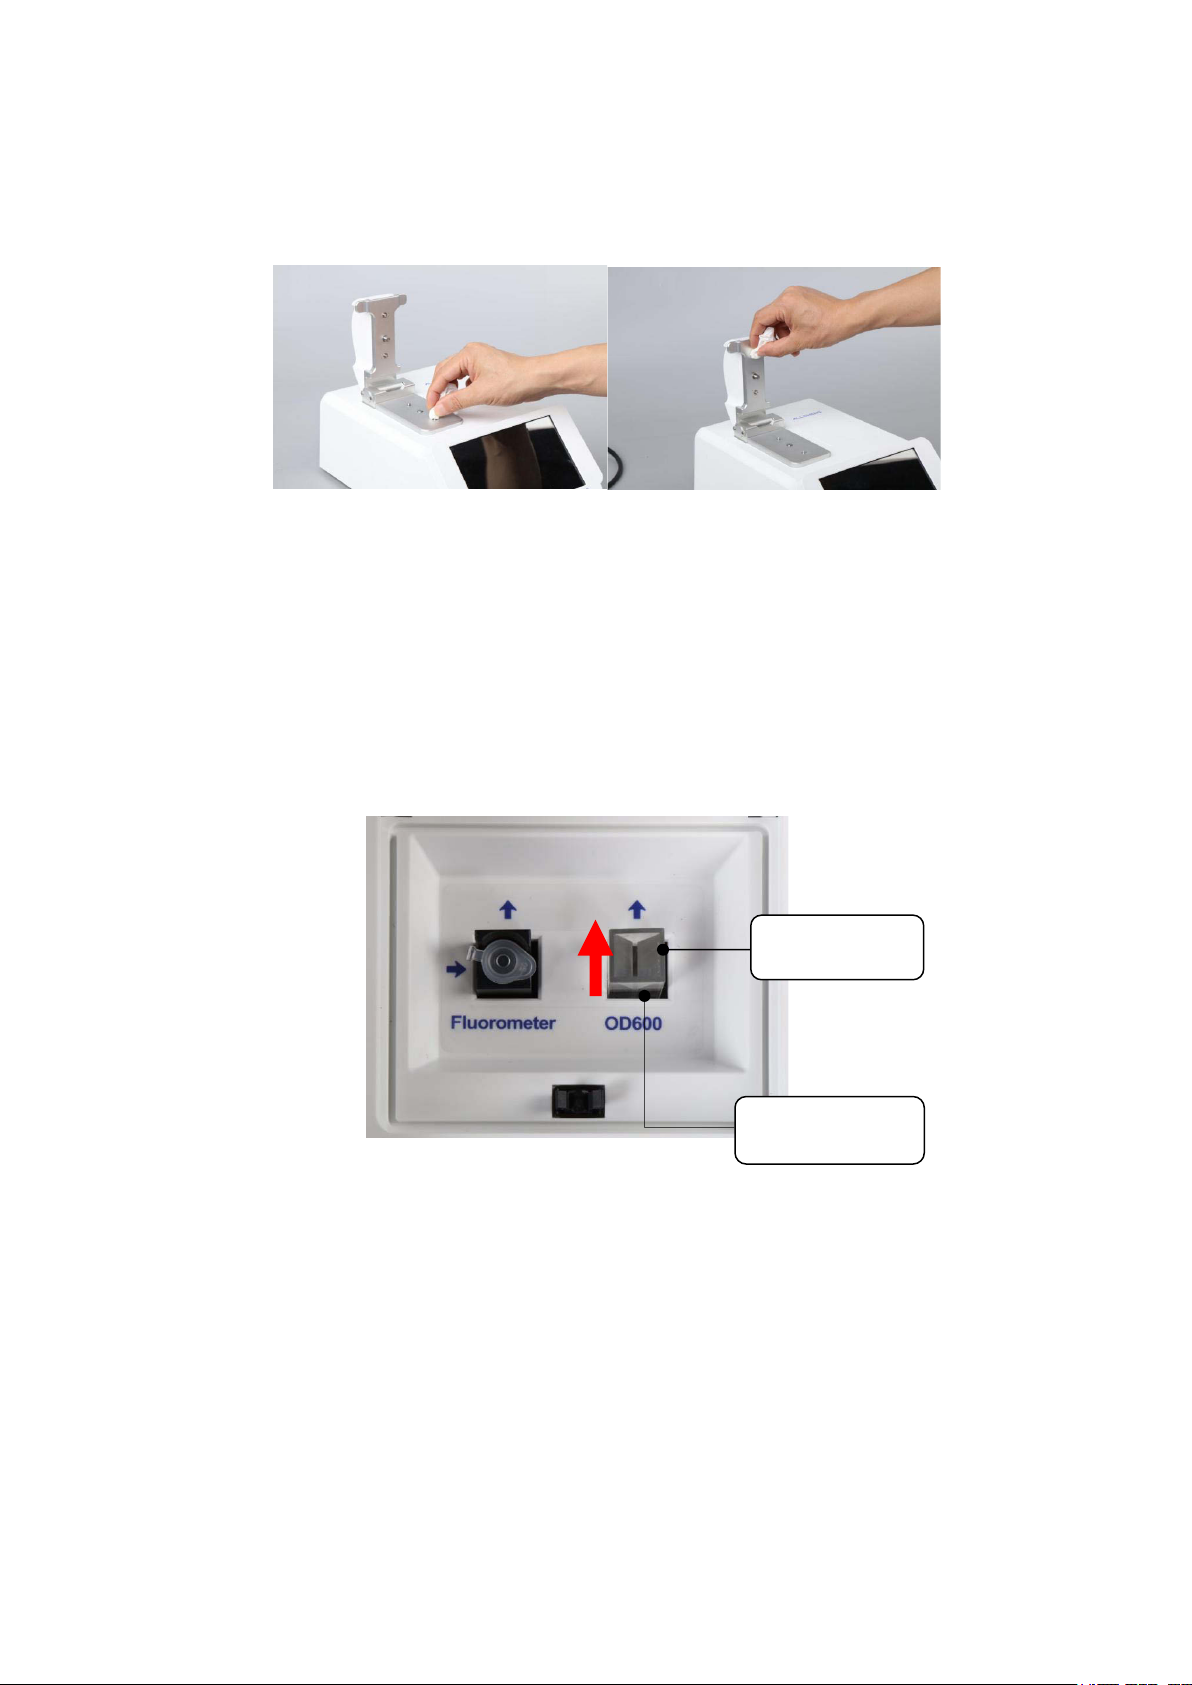
4. OD600 Measurement
The SmartDrop XF includes a cuvette slot for OD600 measurements. Lift the upper
pedestal to expose the cuvette slot. Select the OD600 interface on the touch screen.
Set a “blank” as required for the experiment (blank = air, empty cuvette, or buffer in
cuvette). Then add 2~3mL of sample into the cuvette. Place the cuvette into the slot
and start the measurement (Fig. 7).
Fig. 7 OD600 & Fluorometer Port
Note:The direction of the light path is shown by the red arrow in the figure above.
Please ensure the cuvette is loaded with the correct orientation.
6

Fig. 8 Start-up Interface
Fig. 9 Main Menu Interface
Chapter 4 Programming & Operation
1. Start-up Interface
Upon powering on the instrument, it will perform a self-check, and the start-up screen
will be displayed (Fig. 8)
2. Main Menu Interface
After start-up, the main menu interface will be displayed. There are 7 options: Nucleic
Acids, Protein A280, Colorimetry, Fluorometer UV-Vis, OD600, & System Settings
7

Fig. 10 Nucleic Acids Interface
3. Nucleic Acids Interface
Beer-Lambert’s Law for DNA/RNA quantitation
The following “Beer-Lambert” equation is used to calculate the concentration of
nucleic acids:
𝐴 ∗ 𝜀
𝐶 =
C=Sample DNA concentration, unit : ng/μL
A=Sample absorbance, unit : A
ε=extinction coefficient, unit: ng-cm/μL
b=Path Length, unit: cm
Standard DNA/RNA extinction coefficients :
dsDNA:50ng-cm/μL
ssDNA:33ng-cm/μL
RNA:40ng-cm/μL
When the sample column is used, highly concentrated nucleic acid samples can be
measured without dilution using a 1.0mm, 0.2mm, or 0.05mm path length. The
SmartDrop XF will measure and display sample absorbance values of the 10mm
pathlength equivalent of up to 300 A.
𝑏
The SmartDrop XF will accurately measure dsDNA samples up to 15,000ng/μL
without dilution. To do this, the instrument automatically detects highly concentrated
samples and adjusts the pathlength to measure the sample absorbance.
Select “Nucleic acid” from the main menu to enter the Nucleic Acids Interface:
Fig 10; there are three tabs in the Nucleic Acids Interface: Nucleic Acids, Report, and
Help.
8

• : The sample ID name has a default value of the current
date and time. Users can rename the sample ID. One sample ID can contain
up to 1000 measurement values.
• : Select the sample type: DNA-50 for dsDNA, RNA-40 for RNA,
ssDNA-33 for ssDNA. For a different nucleic acid type, select “others” and enter
the extinction coefficient.
• : Perform a blank reading. This step is essential before
measurement. Blank absorbance values are typically in the range of 0.004-0.03
Abs and are valid for up to 30 minutes. The instrument will automatically remind
the user to perform another blank reading after 30 minutes.
• : Spectrum normalization; The baseline is
automatically set to the absorbance of the sample at 340nm and can be
modified. This feature can remove spectroscopic signals from sample
measurements by subtracting the measured absorbance at a specified baseline
correction wavelength from the absorbance values at all wavelengths of a
measured sample.
o Note: If baseline calibration is not performed, the spectroscopic signals
will not be separated from interference/background effects and will lead
to inaccurate results.
• : When turned on, the blank measurement starts automatically
when the upper pedestal is lowered.
o Note: The automatic blank only takes effect when no blank readings
have been made in a current run.
• : When turned on, the sample measurement starts
automatically when the upper pedestal is lowered.
o Note: Automatic sample detection only takes effect after a blank reading
has been performed.
• The icon appears in the upper right corner to indicate an error in reading
blank/sample volumes. Please clean and wipe the pedestal and perform
another blank reading. If the problem persists, contact Accuris Instruments.
9

Operation:
1. Set the Sample ID.
2. Clean the upper and lower pedestals with a lint-free wipe, add 2μL buffer
solution to perform a blank reading.
3. Clean the buffer solution on the pedestals with a wipe.
4. Measure a 2μL sample volume and click “Measure” to detect the sample.
Note: A blank reading must be performed prior to sample measurements. The
sample volume must be equivalent to the volume used to set the blank
reading.
5. Clean and dry the pedestal between measurements.
Fig. 11 Nucleic Acid Sample Results
The sample concentration and absorbance ratios will display on the left side of the
interface (Fig. 12).
Fig. 12 Sample Concentration & Absorbance Ratios
Conc.:Calculated nucleic acid concentration.
A260: The sample absorbance at 260nm (10mm pathlength equivalent).
A280: The sample absorbance at 280nm (10mm pathlength equivalent).
A230: The sample absorbance at 230nm (10mm pathlength equivalent).
A260/A280: The ratio of corrected absorbance values at 260nm to corrected
absorbance values at 280nm. An A260/A280 ratio of ~1.8 is generally accepted as
pure for DNA (~2.0 for RNA). Acidic solutions will under-represent the A260/A280
ratio by 0.2 – 0.3 units, whereas basic solutions will over-represent the A260/280
ratio by 0.2 – 0.3 units.
10

A260/A230:The ratio of corrected absorbance values at 260nm to the corrected
absorbance values at 230nm.This ratio can be used as a secondary measure of
nucleic acid purity. An A260/A230 ratio within the range of ~1.8 – 2.2 is considered
as pure for nucleic acids. Lower ratio values indicate the presence of contaminants
that absorb strongly at or near 230nm.
: Input a wavelength to view the corresponding
sample absorbance value (Fig. 13).
Fig. 13 Nucleic Acid Sample Absorbance Curve
(220nm – 350nm)
:Export the graph (PNG file) and full spectrum absorbance data (1nm
steps) to a USB flash drive.
: Begin sample measurement.
: Print the calculated data.
: Save the full spectrum absorbance data in 1nm steps.
: Zoom into the sample absorbance curve.
: Return to the main menu interface.
11

Nucleic Acid Report Interface
Fig. 14 Nucleic Acid Report Interface
Select the “Report” tab at the top of the Nucleic Acid Interface (Fig. 14).
Users can select previously saved results by the file name.
: Print the selected data from the built-in printer.
:.To view sample absorbances at a specific wavelength, input a
wavelength and the red coordinate line will display the corresponding
absorbance value (Fig. 15).
Fig. 15 Nucleic Acid Sample Absorbance Curve
(220 – 350nm).
: Export the result to a USB flash drive.
: Delete the selected results.
: Delete the selected files
Export : Export the selected files to a flash drive.
12

4. Protein A280 Interface
Introduction
The Protein A280 interface can be used to quantify purified proteins that contain amino
acids such as tryptophan, tyrosine, or cys-cys disulfide bonds. These amino acids
exhibit peak absorbance at 280nm. The following sample types can be selected:
“A280”, “BSA”, “IgG”, “Lysozyme”, & “Others”.
This interface does not require the generation of a standard curve. Sample absorbance
values (260nm & 280nm) and A260/A280 ratios can be measured and displayed. A
baseline correction can be used for normalization. Like the Nucleic Acids interface, the
Protein A280 interface automatically switches the pathlength to 0.2mm when a highly
concentrated protein sample is detected and displays 10mm pathlength equivalent
data.
Protein A280 Interface
Select “Protein A280” from the main menu interface.
Fig. 16 Protein A280 Interface
Fig. 16; There are three options at the top of the screen, Protein A280, Report, and
Help.
• : The sample ID name has a default value of the current
date and time. Users can rename the sample ID. One sample ID can contain
up to 1000 measurement values.
• : Select the sample type: A280, BSA, IgG, Lysozyme. Select
“others” and type in the extinction coefficient.
• : Perform a blank reading. This step is essential before
13

measurement. Blank absorbance values are typically in the range of 0.004-0.03
Abs and are valid for up to 30 minutes. The instrument will automatically remind
the user to perform another blank reading.
• : Spectrum normalization; The baseline is
automatically set to the absorbance of the sample at 340nm and can be
modified. This feature can remove spectroscopic signals from sample
measurements by subtracting the measured absorbance at a specified baseline
correction wavelength from the absorbance values at all wavelengths of a
measured sample.
Note: If baseline calibration is not performed, the spectroscopic signals will not
be separated from interference/background effects and will lead to inaccurate
results.
• : When turned on, the instrument will automatically perform a
blank detection the first time the pedestal is lifted and closed
Note: The automatic blank only takes effect when no blank readings have been
made in a current run.
• : When turned on, the instrument will automatically
perform sample measurements once the sample column has formed.
Note: Automatic sample detection only takes effect after a blank reading has
been performed.
• The icon appears in the upper right corner to indicate an error in reading
blank/sample volumes. Please clean and wipe the pedestal and perform
another blank reading. If the problem persists, contact Accuris Instruments.
Operation:
1. Set the Sample ID.
2. Clean the upper and lower pedestals with a lint-free wipe, add 2μL buffer
solution to perform a blank reading.
3. Clean the buffer solution on the pedestals with a wipe.
4. Measure a 2μL sample volume and click “Measure” to detect the sample.
Note: A blank reading must be performed prior to sample measurements. The
sample volume must be equivalent to the volume used to set the blank
reading.
5. Clean and dry the pedestal between measurements.
14

Fig. 17 Protein Sample Results
The sample concentration and absorbance ratios will display on the left side of the
interface (Fig. 18).
Fig. 18 Sample Concentration & Absorbance Ratios
Conc.: Calculated protein concentration.
A260: The sample absorbance under 260nm (10mm pathlength equivalent).
A280: The sample absorbance under 280nm (10mm pathlength equivalent).
A260/A280: The ratio of corrected absorbance values at 260nm to the corrected
absorbance values at 280nm.This ratio can be used as a secondary measure of
nucleic acid purity. An A260/A280 ratio within the range of ~1.8 – 2.2 as pure for
nucleic acids. Lower ratio values indicate the presence of contaminants that absorb
strongly at or near 280nm.
: Input a wavelength to view sample absorbance
values (Fig. 19).
15

Fig. 19 Protein Sample Absorbance Curve
Protein A280 Report Interface
(220nm – 350nm)
Fig. 20 Protein Report Interface
Note: This interface is similar to the Nucleic Acids detection interface (see section 3).
: To view sample absorbances at a specific wavelength, input a
wavelength and the red coordinate line will display the corresponding absorbance
value (Fig. 21).
Fig. 21 Protein Sample Absorbance Curve (220 – 350nm)
16

5. Colorimetry Interface
Introduction
BCA, Lowry, & Bradford protein assays are measured using colorimetric methods,
which requires the generation of a standard curve.
BCA Protein Assay:
The BCA Assay is an alternative method for determining protein concentration. It
utilizes bicinchoninic acid as a detection reagent to measure protein concentrations in
crude samples. This assay measures protein solutions at 562nm and uses a standard
curve to calculate the concentration. A baseline-correction can be used for
normalization. Bicinchoninic acid is used to detect Cu⁺¹, which forms when Cu⁺² is
exposed to an alkaline environment. A purple chelate is formed when two BCA
molecules react with 1 Cu⁺¹. The Cu-BCA chelate is measured at 562nm and baselinecorrected using a 750nm absorbance value.
Lowry Assay:
Folin-Ciocalteu is used as the detection reagent to measure protein concentrations in
unpurified protein samples. This assay measures the absorbance of protein solutions
at 650nm and uses a standard curve to calculate the concentration. A baselinecorrection can be used for normalization. When protein solutions are exposed to cupric
sulfate in an alkaline environment, tetradentate copper protein complexes form. FolinCiocalteu is reduced in proportion to the chelated copper-complexes which results in
the formation of a water-soluble blue product that is measured at 650nm and baselinecorrected using a 405nm absorbance value.
Bradford Assay:
The Bradford Assay is an alternative method commonly utilized for determining protein
concentration. It is often used for more dilute protein solutions where lower detection
sensitivity is needed. Like the BCA and Lowry Assays, the Bradford Assay requires a
standard curve before each run. The Bradford uses the protein-induced absorbance
shift of Coomassie Blue dye at 595nm to measure protein concentration. The bound
protein-dye complex is measured at 595nm and baseline-corrected using a 750nm
absorbance value.
Note: Please perform measurements quickly. Coomasie dye-dye & dye-protein
aggregates can form the longer it sits, which will result in fluctuations in absorbance
readings.
17

Colorimetry Interface
A standard curve must be generated prior to sample measurement.
Fig. 22 Colorimetry Interface
: Select the assay type: BCA-562, Bradford-595, Lowry-650.
: Select the curve.
Operation:
1. Set the colorimetry and curve type.
2. Ensure that the upper and lower pedestals have been wiped clean. Pipette
0.5µL-2μL of buffer solution to perform a blank reading.
3. Wipe the buffer solution off the pedestals with a laboratory wipe.
4. Measure a 0.5µL-2µL sample. Select “Sample” to perform the reading. The
sample volume must be equivalent to the volume used to set the blank
reading.
Note: A blank reading must be performed prior to sample measurements.
5. Clean and wipe the pedestals between each sample measurement.
Curve
To generate a standard curve, at least 5 standard sample concentrations are needed.
The concentration range of the standards should cover all unknown sample
concentrations.
18

Colorimetry Curve Interface:
Click the “Curve” tab to build a standard curve (Fig.23).
Fig. 23 Colorimetry Curve Interface
Standard Curve Generation:
Click . Input the curve name and click “Confirm”. The standard curve
table will display.
Fig. 24 Standard Curve Interface
Click to choose the unit for samples and to input the
concentration.
Select a standard sample and then click “Blank” to perform a blank reading. Then,
click “Measure” to measure the absorbance of the standard sample.
Each standard sample can be measured up to 5 times, and the average value can be
used to build the standard curve. Users can delete the standard sample values or
delete single values amongst the 5 measurements of an individual sample.
After measuring all standards, click to save the curve.
Note: Please save the curve it prior to further operation.
19

: View the standard curve as below:
Fig. 25 Standard Curve
: Import a standard curve from a USB flash drive.
: Export a standard curve to a USB flash drive.
: Save the inputted standard sample concentration value.
: Delete the inputted concentration value.
Colorimetry Report Interface
Fig. 26 Colorimetry Report Interface
This interface is similar to the Nucleic Acids detection interface (see section 3).
: Choose the assay type and the detection data will be displayed.
20

6. Fluorometer Interface
Introduction
The Fluorometer interface allows for accurate quantitation of nucleic acids and proteins
that have been labeled with a fluorescent dye. The default excitation/emission
wavelength for fluorescence readings is set to 460/525nm. Select “Fluorometer” from
the main menu interface to enter the fluorometer interface (Fig. 27). For direct sample
fluorescence measurements, select “Fluorescence” to enter the fluorescence interface.
In this interface, no standard curve is required.
Fig. 27 Fluorometer Interface
Fluorescence Interface
Select “Fluorescence” to enter the fluorescence interface (Fig. 28).
Fig. 28 Fluorescence Interface
: Begin sample measurement.
: Print the calculated data.
: Current excitation/emission wavelengths.
21

Operation:
1. Set the sample ID.
2. Put the tube holder into the fluorescence sample port.
3. Add 200µl of sample into a 0.5ml PCR tube and place it into the sample port.
4. Select “Measure” to begin sample measurement; results will be displayed
towards the left of the interface.
Fluorescence Report
Fig. 29 Fluorescence Report Interface
This interface is similar to the Nucleic Acids detection interface (see section 3).
dsDNA, Protein, & Oligo Interfaces
The “dsDNA”, “Protein” or “Oligo” interfaces require the generation of a standard or
calibration curve. The dsDNA interface can measure samples concentrations as low
as 0.5pg/µl. Note: The interfaces for dsDNA, Protein, & Oligo are identical.
Fig. 30 dsDNA Interface
22

: The sample ID name has a default value of the current date and
time. Users can rename the sample ID. One sample ID can contain up to 1000
measurement values.
: Select a standard curve.
: Input the original sample volume.
: Begin sample measurement.
: Print the calculated data.
Fig. 31 dsDNA Sample Results
Original con.: The original sample concentration.
Sample con.: The PCR tube sample concentration.
Fluorescence: The fluorescence value of the measurement.
dsDNA Standard Curve Interface
Select “Curve” to enter the dsDNA standard curve interface (Fig. 32).
To generate a standard curve, at least 5 standard sample concentrations are needed.
The concentration range of the standards should cover all unknown sample
concentrations.
Fig. 32 dsDNA Standard Curve Interface
23

This interface is similar to the colorimetry curve interface (see Chapter 4.5). Please
note the following differences:
• A blank is not required for this interface; select “Measure” to begin sample
measurement directly.
• Calibration Curve: Calibrate the created standard curve to eliminate potential
drift error caused by the instrument.
Standard Curve Generation:
Select and input the curve name and select the curve type (Fig. 33).
Fig. 33 New Standard Curve
Fig. 34 Standard Curve Interface
Select to set the units of standards. To input the concentration of standards,
select . Make sure the set concentration is the same as standard
sample. There is no requirement of the orders when set the concentrations.
Fig. 34; when a standard sample is selected, the row will be highlighted in blue.
24

Select “Measure” to begin fluorescence detection. Each standard sample can be
measured up to 5 times, and the average value can be used to build the standard
curve. Users can delete the standard sample values or delete single values amongst
the 5 measurements of an individual sample.
Click to save the created standard curve.
Calibration Curve Interface:
Click to enter the calibration curve interface.
Fig. 35 Calibration Curve Interface
Input the concentration of the samples. Select “Measure” to begin the selected
standard fluorescence detection. Select “Calibrate” to complete the calibration.
dsDNA Sample Measurement
After generating a standard/calibration curve, return to the dsDNA interface (Fig. 30)
for sample measurements.
Operation:
1. Set the sample ID, standard curve, and input the original sample volume.
2. Put the tube holder into the fluorescence sample port.
3. Add 200µl of sample into a 0.5ml PCR tube and place it into the sample port.
4. Select “Measure” to begin sample measurement; results will be displayed
towards the left of the interface.
25

dsDNA Report Interface
Fig. 36 dsDNA Report Interface
This interface is similar to the Nucleic Acids detection interface (see section 3).
Kinetics Interface
In the Fluorometer interface, click “Kinetics” enter the interface (Fig. 37). In this
interface, kinetic fluorescence readings can be made, and a kinetic curve will be
displayed.
Fig. 37 Kinetics Interface
: Input the sample ID
: Set the total time (Hour: Minute: Second).
: Set the interval between two tests (Hour: Minute: Second).
26

Please wait. Measuring sample…
Fig. 38 Kinetics Sample Detection
:Export the graph (PNG file) and full spectrum absorbance data (1nm
steps) to a USB flash drive.
: Print the calculated data.
: Zoom into the sample absorbance curve.
Operation:
1. Set the sample ID, standard curve, and input the original sample volume.
2. Put the cuvette holder into the fluorescence sample port.
3. Add 200µl of sample into a 0.5ml PCR tube and place it into the sample port.
4. Select “Measure” to begin sample measurement; results will be displayed
towards the left of the interface.
Kinetics Report Interface
Fig. 39 Kinetics Report Interface
This interface is similar to the Nucleic Acids detection interface (see section 3).
27

7. UV-Vis Interface
Introduction
The UV-Vis module allows the SmartDrop XF to function as a conventional
spectrophotometer. Sample absorbances will display from 200nm to 800nm. Samples
with high absorbance values (10mm pathlength equivalent of 300A) can be measured
directly.
UV-Vis Measurement
Fig. 40 UV-Vis Interface
Click to set a blank reading. After setting a blank, click to
enter the full wavelength interface of the blank sample.
Fig. 41 Blank Full Wavelength Interface (200 - 800nm)
Users can input up to 5 wavelengths before detection and the corresponding
absorbance values will be displayed after detection (Fig. 42).
28

Fig. 42 Select Wavelengths for Measurement
After blank detection, click to perform a sample reading. Click
“ to enter the full wavelength interface of the sample.
Fig. 43 Sample Full Wavelength Interface
Operation:
1. Set the Sample ID.
2. Clean the upper and lower pedestals with a lint-free wipe, add 2μL buffer
solution to perform a blank reading.
3. Clean the buffer solution on the pedestals with a wipe.
4. Measure a 2μL sample volume and click “Measure” to detect the sample.
Note: A blank reading must be performed prior to sample measurements. The
sample volume must be equivalent to the volume used to set the blank
reading.
5. Clean and dry the pedestal between measurements.
29

UV-Vis Report Interface
Fig. 44 UV-Vis Report Interface
: Click to enter the UV-Vis Full Spectrum Interface. Input a wavelength
to view the corresponding sample absorbance value (Fig. 45).
Fig. 45 UV-Vis Full Spectrum Interface
8. OD600 Interface
Introduction
The OD600 function allows for measuring absorbance values at 600nm. It is commonly
used for measuring the growth rate of bacterial cell cultures by measuring absorbance
of the culture in growth media at 600nm. The Beer-Lamber equation is used to
calculate the concentration (see section 3). This interface does not require the
generation of a standard curve.
30

OD600 Interface
Operation:
Fig. 46 OD600 Interface
1. Set the Sample ID.
2. Clean the upper and lower pedestals; add 2μL buffer solution to perform a
blank reading.
3. Clean the buffer solution on the pedestals.
4. Measure a 2μL sample volume and click “Measure” to detect the sample.
Note: A blank reading must be performed prior to sample measurements. The
sample volume must be equivalent to the volume used to set the blank
reading.
5. Clean and dry the pedestal between measurements.
OD600 Report Interface
Fig. 47 OD600 Report Interface
This interface is similar to the Nucleic Acids detection interface (see section 3).
31

9. System Settings Interface
Click “System” on the main interface to enter the System Settings Interface (Fig. 48).
Fig. 48 System Settings Interface
Date & Time Settings Interface
Click the “Time” icon to enter the date and time settings interface.
Fig. 49 Date and Time Settings Interface
Click “Set date” to enter the Date Settings Interface (Fig. 50). Click “Set Time” to enter
the Time Settings Interface (Fig. 51).
Fig. 50 Date Settings Interface Fig. 51 Time Settings Interface
32

Print
Click the “Print” icon to set the print mode.
Fig. 52 Print Settings Interface
Brightness
Click the “Brightness” icon to enter the Brightness Settings Interface. Use the slider to
adjust the brightness of the display.
Fig. 53 Brightness Settings Interface
33

Fault
Analysis
Troubleshooting
Instrument does not
power on.
No power supply,
Switch defective,
Power adapter defective.
Check the power supply,
Replace the switch,
Contact Accuris
Instruments.
Measurement results not
precise
Sample column
unformed,
Pedestal contaminated
Add sample again, make
sure the liquid column
formed well,
Clean the pedestals,
Contact Accuris
Instruments.
OD600 module failure
Poor connection
between cable and
board.
Contact Accuris
Instruments.
Insufficient light intensity
error
Analysis module
defective, optical fiber
broken.
Contact Accuris
Instruments.
Touch screen error
Power supply does not
have effective grounding.
Provide effective
grounding power supply.
Communication timeout
Analysis module
communication failure.
Contact Accuris
Instruments.
Chapter 5 Troubleshooting
34
 Loading...