

Page 1

5 Commonwealth Ave
Woburn, MA 01801
TestEquipmentDepot.com
Page 2

Operation Manual
Version 2.0
MR9610,
SmartReader™ UV-Vis
Microplate Reader
This instrument is for research use only
Page 3

III
Please read the manual carefully and operate safely according to all
guidelines.
This instrument is intended for Research Use Only
Users should have a clear understanding on use this instrument before
operation. Please read this user manual carefully.
Foreword
Thank you for purchasing our MR9610, SmartReader™ UV-Vis Microplate
Reader. This user manual describes how the instrument works and includes an
operation guide, please read it carefully before operation and keep for future
reference.
Initial check
Please check the instruments as well as all accessories with the packing list when
first received and unpackaged. If you find any missing, please contact your
distributor or Accuris Instruments.
Safety Warning and Guidelines
1. Important information for safe use
Page 4

IV
Indoor use only.
Warning: Biological contamination hazard. All samples for testing,
quality control, and calibration should be regarded as infectious, and
any parts that come into contact with samples should also be treated
as infectious. Please wear gloves and appropriate safety gear when
operating this device.
Before using the device, read the operation manual carefully. These
instruments are designed for use in a laboratory environment. The
device must be operated by skilled laboratory personnel with the
appropriate training.
Warning: Avoid injury. Keep your body or any part of body at a safe
distance (1 foot or more) from the instrument when running.
The operator should not open or perform any repairs on the
Instrument without specific instructions from Accuris Instruments or
an authorized agent of Accuris. Performing any unauthorized
service repairs will result in loss of warranty coverage. Contact
Accuris Instruments or an authorized distributor or agent in the event
of any service issues.
Before powering on, confirm that the voltage used meets the
electrical requirements of the instrument as stated on the rating plate.
If the electric cord is damaged, replace it with the same type.
Hold the socket firmly when you pull the plug from an outlet, and don’t
pull the electric line only.
2. Safety Tips
The operation, maintenance and repair of the Instrument should comply with the
basic guidelines and the warnings below.
Page 5

V
The Instrument should be installed in an environment of standard
room temperature, low dust, low humidity and away from direct
sunlight. Also make sure there is adequate ventilation, no corrosive
gas or strong magnetic field.
Always power off the instrument when you are finished using it.
Unplug the power cord and cover the instrument with a cloth or plastic
sheet to prevent excessing dust from entering the housing.
Pull the connector plug from the electrical outlet immediately and
contact the vendor in the case of:
⚫ Liquid entering the housing.
⚫ Abnormal operation: such as any abnormal sound or smell.
⚫ The instrument is dropped or there is any damage to the housing.
⚫ Any malfunction
Page 6

Contents
Foreword ................................................................................................................................................ III
Initial check ........................................................................................................................................... III
Safety Warning and Guidelines .............................................................................................................. III
1. Important information for safe use .................................................................................... III
2. Safety Tips ............................................................................................................................ IV
Chapter 1 Introduction .................................................................................................................... 1
Chapter 2 Features ................................................................................................................................ 2
Chapter 3 Instrument Overview .................................................................................................... 4
Chapter 4 Installation ............................................................................................................................ 5
1. Initial check ................................................................................................................................ 5
2. Installation location and environment..................................................................................... 5
3. Installation steps ....................................................................................................................... 5
Chapter 5 Operation Guide ...................................................................................................................... 7
1. Initial self-check ......................................................................................................................... 7
2. System settings ..................................................................................................................... 8
3. Protocol Management ........................................................................................................... 9
4. Reading a Microplate .......................................................................................................... 12
5. Result processing ................................................................................................................ 18
6. Report exporting .................................................................................................................. 26
7. Power off ............................................................................................................................... 27
Chapter 6 Maintenance, storage, transportation ......................................................................... 28
1. Maintenance ......................................................................................................................... 28
2. Storage and transportation ................................................................................................ 28
Chapter 7 Trouble shooting ................................................................................................................. 29
Chapter 8 Accessories ............................................................................................................................ 31
Page 7

MR9610 Microplate Reader Operation Manual Chapter 1 Brief Introduction
─ 1 ─
Chapter 1 Introduction
The SmartReader™ UV-Vis is an automated microplate reader for ELISA
assays. Through absorbance readings, it can determine the concentration, as
well as positive or negative detection of antibody and antigen in samples when
used with ELISA kits and solutions. The instrument can also be used to test for
purity and quantitate nucleic acids and proteins.
Key Features:
1) 10-inch color touch screen.
2) Operating system allows acquisition, editing and saving of data.
3) Stand-alone system incorporates built-in processing, it can be optionally
connected to a PC with the use of SmartReader software.
4) Graphical interface displays a representative plate for easy setting of well
parameters: blank, sample, standards, positive/negative, quality control
and multi-value comparisons.
5) Dual optical channels, one used for sample detection, and one used for
reference.
6) End-point method, kinetic readings, and spectral scanning can be
performed.
7) Accepts plates with or without lids. Top heating prevents condensation.
8) Xenon lamp offers long life: 109 flashes (1,000,000,000), equivalent to
approximately 1,300,000 plate reads.
9) Plate incubation feature allows accurate and uniform temperature control
(≤0.5°C deviation between wells).
10) Top reading optical path with continual self-checking and automatic
calibration option for monochromator wavelength and plate positioning.
11) Shaking function, time and speed are adjustable.
12) USB flash drive data export, for fast and easy data transfer.
13) Multi-user operation, data management for separate users.
Page 8

─ 2 ─
Model
Parameter
MR9610
Light source
Xenon flash lamp >109 flashes
Wavelength
200~1000nm
Bandwidth
< 2.5nm
Wavelength accuracy
±2nm
Wavelength
repeatability
0.2nm
Read-out range
0.0-4.0 OD
Linearity@450nm
R2 ≥ 0.999, [0.0 – 3.0]
Accuracy@450nm
1.0% + 0.003 Abs (0 - 2.0]
2.0% (2.0 - 2.5 Abs]
Precision@450nm
CV < 0.5% or SD<0.003 (Precision mode); CV < 1.0%
(Fast mode)
Stability@450nm
< 0.005A , (0.0 - 2.0]
< 2% , (2.0 - 2.5]
Measurement speed
< 8 seconds in Fast mode (96-well plate)
< 28 seconds in Precision mode (96-well plate)
< 74 seconds in Precision mode (384-well plate)
Plate shaking
Linear (Slow: 16.8Hz, 1mm; Medium: 6.68Hz, 3mm;
High: 2.44Hz, 15mm)
Incubation range
RT+ 5°C to 45°C
Temp. uniformity
± 0.5°C @ 37°C
MR9610 Microplate Reader Operation Manual Chapter 2 Features
Chapter 2 Features
Working conditions:
Ambient temperature: 10C~40C
Relative humidity: 30%~80% (Non-condensing environment)
Power: AC 100-240V 50-60Hz 2A
Parameters:
Page 9

─ 3 ─
Connections
1 B-type USB port for PC connection
1 Ethernet port
2 A-type of USB ports for mouse and printer connections
Power requirements
Included power adapter: DC24V 6.67A 160W,
AC 100V – 240V
Dimension (W×D×H)
300×500×260mm / 11.8 x 19.7 x 10.25 inch
Weight (kg)
15.5kg / 34 Lbs
MR9610 Microplate Reader Operation Manual Chapter 2 Features
Page 10

─ 4 ─
Structure
Rear cover
Touch screen
Housing
External Buttons
Plate holder
Front door
Extension module
USB Ports
LAN Port
Power Switch
DC Power Inlet
B-type
USB Port
Air outlet
MR9610 Microplate Reader Operation Manual Chapter 3 Instrument Structure
Chapter 3 Instrument Overview
Page 11

─ 5 ─
MR9610 Microplate Reader Operation Manual Chapter 4 Installation
Chapter 4 Installation
1. Initial check
Each MR9610 is thoroughly tested before shipping, but please check it again when you
receive the instrument and contact your local distributor or Accuris Instruments if:
• The outer package is damaged
• The outer package has any obvious moisture stains
• The outer package has marks of impact
After opening, please check the instrument and box contents.
Confirm that all ordered accessories have been included.
Check the instrument’s appearance for any damage.
2. Installation location and environment
Installation location: locate the instrument on a flat, dry, clean and stable surface, allow
enough room on the front side so there is space for plate holder drawer to move in and out,
and also keep 15cm / 6 inches of space behind and on the sides for any wires and air flow.
Environment:
a. The environment for installation should not be excessively humid or dusty.
b. Temperature should be within the range of +10°C ~ +40°C.
c. Relative humidity should be within the range of 30% ~ 80% to avoid condensation.
Note: KEEP THE INSTRUMENT AWAY FROM CORROSIVE GASSES AND
LIQUIDS.
3. Installation steps
① Place the instrument on a stable and level surface.
Note: DO NOT loosen any screws or parts without first consulting with the
Accuris Instruments Service Department or your authorized distributor. Doing
so can cause damage and void the warranty.
② Connect the instrument to an appropriate power outlet using the provided power
cord.
Fig. 1
Page 12

─ 6 ─
MR9610 Microplate Reader Operation Manual Chapter 4 Installation
Note: One cord coming from the power adapter will fit to the input jack on the
back of the instrument. Make sure to connect it according to the above picture.
The other cord will connect to a standard electrical outlet (100VAC to 230VAC)
③ After connecting the power cords, switch the power button on the rear of the
instrument to the ON position, the front panel will cycle through a start-up and
self-test screen.
Warning: Do not connect the instrument to a power outlet that is not properly
grounded.
Page 13

─ 7 ─
MR9610 Microplate Reader Operation Manual Chapter 5 Operation Guide
Chapter 5 Operation Guide
1. Initial self-check
This chapter explains a standard protocol set up and operation, beginning with the
automatic self-check after power on. The following screen image will appear during the
self-check:
Fig 2
The user login interface will appear after the self-check, see Fig 3. This allows login
as the Admin, existing user, or click “Guest”.
Fig 3
Page 14
─ 8 ─
User type
Creation
Method
Default password
Permission
Export
Admin
Cannot be
deleted
“123456”
For all files of
Admin, User and
Guest
All can be
exported
User
Created by
Admin
Default is “123456” or
is set when creating
Access to files
under the user
account
Guest
Cannot be
deleted
No password
MR9610 Microplate Reader Operation Manual Chapter 5 Operation Guide
Table 1
Note: Please keep the Admin password recorded and in a safe place, and contact
Accuris Instruments or your distributor if the Admin password is lost or forgotten.
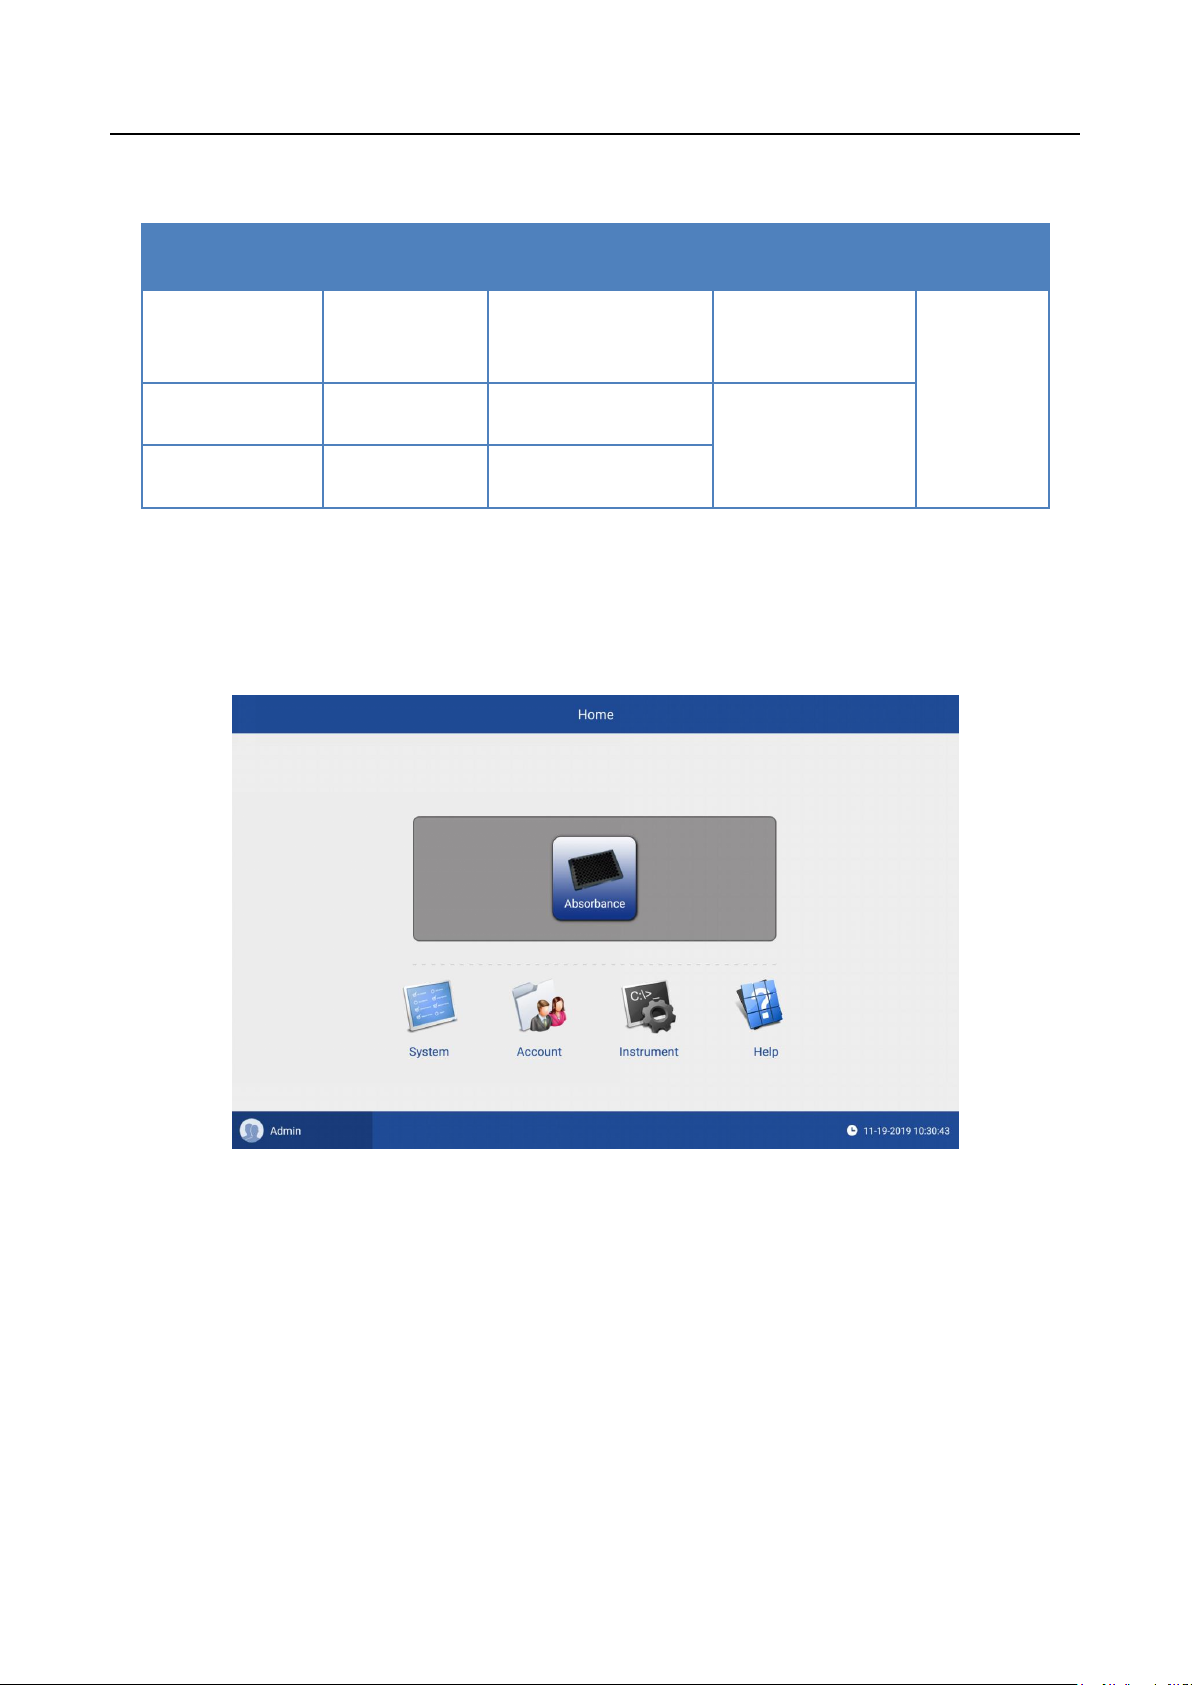
After logging in, the Home Interface screen is displayed (Fig 4.)
The “Admin” button on the lower left is for the logout and login interface.
2. System settings
In the “Systems” section, users create system settings (time, date and language)
according to their needs, for details see Fig 5.
Fig 4
Page 15

─ 9 ─
MR9610 Microplate Reader Operation Manual Chapter 5 Operation Guide
Fig 5
Note: 1. The instrument must be manually powered off and back on after the date and
time settings are changed.
2. The Maintenance function is accessible only by authorized service
representatives.
3. Click the “Home” button on the top left corner to go to the main interface.
3. Protocol Management
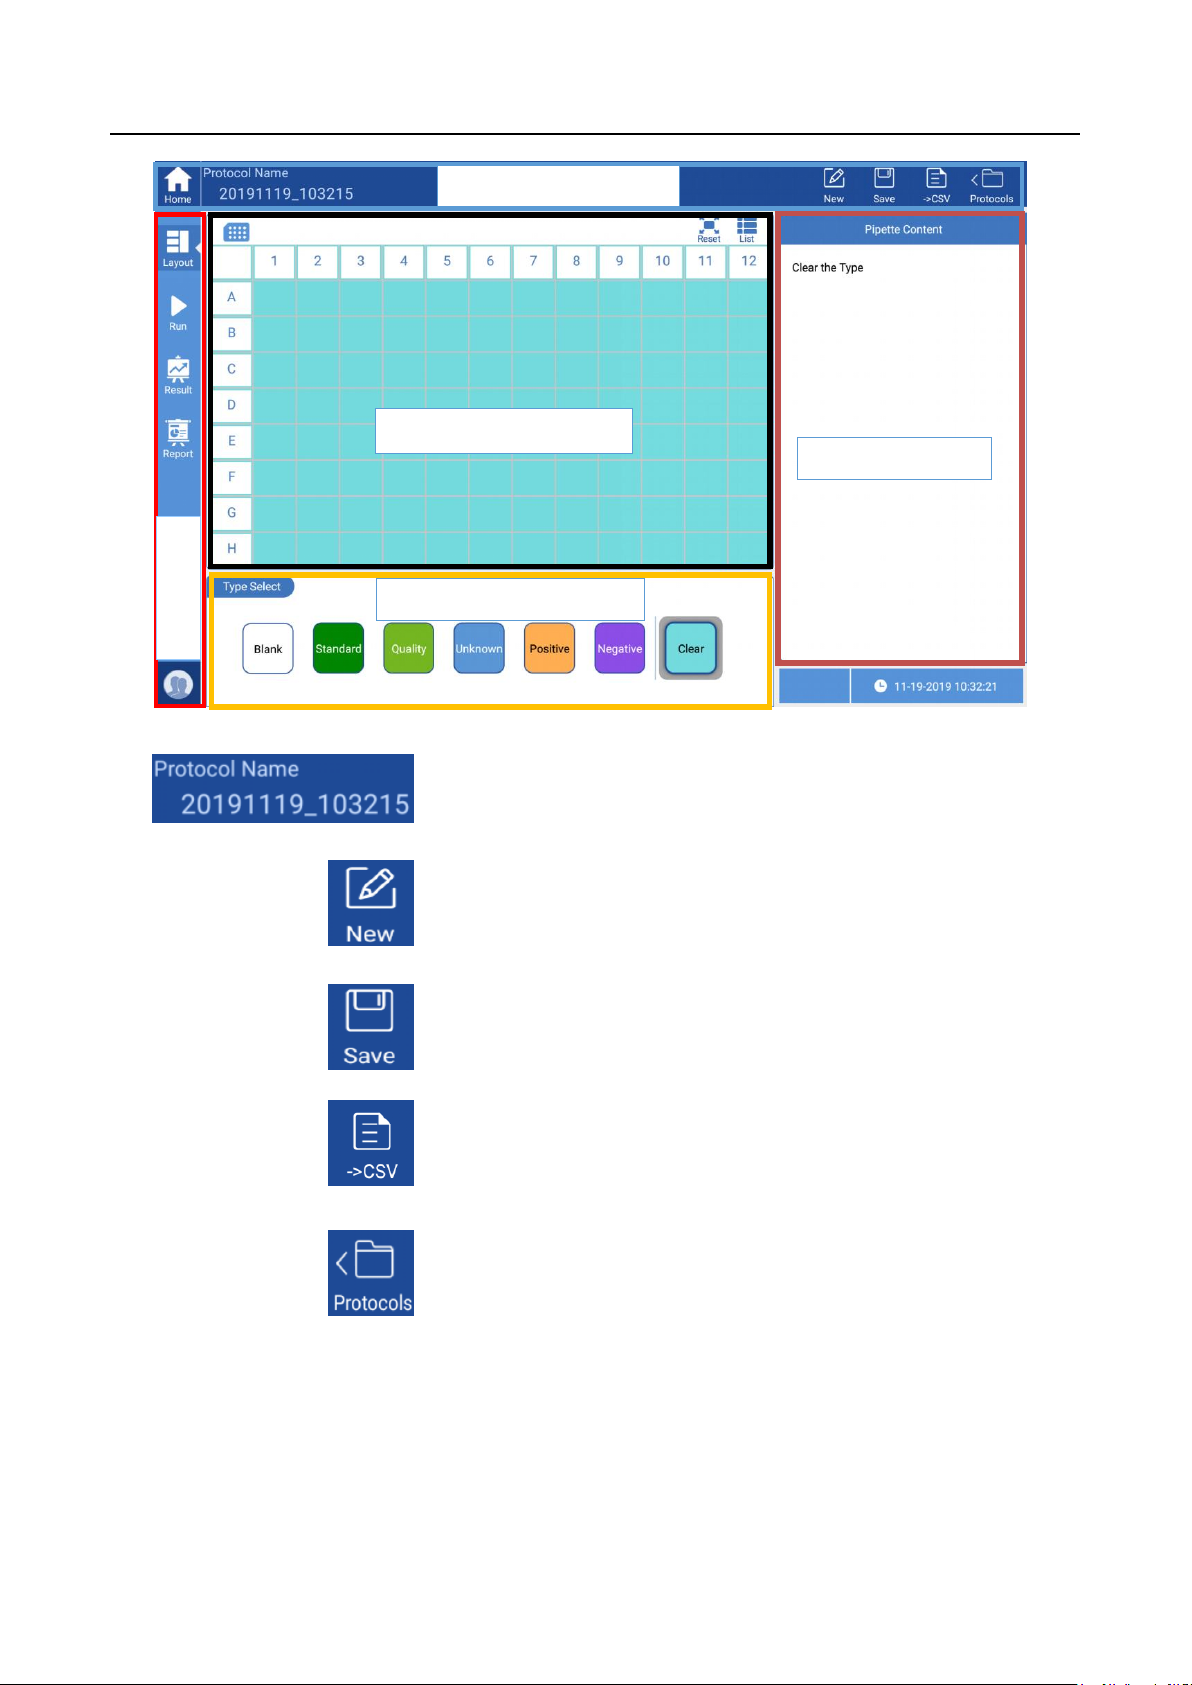
Click “Absorbance” on the home interface to enter the layout interface (fig 6). This
interface is composed of six sections: the navigation bar at the top, the sidebar, the main
display area, the optional bar, setting type selection and the status bar at the lower right
area. The SmartReader UV-Vis incorporates a touch screen control panel, but the
included mouse can also be used for all programming functions.
Page 16
─ 10
Protocol name can be modified by clicking it directly.
The default name of a new protocol is the system date
and time, and it can be modified manually. A pop-up
window will appear to remind the user when a modified
protocol has not been saved.
Save the current protocol to the protocol list.
Shortcut for exporting raw data to a flash drive in .csv
format. (Exports only the data displayed in the “Main
Display Area”)
Open the Protocol folder for accessing saved protocols,
sorting, deleting, importing, exporting, and renaming
protocols. The Protocol list opens on the right side of the
screen and can be closed by clicking on the left area.
Navigation bar
The optional bar
Setting Type Selection
The Sidebar
Main display area
MR9610 Microplate Reader Operation Manual Chapter 5 Operation Guide
Fig 6
Page 17
─ 11
MR9610 Microplate Reader Operation Manual Chapter 5 Operation Guide
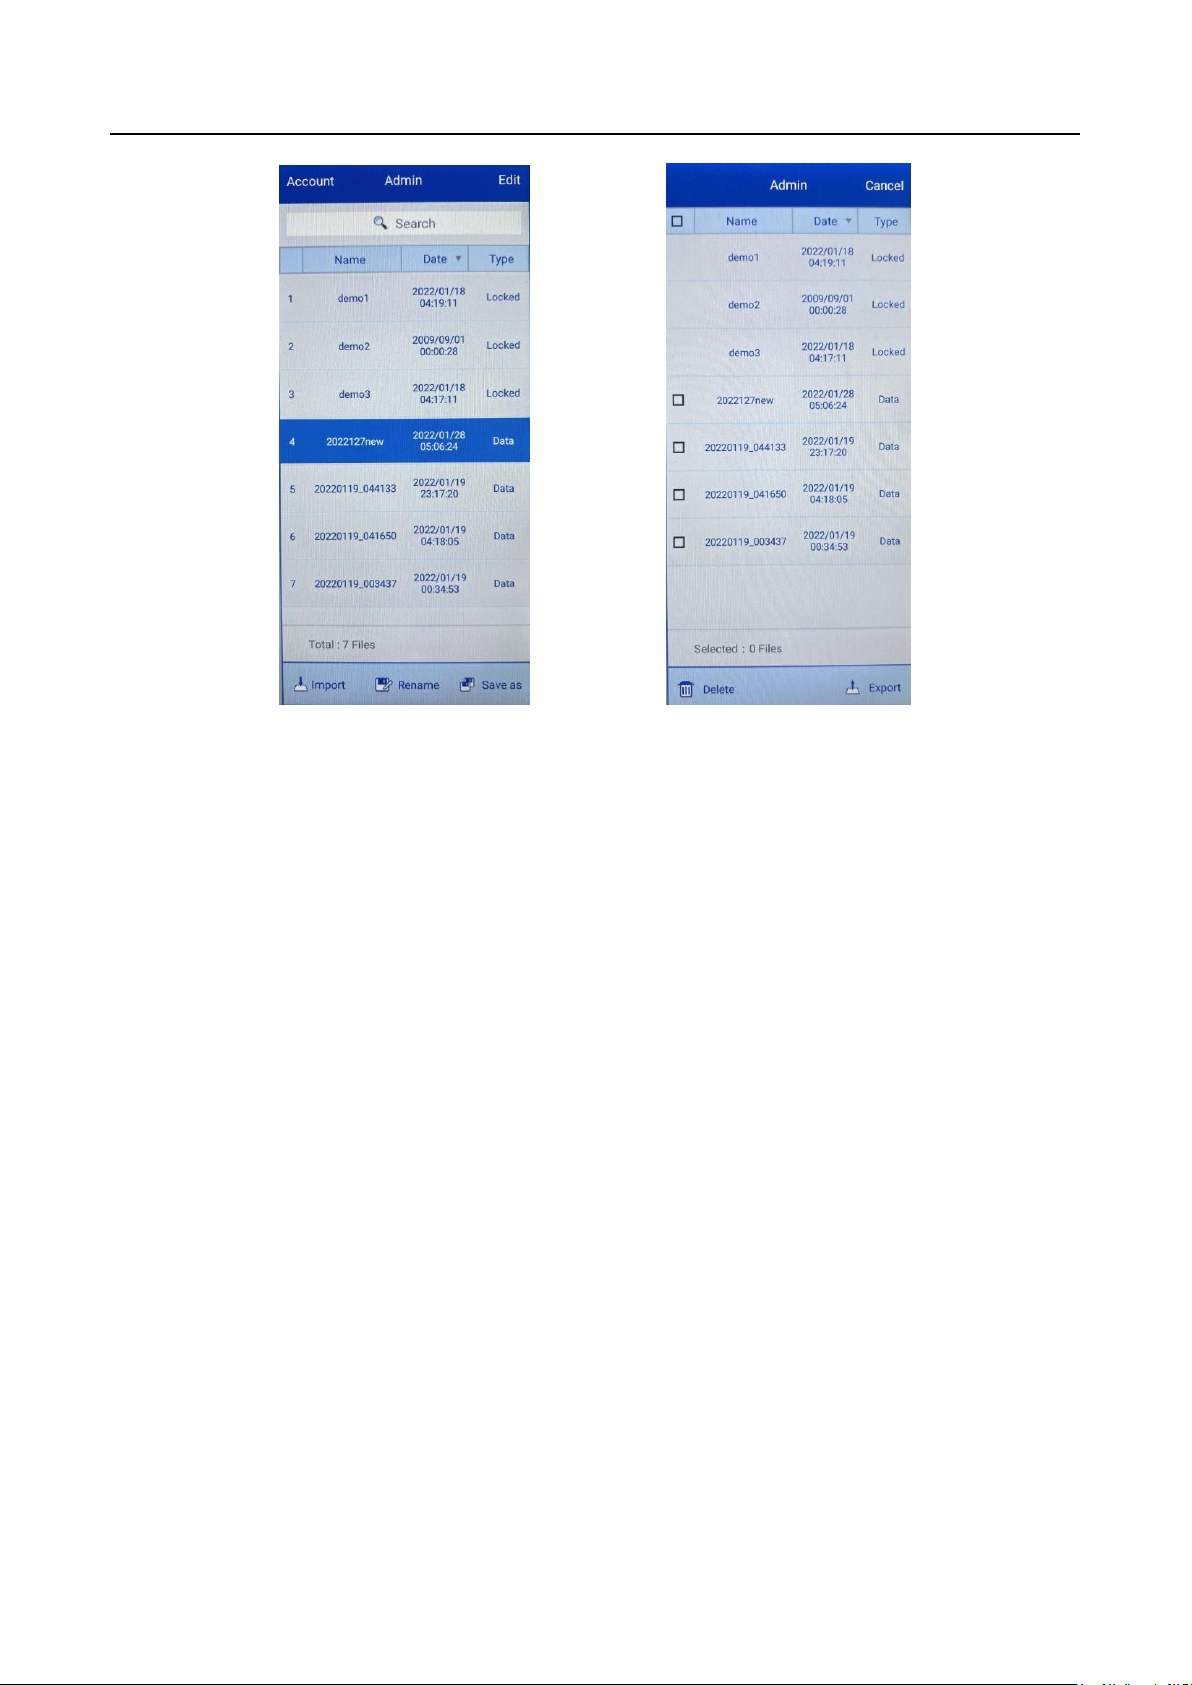
Protocol list, standard state Protocol list in “edit” state
Fig 7
When the protocol list is in the standard state, users can perform the below operations:
⚫ Search: Enter a keyword to search the list.
⚫ Sort: protocols can be sorted according to “Name”, “Date” and “State”. “demo1”,
“demo2” and “demo3” are always displayed at the first three positions.
⚫ Import: For importing protocols from a flash drive to the instrument.
⚫ Rename: Change the name of a protocol.
⚫ Save as: Save as a new protocol.
⚫ Edit: “Edit” button is located on the top right corner, see Fig 7 to enter the edit state.
⚫ Account: Protocols of other accounts can be checked, but this function is only
available for the Admin account.
When the protocol list in the edit state, the below operations are available:
⚫ Sorting: protocols can be sorted according to “Name”, “Date” and “State”.
⚫ Checkbox: “” can used to select more than one for batch operation.
⚫ Delete: delete selected protocols.
⚫ Export: For exporting selected protocols to a flash drive.
⚫ Cancel: Return to the standard state of the protocol list.
Page 18
─ 12
Blank: Set for a blank control during measurement. The
average absorbance value of the blank wells is
subtracted from the absorbance values of the other wells
after a plate read.
MR9610 Microplate Reader Operation Manual Chapter 5 Operation Guide
4. Reading a Microplate
After a protocol name is created, the next step is to set the parameters according to
the experiment requirements.
4.1 Plate layout settings
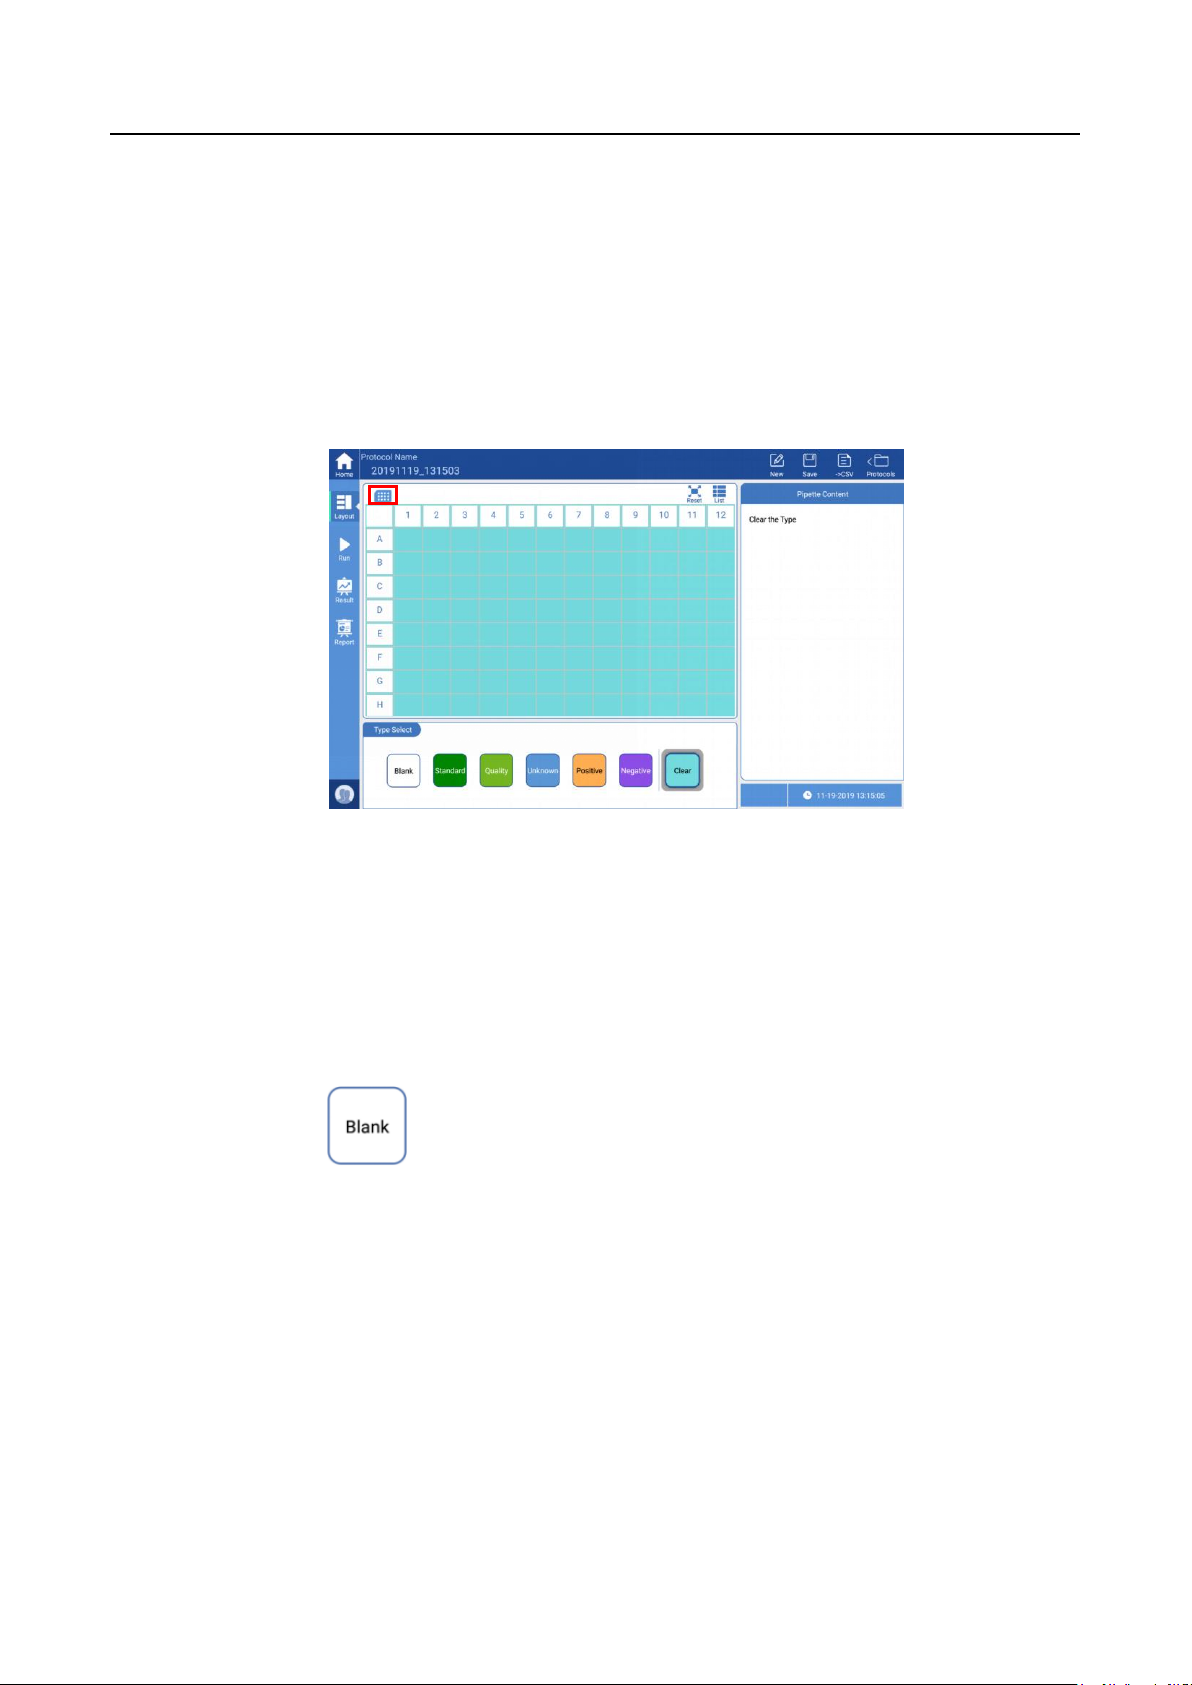
The interface will automatically display the plate in a 96 well plate layout when
creating a new protocol. To change from a 96 to 384 well-layout, click on the top left of the
plate layout to choose the required layout format.
Fig 8
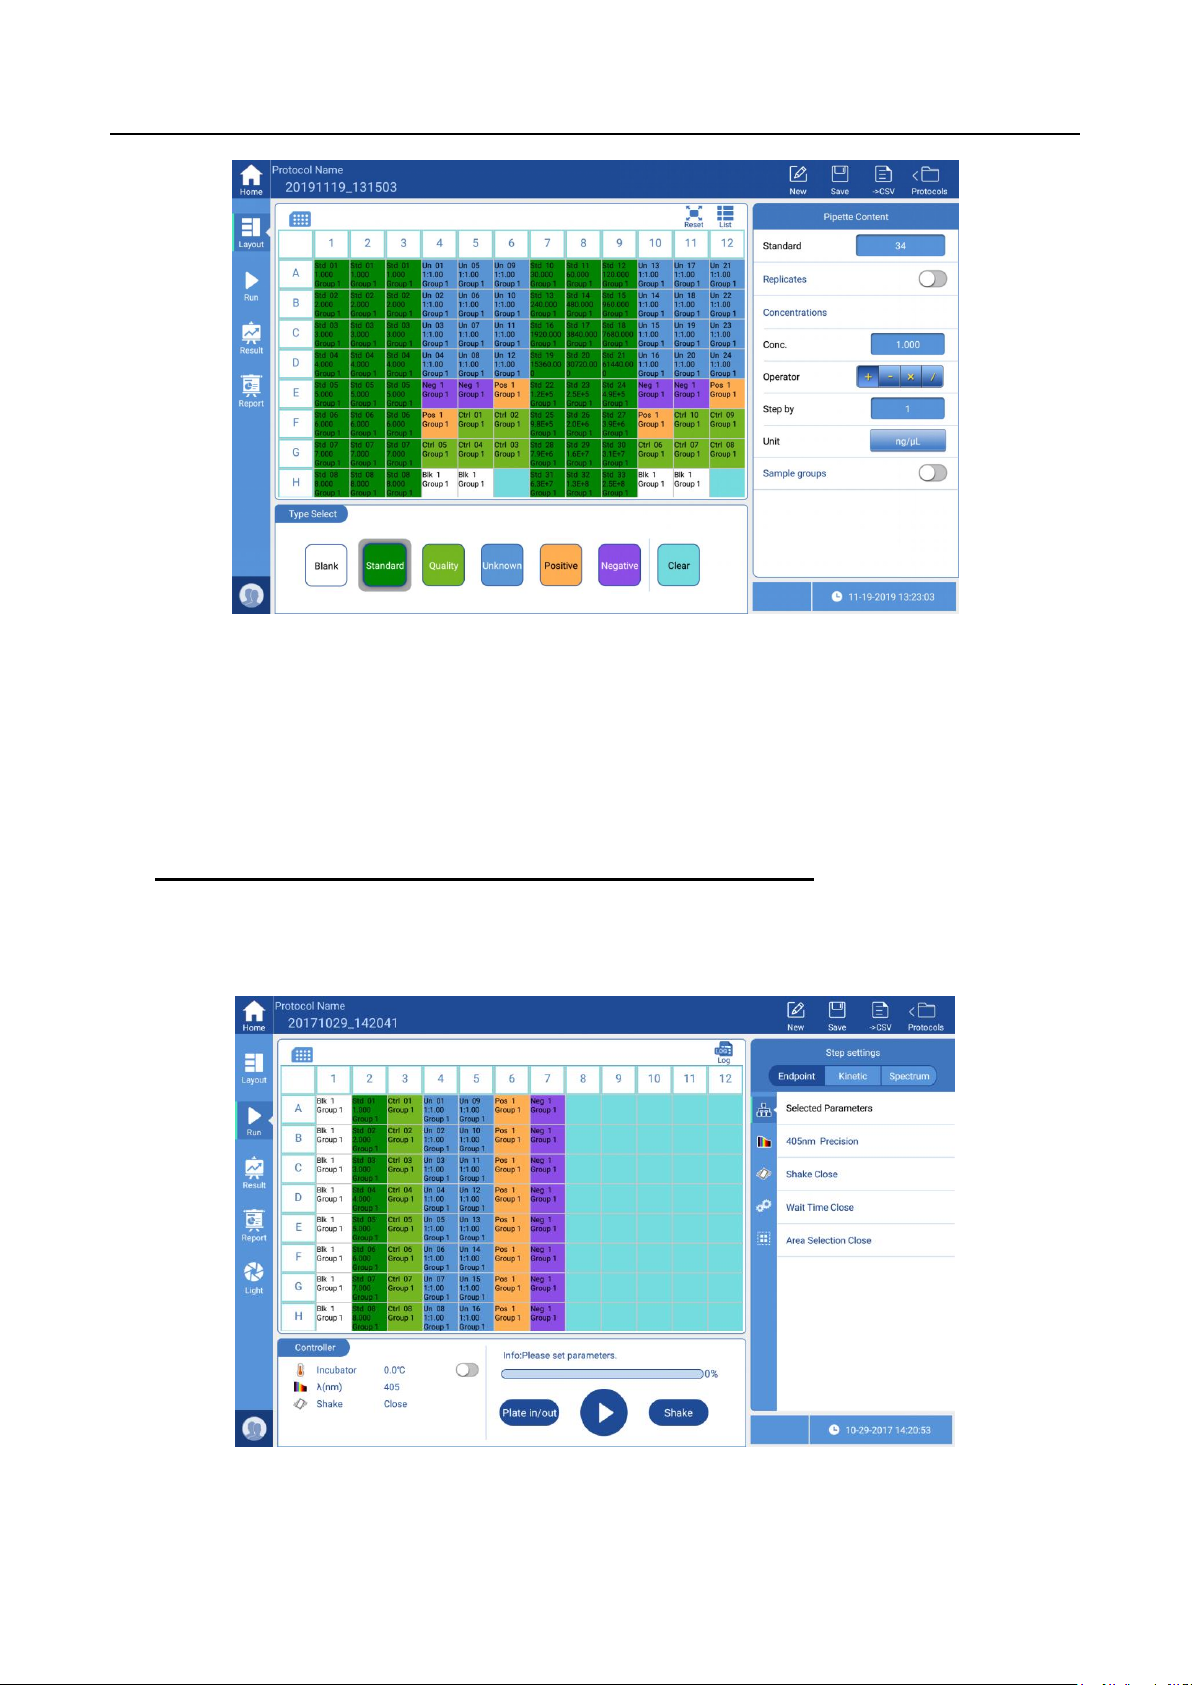
The plate layout menu allows choosing 6 well-setting options, as well as a clear option.
Choose the appropriate setting type, and the option bar will change accordingly, then click
the corresponding wells on the main display area to finish the settings.
Note: the entire plate (all wells) can be selected by clicking the blank box at the
upper left corner of the plate layout.
Page 19

─ 13
Standard: Used for creating the standard curve. After
clicking “Standard”, the option bar will allow setting
replicates and also calculations for quickly setting the
standard concentrations, see Fig 9.
⚫ Replicates: Use to set the same standard for multiple
wells.
⚫ Concentrations: After setting the concentration and
unit of the first well, the protocol will calculate and set
subsequent standards automatically according to the
set operator and step size, or the values can be
modified manually by clicking the corresponding
wells.
Example: If the set concentration is 125ng/μL, the
operator is “×” (multiply) and the step size is “2”, the
concentration of the first well will be 125ng/μL, the
second well 250ng/μL (2 x 125ng/μl) and the third
500ng/μL (2 x 250ng/μL)… etc.
Quality control. Settings are done in the same manner as
the wells of standard samples.
Unknown samples. Users can set wells as unknown, and
there in an additional “Factor” option if the unknown
sample has been diluted. If a dilution has been used,
set the value for the dilution factor “X. 1:X means the
unknown sample was diluted X times.
Positive Control, users can set several wells as positive
controls
Negative Control, users can set several wells as negative
controls
Used for clearing the settings of the plate layout.
MR9610 Microplate Reader Operation Manual Chapter 5 Operation Guide
Page 20
─ 14
MR9610 Microplate Reader Operation Manual Chapter 5 Operation Guide
Fig 9
Note: The plate layout can be set up before or after the plate is read. For
example, users can set all wells as “unknown”, read the absorbance values, then set
up the layout of the plate. The absorbance value data and layout are separate,
users can create or modify a layout to analyze absorbance data that was captured in
the past.
Note: the absorbance values of a test cannot be changed!
4.2 Parameter setting
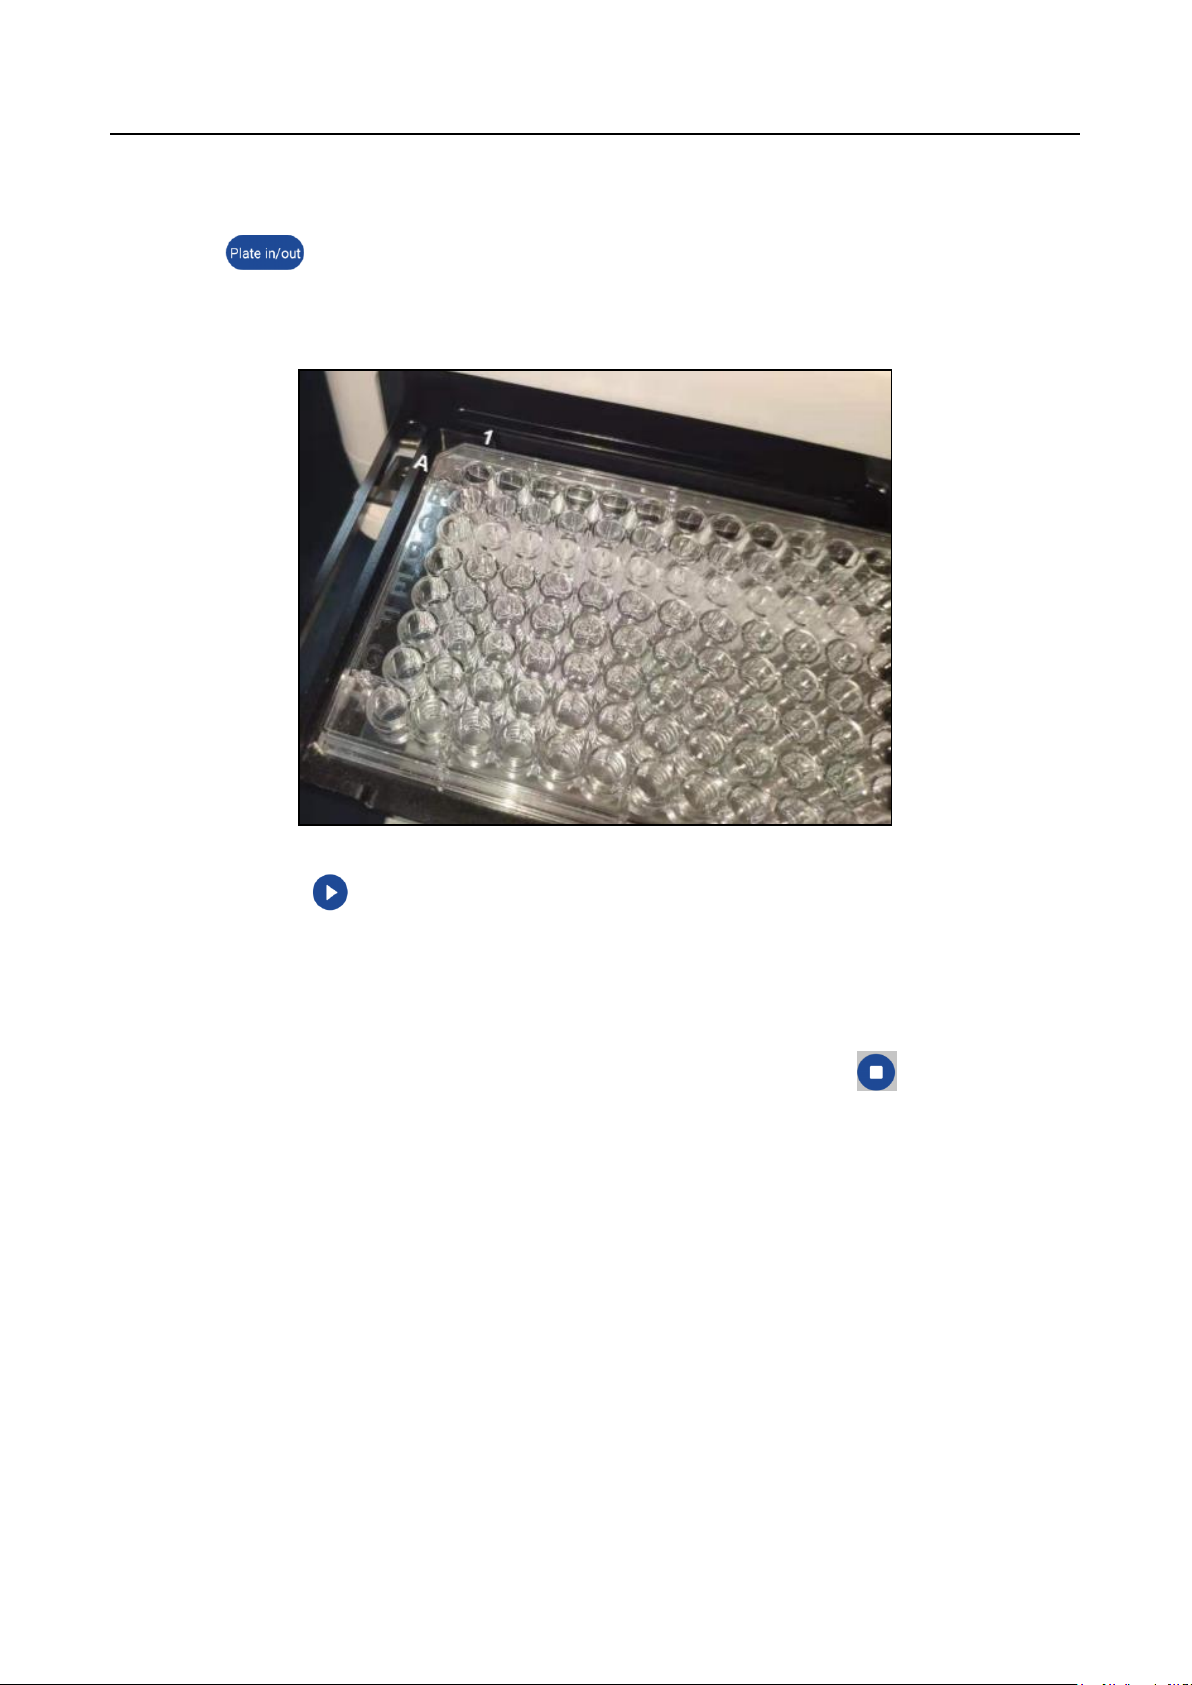
After completing the plate layout settings, click “Run” on the left side bar (see Fig 10.)
Fig 10
After clicking “Run” the lower window becomes a controller with the following functions:
Page 21

─ 15
MR9610 Microplate Reader Operation Manual Chapter 5 Operation Guide
⚫ Incubator: The plate chamber can be set to a specified temperature, and the actual
temperature is displayed.
⚫ Wavelength: shows wavelength parameters of the current protocol.
⚫ Shake: This function can be set to on or off.
⚫ Progress bar: displays the running status of the current protocol.
⚫ Plate in/out: control the motorized plate drawer to move it in and out; there is also a
physical control button on the front of the instrument.
⚫ Start/Stop: Used to start or stop a plate reading. There is also a physical button
on the front of the enclosure for start/stop.
⚫ Shake: This setting is independent from the shaking function in the settings menu,
it is specifically used for plate defoaming.
In “Run” mode, the window on the right side allows choosing a specific measurement
method: Endpoint, Kinetic or Spectrum, as well as reading parameters. See below table 2.
Page 22

─ 16
Endpoint
Kinetic
Spectrum
┗ Selected Parameters
┗ Selected Parameters
┗ Selected Parameters
┗ Wavelength
┗Mode
┗Fast
┗Precision
┗ Wavelength
┗λ1 (405)
┗λ2 (450)
┗λ3 (492)
┗λ4 (630)
┗ Wavelength
┗Mode
┗Fast
┗Precision
┗ Wavelength
┗λ1 (405)
┗λ2 (450)
┗λ3 (492)
┗λ4 (630)
┗ Wavelength
┗Mode
┗Fast
┗Precision
┗ Wavelength
┗Start Wavelength
┗End Wavelength
┗Step
┗ Kinetic
┗Total Time
┗Total Time
┗Kinetic region
┗No. of readings
┗Number
┗Kinetic region
┗ Shake
┗Speed
┗Low
┗Medium
┗High
┗Type
┗Continuous
┗Pulsed
┗Time
┗ Shake
┗Speed
┗Low
┗Medium
┗High
┗Type
┗Continuous
┗Pulsed
┗Time
┗ Shake
┗Speed
┗Low
┗Medium
┗High
┗Type
┗Continuous
┗Pulsed
┗Time
┗ Wait Time at start
┗ Wait Time at start
┗ Wait Time at start
┗ Area Selection
┗ Area Selection
┗ Area Selection
MR9610 Microplate Reader Operation Manual Chapter 5 Operation Guide
Table 2
For wavelength selection, Endpoint and Kinetic are configured with four wavelengths
(defaults are 405nm, 450nm, 492nm and 630nm), users can click on and modify these
wavelength values manually, but must be within the range of 200nm~1000nm. Spectral
analysis allows setting a wavelength range within 200nm~1000nm.
A “Log” button appears at the top right corner of the plate layout window after the
current protocol has been executed.
The “Log” is mainly used for recording the finishing time of each step of a protocol.
Note: Steps cannot be edited if a protocol has been executed, users can save it as a
new one and then edit.
Page 23
─ 17
MR9610 Microplate Reader Operation Manual Chapter 5 Operation Guide
4.3 Reading a Plate
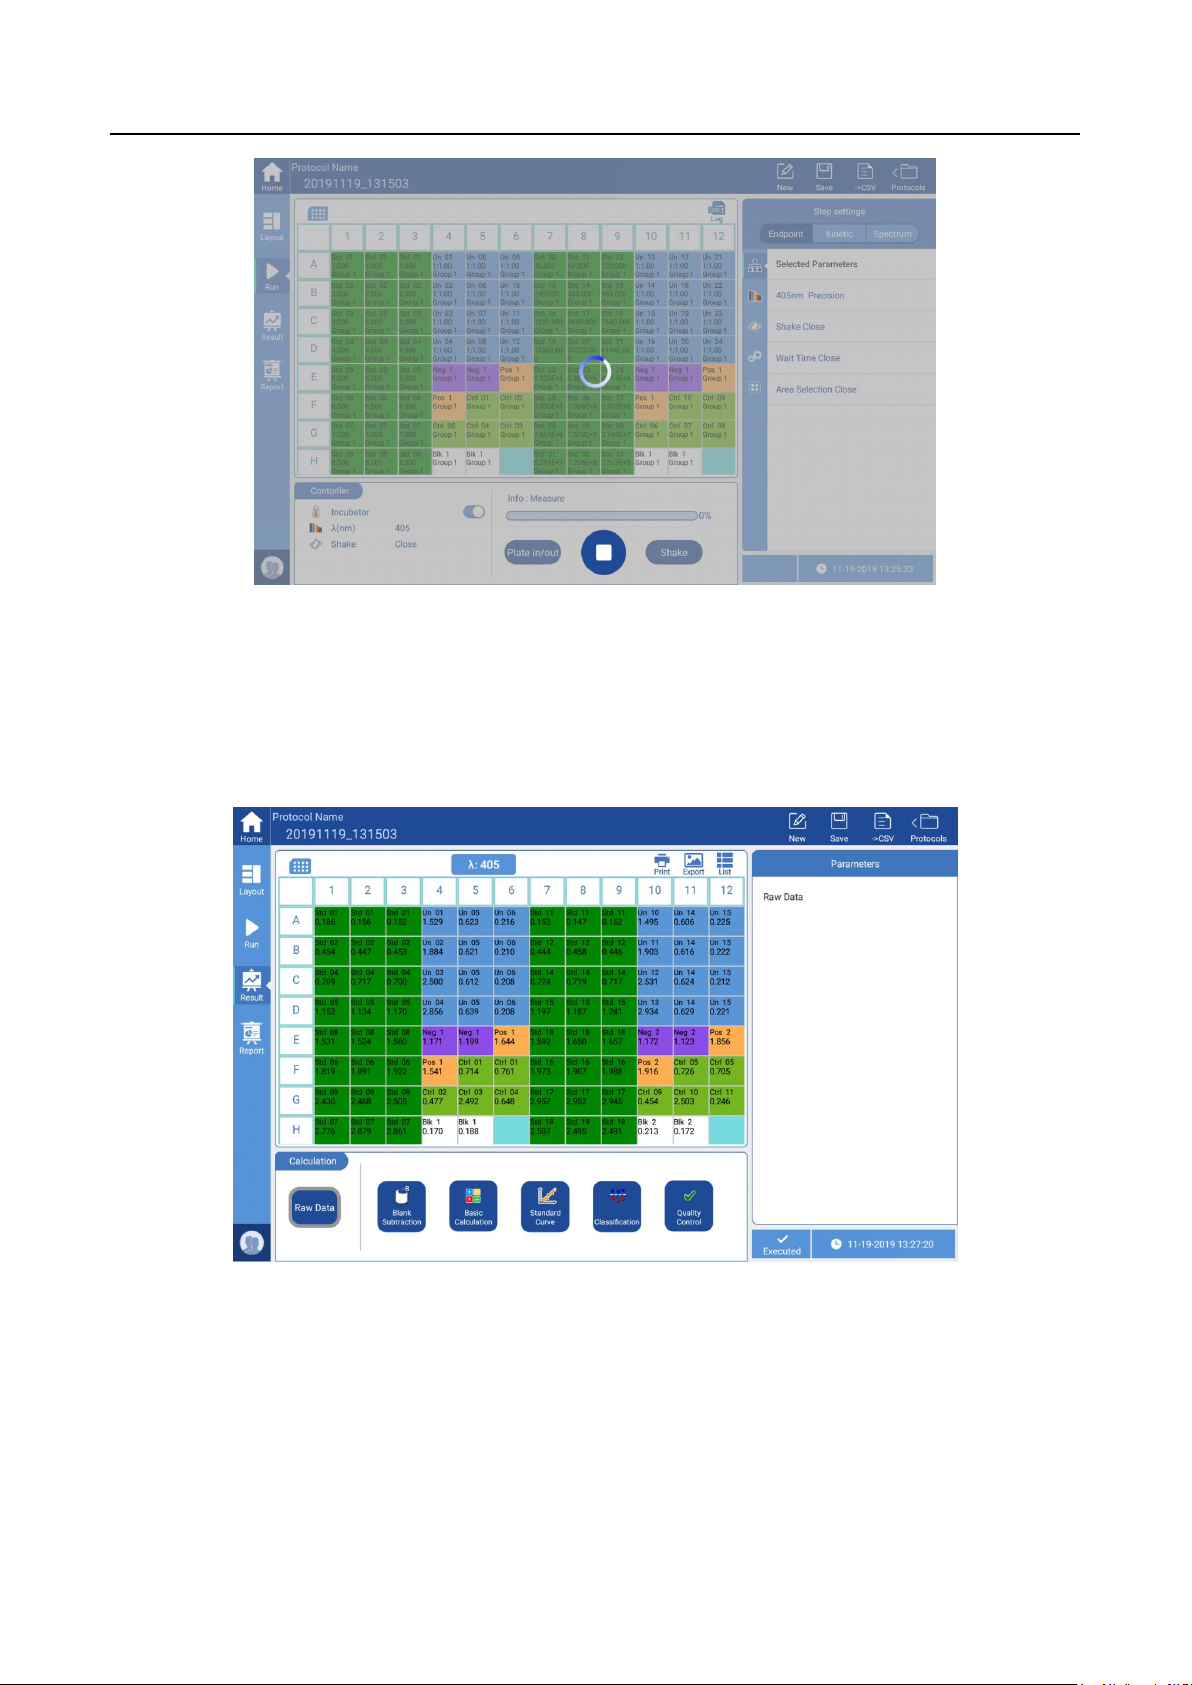
Click “ ” on the screen or press “Plate in/out” on the front of the enclosure to
open the plate drawer, load an ELISA plate on the plate holder, paying attention to the
orientation of the plate so the A1 well is in the correct location. See Fig 11.
Fig 11
Click button “ ” on the display or press the “Start” button on the front of the
instrument. If the protocol has already been run, a window will pop up to allow re-naming
the protocol results file. Input a file name, click “ok” to run the protocol. The plate drawer
will close, and during the reading process the screen will turn grey (see Fig 12) and all
buttons will become inoperable with the exception of the stop button “ ”. The user can
also press the “Stop” button on the front of the housing to stop a run.
Page 24
─ 18
MR9610 Microplate Reader Operation Manual Chapter 5 Operation Guide
Fig 12
5. Result processing
The screen will stay in the “Run” interface after detecting samples and will display the
original absorbance values measured. To view the analyzed results, switch to the “Result”
interface by pressing the Result button on the side bar, see Fig 13.
Fig 13
Results are displayed according to the protocol settings and measurement method.
The above Fig 13 shows results of an endpoint reading. Here, according to different types
of detection modes, the Result is divided into three modes: Endpoint, Kinetic and
Spectrum.
Page 25
─ 19
MR9610 Microplate Reader Operation Manual Chapter 5 Operation Guide
5.1 Endpoint result
As Fig 13 shows, data processing options for an endpoint result include: “Raw Data”,
“Blank Subtraction”, “Basic Calculation”, “Standard Curve”, “Classification” and “Quality
Control”.
⚫ Raw data: displays absorbance values of each well. If the plate was read using
multiple wavelength, the user can switch to different wavelengths by pressing the
button “ ” at the top, middle of the main interface. Blank Subtraction: An
average blank absorbance value is obtained per the wells set for “blank” samples.
This average value is then subtracted from the absorbance values for each sample
well.
Note: 1. The Blank Subtraction button is only available if blanks have been set
in the protocol layout interface.
2. When a protocol layout is set with blank samples, the absorbance
values of “Basic Calculation”, “Standard curve”, “Classification”, “Quality
Control” and “Kinetic Analysis” all include the subtraction of the blank
value.
⚫ “Basic Calculation”: the four basic functions of “+”, “-”, “x”, “/” can be performed on
the absorbance values at different wavelengths of the same well.
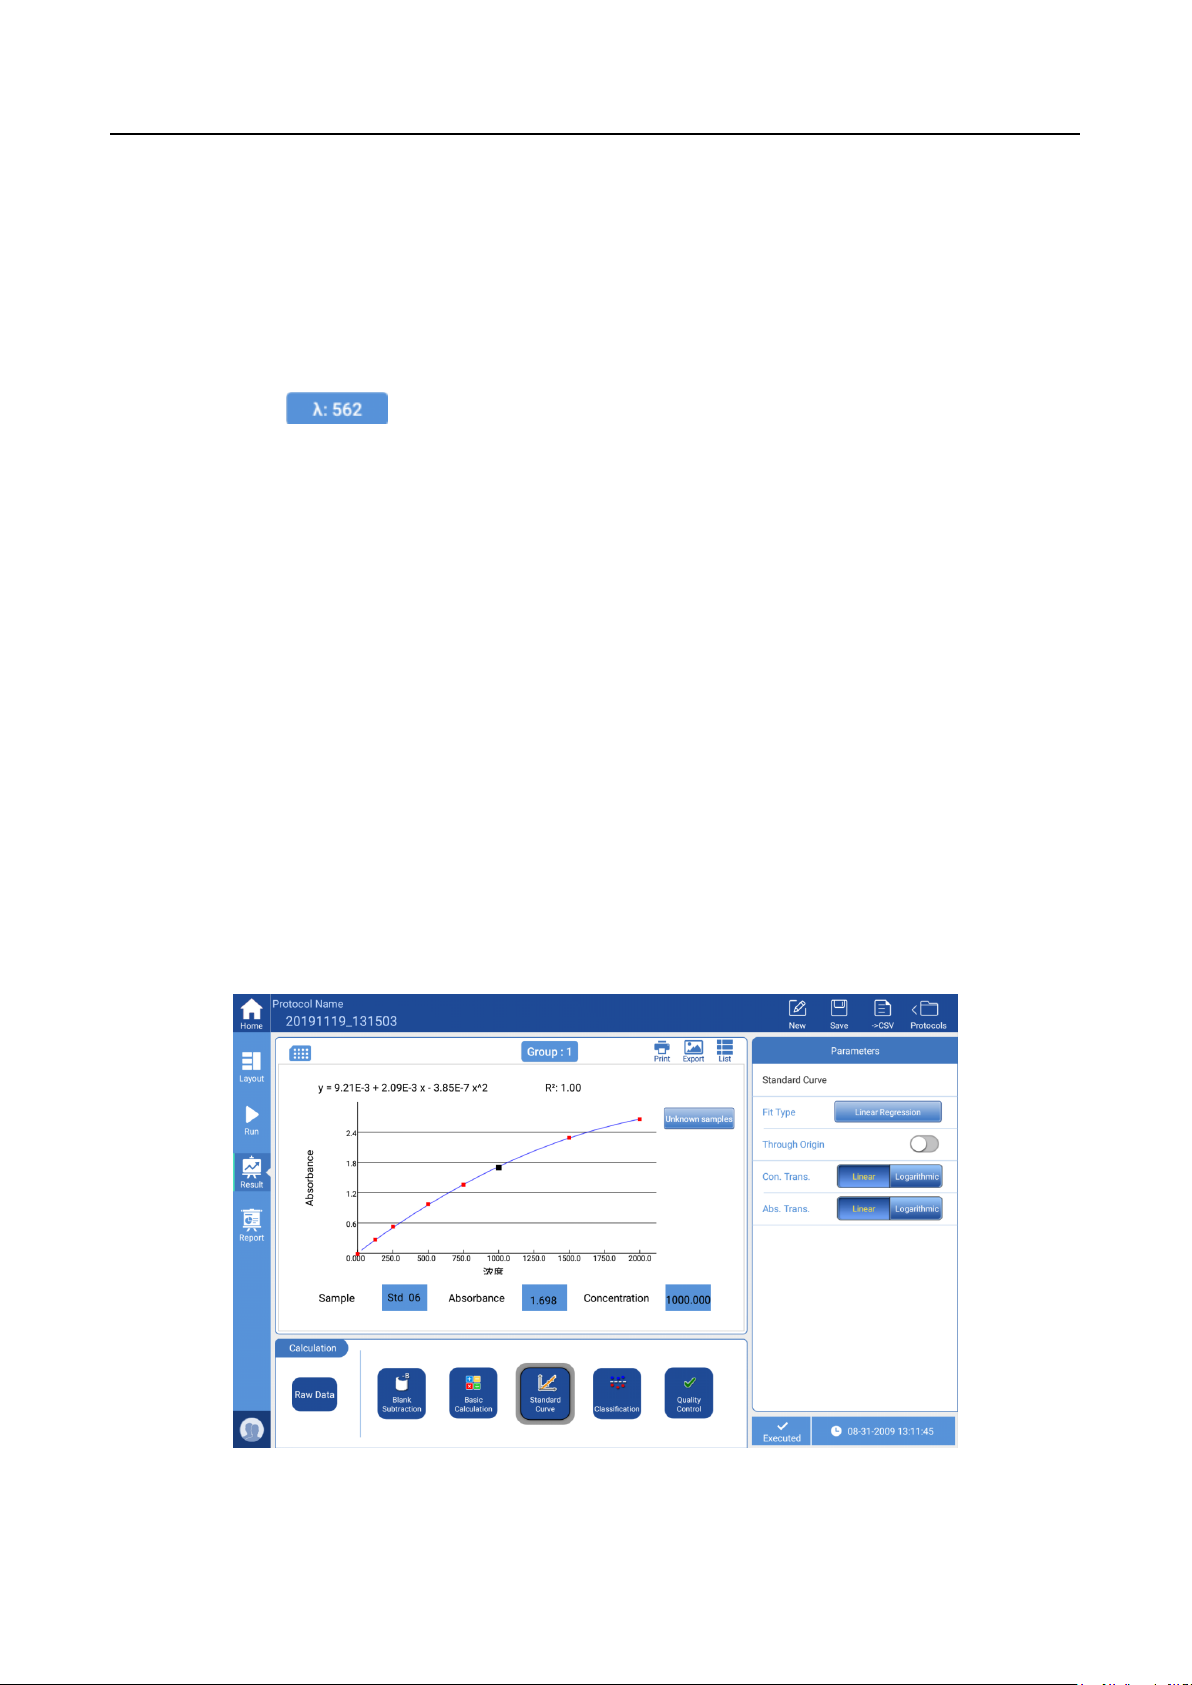
⚫ “Standard Curve”: Based on the concentrations set for the standard wells and the
corresponding measured absorbance values, the instrument will generate a
standard curve and use this for sample concentration calculations, see Fig 14.
Fig 14
If the curve fit is not closely matching the data points, the curve type can be changed in
Page 26

─ 20
MR9610 Microplate Reader Operation Manual Chapter 5 Operation Guide
the “Parameters” window on the right of the interface. Below are the 8 curve fitting
types available:
➢ Linear fitting (Minimum Standards required: 2)
➢ Four Parameters Logistic (4PL) (Minimum Standards required: 4)
➢ Quadratic polynomial (Minimum Standards required: 3)
➢ Cubic polynomial (Minimum Standards required: 4)
➢ Quartic polynomial (Minimum Standards required: 5)
➢ Point-to-point (Minimum Standards required: 2)
➢ Cubic Spline (Minimum Standards required: 3)
➢ Logit/Log (Minimum Standards required: 2)
The absorbance values and concentration values of the standards are set to a curve.
The
SmartReader supports the following types of curve fittings that can be chosen to best fit
the standard curve. When R2 value is closest to 1.0, this indicates an optimized curve
fit.:
➢ Linear/Linear (Linear fitting of absorbance value and corresponding concentration)
➢ Linear/Log (Linear fitting of absorbance value and the logarithm of the
concentration)
➢ Log/Linear
➢ Log/Log
Note: In order to generate a curve, standard wells must be set up on the Protocol
Layout Interface. Some curve types require a minimum quantity of
standards. In the event of a “curve fit failure”, additional standards and
concentration values may need to be included in the layout settings.
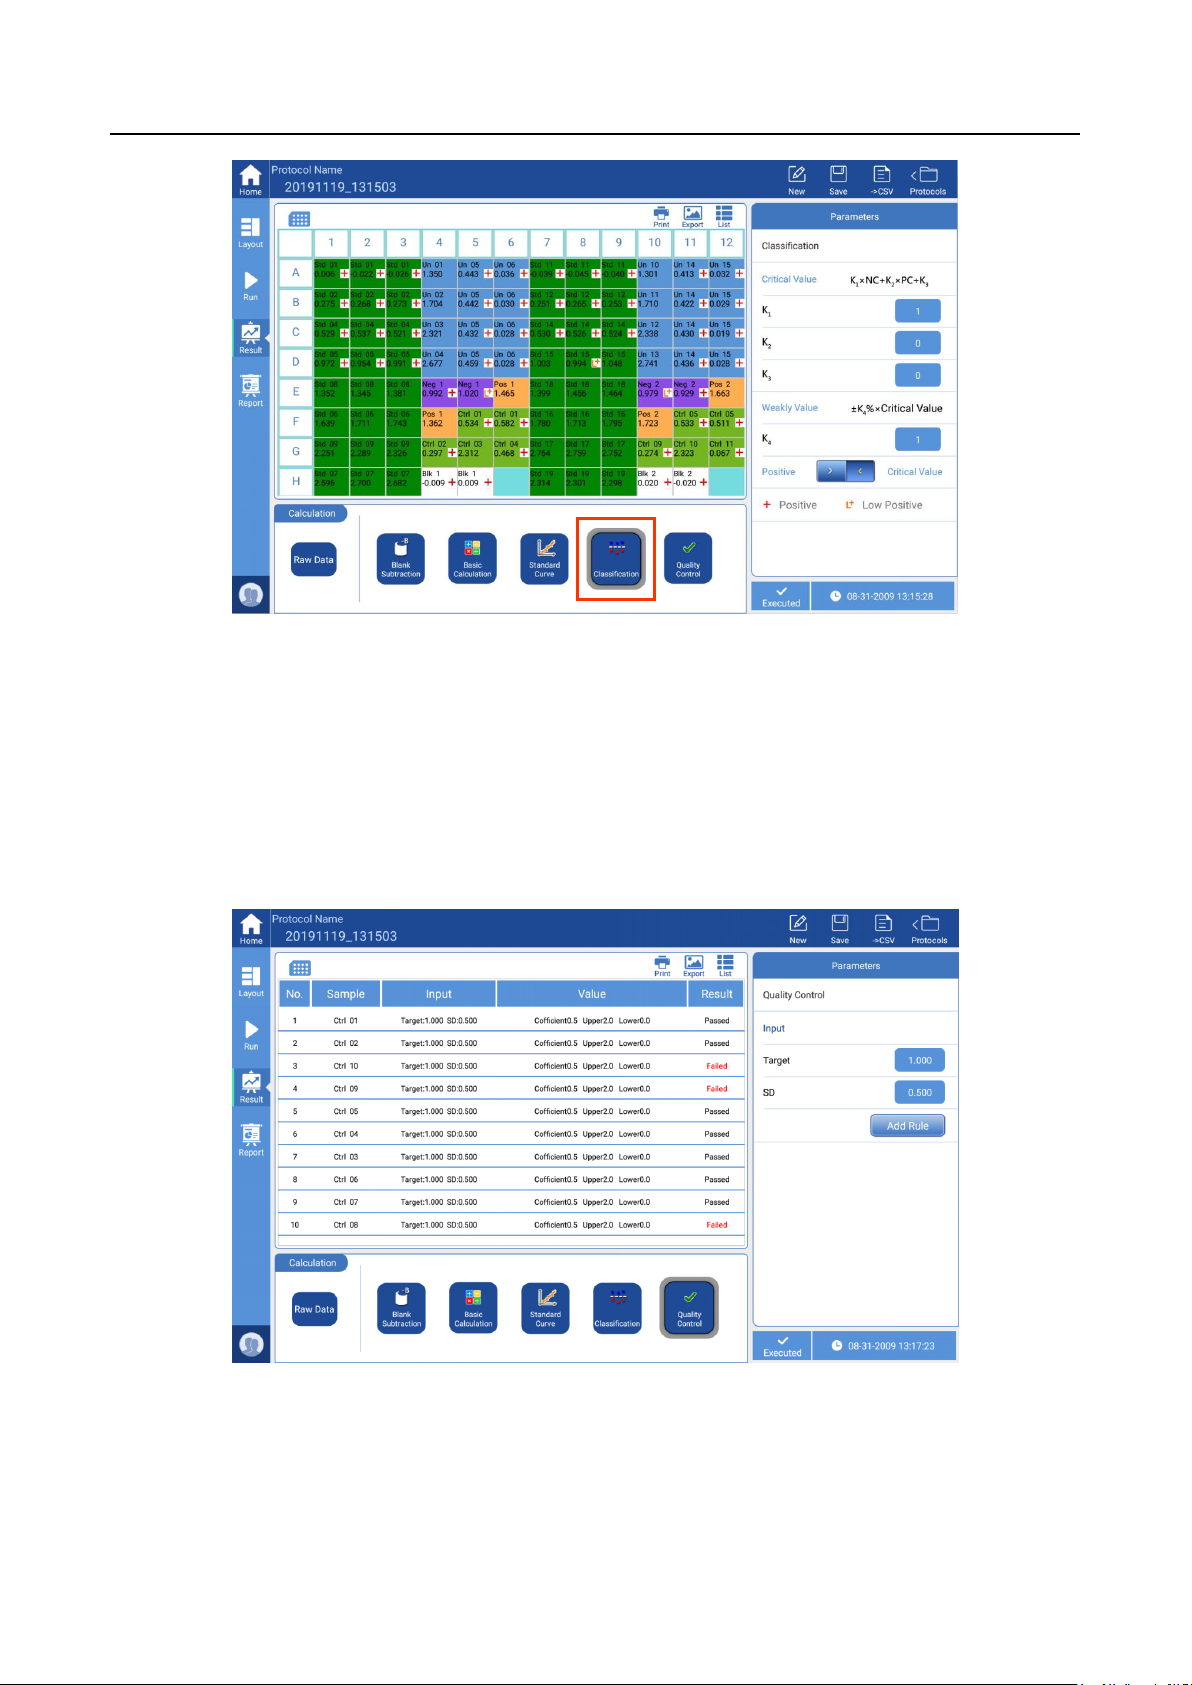
⚫ Qualitative analysis: Samples can be qualitatively analyzed in relation to negative
and positive references as set up in the plate layout. (see Fig 15). A formula is set
up (on the right side of the interface), for calculating and marking positive “ ”,
weak positive “ ”, or negative (no marking) sample wells automatically. Enter the
appropriate values to create the formula for the “critical value”, “weak value”, and
select if positive result will be > or < the critical value.
Page 27
─ 21
MR9610 Microplate Reader Operation Manual Chapter 5 Operation Guide
Fig 15
Note: The Protocol layout interface must be set with at least one positive or negative
well, or the “Classification” button will not be available. See Fig. 15
⚫ Quality Control: Click “Quality Control” button, (see Fig 16), the main display area
will turn out to be a list, it displays status of the quality control wells which have set
previously, the instrument will mark the samples according to conditions set in
“Parameters “Parameters”.
Fig 16
Note: protocol layout interface must be set with “Quality” wells, otherwise, this
button will be not available.
Page 28
─ 22
MR9610 Microplate Reader Operation Manual Chapter 5 Operation Guide
5.2 Kinetics
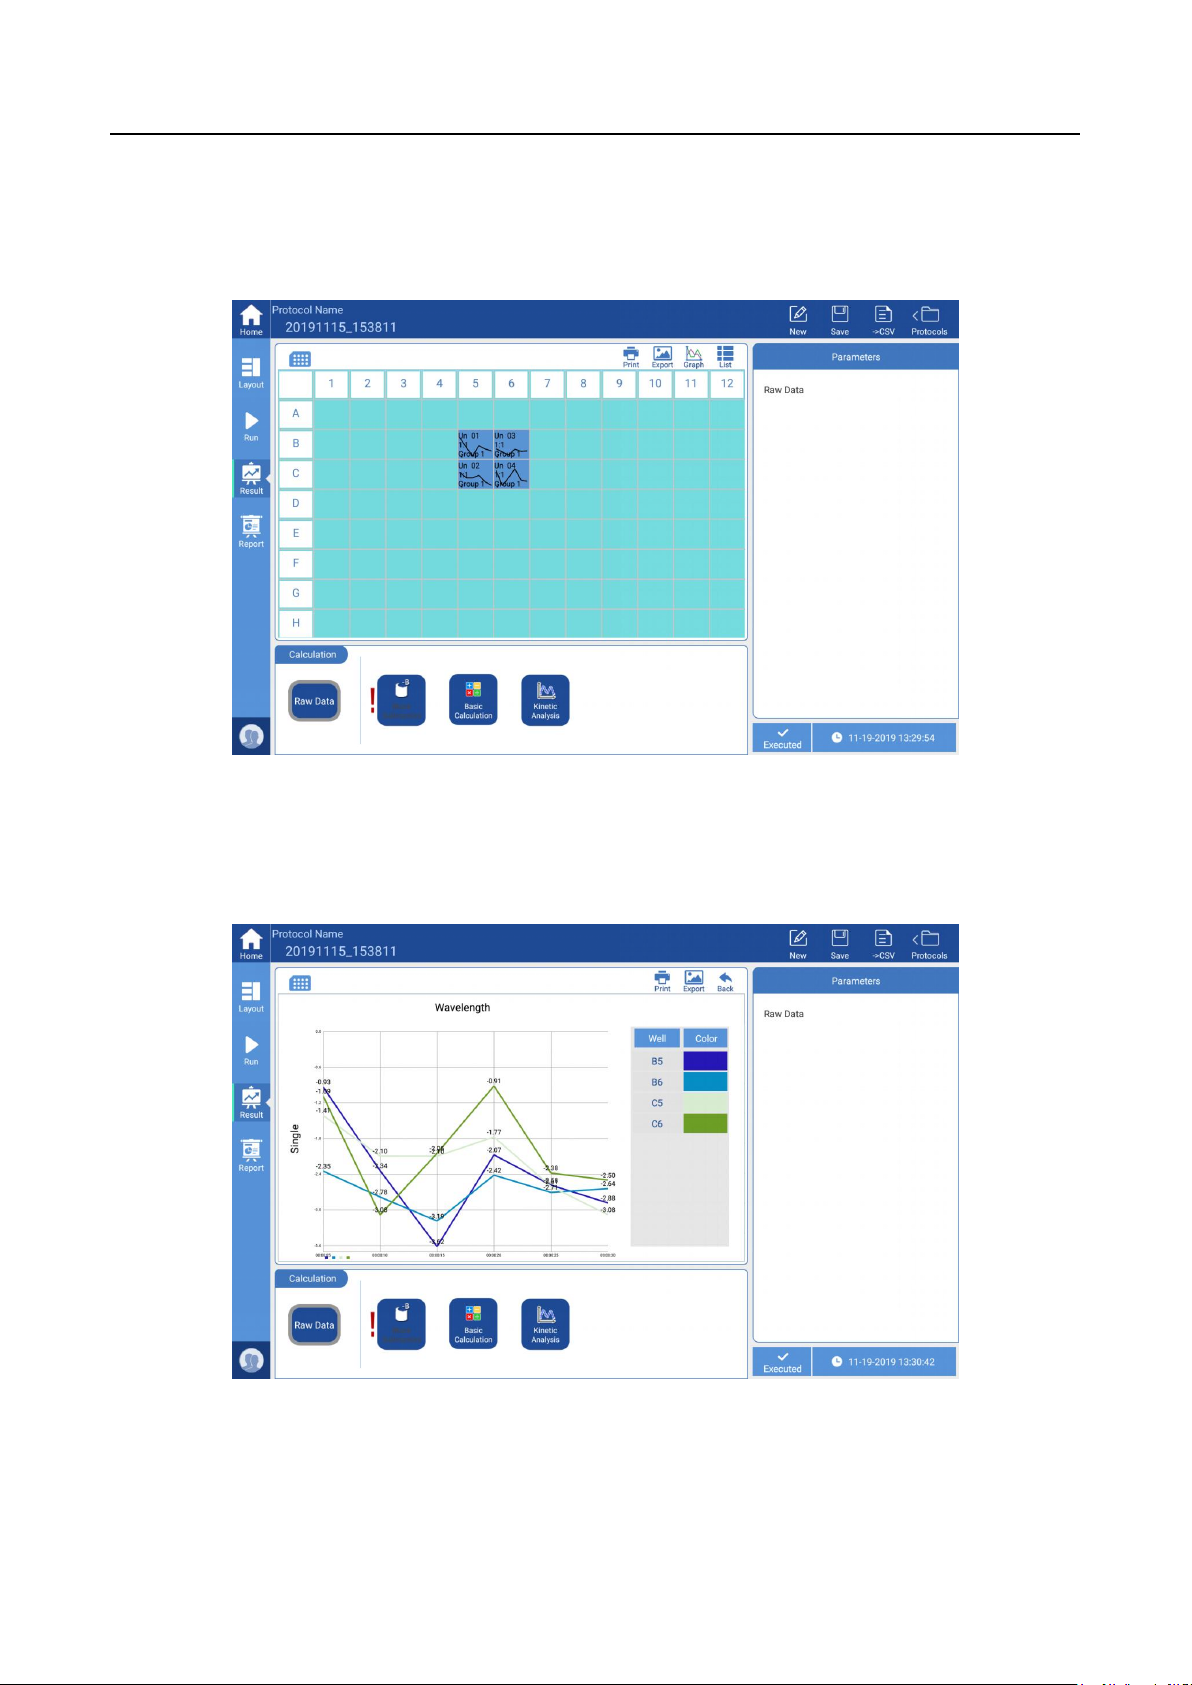
After a kinetic type assay, the results screen will display small graphs inside the
squares instead of absorbance values (see Fig 17).
Fig 17
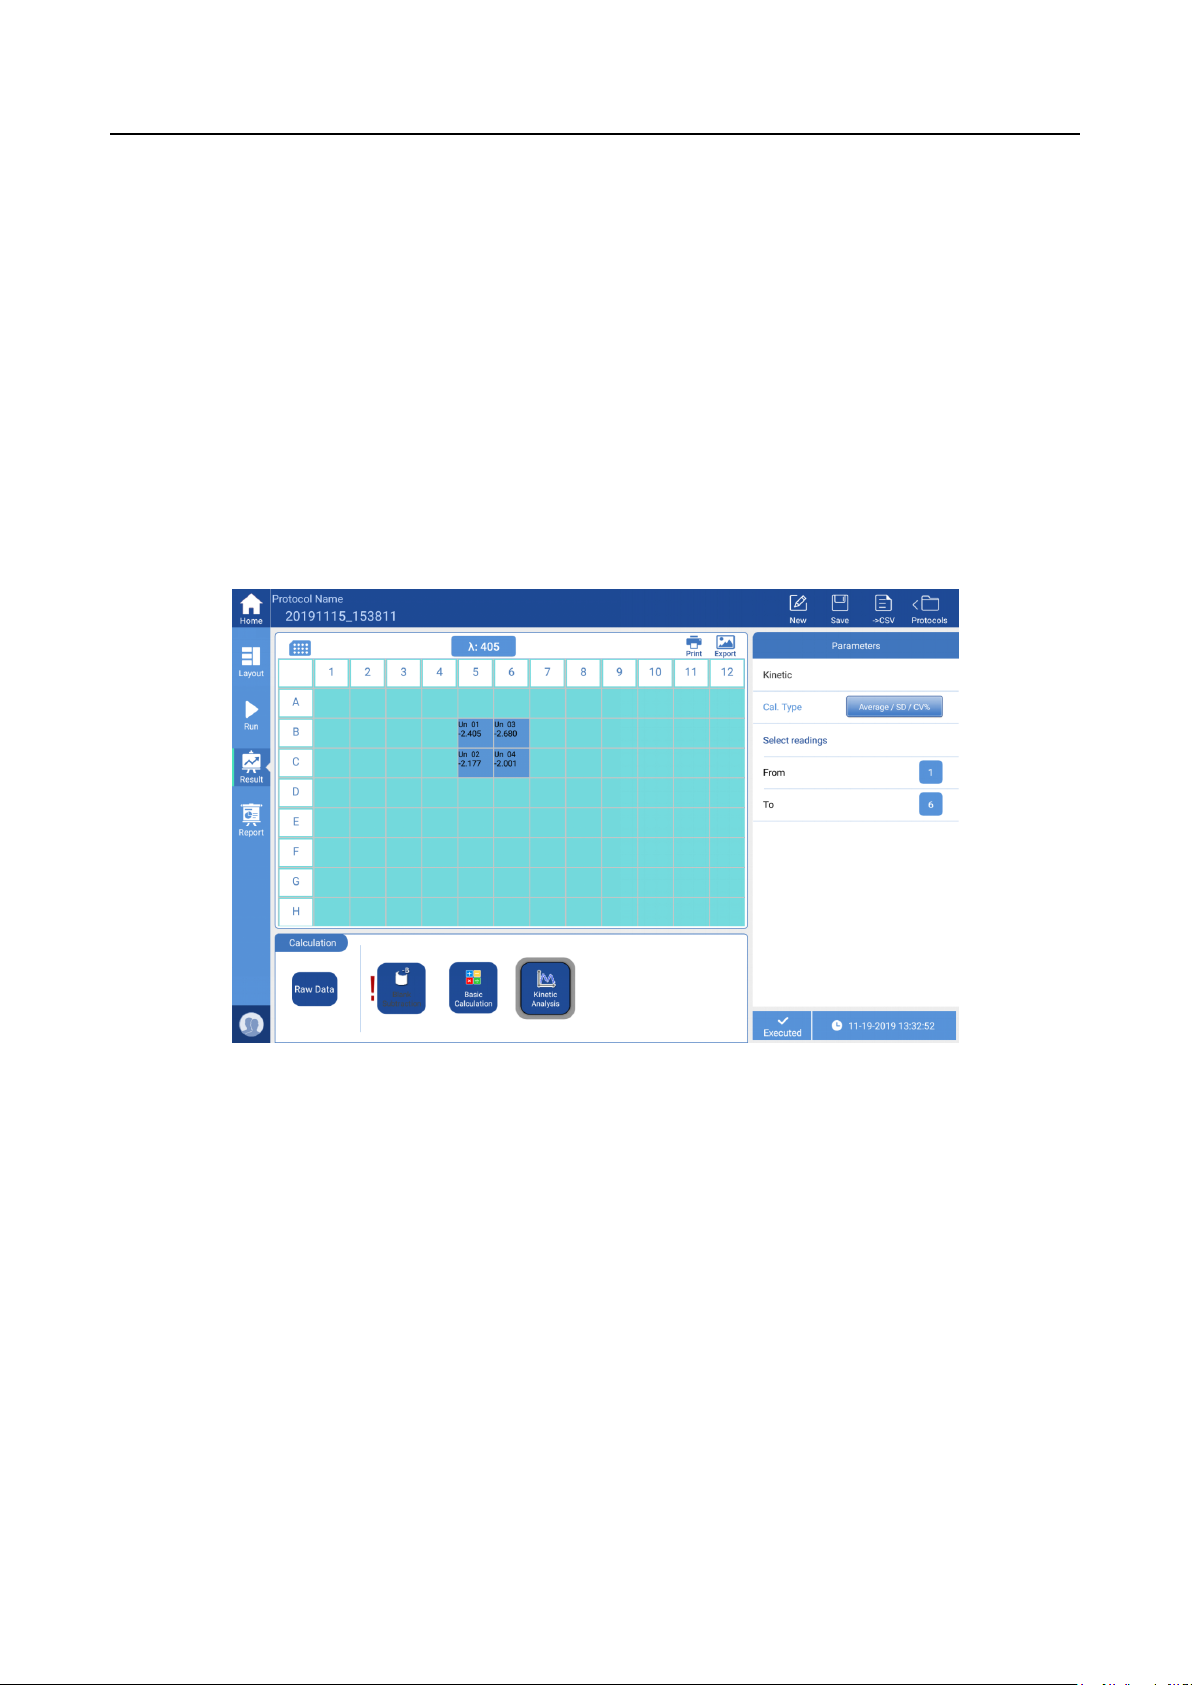
To see the detailed absorbance results for a specific well, select the target well, then
click the “Graph” button at the top right to enlarge the kinetic curve (see Fig 18). Click
“Back” to return to the main interface.
Fig 18
The “Calculation” window at the bottom offers four selections: “Raw Data”, “Blank
Subtraction”, “Basic Calculation” and “Kinetic Analysis” (see Fig 18).
For functions and algorithms of “Raw Data”, “Blank Subtraction” and “Basic Calculation”,
Page 29
─ 23
MR9610 Microplate Reader Operation Manual Chapter 5 Operation Guide
please see Section 5.1.
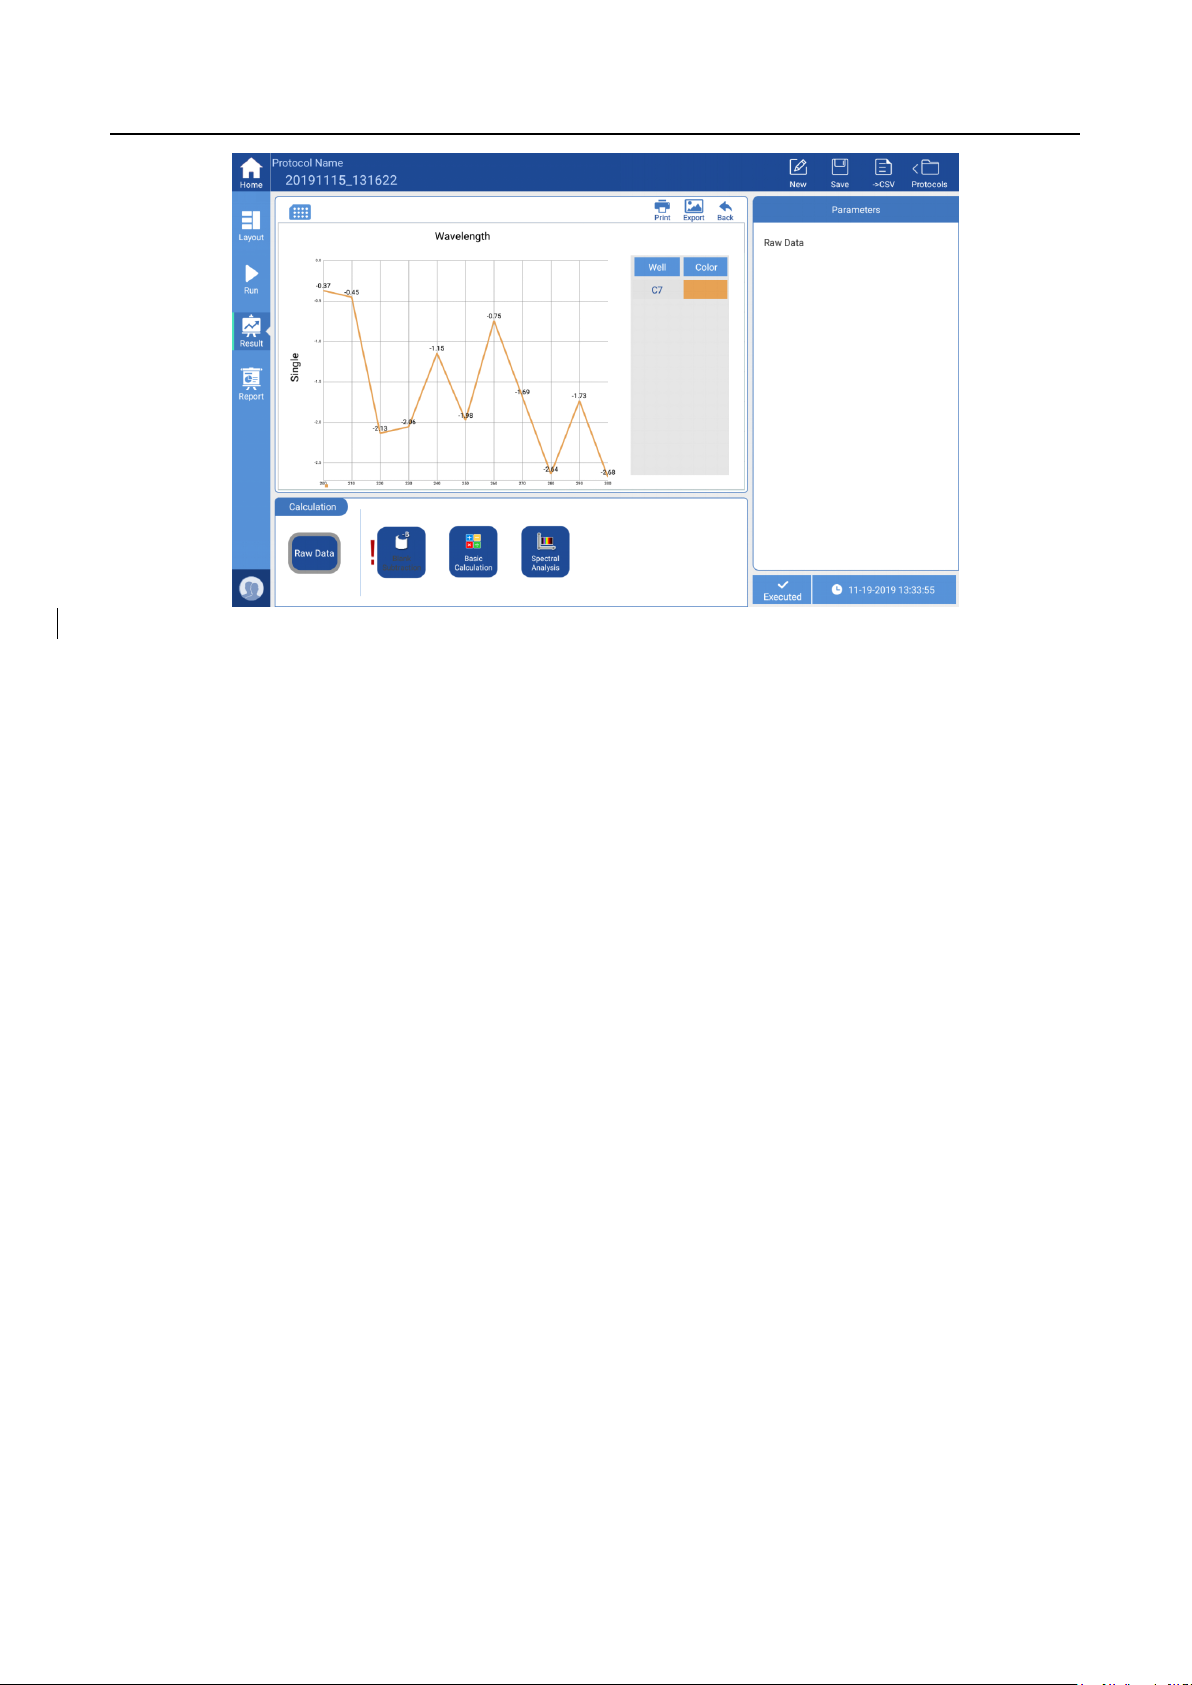
Clicking the “Kinetic Analysis” button, the window on the right side will offer different
calculation options, (see Fig 19).
The calculations available include:
➢ Average/SD/CV%
➢ Integral
➢ Baseline Subtraction
➢ Select Single Reading
➢ Select Reading Range
➢ Maximum Rate
➢ Maximum (Peak)
Fig 19
Page 30
─ 24
MR9610 Microplate Reader Operation Manual Chapter 5 Operation Guide
Fig 20
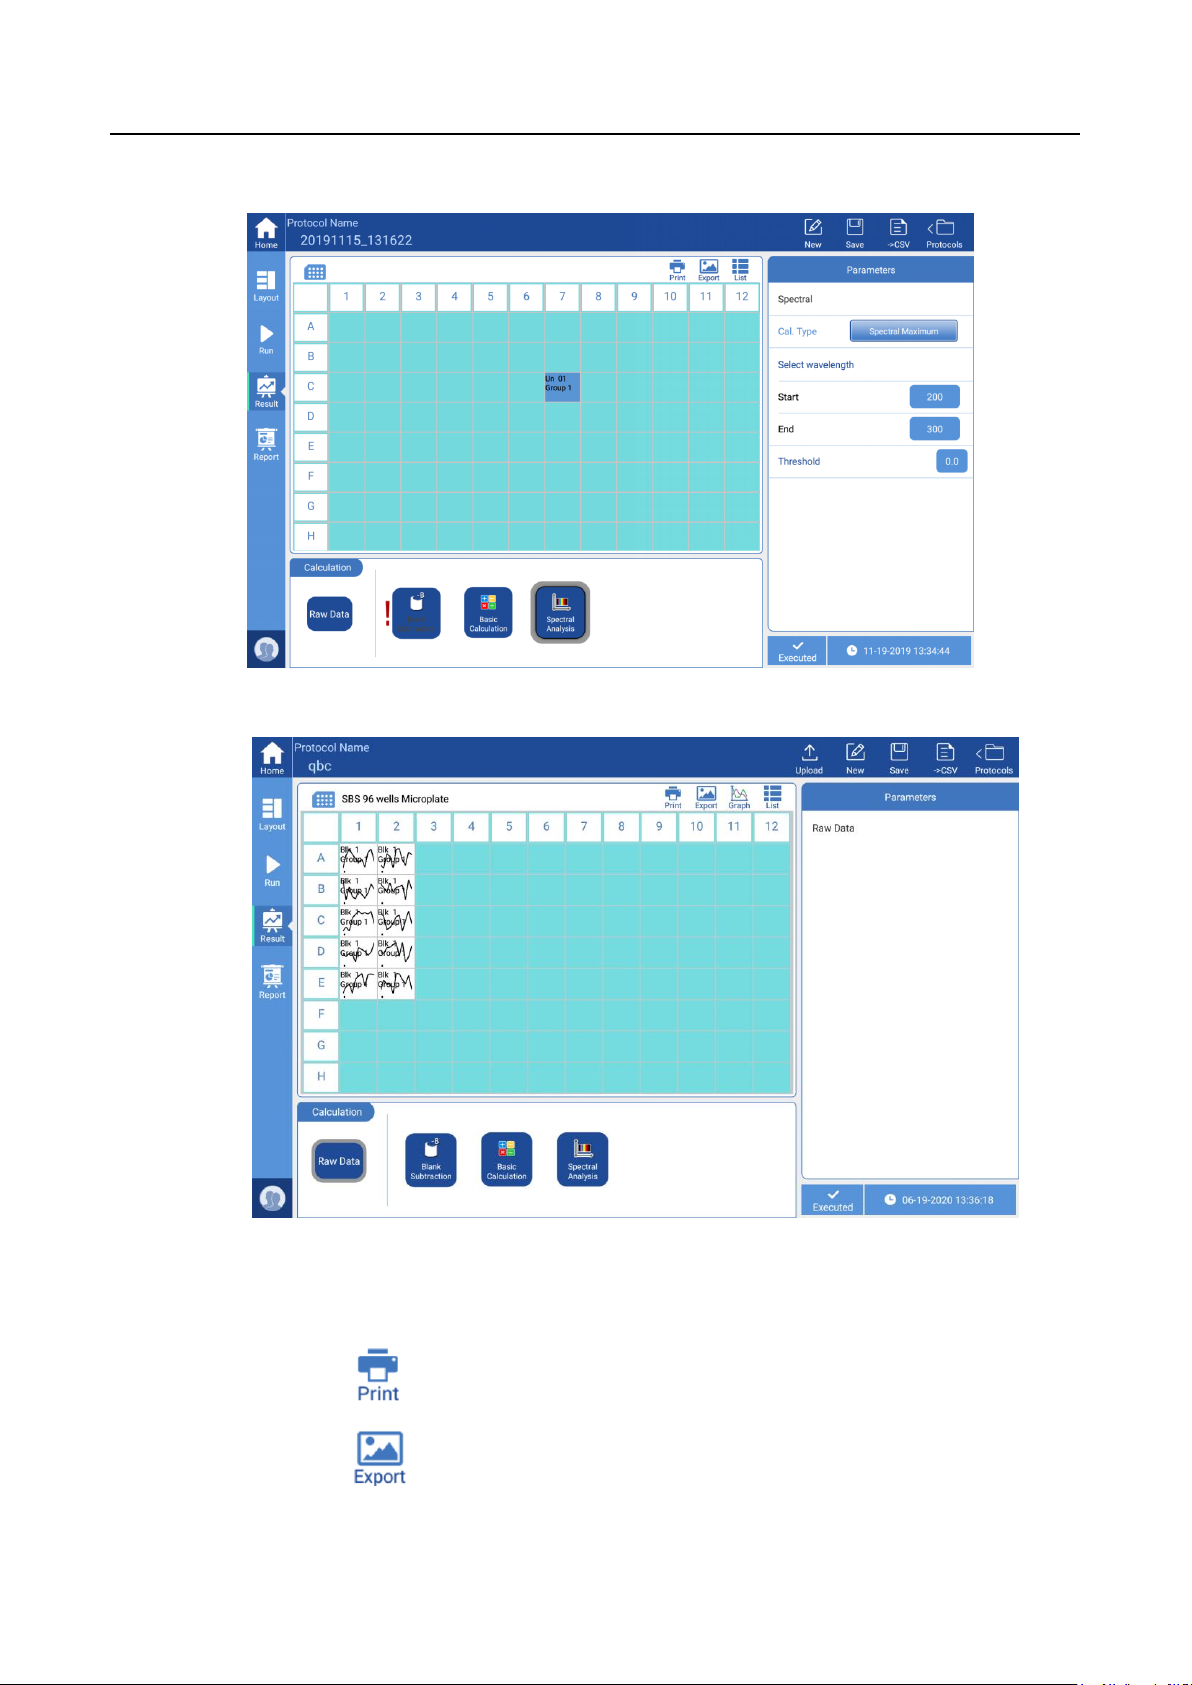
5.3 Spectral Analysis
See Fig 20 (above), select the target wells. click “Graph” button to enlarge the spectral
curve, the absorbance of each wavelength shown on the curve. Users can click the “Back”
button to return to the main interface.
Click “Spectral Analysis”, see Fig 21, for further analysis.
Calculations available:
➢ Spectral Maximum: read the maximum value greater than the threshold value
within a set range.
➢ Spectral Normalization:set the spectral range, take the maximum absorption peak
as 1, the remaining values will be converted into percentage based on this
criterion.
➢ Ratio within the Spectrum: set two wavelength values λ1 and λ2, calculate the
value of λ1/λ2.
➢ Select Wavelength Range:read measurement values within a set wavelength
range.
Page 31
─ 25
Print the current content of the main display area to a
connected thermal printer
Export the current content of the main display area as an
image file to a flash drive.
MR9610 Microplate Reader Operation Manual Chapter 5 Operation Guide
➢ Select Single Wavelength :read the measurement value of a single wavelength.
Fig 21a
Fig 21b
Description of each button on the upper right corner of the main display area:
Page 32
─ 26
Choose a well to view the kinetic curve, the “Graph”
button can enlarge the curve, see Fig 17, “Back” is to
return to the main interface.
Switch from plate layout view to a data list display, click
the “Plate” button in the upper right corner to switch back
to the plate layout display.
Restore the zoom function
Return to the previous interface
MR9610 Microplate Reader Operation Manual Chapter 5 Operation Guide
6. Report exporting
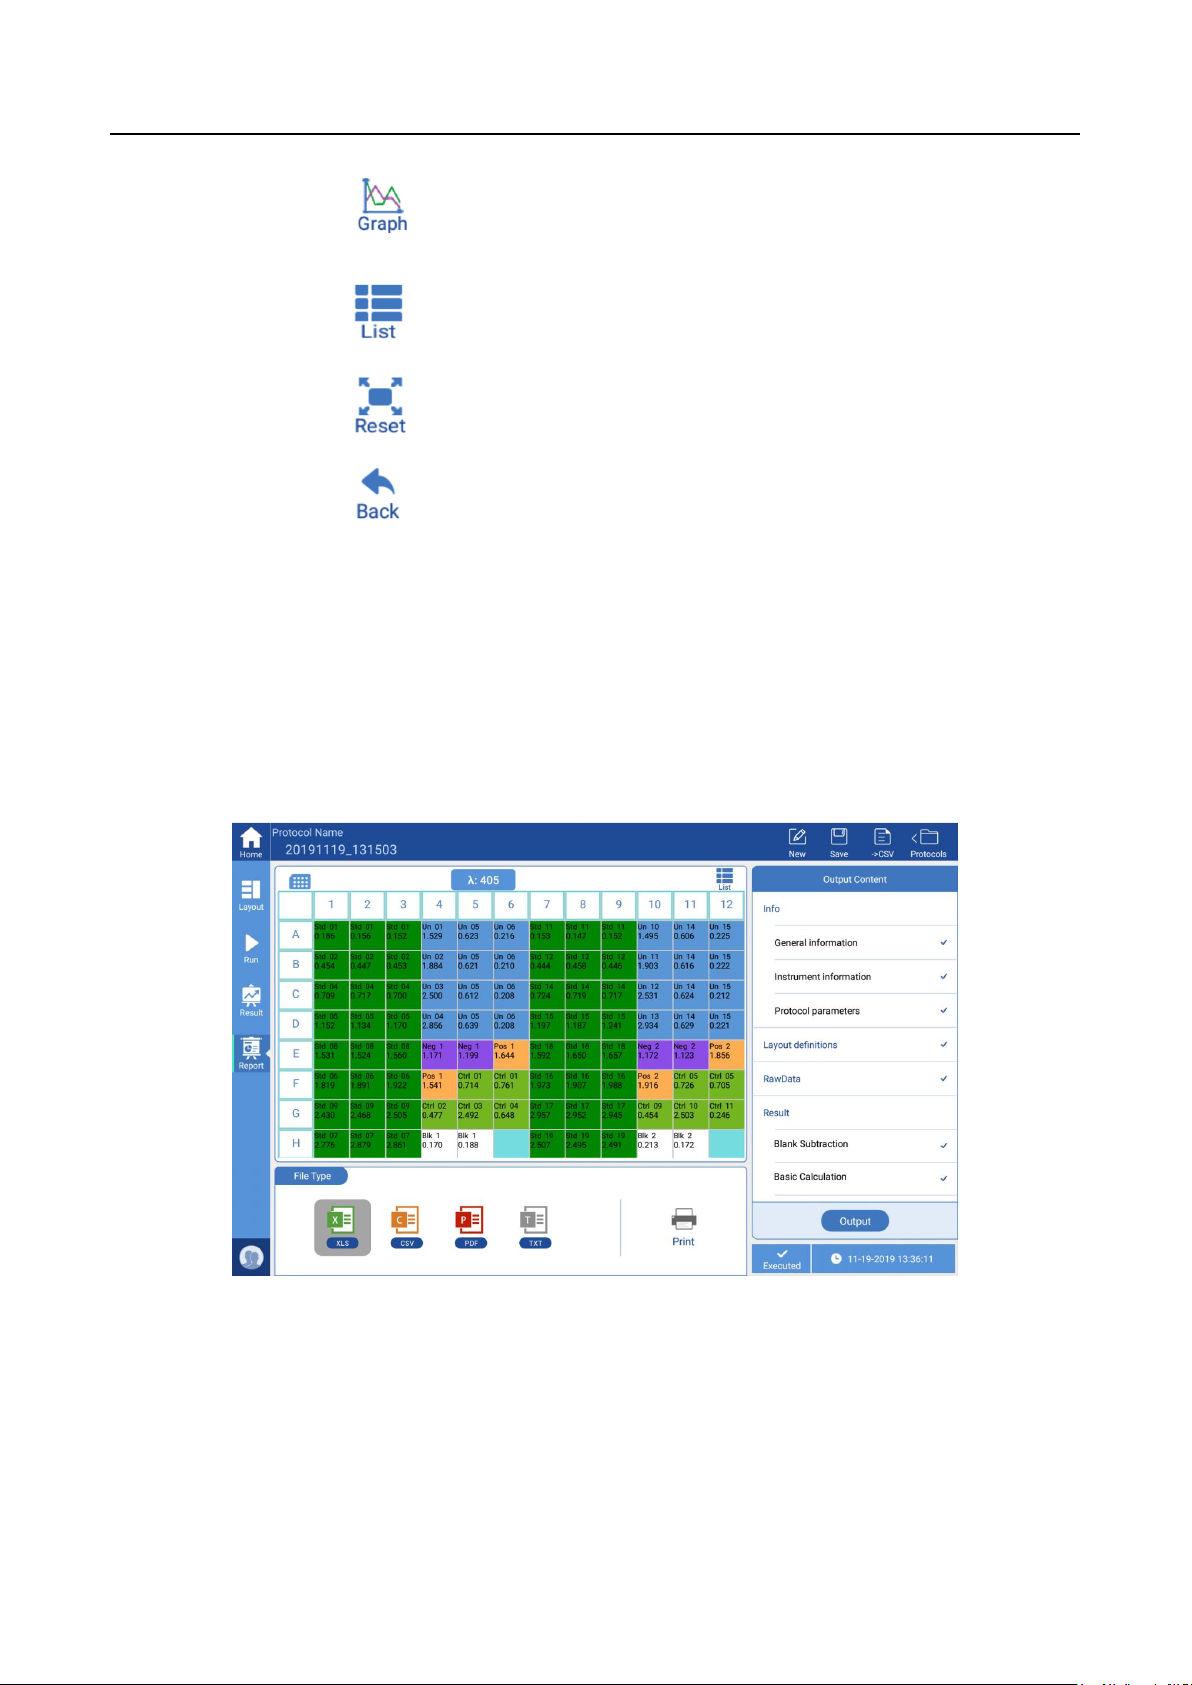
Both processed data and raw data can be exported, click the “Report” button on the left side menu,
see Fig 22.
Fig 22
Choose the desired format in the “File Type” window at the bottom, four formats are
available:
◼ XLS
◼ CSV
◼ PDF
◼ TXT
Page 33

─ 27
MR9610 Microplate Reader Operation Manual Chapter 5 Operation Guide
Choose the content to export in “Output Content” on the right side, “√” will appear next
to the selected content, then click “Output” to export data to a flash-drive.
“Print”: The print function can only be used to print the instrument’s basic information,
including instrument serial number, software version etc.
7. Power off
Press the “Plate in/out” button to remove the ELISA plate from the Reader, then press
the button again to insert the empty plate holder back into the chamber.
Turn off the power switch on the back of the instrument.
Page 34

─ 28
Content
Daily
Weekly
Annually
When
needed
Make sure the instrument powers off correctly
√
Keep the instrument away from dust
√
Remove spilled solutions right away to prevent
damage, then clean it with distilled water.
√
If any surface has been contaminated with
biohazardous materials , sterilize it using a
disinfectant.
√
Clean instrument housing regularly.
√
Clean the plate holder when necessary.
√
Maintenance
√
MR9610 Microplate Reader Operation Manual Chapter 6 Maintenance, storage, transportation
Chapter 6 Maintenance, storage, transportation
1. Maintenance
⚫ Keep the installation environment dry and clean to prevent moisture, corrosion,
and strong electromagnetic interference sources.
⚫ The SmartReader Instrument is calibrated before it leaves the factory. There are
no user-serviceable parts inside, so please do not attempt to open the housing. If
any defects or operation problems arise, please contact your distributor or Accuris
Instruments at 908-769-5555 or [email protected].
⚫ Do not switch on and off the power abruptly, as this can damage the electronics.
⚫ Make sure to connect the SmartReader to an appropriate power outlet (voltage
and Hz) as stated on the instrument rating plate.
⚫ Maintenance list
2. Storage and transportation
⚫ When not in use, store the instrument at a temperature range -10℃~40℃,
relative humidity less than 80%, without corrosive gas and with good ventilation.
⚫ Prevent from heavy vibrations and humidity during transportation.
Page 35

─ 29
No
.
Trouble description
Possible reason
Solution
1
The Microplate Reader
cannot be started
Power supply failure
a. Check that there is power to the
instrument
b. Make sure that all power cords
are connected properly
c. Confirm that the wall voltage is
correct.
2
“Communication
timeout” during
self-checking
Instrument not
working
Restart the instrument and try again;
if the problem persists, please
contact your distributor or Accuris
Instruments.
3
“E913, E923, E933,
E943” during
self-checking
Insufficient light
intensity
Please contact your distributor or
Accuris Instruments.
4
“E912, E922, E932,
E942” when
self-checking
Light intensity is too
strong
Please contact your distributor or
Accuris Instruments.
5
“E911, E921, E931,
E941” when
self-checking
Excessive dark
current
Please contact your distributor or
Accuris Instruments.
6
“E612, E622, E632,
E642” when
self-checking
Detection module
failure
Please contact your distributor or
Accuris Instruments.
7
“E401, E403, E415,
E425, E435, E445”
when self-checking
Motor failure
Please contact your distributor or
Accuris Instruments.
8
“E011~E056” when
self-checking
Incubation failure
Please contact your distributor or
Accuris Instruments.
9
Test results are greatly
deviated or all are zero
Xenon lamp
damaged
Restart the instrument and try again;
if the problem persists, please
contact your distributor or Accuris
Instruments.
10
Elisa plate holder not
properly moving in or
out
Something is
obstructing the
movement
Check for any objects around the
plate holder, if the plate cover is
raised, or if the plate is not inserted
properly
11
Abnormal noise occurs
during running
The Elisa plate is
not correctly seated
or the plate cover is
not seated
a. Check Elisa plate
b. If the noise still occurs there when
running without a plate, restart the
instrument
c. If noise persists, please contact
your distributor or Accuris
Instruments.
MR9610 Microplate Reader Operation Manual Chapter 7 Troubleshooting
Chapter 7 Trouble shooting
Page 36

─ 30
12
Test results are
unstable
Light path failure
Check that the plate is properly
seated, if liquid has spilled out and
whether the front door is working
correctly, then re-start the
instrument. If problem still occurs,
contact your distributor or Accuris
Instruments
13
Instrument stops
running during
detection
Communication
breakpoint
Press “stop”, restart the detection
MR9610 Microplate Reader Operation Manual Chapter 7 Troubleshooting
Page 37

MR9610 Microplate Reader Operation Manual Chapter 8 Accessories
31
No.
Item
Type
Unit
Qty
Remarks
1
Power cord
PCS
1
2
AC/DC Power Adapter
24V 160W
PCS
1 3
Mouse
Logitech
PCS
1 4
Performance test statement
PCS
1 5
Operation Manual
PCS
1 6
Packing List
PCS
1
7
Flash Drive
PCS
1
8
Certification
PCS
1 9
Chapter 8 Accessories
Page 38

32
Memo
 Loading...