

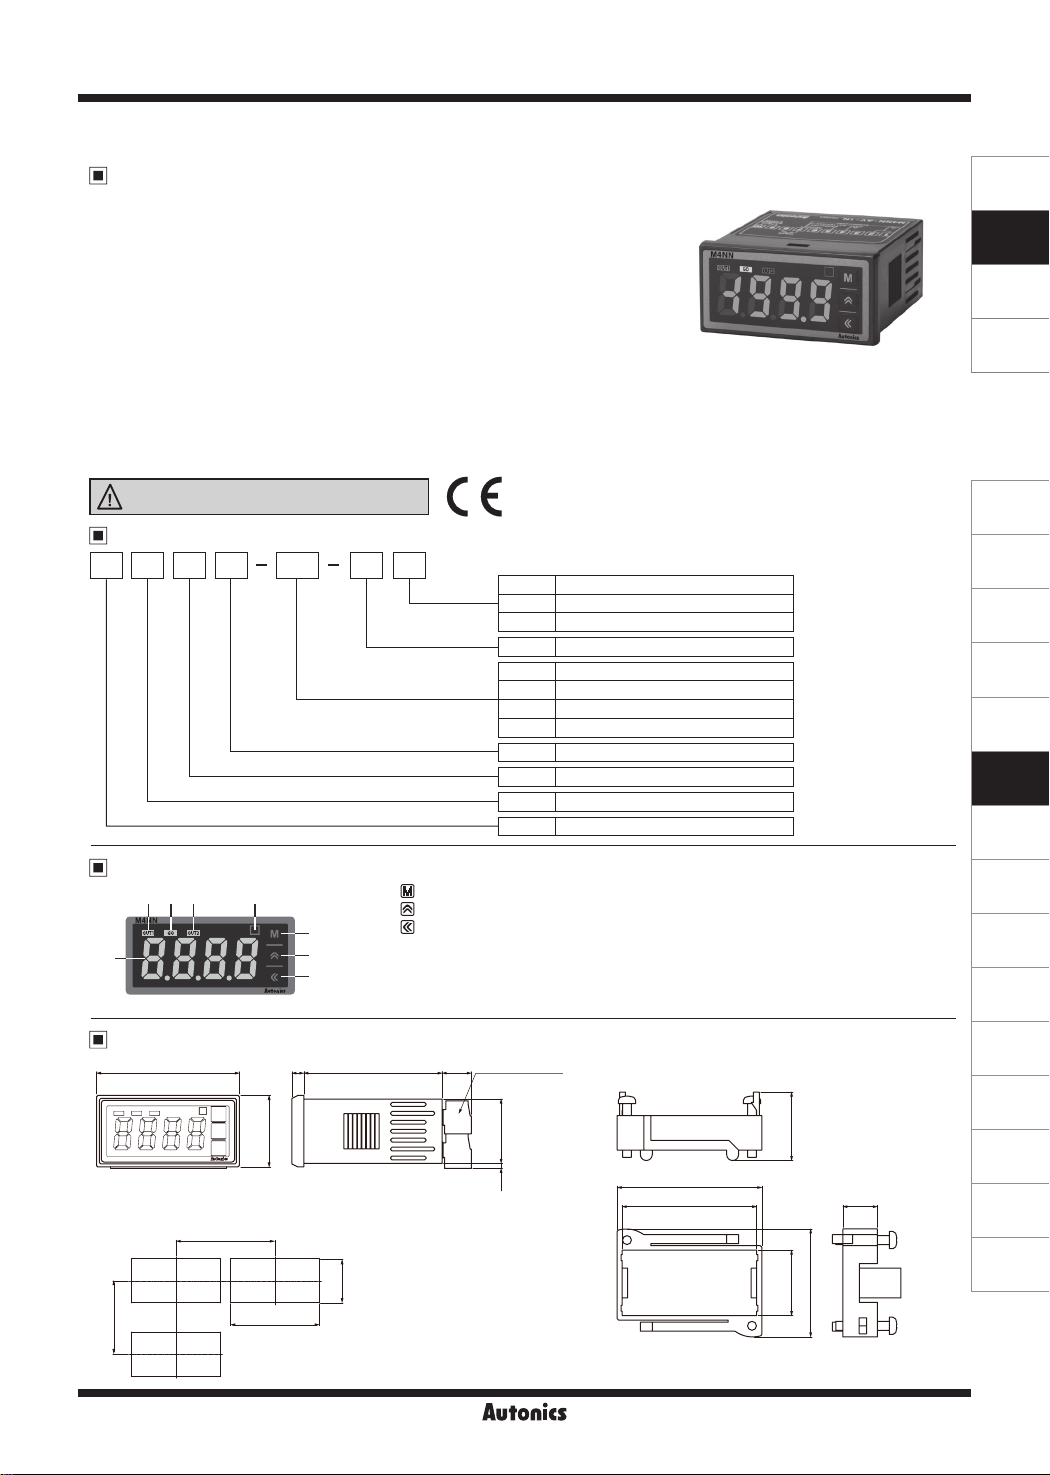
DIN W48×H24mm Small Digital Multi Panel Meter
Features
● Various input options (by model)
- Input options: DC voltage, DC current, AC voltage, AC current
● Isolated input and power modules allow powering of multiple units
using a single power supply
● Display range: -1999 to 9999
● High/low-limit display scale function
● AC frequency measurement (range: 0.1 to 9999Hz)
● Preset output mode: OUT1, GO, OUT2 (NPN/PNP open collector output)
● Power factor display function: displays analog outputs (1-5V, 4-20mA)
from power factor converters as -0.50 to 1.00 to 0.50
● Various functions: peak display value monitoring, display cycle delay,
zero-point adjustment, peak display value correction
● Power supply: 5-24VDC (isolated type)
Please read “Safety Considerations”
in the instruction manual before using.
~~
__
Ordering Information
M 4 N N 1 NDV
Size
Digit
Item
-
Type
__JI C €
-19
Measurement function (input)
Output
Power supply
N Indicator
1 NPN open collector output
2 PNP open collector output
I I
1 5-24VDC
I I I
DV DC Voltage (minus input)
DA DC Current (minus input)
AV AC Voltage
AA AC Current
N New Type
7 7
N DIN W48×H24mm
7
7
7
I
4 9999 (4-digit)
I
M Mul i Meter
I
M4NN Series
l
I
I
SENSORS
CONTROLLERS
MOTION DEVICES
SOFTWARE
(J)
Temperature
Controllers
(K)
SSRs
(L)
Power
Controllers
(M)
Counters
(N)
Timers
(O)
Digital
Panel Meters
(P)
Indicators
Unit Description
5 6 7 8
2
1
~~-
---------
Dimensions
=ir---------
48
~~~~=
※
Indicator model does not have transistor output terminal.
●Panel cut-out
Min. 50
Min. 37
3
4
4
24
~
+ 0.6
45
0
1. Measurement value display part
2. Key: MODE key
3. Key:
4.
5. OUT1 (red): OUT1 output indicator of preset
6. GO (green): GO output indicator of preset
7. OUT2 (red): OUT2 output indicator of preset
8. Unit sticker
46.5
■
;:Hq
0
0.3
22.2
Key
Up key
: Shift key
9.8
Transistor
output terminal
21.6
1.7
r
Autonics
●Bracket
En
b
I I
jJ
48.6
45.2
0
(Q)
Converters
(R)
Digital
Display Units
(S)
Sensor
Controllers
(T)
(unit: mm)
2322
11.6
36.3
Switching
I----
Mode Power
Supplies
(U)
Recorders
(V)
HMIs
(W)
Panel PC
(X)
Field Network
Devices
~
O-37
M4NN Series
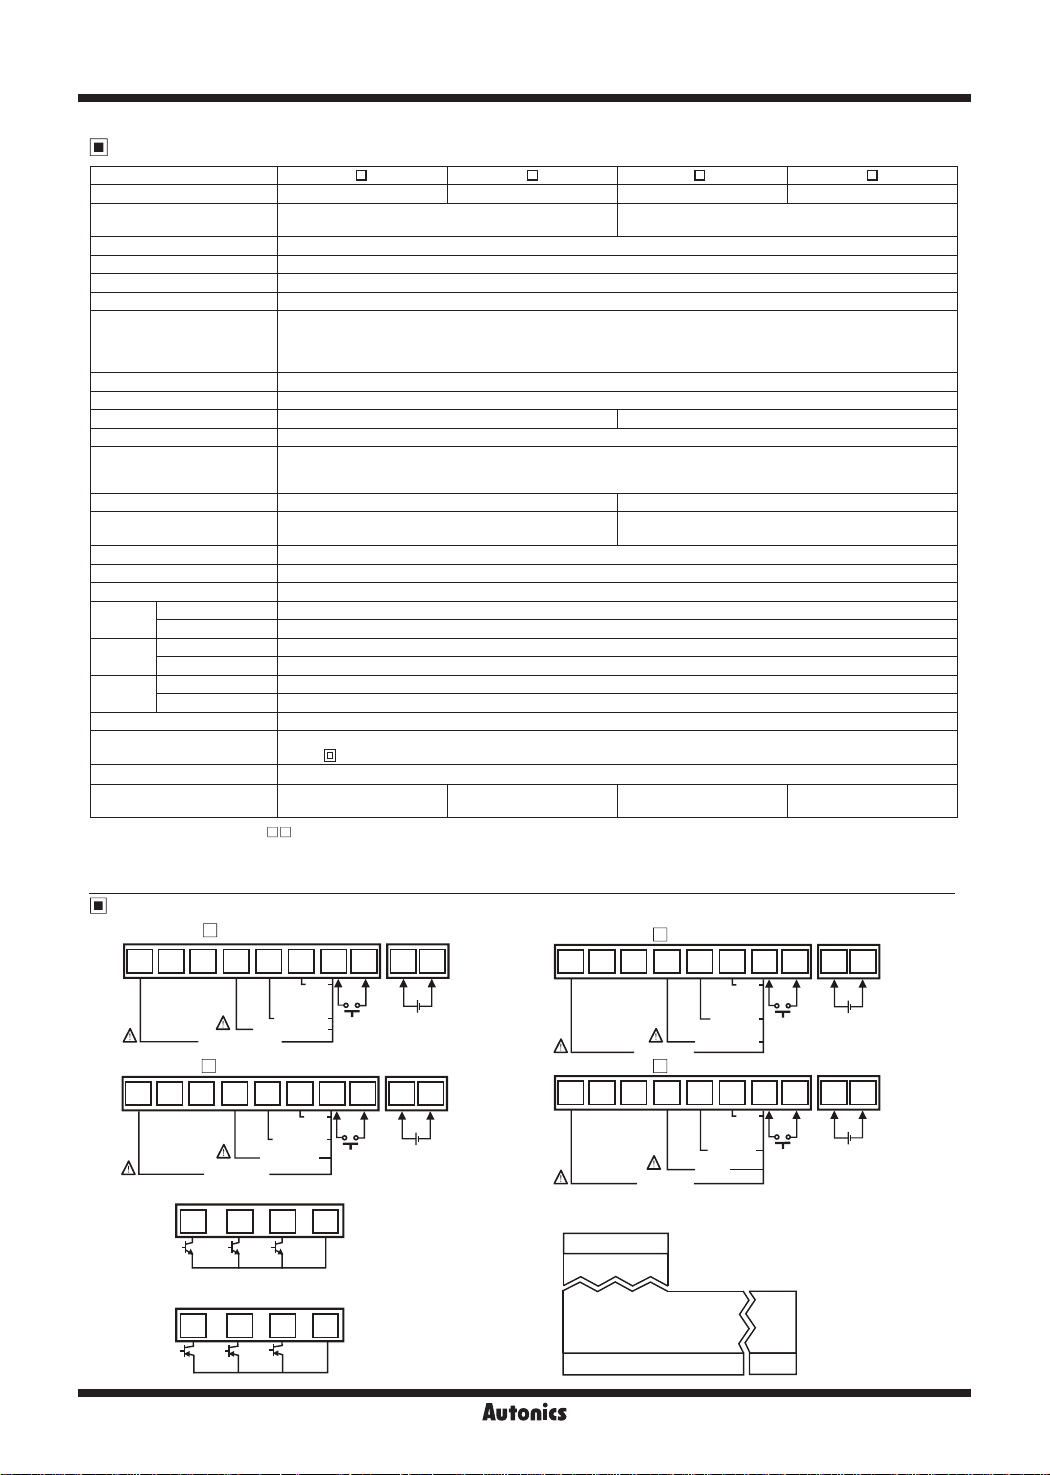
Specifications
Model M4NN-DV-1
Measurement input DC voltage DC current AC voltage, frequency AC current, frequency
Max. allowable input
Power supply 5-24 VDCᜡ
Allowable voltage range 90 to 110% of the rated voltage (5V is xed for lower limit)
Power consumption Max. 3W
Display method 7-segment LED display (red) (character height: 11mm)
Display accuracy
Display cycle 0.1 to 5.0 sec (selectable by 0.1 sec)
A/D conversion method Practical oversampling using successive approximation ADC
Sampling cycle 50ms (resolu ion 1/12,000) 16.6ms (resolution 1/12,000)
Max. display range -1999 to 9999 (4-digit)
※
Preset output
AC measurement
Frequency measurement
Insulation resistance Over 100MΩ (at 500VDC megger)
Dielectric strength 2000VAC 50/60Hz for 1 min (between all terminals and case)
Noise immunity ±2kV the square wave noise (pulse width: 1㎲) by the noise simulator
Vibra ion
Shock
Environment
Connection Plug/Socket terminal block (accessory)
Insulation type
Approval
Weight
※
1: Indicator model (M4NN-
※
2: AC, frequency measurement functions are only for AC measurement type.
※
3: The weight includes packaging. The weight in parenthesis is for unit only.
※
Environment resistance is rated at no freezing or condensa ion.
1
※
2
Mechanical 0.75mm amplitude at frequency of 10 to 55Hz (for 1 min) in each X, Y, Z direction for 2 hours
Malfunction 0.5mm amplitude at frequency of 10 to 55Hz (for 1 min) in each X, Y, Z direction for 10 min
Mechanical 100m/s
Malfunction 300m/s
Ambient temperature
Ambient humidity 35 to 85%RH, storage: 35 to 85%RH
※
3
-110 to 110% of the rated measurement input range
(when not using minus input: -10 to 110%)
• 23℃±5℃
• -10 to 50℃-DC/AC Input: ±0.5% F.S. ±3-digit / Frequency: ±0.5% F.S. ±3-digit
NPN/PNP open collector output:
• Load voltage: max. 30VDCᜡ • Load current: max. 100mA
• Residual voltage: max. 1VDCᜡ (NPN), max. 2VDC (PNP)
-
※
2
-
-10 to 50℃, storage: -20 to 60℃
Double insulation or reinforced insulation
(mark:
ᜢ
Approx. 83.6g
(approx. 46.8g)
-1N) does not have output function.
□□
□
-DC Input: ±0.1% F.S. ±2-digit / AC Input ±0.3% F.S. ±3-digit
2
(approx. 10G) in each X, Y, Z direction for 3 imes
2
(approx. 30G) in each X, Y, Z direction for 3 imes
, dielectric strength between the measurement input part and the power part: 1kV)
[Q]
Connections
● M4NN-DV-1
1
□□□□□□□□
&~
● M4NN-AV-1 ● M4NN-AA-1
1 1
l
□□□□□□□□
J
● NPN Open Collector
● PNP Open Collector
O-38
□
2
3
4
5
6
7
8
DC ±1V
/±200mV
DC±10V/±2V
DC ±100V/±20V
& "T"
DC ±600V/±200V
l~~I
-
+
HOLD HOLD
□
2 2
3 3
4 4
5 5
6 6
7 7
8 8
AC 2V/1V
"[[
AC 600V/200V
11 12 13 14
ID
~
OUT1 GO OUT2 COM
11 12 13 14
ID
~
OUT1 GO OUT2 COM
AC 20V/10V
'fJ
AC 110V/50V
□□
DI
5 5 I
□□
DI
3 3 I
l~I
-
+
HOLD
M4NN-DA-1 M4NN-AV-1 M4NN-AA-1
I
I
※
For 5A terminal of current Input, ±0.3% F.S. ±3-digit
※
For 5A terminal of current Input, ±1% F.S. ±3-digit
Approx. 83.7g
(approx. 46.7g)
I
9
10
□
● M4NN-DA-1
1
2
Approx. 110% of the rated measurement input range
Average value (AVG) measurement
Measurement range: 0.100 to 9999Hz
(variable by decimal point position)
Approx. 83.8g
(approx. 46.9g)
□
3
4
□□□□□□□□
+
-
SOURCE
5-24VDC
A &
Lll~
DC ±5A/±2A
□
5
DC ±10mA
DC±100mA
/±20mA
/4-20mA
DC ±1A/200mA
6
7
/±2mA
I
I
Approx. 83.8g
(approx. 46.9g)
I
8
-
+
"T"
□
9 9
10 10
+
-
SOURCE
5-24VDC
□□□□□□
&~
※
Input and output are insulated from the power.
11 12 13 14
Option output
ADC input circuit and
12345678 9 10
&
AC 5A/2.5A
display part
AC500mA
/AC250mA
AC 1A
AC100mA
/AC50mA
-
+
"T"
HOLD
Power
Autonics
□
9
10
l~I
+
-
SOURCE
5-24VDC
l~I
+
-
SOURCE
5-24VDC
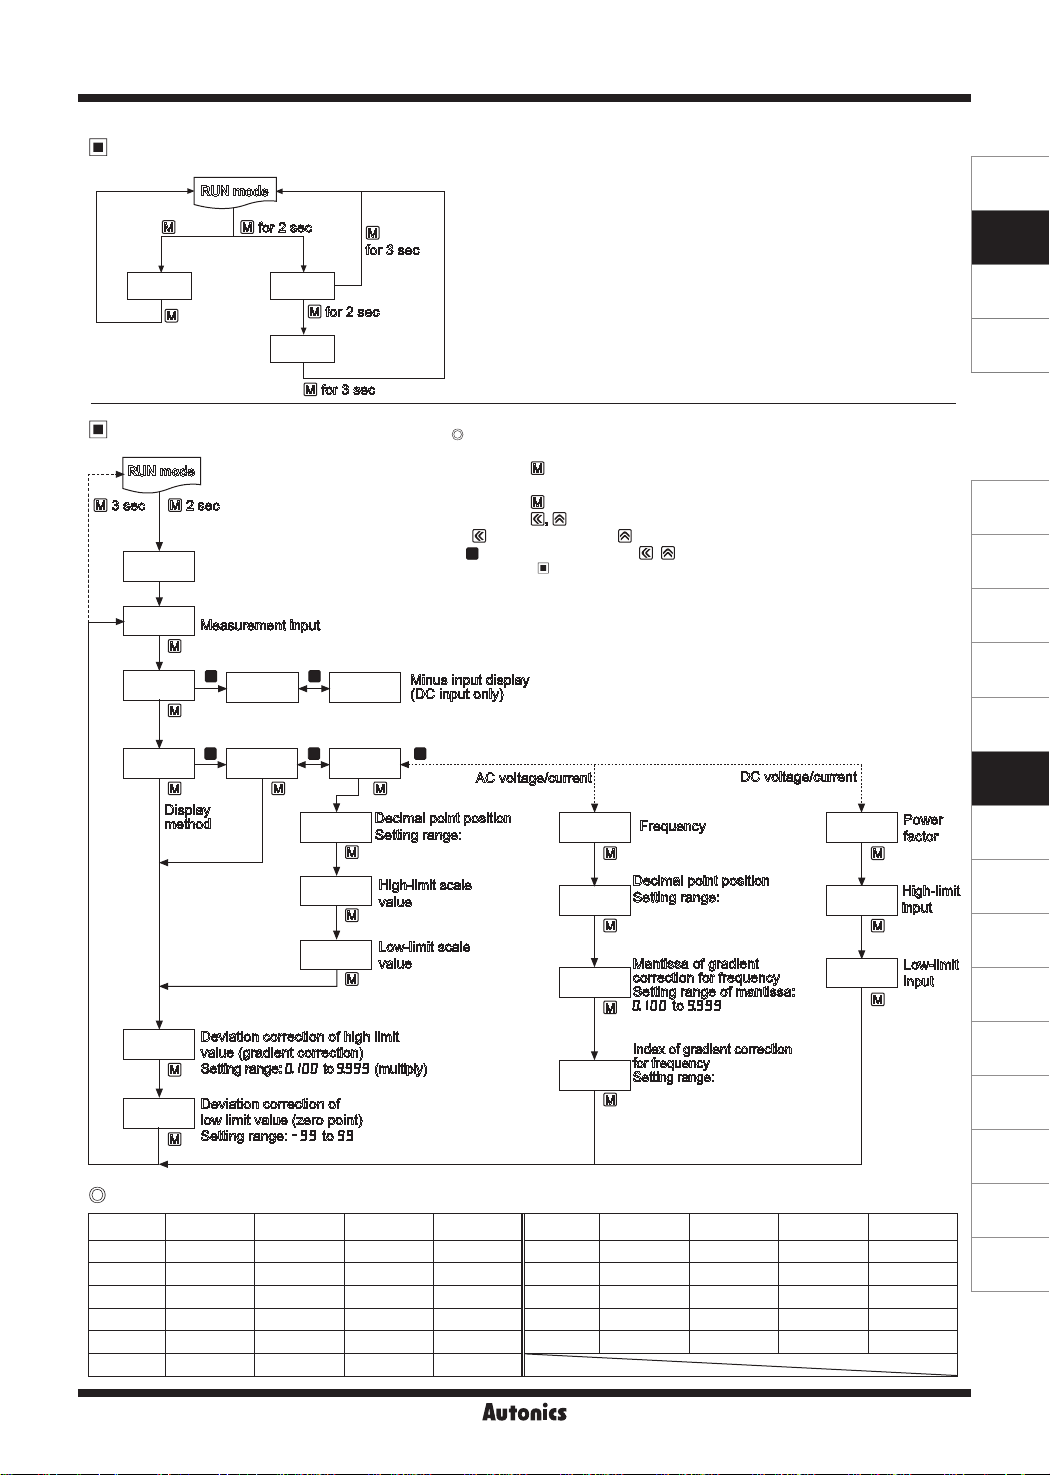
Parameter Settings
N d
Small Multi Panel Meter
SENSORS
ID
PA0 PA1
'----'[iJ
Parameter 1 Group
N
PA1
IN-R
MINU
DISP
INbH
IOI
INbL
IOI
m
ON OFF
STND SCAL
IOI
D v t
v t )
m )
D v
v )
PA2
SS
SS
H-SC
L-SC
f
f
※
1
DOT
Parameter setting
1. Each parameter alternately displays parameter name and the SV in 0.5 sec.
2. Press the key and the SV is saved and it moves to next parameter.
3. If there is no operation for 60 sec, it returns to RUN mode automatically.
4. Press the
5. Press the keys to change the SV at the parameter.
(
※
S
※
1: Refer to
y
D t y
S
D m t
H
v
v
※
1
※
1
0, )0, )00
)000
[ill
keys for 3 sec and it returns to RUN mode.
Im
l~I,~
: moves setting digit, : changes set value)
: Press any key between , .
Measurement Input'.
,
FREQ
DOT
INbH
[iJ
INbE
[iJ
~
~ ~
q y
D m t
M a
f
10 0, 10 1, 10-2, 10-1
0, )0,
)00, )000
q y
t
:
C v n
PF
H-RG
L-RG
P
f
※
1
L
※
1
CONTROLLERS
MOTION DEVICES
SOFTWARE
(J)
Temperature
Controllers
(K)
SSRs
(L)
Power
Controllers
(M)
Counters
(N)
Timers
(O)
Digital
Panel Meters
(P)
Indicators
(Q)
Converters
(R)
Digital
Display Units
(S)
Sensor
Controllers
(T)
Switching
Mode Power
Supplies
(U)
Recorders
(V)
HMIs
Factory default
Parameter M4NN-DV M4NN-DA M4NN-AV M4NN-AA Parameter M4NN-DV M4NN-DA M4NN-AV M4NN-AA
IN R 600V 5A 600V 5A INbH !000 !000 !000 !000
MINU ON ON
- -
DISP STND STND STND STND H RG 600 %00
DOT 0 0 0 0 L RG 600 %00
H SC 600 500 600 5000 INbE
INbL 00 00 00 00
- -
- -
- -
10 0 10 0
L SC 600 500 0 0
Autonics
O-39
(W)
Panel PC
(X)
Field Network
Devices

M4NN Series
Parameter 2 Group
R N
·-----~
c
PA2
'"''2
i
;-----------; • ;------------:
' ' :----=-+: '
OU!T OFF
:
____
1[]
;-----
' :----=-+: '
S
__
! :
____
----'-; .
S
;------------:
TIM(
OFFOU@T
Parameter (0 to 2) group setting method
1. Each parameter alternately displays parameter name and the SV in 0 5 sec.
2. Press the key and the SV is saved and it moves to next parameter.
3. If there is no operation for 60 sec, it returns to RUN mode automatically.
4. Press the
5. Press the keys to change the SV at he parameter.
(
※
S
Preset output operation mode of OUT1 (displayed only for OUT 1 output model)
Setting range:
Preset output operation mode of OUT2 (displayed only for OUT 2 output model)
OFF, HI, LO, HL, HL-G
[ill
[ill
keys for 3 sec and it returns to RUN mode.
l~LIBI
: moves setting digit, : changes set value)
: Press any key between , .
;:
111
HYs1
S
; • •
;:::::
Preset hysteresis of OUT1
::::::
Setting range: within 10% of max. display range (unit: digit)
001
※
When
OU!T
parameter is
OFF
, it is not displayed.
l[ill
S
------]------.t::::::::::::]
[ill
S
00 5
S
)2 5
S
[ill
.___
[-----
HYs2
PEkT
DIsT
LOC
__
Factory default
Parameter M4NN-DV M4NN-DA M4NN-AV M4NN-AA Parameter M4NN-DV M4NN-DA M4NN-AV M4NN-AA
※
1
OU!T
OU@T
HYs1
HYs2
I I I I I
※
It is not displayed for the indicator model.
OFF OFF OFF OFF PEkT 00 5 00 5 00 5 00 5
※
1
OFF OFF OFF OFF DIsT )2 5 )2 5 )2 5 )2 5
※
1
- - - -
※
1
- - - -
Parameter 0 Group
N m
S
S
Max. display
value
Min. display
value
OU!H
OU!L
Preset hysteresis of OUT2
Setting range: within 10% of max. display range (unit: digit)
001
※
OU@T
When
When initially supplying power, delays monitoring of high-limit/low-limit value of display value for the set time.
Setting range: 00 to 30 sec
※
If it is set to 00 sec [
value [
Display cycle
Setting range: 0.1 to 5.0 sec
Lock among 4 types.
OFF
Setting range:
parameter is
lPEK
] in the parameter 0 group will be not displayed.
OFF, LOC1, LOC2, LOC3
OFF
, it is not displayed.
00 S
], parameters of high-peak monitoring value [
OFF
Unlock
LOC1
Lock Parameter 1 group
LOC2
Lock Parameter 1, 2 groups
LOC3
Lock Parameter 0, 1, 2 groups
I I
LOC OFF OFF OFF OFF
hPEK
]/low-limit monitoring
II
High-limit preset of
※
Not displayed when
Low-limit preset of
※
Not displayed when
OUT1
OUT1
OU!T
OU!T
parameter is
parameter is
OFF
at the parameter 2 group.
OFF
at the parameter 2 group.
O-40
OU@H
OU@L
hPEK
lPEK
S
S
S
S
Max. display
value
Min. display
value
)0
)0
High-limit preset of
※
Not displayed when
Low-limit preset of
※
Not displayed when
It displays max. monitoring value (high peak value) in RUN mode.
Press any key between
※
hPEK
parameter is not displayed when
It displays min. monitoring value (low-limit value) in RUN mode.
Press any key between
※
lPEK
parameter is not displayed when
OUT2
OU@T
parameter is
OUT2
OU@T
parameter is
, and it is initialized (reset).
, and it is initialized (reset).
OFF
at the parameter 2 group.
OFF
at the parameter 2 group.
PEkT
parameter is set as 00 sec[
PEkT
parameter is set as 00 sec[
Autonics
00 5
] at the parameter 2 group.
00 5
] at the parameter 2 group.

Small Multi Panel Meter
Factory default
Parameter M4NN-DV M4NN-DA M4NN-AV M4NN-AA Parameter M4NN-DV M4NN-DA M4NN-AV M4NN-AA
※
1
OU!H
※
OU!L
※
OU@H
I I I I I I I I I I I
※
It is not displayed for he indicator model.
600 %00 60)0 %000 OU@L
1
-600 -%00 00)0 )000 hPEK
1
600 %00 60)0 %000 lPEK
※
1
-600 -%00 00)0 )000
※
1
※
1
0 )00 )0 )000
0 )00 )0 )000
SENSORS
CONTROLLERS
MOTION DEVICES
Measurement Input
Type Measurement input range Input impedance Display range [
600V
] 4.694MΩ -600 to 600
200V
] 4.694MΩ -199.9 to 200 0
100V
] 794kΩ -100.0 to 100 0
20V
] 79kΩ -19.99 to 20.00
10V
] 79kΩ -10.00 to 10.00
)2V
] 7.5kΩ -199.9 to 200 0
)2A
] 0.1Ω -199.9 to 200 0
)1A
]
20MA
] 1.1Ω -19.99 to 20.00
4-20
] 1.1Ω 4.00 to 20.00
10MA
] 11.1Ω -10.00 to 10.00
2MA
] 11.1Ω -1.999 to 2.000
600V
] 4.987MΩ 0.0 to 600 0
250V
] 4.987MΩ 0.0 to 250 0
110P
] 1.087MΩ 0.0 to 440 0
50V
] 1.087MΩ 0.00 to 50.00
20V
] 200kΩ 0.00 to 20.00
10V
] 200kΩ 0.00 to 10.00
@5A
] 0.01Ω 0.000 to 2.500
)5A
] 0.1Ω 0.0 to 500 0
)25A
] 0.1Ω 0.0 to 250 0
)1A
] 0.5Ω 0.0 to 100 0
50MA
] 0.5Ω 0.00 to 50.00
1.1Ω -100.0 to 100 0
DC voltage
DC current
AC voltage
AC current
※
When "
-600-600V [
-200-200V [
-100-100V [
-20-20V [
-10-10V [
-2-2V [2V] 79kΩ -1.999 to 2.000
-1-1V [1V] 7.5kΩ -1.000 to 1.000
-200-200mV [
-5-5A [SA] 0.01kΩ -5.00 to 5.00
-2-2A [2A] 0.01Ω -1.999 to 2.000
-1-1A [1A] 0.1Ω -1.000 to 1.000
-200-200mA [
-100-100mA [
-20-20mA [
4-20mA [
-10-10mA [
-2-2mA [
0-600V [
0-250V [
0-110V [
0-50V [
0-20V [
0-10V [
0-2V [2V] 20kΩ 0.000 to 2.000
0-1V [1V] 20kΩ 0.000 to 1.000
0-5A [5A] 0.01Ω 0.000 to 5.000
0-2.5A [
0-1A [1A] 0.05Ω 0.000 to 1.000
0-500mA [
0-250mA [
0-100mA [
0-50mA [
HHHH
" or "
LLLL
" is ashes with a certain measurement input, disconnect power supply and then check he cables.
STND
] Note
※
ForDCinput,nottodisplayminus
input,setminusinputdisplay[
ofparameter1groupas
E.g.)Whenthedisplayrangeis-600
to600V,set
1groupas
MINU
OFF
rangeis0to600V.
DOT
Display range
0
-1999 to 9999
)0
-199.9 to 999.9
)00
-19.99 to 99.99
)000
I I I
-1.999 to 9.999
(display range is variable according
to decimal point position)
Connect to the input terminals whose
※
30% to 100% of the input range
includes the max. value of the input
range to measure.
When the max. input value is under
he 30% of the input terminal range,
display accuracy is degraded. When
he max. input value is over the
100%, it may result in input terminal
damage.
※
For the range setting of AC voltage,
when set ing as 0 to 110V[
and using P.T for 440V/110VAC,
110V is input and 440V is displayed
automatically by the set scale value
for P.T users' convenience.
※
Frequency measurement range
(AC voltage/current)
: 0.100 to 9999Hz
MINU
OFF
.
ofparameter
andthisdisplay
110P
]
]
SOFTWARE
(J)
Temperature
Controllers
(K)
SSRs
(L)
Power
Controllers
(M)
Counters
(N)
Timers
(O)
Digital
Panel Meters
(P)
Indicators
(Q)
Converters
(R)
Digital
Display Units
(S)
Sensor
Controllers
(T)
Switching
Mode Power
Supplies
(U)
Recorders
(V)
HMIs
(W)
Panel PC
Autonics
O-41
(X)
Field Network
Devices

M4NN Series
~
Functions
g
Minus input display [PA 1 group:
When minus input is unnecessary, or when display 0 not
●
to display minus input due to display minus input due
to unstable input value around 0, set as
input display function.
When setting
●
and it displays minus input as 0.
The low-limit value of
●
is changed based on "0".
Min. display value is "0" and
display max. value of the input range.
INbH
The
are initialized to factory default.
※
In case of DC current measurement input model, when
measurement input range [
parameter is not displayed.
g
AC frequency measurement
[PA 1 group:
It measures input signal frequency when it is an AC input.
It uses fixed decimal point by
parameter 1 group, measured range can be changed by
setting and measured range of decimal point position is
as below chart. It is available to adjust upper gradient
INbH
at
measure frequency normally, input signal, over 10% F.S.
of the measured range, should be supplied. Please select
the proper point of measurement terminal.
Measurement range
●
Dot position
Measurement
range
※
Accuracy of frequency measurement: Below 1kHz, F.S.
±0.1rdg ±2-digit, from 1 to 10kHz, F.S. ±0.3 rdg ±2-digit
INbH
●
INbE
●
g
Zero adjustment [low-limit display value
OFF
, low-limit value of input range is set 0
L SC, OU
INbL
/
OU T
/
□
DISP
INbE
and
: 0.100 to 9.999
[gradient adjustment of high-limit value]
: 10
of parameter 1 group. In order to
)000 )00 )0 0
0.100 to
9.999Hz
-2
, 10-1, 100, 101[index adjustment of
0.10 to
99.99Hz
L, L RG
□
H SC, H RG
OU
HYS.
/
/
□
IN R
] is set as
]
DOT
parameter setting of
0.1 to
999.9Hz
MINU
this minus
oFF
parameters
parameters
.H
parameters
□
4 20
1 to 9999Hz
INbH
]
, this
]
deviation correction]
Forces the display value of measured input to 0 (Zero).
• Zero adjustment range: -99 to 99
• Zero adjustment method: Press and key in RUN
mode for 3 sec.
)15 )00
When zero point adjustment with front key and hold terminal
is finished normally, zero point of measurement terminal
is displayed and the adjusted value is saved in
automatically.
※
If zero adjustment range is exceeded, the error[
flashes twice and then move to RUN mode, maintaining
previous setting value.
INbL
OVER
]
Initialization
m d
v
INIT NO YES
0000
※
SA
OFF
D1sT
of parameter
mode of
Flashes
twice in
order
and it is
initialized
: -10%)
]
PEkT
hPEK
M4NN-DV/AV
M4NN-DA/AA
g
Error display
Display Description
Flashes when measured input is exceeded the max.
HHHH
allowable input (+110%)
Flashes when measured input is exceeded the min.
LLLL
allowable input (minus input ON: -110%,
Flashes when display input is exceeded max. display
D-HH
range (9999)
Flashes when display input is exceeded min. display
D-LL
range (-1999)
Flashes when input frequency is exceeded the max.
F-HH
measured range (10kHz) and display range (9999)
Flashes when power factor display value to measured
PF-H
input is over than LAG 0.50
Flashes when power factor display value to measured
PF-L
input is less than LEAD -0.50
※
Error is cleared when the input value is within
measurement range or display range.
g
Display cycle delay[PA 2 group:
In some applications the measured input may fluctuate
which in turn causes the display to fluctuate. By adjusting
the display cycle delay function time at
2 group, the operator can adjust the display time within
a range of 0.1 sec to 5 sec For example, if the operator
sets the display cycle time to 4.0 sec, the display value is
displayed the averaged input value over 4 sec in every 4
sec.
g
Monitoring max./min. display value
[PA 0 group:
It monitors Max./Min. value of display value based on
current display value and then display the data in
lPEK
of parameter 0 group. Set delay time (0 to 30 sec) in
PEkT
mode of parameter 2 group in order to avoid caused
by initial overcurrent or over voltage, when monitoring
the peak value. Delay time is 0 to 30 sec and it starts to
monitor the peak value after set time.
When , keys are pressed at
parameter 0 group, it will be initialized.
※
hPEK, lPEK
monitoring delay time [
set as 00 sec[
hPEK/lPEK
parameters is not displayed when
00 S
PEkT
].
600V
j:::---:::::_]
STND
t
_____ --·
D1sT
, PA 2 group:
hPEK, lPEK
] of parameter 2 group is
]
,
O-42
Autonics

Small Multi Panel Meter
Error correction[PA 1 group:
INbH
/
INbL
]
It corrects display value error of measurement input.
INbL
: -99 to 99 (adjust deviation of low-limit value),
INbH
: 0.100 to 9.999 (correct gradient of high-limit value)
Display value= (measured value ×
INbH
) +
INbL
E.g.) When the measured range is 0 to 500V, and the
display range is 0 to 500.0. If the low display value is
!2
to 0V input, set -12 as
INbL
value to display 0.0
by adjusting offset of the low-limit value. The display
value to 500V measured input varies by adjusting the
offset of low-limit value. If this display value is
50!0
,
calculate 500.0/501.0 (desired display value/the
display value), and set the
INbH
the
to display
)998
50)0
correction value as
by adjusting gradient of
high-limit value.
※
The offset correction range of
-0
-1
, D
for D
※
High limit error correction function is available as
digit regardless of decimal point position [
INbL
is within -99 to 99
DOT
“Gradient correction function”and low limit error
correction function is available as “Zero adjustment
function”.
Gradient correction[PA 1 group:
INbH
]
This function is to adjust gradient of standard display value
or scale value for the input value within the measured input
range. By adjusting gradient, it is available as “High limit
error correction function”.
As the below (figure 1), in case of display gradient 1 for
the measured input 100V, this function is to adjust display
value by adjusting the gradient as 1.5 times or 0.5 times.
• Setting range: 0.100 to 9.999,
Factory default: 1.000 (unit: multiply)
E.g. 1) Gradient adjustment
When the measured input is 100.0V in order to display
①
15)0
, set gradient correction set value[
INbH
] as
!500
This value is also applied for minus input. When the
measured input is -100.0V, it displays
When the measured input is -100.0V in order to display
②
5)0
, set gradient correction set value[
15)0
INbH
.
] as
)500
This value is also applied for plus input. When the
measured input is 100.0V, it displays
INbH
Note
※
Shaded part of Figure 1 is not displayed for the below
!500
①
②
cases.
• AC input model
• DC input model and minus inpu [
• DC current input model and Input range [
)500
as
4-20.
-100V
Display
value
15)0
10)0
5)0
5)0
`0)0
`5)0
100V
(Figure 1)
5)0
M1NU
INbH: !500
INbH: !000
INbH: )500
.
] is set as
IN-R
Input value
OFF.
] is set
E.g. 2) Display scale setting [
adjustment [
When the measured input AC 2.000V at the input range
①
INbH
AC 0 to 5.000V and it displays
position [
When the measured input is AC 2.000V in order to
②
display
DOT
%000
)000
] as
, 12.500 should be displayed when max.
L SC/H SC
]and gradient
] (AC input)
%000
, set decimal point
before setting the scale value.
input value is 5.000V. However, it cannot set because the
max. set value is 9.999.
Set as Gradient correction set value [
H SC
value[
After this setting is finished, it displays
③
] = 12,500 as the following table.
INbH
%000
measured input is 2.000V.
H SC L SC INbH
12.500 0.000 1.000
6.250 0.000 2.000
].
3.125 0.000 4.000
2.500 0.000 5.000
I I I I
Display
E.g. 3) Display scale setting [
adjustment [
When the measured input DC -40mA at the input range
①
DC -100.0 to 100.0mA and it displays
.
point position[
DOT
Note
Unavailable to set because max
set value of
In this case, any setting methods
display the same display value.
value
12.500
Display value for
measured input
5.000
2.000V 5.000V
H-SC is (999
L SC/H SC
INbH
] (DC minus input)
)000
] as
before setting the scale
Input
value
] and gradient
`6)0
value.
When the measured input is DC -40mA in order to
②
.
`6)0
display
, -400.0 should be displayed when min.
input value is -100.0mA. However, it cannot set because
the min. set value is -199.9.
Set as gradient correction set value[
L SC
value [
] =-400.0 as the following table.
Set high-limit scale value as (- (
INbH
L SC
)) value. If high
scale value is set at first, set low scale value as (- (
value.
After this setting is finished, it displays
③
`6)0
measured input is DC-40.0mA.
H SC L SC INbH
400.0 -400.0 1.000
200.0 -199.9 2.000
100.0 -100.0 4.000
80.0 -80 0 5.000
I I I I
Note
Unavailable to set because max
set value of
In this case, any setting methods
display the same display value.
Display
value
400.0
160.0
-100.0 -40.0
40.0 100.0
-160.0
-400.0
L-SC
Input
value
Display value for
measured input
] × High scale
when the
, set decimal
]×low scale
when the
`9 (9
is
H SC
SENSORS
CONTROLLERS
MOTION DEVICES
SOFTWARE
(J)
Temperature
Controllers
(K)
SSRs
(L)
Power
Controllers
(M)
Counters
(N)
Timers
(O)
Digital
Panel Meters
(P)
Indicators
(Q)
Converters
(R)
Digital
Display Units
))
(S)
Sensor
Controllers
(T)
Switching
Mode Power
Supplies
(U)
Recorders
(V)
HMIs
(W)
Panel PC
(X)
Field Network
Devices
Autonics
O-43

M4NN Series
Power factor (PF) display
`)00
LEAD
(
H RG
is set as
%00
as
0.50
0.75
0.90
1.00
-0.90
-0.75
-0.50
H-RG/ L-RG
H RG
]/low-limit[
IN R
]
200V
IN R, H RG
in
`9 (9
10V, H RG
1)00.
to
)+ (
L RG
2
2)00
to
and
※
H RG
(
LAG
)
H RG
IN R
] as
automatically.
!00
and for 20mA, it displays
IN R
L RG
and
!00
-----------------
as
and for 5V, it displays
------------
- '
1V 5V3V
1
0.9
0.5
LEAD LAG
]
L RG
] analog
L RG
and
20)0
.
L RG
are available to
L RG
<Factory default>
Model
M4NN-DV
M4NN-DA
※
Power factor display is only
for DC measurement input
model.
Input value
4 20
4 20, L RG
] as
MINU
!00
for the output of the
)50
)
>
H RG L RG
600 600
%00 %00
.
is set as
L RG
and
)50
. For 12mA
10V
.
OFF
] as
. For 3V measured
)50
.
Input value
are
$00
H RG
not to
[PA 1 group:
This function displays LEAD and LAG by analog output
●
signal from the power factor transducer.
It is available to accept several outputs of the power factor
●
transducer by high-limit[
output value setting in the power factor transducer.
Power factor value is displayed as cosø value -0.50 (LEAD)
●
to 1.00 to 0.50 (LAG).
LEAD is when current phase leads voltage phase, LAG is
●
when current phase lags behind voltage phase. LEAD and
LAG are invalid power.
Setting range: From min. to max. selected value from
●
measurement input[
E.g.) When setting
available to set from
When setting
set from
Display
vlaue
cosø
1
0.5
L RG
E.g. 1) When the output of the power factor transducer is DC
4-20mA,
Connect the output to the input terminal 5 (+), 7 (-) of this
①
unit, then set input range[
When setting the input range as
②
H RG
and
is for the setting of the power factor transducer output.
If measured input is 4mA, it displays
③
measured input, it displays
)50
.
E.g. 2) When the output of the power factor transducer is
DC1-5V,
Connect the output to the input terminal 5 (+), 7 (-) of this
①
unit, then set the input range [
Select minus input display function [
②
display minus value.
H RG
Set
③
power factor transducer.
If measured input is 1V, it displays
④
input, it displays
Max. output value SV
Min. set value
E.g. 3) When LEAD value is smaller than -0.90, LAG value
is smaller than 0.90, and OUT1 is used,
OU!T
Set
①
Set
②
※
OU@T
Display scale [PA 1 group:
0
as HL at parameter 2 group.
OU!H
as
)90
and
OU!L
is also same setting as
Output mode
U!H
U!L
value
value
HL
0.90
1.00
-0.90
LAG
LEAD
as
)90
at parameter 0 group
OU!T
.
H-SC
Hysteresis
Output value
/
Hysteresis
L-SC
This function is to display setting (-1999 to 9999) of
particular High/Low-limit value in order to display High/Lowlimit value of measurement input. If measurement inputs
are 'a' and 'b' and particular values are 'A' and 'B', it will
display a=A, b=B as below graphs.
Display
value
B
A
a
Display
value
A
B
a
Display
value
B
a a
A
※
In case of DC Volt/Ampere input model (M4NN-D
using Minus input, they are displayed.
Display
value
B
A
b
Input
value
b
Input
value
Display
value
b b b
Input
value
a
Display
value
a
A
B
B
:_______ i ,--------
A
~~
Input
value
Input
value
Input
value
Display
value
B
Display
value
Display
value
a
A
A
B
A
B
b
b
□□
a
a
Input
value
i
'
:
- ) and
Display scale function is able to change display value for
min./max. measured input by setting high limit scale
and low limit scale
L SC
in parameter 1 group.
E.g.) High limit scale value and low limit scale value setting
(input range = 0 to 10V)
L SC: )00
H SC: %00, 1)00, 1%00, `)00
Display
value
1%00
1)00
%00
0 10V
•
`)00
※
When changing measured input, high limit scale value
Input
value
L SC: 1)00
H SC: `)00
Display
value
1%00
1)00
-----------,
%00
0 010V 10V
~
___________ ! ___________
`)00 `)00
Input
value
i
L SC: %00
H SC: %00
Display
value
1%00
1)00
~
%00
----------··:
and low limit scale value are automatically changed as
the default display range of the changed measured input.
]
b
Input
value
b
Input
value
H SC
1
Input
value
.
,
O-44
Autonics

Small Multi Panel Meter
Preset output mode [PA 2 group:
OU!T/OU@T
Mode Output mode Opera ion
OFF
OUT1 No output
OUT1.H
HI
OUT1
Hysteresis
No output
Period ON
: Display value ≥
Period OFF
: Display value ≤
OU!H
OU!H-HYs1
Period ON
OUT1.L
LO
OUT1
: Display value ≤
Period OFF
: Display value ≥
OU!L
OU!L+ HYs1
Period ON
OUT1.H
OUT1.L
HL
OUT1
: Display value ≤
Display value ≥
Period OFF
: Display value ≥
Display value ≤
or
OU!L
OU!H
OU!L+ HYs1
OU!H-HYs1
Period ON
OUT1.H
OUT1.L
HL G
OUT1
※
Set output mode separately for each OUT1/OUT2.
※
OUT1/OUT2 are operated individually depending on
: Display value ≥
Display value ≤
Period OFF
: Display value ≤
or Display value ≥
HYs1
OU!L
OU!H
OU!H-HYs1
OU!H
output operation mode.
※
Setting value mode of parameter group 0 is displayed
depending on output operation mode.
※
GO outputs when the period both OUT1/OUT2 are off.
(NPN/PNP open collector output type)
or
or
]
SENSORS
CONTROLLERS
MOTION DEVICES
SOFTWARE
+
(J)
Temperature
Controllers
(K)
SSRs
(L)
Power
Controllers
(M)
Counters
(N)
Timers
(O)
Digital
Panel Meters
(P)
Indicators
(Q)
Converters
(R)
Digital
Display Units
(S)
Sensor
Controllers
(T)
Switching
Mode Power
Supplies
(U)
Recorders
(V)
HMIs
(W)
Panel PC
(X)
Field Network
Devices
Autonics
O-45
 Loading...