

Page 1
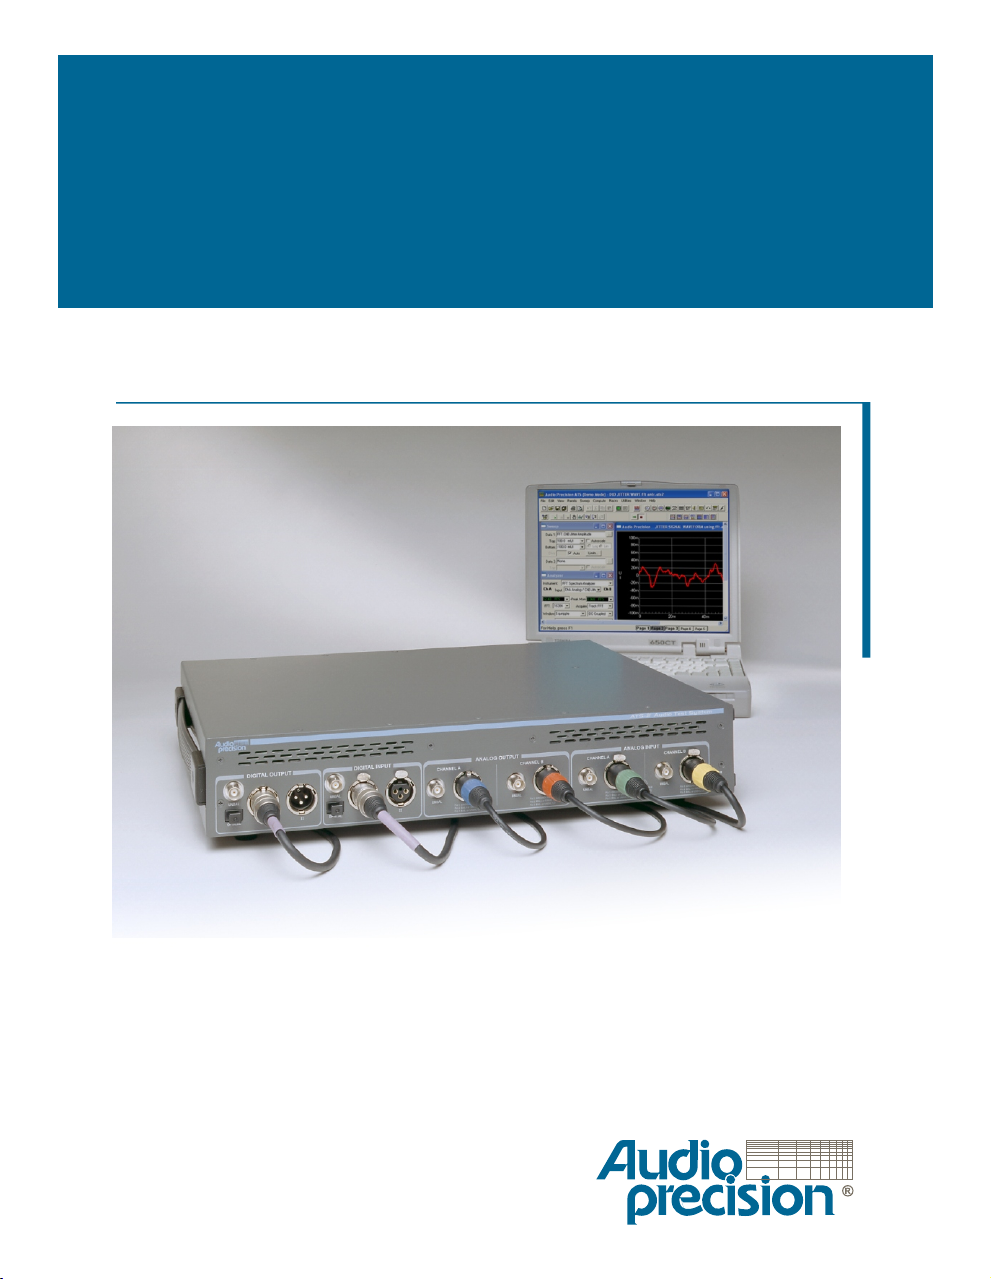
ATS-2
Getting Started with Your ATS-2
Page 2

Page 3
Getting Started
with ATS-2
An Introductory Guide to ATS-2
APIB and GPIB Configurations
Page 4

Copyright Ó 2001–2004 Audio Precision, Inc.
All rights reserved.
Audio Precision PN 8211.0136 Revision 3
No part of this manual may be reproduced or transmitted in any
form or by any means, electronic or mechanical, including
photocopying, recording, or by any information storage and
retrieval system, without permission in writing from the
publisher.
Audio Precision®, System One®, System Two™, System Two
Cascade™, System One + DSP™, System Two + DSP™, Dual
Domain®, FASTTEST®, APWIN™, ATS™ and ATS-2™ are
trademarks of Audio Precision, Inc. Windows® is a trademark
of Microsoft Corporation.
Published by:
Printed in the United States of America
5750 SW Arctic Drive
Beaverton, Oregon 97005
Tel: 503-627-0832
Fax: 503-641-8906
US Toll Free: 1-800-231-7350
email: [email protected]
Web: audioprecision.com
IV1011152010
Page 5

Contents
Safety Information...........................v
Safety Symbols ............................vi
Disclaimer ...............................vi
Chapter 1
General Information ..........................1
ATS-2: An Overview...........................1
ATS-2 Capabilities............................2
Conceptual Architecture of ATS-2 ..................3
About This Manual ...........................4
Online Help ...............................4
Other Documentation for ATS-2 ...................4
ATS-2 User’s Manual .........................4
AP Basic User’s Guide and Language Reference .........5
AP Basic Extensions Reference for ATS-2 .............5
Filter Design Package Manual....................5
Other Publications ..........................5
GPIB Documentation for ATS-2 ...................5
Chapter 2
Installation and Setup for APIB ...................7
ATS-2 Components ...........................7
Getting up and Running .......................8
Installing ATS Software on a PC ....................8
PC System Requirements ......................8
Installing the Software .......................8
Setting Up the ATS-2 Hardware ....................9
Connecting ATS-2 to the Electrical Mains Supply .........9
Checking the Mains Supply Voltage Configuration ......10
Opening the Power Entry Module ...............10
Changing the Mains Supply Voltage Configuration......10
Fuse Information ..........................12
Getting Started with ATS-2 i
Page 6

Changing the Fusing Arrangement ..............12
Connecting ATS-2 to Your PC ....................13
Installing a PCI APIB Card......................13
Using the PCM-WIN PCMCIA Interface Card ............14
Chapter 3
Hardware Overview..........................15
ATS-2 Front Panel ...........................15
ATS-2 Rear Panel............................16
Chapter 4
ATS-2 User Interface .........................19
Overview................................19
A Note on Nomenclature ......................19
Starting up the ATS Software ....................20
ATS Workspace ............................20
ATS Panels ...............................21
Panel Settings............................22
Panel Readings ...........................22
ATS Menus ...............................23
File Menu ..............................23
Edit Menu ..............................23
View Menu..............................23
Panels Menu.............................23
Sweep Menu ............................23
Compute Menu ...........................24
Macro Menu .............................24
Utilities Menu ............................24
Window Menu ...........................24
Help Menu..............................24
Status Bar ...............................24
Toolbars and Buttons ........................25
Standard Toolbar ..........................25
Panels Toolbar ...........................25
Macro Toolbar ...........................25
Learn Mode Toolbar ........................26
Quick Launch Toolbar .......................26
Using Files with ATS..........................26
Test Files...............................26
Macro Files .............................27
Data Files ..............................27
Waveform Files ...........................27
Log File ...............................28
Downloadable Filter Files .....................28
ii Getting Started with ATS-2
Page 7

Chapter 5
Quick Guides ..............................29
Introduction .............................29
Quick Guide to the Analog Signal Path ...............29
Analog Input Panel .........................29
Analog Generator Panel ......................29
Analyzer Panel ...........................30
Signal Monitor ...........................31
Controlling the Analog Generator ................31
Units .................................32
Quick Guide to Sweeps ........................33
Sweep Fundamentals .......................34
Settings and Readings ......................34
Source Range, Steps, and Spacing ...............35
Data Display Range ........................35
Example Sweep: Frequency Response ..............36
Review...............................36
Example Sweep: Amplitude Linearity ..............37
Quick Guide to the FFT Spectrum Analyzer ............38
Real-Time vs. Batch-Mode Instruments..............38
The FFT Concept ..........................39
Setting up an FFT ..........................39
Panel Fields ............................40
Time vs. Frequency .......................40
Quick Sweep Setup........................40
Fine-Tuning the Display .....................41
Saving and Loading Tests ......................42
The Next Step .............................42
Chapter 6
Specifications .............................43
Chapter 7
GPIB Configuration ..........................57
Introduction .............................57
APIB or GPIB? ............................57
The GPIB Software Development Process .............58
Using both GPIB and APIB for Software Development .....60
Establishing GPIB Communication ................61
GPIB Connection .........................61
ATS-2 GPIB Address and I/O Mode Switch ...........63
GPIB Status LEDs .........................65
GPIB Program Message Terminators ..............65
Getting Started with ATS-2 iii
Page 8

iv Getting Started with ATS-2
Page 9

Safety Information
Do NOT service or repair this product unless properly qualified.
Servicing should be performed only by a qualified technician or an
authorized Audio Precision distributor.
Do NOT defeat the safety ground connection. This product is designed
to operate only from a 50/60 Hz AC power source (250 V rms maximum)
with an approved three-conductor power cord and safety grounding. Loss
of the protective grounding connection can result in electrical shock hazard
from the accessible conductive surfaces of this product.
For continued fire hazard protection, fuses should be replaced ONLY
with the exact value and type indicated on the rear panel of the instrument
and discussed on page 12 of this manual. The AC voltage selector also
must be set to the same voltage as the nominal power source voltage (100,
120, 230, or 240 V rms) with the appropriate fuses. Different fuses are
required depending on the line voltage.
The International Electrotechnical Commission (IEC 1010-1) requires
that measuring circuit terminals used for voltage or current measurement
be marked to indicate their Installation Category. The Installation Category
is defined by IEC 664 and is based on the amplitude of transient or
impulse voltage that can be expected from the AC power distribution
network. This product is classified as INSTALLATION CATEGORY II,
abbreviated “CAT II” on the instrument front panel.
Do NOT substitute parts or make any modifications without the written
approval of Audio Precision. Doing so may create safety hazards.
This product is for indoor use—pollution degree 2.
Getting Started with ATS-2 v
Page 10
Safety Symbols
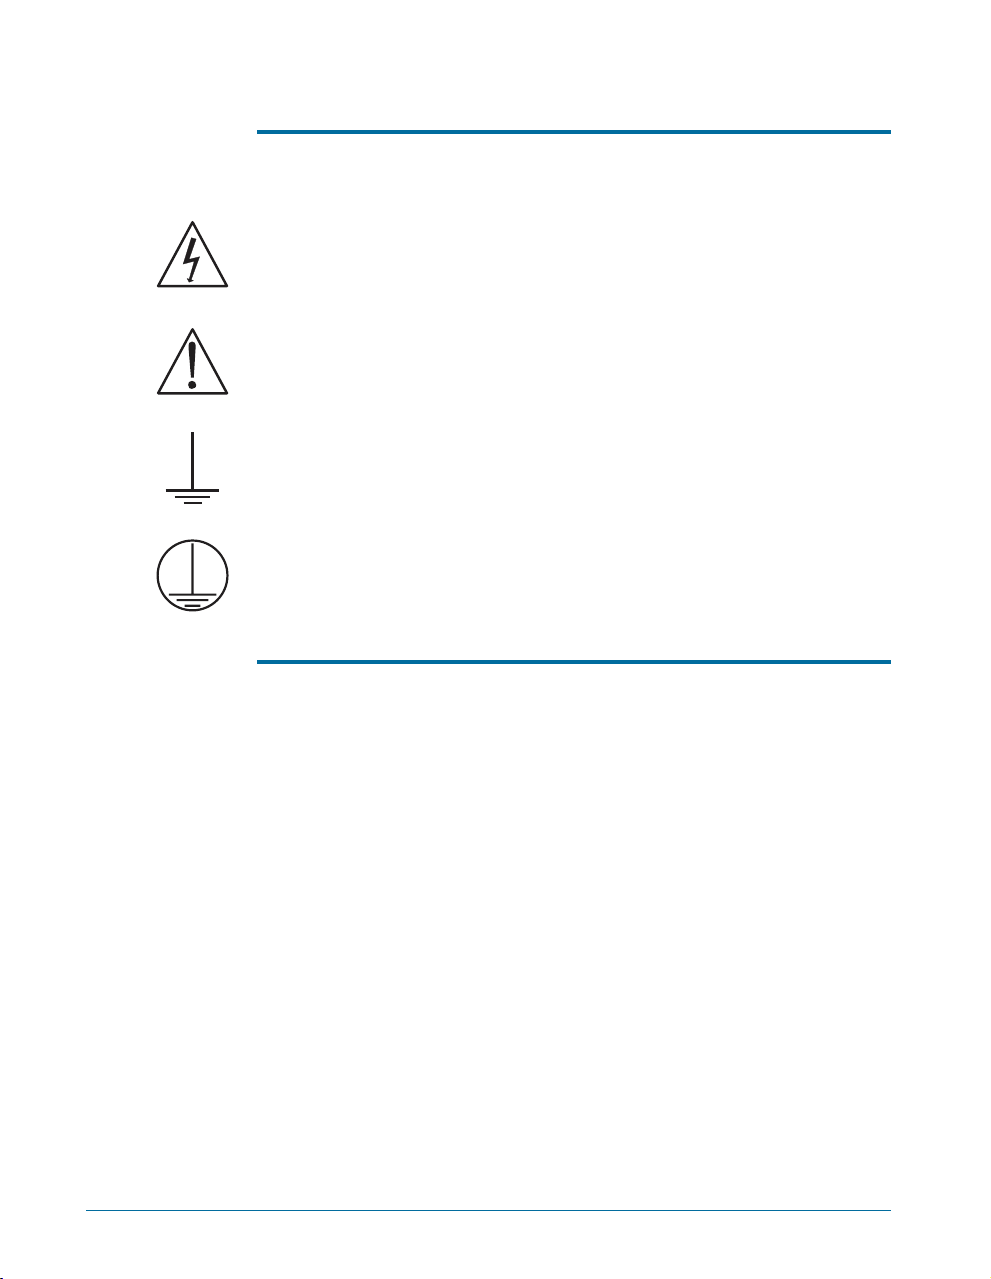
The following symbols may be marked on the panels or covers of
equipment or modules, and are used in this manual:
WARNING!—This symbol alerts you to a potentially hazardous
condition, such as the presence of dangerous voltage that could pose a risk
of electrical shock. Refer to the accompanying warning label or tag, and
exercise extreme caution.
ATTENTION!—This symbol alerts you to important operating
considerations or a potential operating condition that could damage
equipment. If you see this marked on equipment, refer to the Operator’s
Manual or User’s Manual for precautionary instructions.
FUNCTIONAL EARTH TERMINAL—A terminal marked with this
symbol is electrically connected to a reference point of a measuring circuit
or output and is intended to be earthed for any functional purpose other
than safety.
PROTECTIVE EARTH TERMINAL—A terminal marked with this
symbol is bonded to conductive parts of the instrument and is intended to
be connected to an external protective earthing system.
Disclaimer
Audio Precision cautions against using their products in a manner not
specified by the manufacturer. To do otherwise may void any warranties,
damage equipment, or pose a safety risk to personnel.
vi Getting Started with ATS-2
Page 11
Chapter 1
General Information
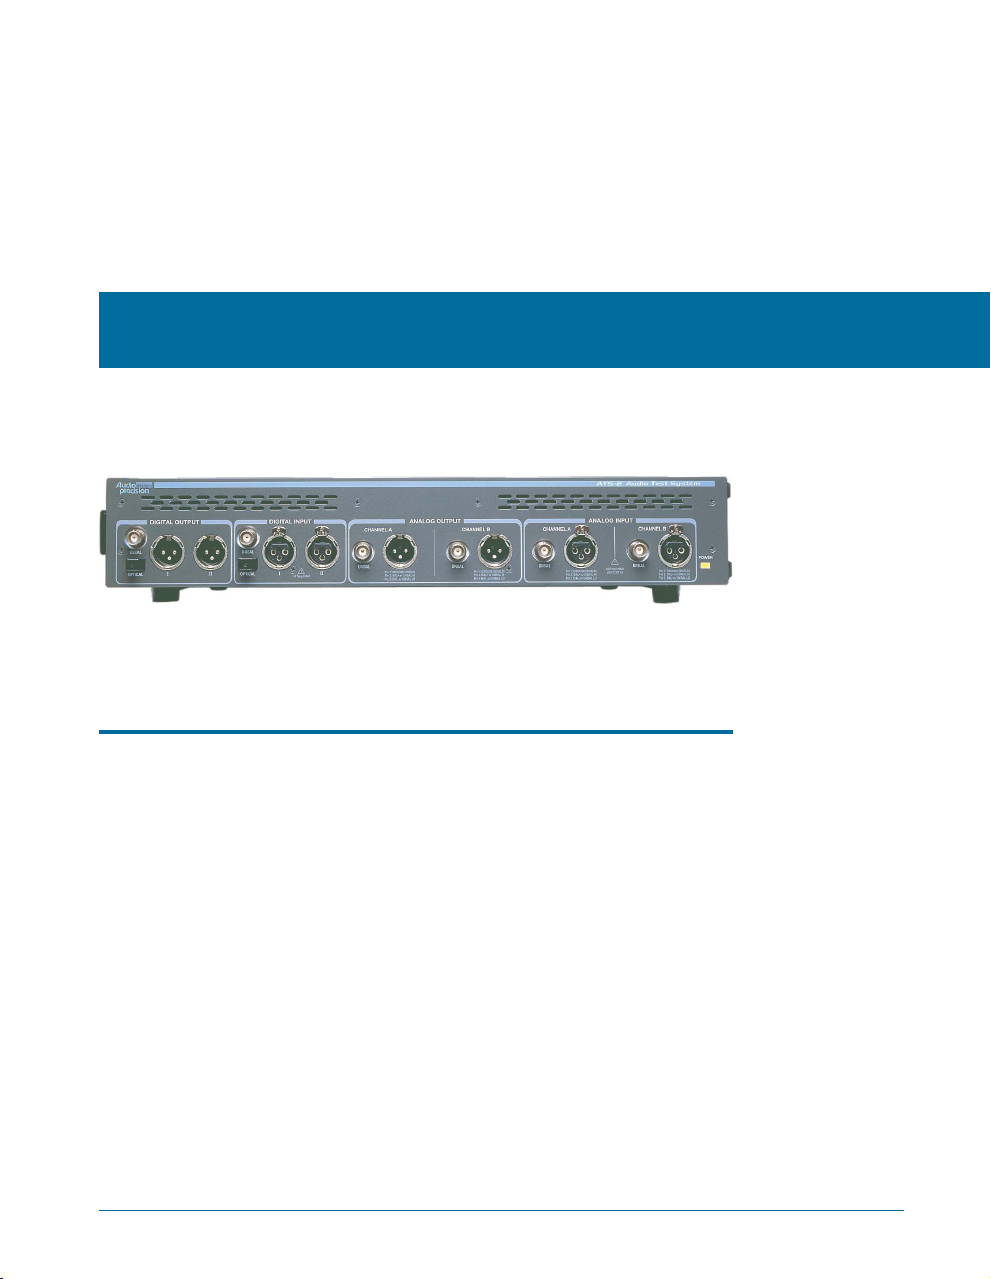
Figure 1. The Audio Precision ATS-2 audio test and measurement system.
ATS-2: An Overview
The Audio Precision ATS-2 is a powerful computer-controlled audio test
and measurement system consisting of two key components:
The ATS-2 hardware: the connectors and circuitry necessary for
§
precise signal generation and analysis, and for interfacing to devices.
The hardware is mounted in a compact (2 U) aluminum and steel
chassis that can be installed in a standard equipment rack using
optional mounting hardware.
The ATS measurement software, which runs on a personal computer
§
(PC), and provides the control, display, report and automation
functions for the ATS-2 system. The ATS software will run under
Microsoft Windows 2000 and Windows XP.
With the exception of the mains power switch on the rear panel, there
are no knobs, dials, controls, readouts, meters or switches on the ATS-2
chassis. All of these functions are performed via the ATS software on the
controlling PC.
Getting Started with ATS-2 1
Page 12

Chapter 1: General Information ATS-2 Capabilities
The PC communicates with the ATS-2 chassis via a proprietary bus
interconnection called the Audio Precision Interface Bus (APIB), which
requires a dedicated cable and a PC-mounted interface card or adapter.
APIB interfaces can be ordered as PCI and PCMCIA compatible devices.
See Chapter 2 for further information on APIB and interface hardware.
When ordered in the optional GPIB configuration (ATS2G), ATS-2 can
also be controlled by the industry-standard IEEE 488.2 General Purpose
Interface Bus (GPIB). See Chapter 7 for more information about the
ATS-2 GPIB configuration.
ATS-2 Capabilities
ATS-2 can make amplitude, frequency, THD+N, noise, phase,
§
crosstalk, bandpass, and IMD measurements for analog or digital
audio devices. In a special function, ATS-2 can perform detailed
analysis and measurement of harmonic distortion products.
ATS-2 can perform complex sweeps, and display and print the results
§
with a powerful graphing engine. ATS-2 offers control over
instrument regulation and settling parameters. Data obtained from
sweeps can be compared to pre-defined limits. A variety of
computations can be performed on the measured data after
acquisition. Tests and data can be saved and recalled, and ATS-2
measurements can be automated by macros written in the AP Basic
programming language.
ATS-2 can perform measurements using fast Fourier transform (FFT)
§
analysis. Advanced high-speed FFT analysis techniques are available,
including multitone recognition and analysis, frequency adjustment
for bin centering, synchronous FFT processing, and advanced
post-FFT analysis.
ATS-2 can examine an AES/EBU digital interface signal and assure
§
the integrity of digitally transmitted data. It can also measure and
examine the jitter in the waveform. ATS-2 can extract a variety of
statistics from a digital waveform, including the sample rate, the
interface waveform voltage, the jitter amplitude, and the active and
inactive data bits. ATS-2 also has the capability of transmitting and
receiving a full complement of AES/EBU status bits.
ATS-2’s sample rate may be synchronized to an external AES/EBU
§
signal, a square wave, or an NTSC or PAL video source.
ATS-2 has two auxiliary control connectors for control of external
§
equipment.
2 Getting Started with ATS-2
Page 13

Conceptual Architecture of ATS-2 Chapter 1: General Information
Conceptual Architecture of ATS-2
The functional components implemented in ATS-2 include two audio
signal generators, an audio signal analyzer, digital and analog input and
output modules, and a module for external timebase synchronization.
All signal generation is performed in the digital domain. One of the two
signal generators is dedicated to the digital output. The signal from this
digital generator is buffered and conditioned for the balanced, unbalanced
and optical outputs. The output of the second signal generator is
converted to an analog signal by a digital-to-analog converter (DAC). The
two-channel output of the DAC is conditioned and ranged for the
balanced and unbalanced analog outputs.
All signal analysis is also performed in the digital domain. The digital
input is buffered and directly applied to the analyzer. Analog inputs are first
ranged and conditioned, and then digitized by a high-resolution
analog-to-digital converter (ADC) before being applied to the analyzer. An
optional high-bandwidth ADC is available to increase measurement
bandwidth.
Analog Domain vs. Digital Domain
Analog audio signals are electrical analogies of the sound waves
that they represent, varying in frequency and amplitude in a continuous
fashion. In analog audio electronics, these voltages and currents are
manipulated, processed, and measured by modifying their amplitude or
frequency. The term analog domain refers to signals represented and
processed in this fashion.
Digital audio signals, on the other hand, are numerical
representations of the sound waves. The representation is often carried
on an electrical signal called the interface signal. Digital audio is
processed mathematically in processes gathered together under the
name of Digital Signal Processing,orDSP. The term digital domain
refers to signals represented and processed in this fashion.
Getting Started with ATS-2 3
Page 14

Chapter 1: General Information About This Manual
About This Manual
You’re reading Getting Started with ATS-2. This manual describes how
to set up the ATS-2 hardware and ATS software. It also contains a quick
tutorial to familiarize you with the system. It is organized as follows:
Chapter 2: Software installation and hardware setup information.
§
Chapter 3: Description of the hardware and its connectors.
§
Chapter 4: Description of the user interface.
§
Chapter 5: Introductory tutorial.
§
Chapter 6: Specifications.
§
Chapter 7: GPIB Configuration.
§
Online Help
Much of the information contained in the ATS-2 User’s Manual is also
available in the online help system included in the ATS software. You can
access the help system in two ways:
ATS has context-sensitive help. Almost every control and display on
§
each software panel has a help topic associated with it. To view the
topic, click on the field or control, then press the F1 function key.
On the Menu bar, click Help. The Help menu offers commands to
§
search the Help Index, browse through the Help Topics, or select
a specific help library such as AP Basic Language.
Other Documentation for ATS-2
Audio Precision publishes a variety of documents, many in electronic
form, about hardware and software products, audio theory, and test and
measurement techniques. The following list describes the documents that
are included as Adobe Acrobat Portable Document Format (PDF) files on
the CD-ROM that comes with your instrument. They can also be
downloaded from our Web site at audioprecision.com.
ATS-2 User’s Manual
The ATS-2 User’s Manual is the primary operation and reference
manual for the system. Consult the ATS-2 User’s Manual for:
Detailed descriptions of every ATS-2 feature, software panel, control,
§
and display.
Reference information on audio test and measurement techniques,
§
sample and utility file listings, and an audio glossary.
4 Getting Started with ATS-2
Page 15

Other Documentation for ATS-2 Chapter 1: General Information
AP Basic User’s Guide and Language Reference
You can create tests and macros to automate your measurements.
Macros are written in the AP Basic programming language, which is a
subset of Microsoft® Visual Basic®. The AP Basic User’s Guide and
Language Reference contains a list of the AP Basic commands, each with a
full description and examples of usage.
AP Basic Extensions Reference for ATS-2
The AP Basic Extensions Reference for ATS-2 contains a list of
OLE/ActiveX automation commands that control the specific features of
the ATS-2 hardware and the ATS software.
Filter Design Package Manual
ATS-2 can access and use downloadable filter files. This feature allows
you to install custom software high-pass, low-pass and weighting filters for
use with the ATS-2 analyzer.
The ATS CD-ROM includes a version of Momentum Data Systems’
QEDLite filter design package. This special version creates filter files in the
format used by ATS. The Filter Design Package manual describes the
operation of this software.
Other Publications
Audio Precision publishes application notes, tech notes, technical papers
and training materials that cover all aspects of audio test and
measurement. Information about our library of technical papers and
announcements of new papers is available from Audio Precision Technical
Support, and on the Audio Precision Web site.
GPIB Documentation for ATS-2
When ordered in the optional GPIB configuration, ATS-2 can also be
controlled by the industry-standard General Purpose Interface Bus (GPIB).
Basic installation with GPIB is covered in Chapter 7 of this manual. For
GPIB development and programming, order the ATS-2 GPIB
Programmer’s Reference Manual, which includes a CD-ROM with GPIB
sample program files.
Getting Started with ATS-2 5
Page 16

Chapter 1: General Information Other Documentation for ATS-2
6 Getting Started with ATS-2
Page 17

Chapter 2
Installation and Setup for APIB
ATS-2 Components
The following items are included with a standard, APIB-configured
ATS-2. For a GPIB-configured ATS-2, refer to Chapter 7.
The ATS-2 hardware chassis.
§
A mains power cord.
§
A packet of miscellaneous printed materials.
§
A box containing the ATS-2 WIN-KIT interface kit.
§
The following items are contained within the ATS-2 WIN-KIT:
This manual, Getting Started with ATS-2.
§
The ATS-2 User’s Manual.
§
An Audio Precision Interface Bus (APIB) interface card, as ordered1.
§
An APIB interface cable.
§
The ATS control software CD-ROM, containing the ATS
§
measurement software and documentation files.
The Tones and Tests CD-ROM, containing audio test tones and
§
sample files.
We recommend that you retain the shipping box and packing materials
to protect your instrument if you need to ship it in the future.
1
The ATS-2 APIB interface card is available for PCI and PCMCIA slots. Refer to Page 13 for detailed
installation information.
Getting Started with ATS-2 7
Page 18

Chapter 2: Installation and Setup for APIB Getting up and Running
Getting up and Running
There are three main tasks to setting up ATS-2:
Installing the ATS software on a personal computer (PC);
§
Configuring ATS-2 for the local power supply; and
§
Installing the APIB card in the PC and connecting it to ATS-2.
§
These tasks are described below.
Installing ATS Software on a PC
PC System Requirements
ATS-2 needs to be connected to an IBM-compatible PC to operate. The
PC must have the following minimum features and capabilities:
A CD-ROM drive.
§
Microsoft Windows 2000 or Windows XP operating system.
§
The minimum processor for your operating system, typically a
§
Pentium-compatible running at 133 MHz or faster for Windows 2000,
or 233 MHz or faster for Windows XP.
The minimum RAM for your operating system, typically 64 MB for
§
Windows 2000 or 128 MB for Windows XP.
An open PCI or PCMCIA slot to mount the APIB interface card.
§
At least 30 MB of free hard disk space; as much as 100 MB if all
§
utilities, documentation and sample files are to be installed.
A color monitor and a video card with at least VGA capabilities.
§
Video resolution of 1024´768 is recommended.
You will also need signal interface cables to connect ATS-2 to your
device for testing. Since there are many possible connection
configurations, signal cables are not provided with ATS-2. Audio Precision
offers cable kits with common connectors and adapters for purchase.
Contact a sales representative or Audio Precision Technical Support for
more information.
Installing the Software
To install the ATS software, use the following procedure:
Close all Windows programs.
§
Insert the ATS CD-ROM into the CD-ROM drive. The installation
§
program should start automatically. If it does not, click on the Start
8 Getting Started with ATS-2
Page 19
Setting Up the ATS-2 Hardware Chapter 2: Installation and Setup for APIB
menu and choose Run. Click Browse and choose the file Setup.exe
on the ATS CD-ROM. Click OK in the Run dialog box.
In the main menu, click Install ATS Software. Follow the on-screen
§
instructions. The installation program prompts you to enter the
required information.
The installer may prompt you to reboot the machine. Although you
§
do not need to reboot immediately, you must reboot before you can
use the ATS-2 hardware.
Setting Up the ATS-2 Hardware
Connecting ATS-2 to the Electrical Mains Supply
ATS-2 must be connected to a 50–60 Hz alternating current (AC)
electrical mains supply, maximum voltage 250 Vrms.
The units are configured at the factory for the expected voltage at their
intended destination. The voltage setting and fusing arrangement will
normally be correct unless the unit has been transported into another area.
The power entry module has a strip of indicator tape showing its mains
voltage setting. This tape must be removed before use.
You MUST be sure that the ATS-2 mains power configuration
is correct for the electrical mains power supplied in your area.
If you are not sure, do not plug ATS-2 in to the mains power.
Follow the instructions below to check or change the ATS-2
mains supply voltage selection.
The mains power supply is applied to ATS-2 through the power entry
module located on the rear panel. Before connecting the power cord,
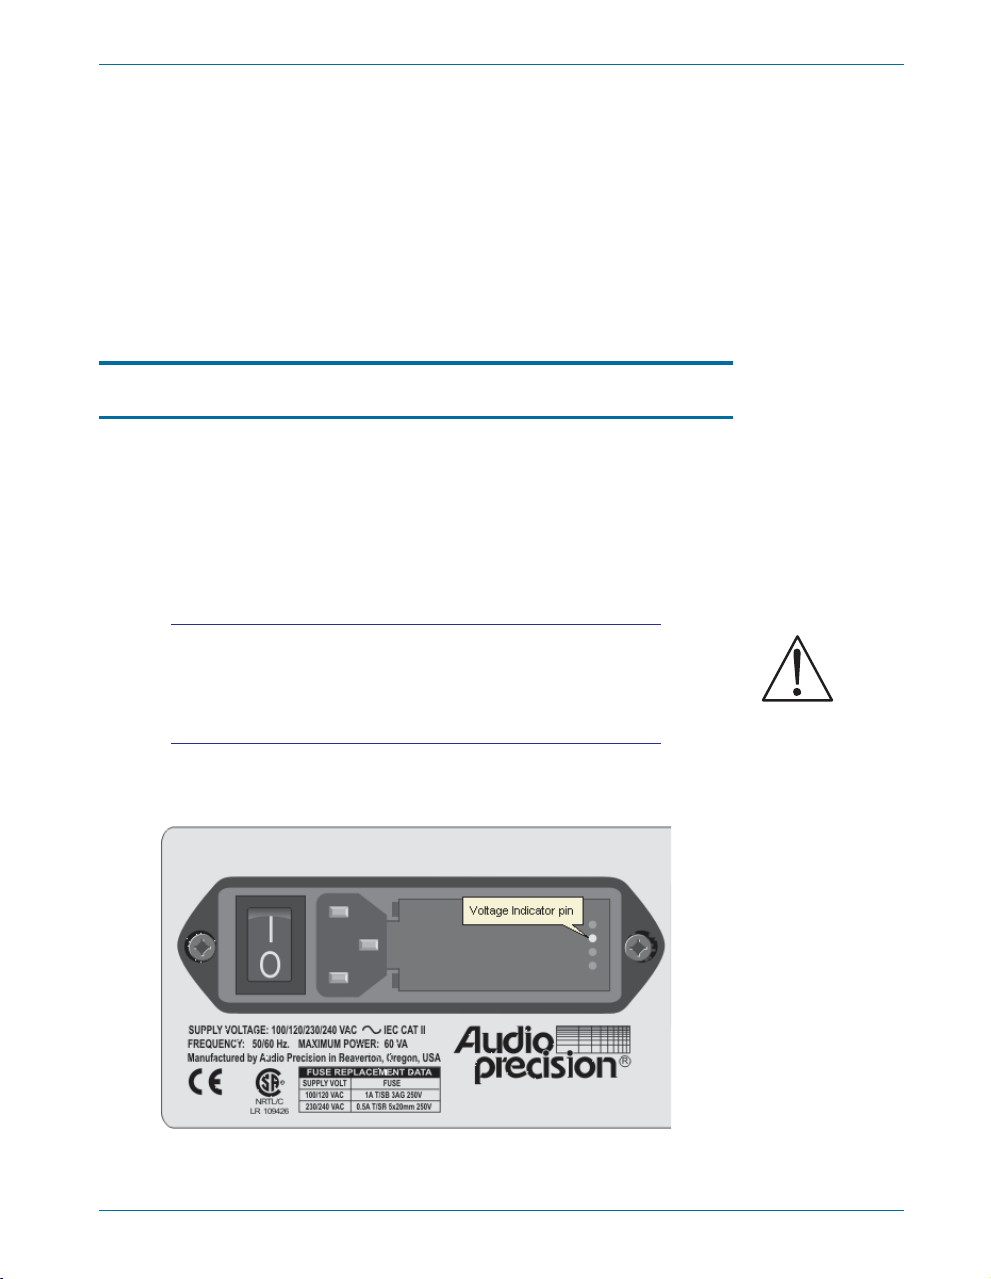
Figure 2. Detail, power entry module on ATS-2 rear panel.
Getting Started with ATS-2 9
Page 20
Chapter 2: Installation and Setup for APIB Setting Up the ATS-2 Hardware
confirm that the input voltage selection and fusing arrangement in the
power entry module are correct for your mains power supply.
Checking the Mains Supply Voltage Configuration
The voltage indicator pin protrudes through one of the four labeled
holes in the module cover to indicate the selected input voltage, as shown
in Figure 2. Check that the indicated voltage matches your mains supply
voltage.
Opening the Power Entry Module
Unplug the power cord from the instrument before changing fuses or
performing any other operations described in this section.
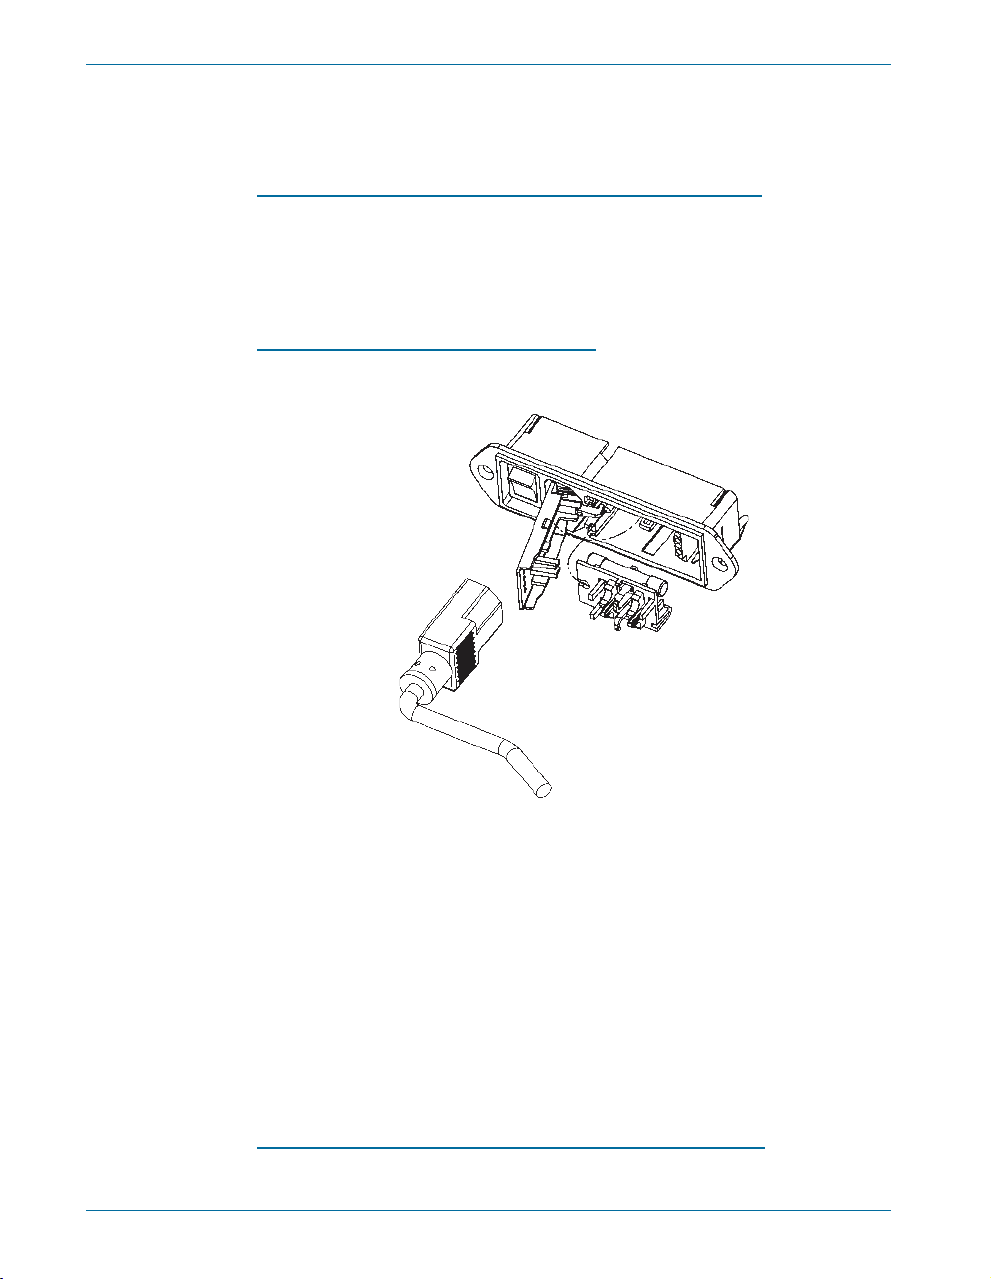
Figure 3. Power entry module door and fuse block.
To open the Power Entry Module, refer to Figure 3 and proceed as
follows:
Remove the mains power supply cord from the power cord
§
connector.
Locate the slot in the module cover door hinge. The hinge is a the
§
left side of the cover door, and the slot in the hinge is visible in the
power cord connector cavity. Insert a small screwdriver or similar tool
in the slot and pry the cover door hinge outward. The cover door will
snap out, and then can be pivoted on its hinge for access to the fuse
block assembly and voltage selector card.
Changing the Mains Supply Voltage Configuration
Open the Power Entry Module as described above.
§
10 Getting Started with ATS-2
Page 21
Setting Up the ATS-2 Hardware Chapter 2: Installation and Setup for APIB
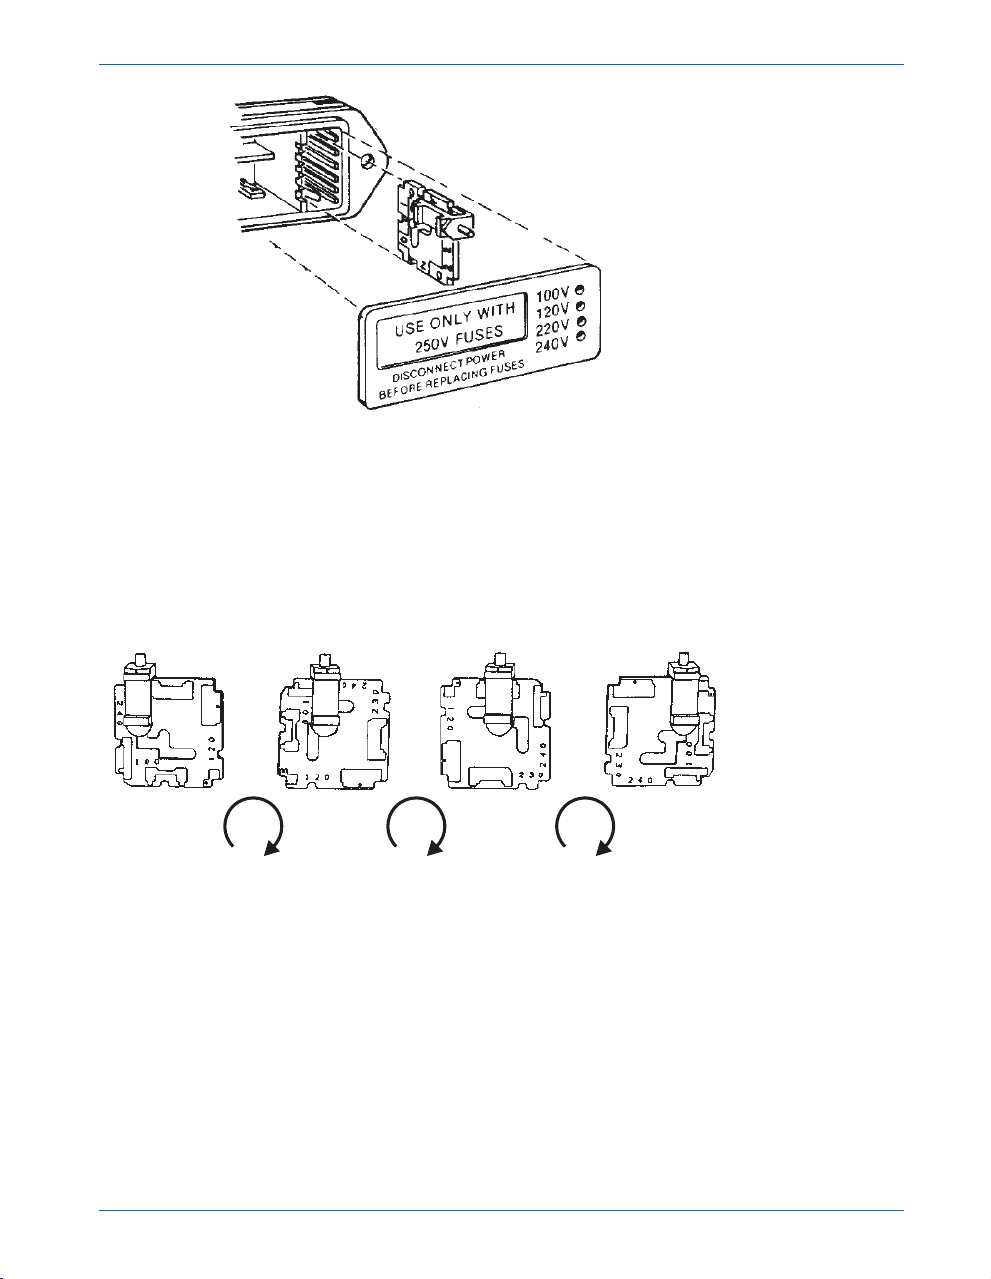
Figure 4. Changing the mains power supply voltage.
The voltage selector card is a small circuit board fitted with a white
§
plastic indicator pin, installed in a housing on the right side of the
Power Entry Module as shown in Figure 4. Pull the voltage selector
card straight out of the housing, using narrow pliers to grab the card.
Do not use the indicator pin as a handle.
Orient the selector card so that the desired input voltage is readable
§
at the bottom, shown in Figure 5. Then move the indicator pin to
100V 120V 230V 240V
point UP, opposite the indicated voltage. Seat the pin assembly in the
notch on the board edge.
Insert the voltage selector card into the housing with the printed side
§
of the card facing toward the mains power connector. The card edge
indicating the desired voltage should enter the housing first.
Confirm that the correct fuse or fuse combination is installed for the
§
intended input voltage (refer to the fuse ratings marked on the
instrument rear panel). If necessary, change the fuse type as
described in the following section.
Close the module the cover door and verify that the indicator pin
§
shows the desired voltage.
Getting Started with ATS-2 11
90° 90° 90°
Figure 5. Voltage selector card positions.
Page 22
Chapter 2: Installation and Setup for APIB Setting Up the ATS-2 Hardware
Once you have verified that the line voltage selection is correct, connect
the power cord from a mains power outlet to the power cord connector on
the instrument rear panel.
Fuse Information
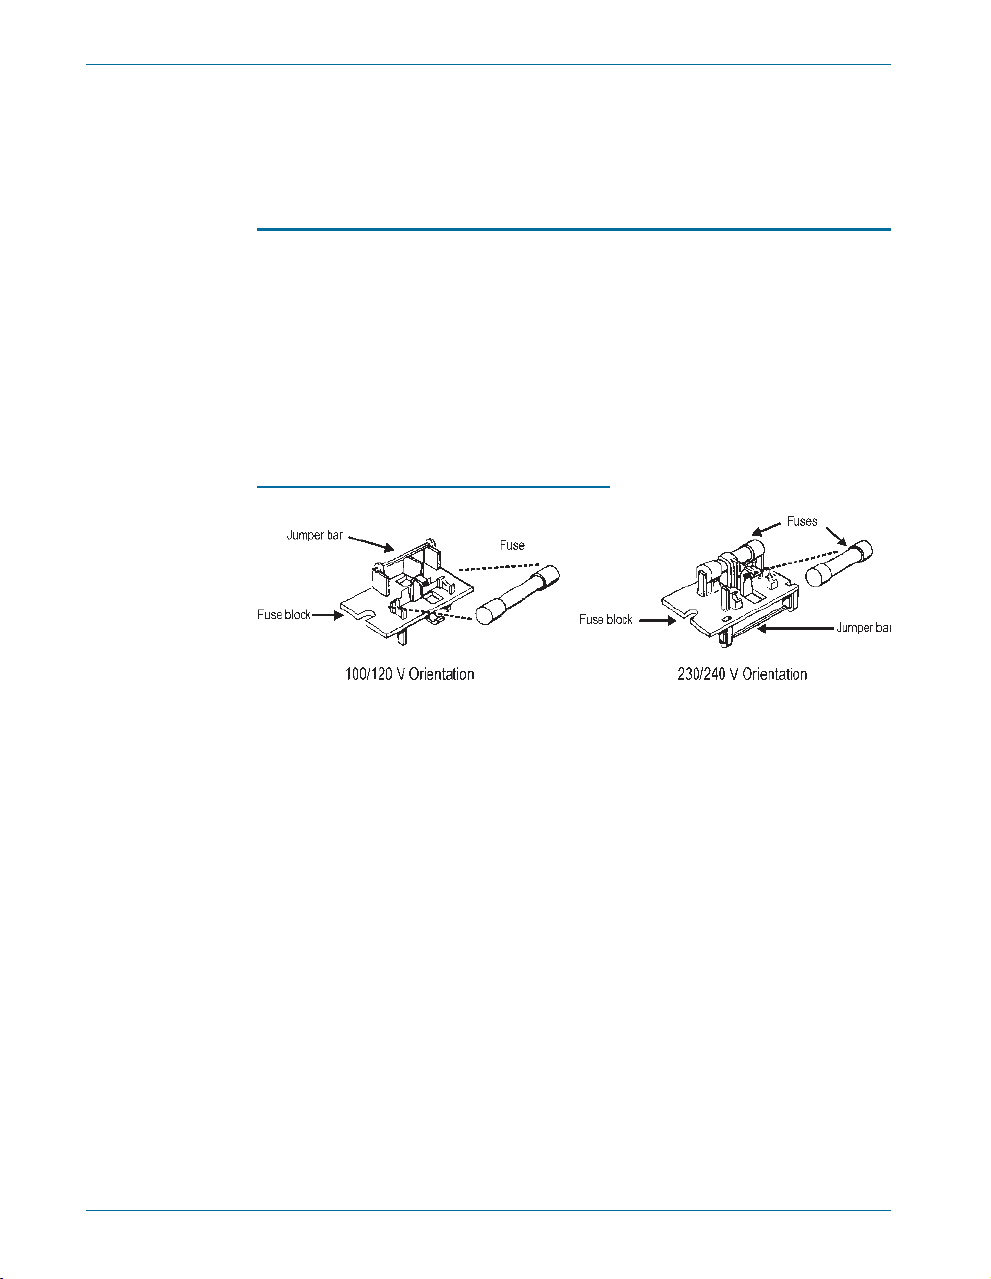
The power entry module accommodates two fusing arrangements, as
illustrated in Figure .
The North American fusing arrangement uses a single type 3AG
§
(0.25" ´ 1.25") SB (slow blow) fuse.
The European fusing arrangement uses two 5´20 mm IEC-approved
§
type T fuses.
Refer to the label on the rear panel for fuse current ratings.
Changing the Fusing Arrangement
Figure 6. Fuse Block Orientation for North American (100/120 V)
and European (230/240 V) operation..
To replace a fuse or change the fusing arrangement, proceed as follows:
Remove the mains power cord from the power cord connector and
§
open the Power Entry Module as described above.
Using narrow pliers, pull the fuse assembly out of the housing.
§
Change or add the correct fuses as necessary, referring to Figure 6.
§
Refer to the instrument rear panel for the correct fuse electrical
current rating.
Insert the fuse assembly in the housing, with the side of the assembly
§
that carries the fuse(s) for your desired fusing arrangement facing into
the housing. Press the fuse assembly firmly into the housing.
Confirm that the line voltage selection is correct for your mains
§
voltage and your fusing arrangement.
Once you have verified that the line voltage selection is correct, connect
the power cord from a mains power outlet to the power cord connector on
the instrument rear panel.
12 Getting Started with ATS-2
Page 23
Connecting ATS-2 to Your PC Chapter 2: Installation and Setup for APIB
Connecting ATS-2 to Your PC
Before connecting ATS-2 to your PC, install the ATS software. See page
8 for details.
The ATS software communicates with the ATS-2 chassis through the
Audio Precision Interface Bus (APIB). We offer two options for the APIB
interface:
The PCI card. Some newer PCs use the PCI bus exclusively; many
§
PCs have a mix of both ISA and PCI bus slots available.
The PCMCIA card. This card allows you to use an existing PCMCIA
§
interface found in many laptop computers. We offer an adapter for
desktop PCs without a PCMCIA slot.
Your system was shipped with an APIB interface cable and with the
interface option you ordered. Refer to the appropriate section for your
interface below.
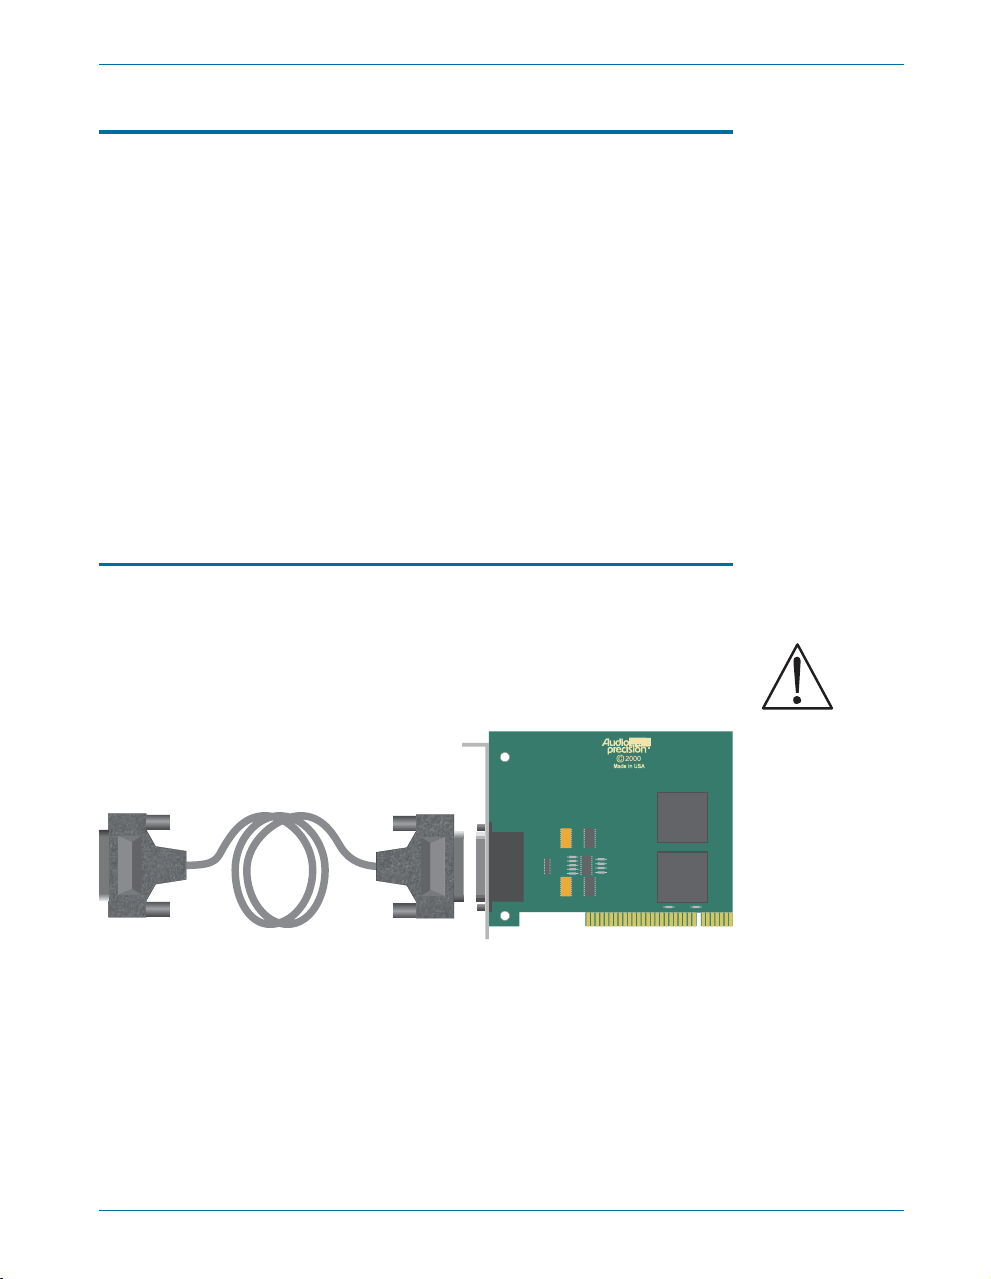
Installing a PCI APIB Card
To install the PCI card, use the following procedure:
Turn off your computer, remove the cover, and install the PCI APIB
§
interface card in an open PCI bus slot. Remember to handle the card
properly to minimize static electricity discharges while installing it. Be
Figure 7. PCI card and APIB cable.
sure the card is well seated in the slot; it should snap down firmly into
the bus connector.
Secure the card bracket with the mounting screw and replace the
§
computer cover.
Connect the APIB cable between ATS-2 and the PCI card.
§
Getting Started with ATS-2 13
Page 24
Chapter 2: Installation and Setup for APIB Connecting ATS-2 to Your PC
PCM-WIN
Turn on the computer. Windows should automatically find and
§
identify the APIB interface and install the correct driver.
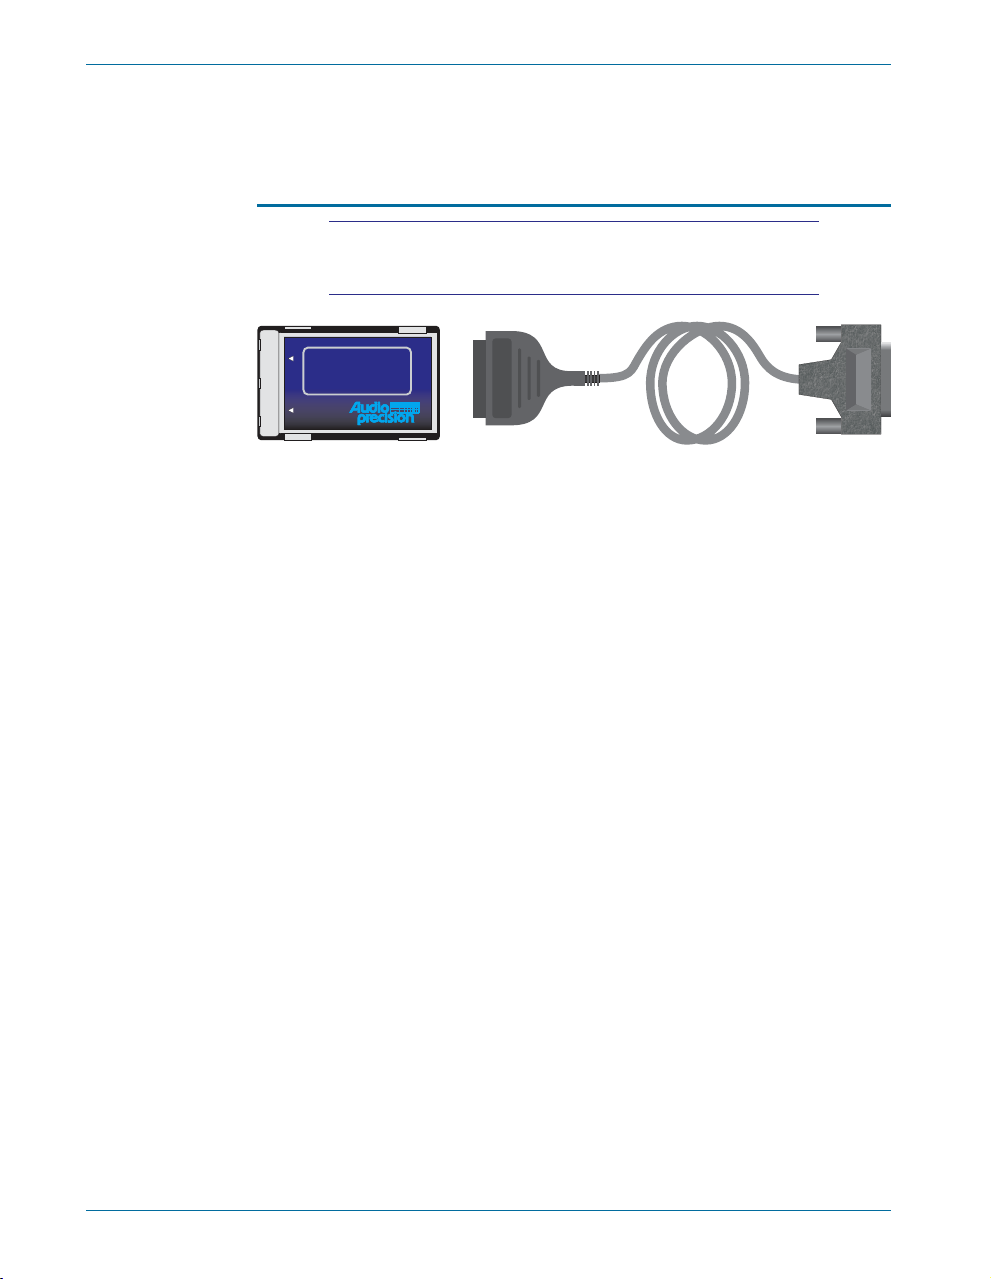
Using the PCM-WIN PCMCIA Interface Card
The ATS-2 PCMCIA interface is most commonly used with
laptop computers, but can be used in other computers with
the appropriate adapter.
For use with S1.EXE, LIB-C orAPWIN
INSERT HERE
PCMCIA to
Audio Precision
Interface Bus
APIB
Figure 8. PCMCIA card and APIB cable.
To use the PCMCIA card, you must have a working PCMCIA interface
already installed in your computer. If you do not have a PCMCIA
interface, Audio Precision offers two adapters: one for an ISA slot, and one
for a PCI slot. Please contact Audio Precision Technical Support for details,
or visit the Audio Precision Web site.
To install the PCMCIA card, use the following procedure:
Install the PCMCIA adapter and drivers if necessary by following the
§
instructions supplied with the adapter.
Insert the PCMCIA card into the PCMCIA interface.
§
Connect the APIB cable between ATS-2 and the PCMCIA card.
§
14 Getting Started with ATS-2
Page 25
Chapter 3
Hardware Overview
The ATS-2 hardware includes input and output connectors, ranging and
signal conditioning modules, digital signal processors, memory, and other
circuitry needed to perform audio measurements. It is connected to the
controller PC by the Audio Precision Interface Bus (APIB). In this chapter,
the features of the hardware are described. For a full list of hardware
specifications, see Chapter 6.
When ordered in the optional GPIB configuration (ATS2G), ATS-2 can
also be controlled by the industry-standard IEEE 488.2 General Purpose
Interface Bus (GPIB). GPIB operation is not covered in this chapter. See
Chapter 7 for more information about the ATS-2 GPIB configuration.
All signal generation and analysis is performed in the ATS-2 hardware,
including storage of signals acquired for DSP waveform display or FFT
analysis.
ATS-2 Front Panel
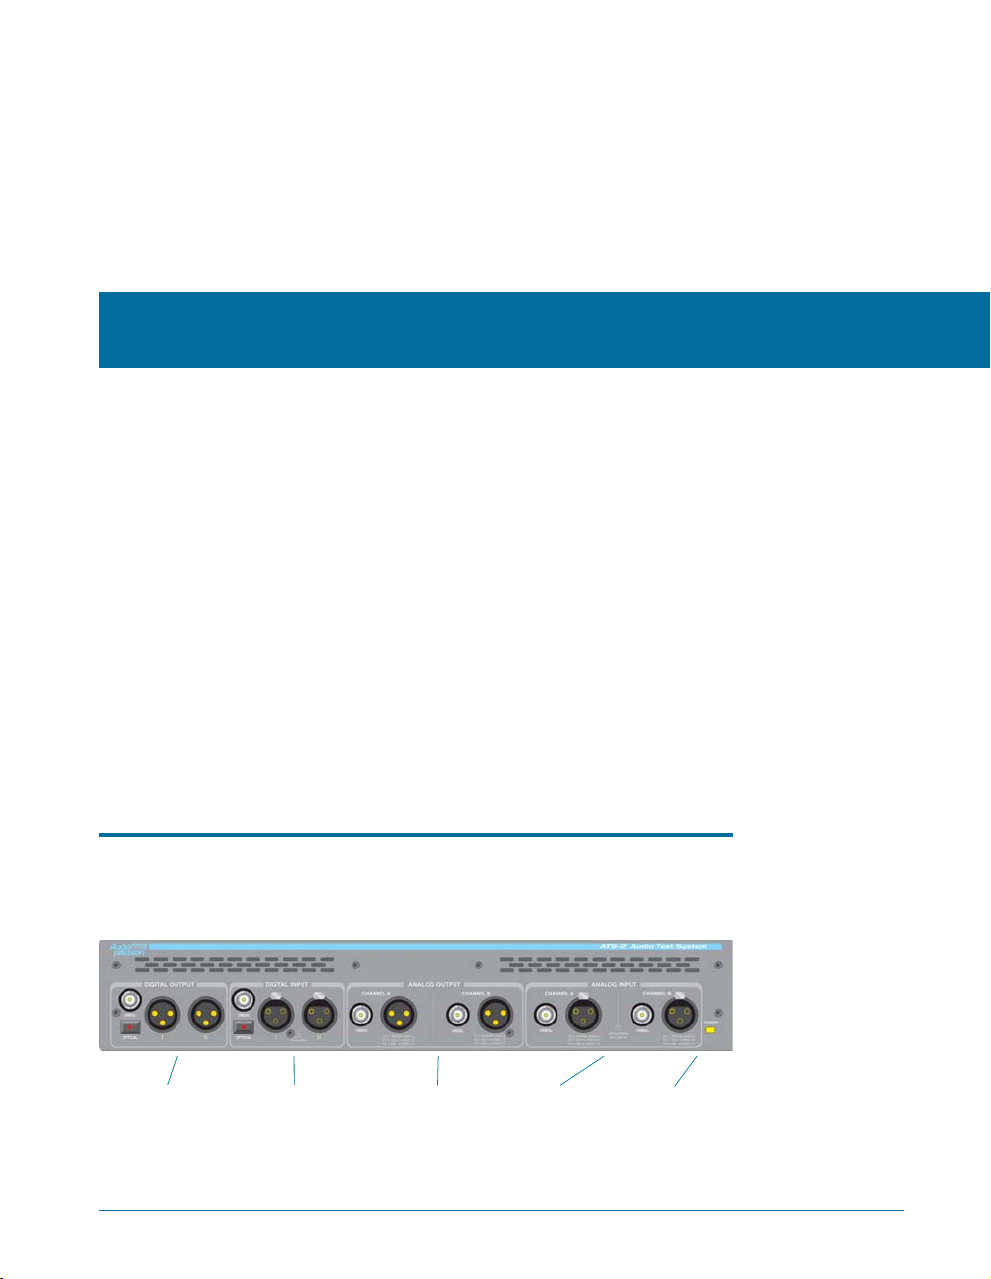
The ATS-2 front panel, shown in Figure 9, includes the digital and
analog inputs and outputs and a power indicator.
Digital Output
Figure 9. ATS-2 front panel.
Getting Started with ATS-2 15
Digital Input Analog Inputs Power Indicator
Analog Outputs
Page 26
Chapter 3: Hardware Overview ATS-2 Rear Panel
r
DIGITAL OUTPUTS
§
In single-connector mode, ATS-2 transmits stereo digital audio
simultaneously on the XLR “I” connector, the BNC connector, and
the optical connector. In dual-connector mode, channels A and B are
transmitted on the XLR “I” and “II” connectors, respectively.
DIGITAL INPUTS
§
In single-connector mode, ATS-2 receives stereo digital audio from
the XLR “I” connector, the BNC connector, or the optical connector.
In dual-connector mode, channels A and B are received on the XLR
“I” and “II” connectors, respectively.
ANALOG OUTPUTS
§
The ATS-2 analog generator outputs (both “A” and “B” channels) are
available as unbalanced signals on the BNC connectors and as
balanced signals on the XLR connectors.
ANALOG INPUTS
§
The XLR balanced and the BNC unbalanced connectors (both “A”
and “B” channels) are connected to the ATS-2 analyzer inputs.
See Chapter 4 of the ATS-2 User’s Manual for more information about
the ATS-2 inputs and outputs and the panels associated with them.
ATS-2 Rear Panel
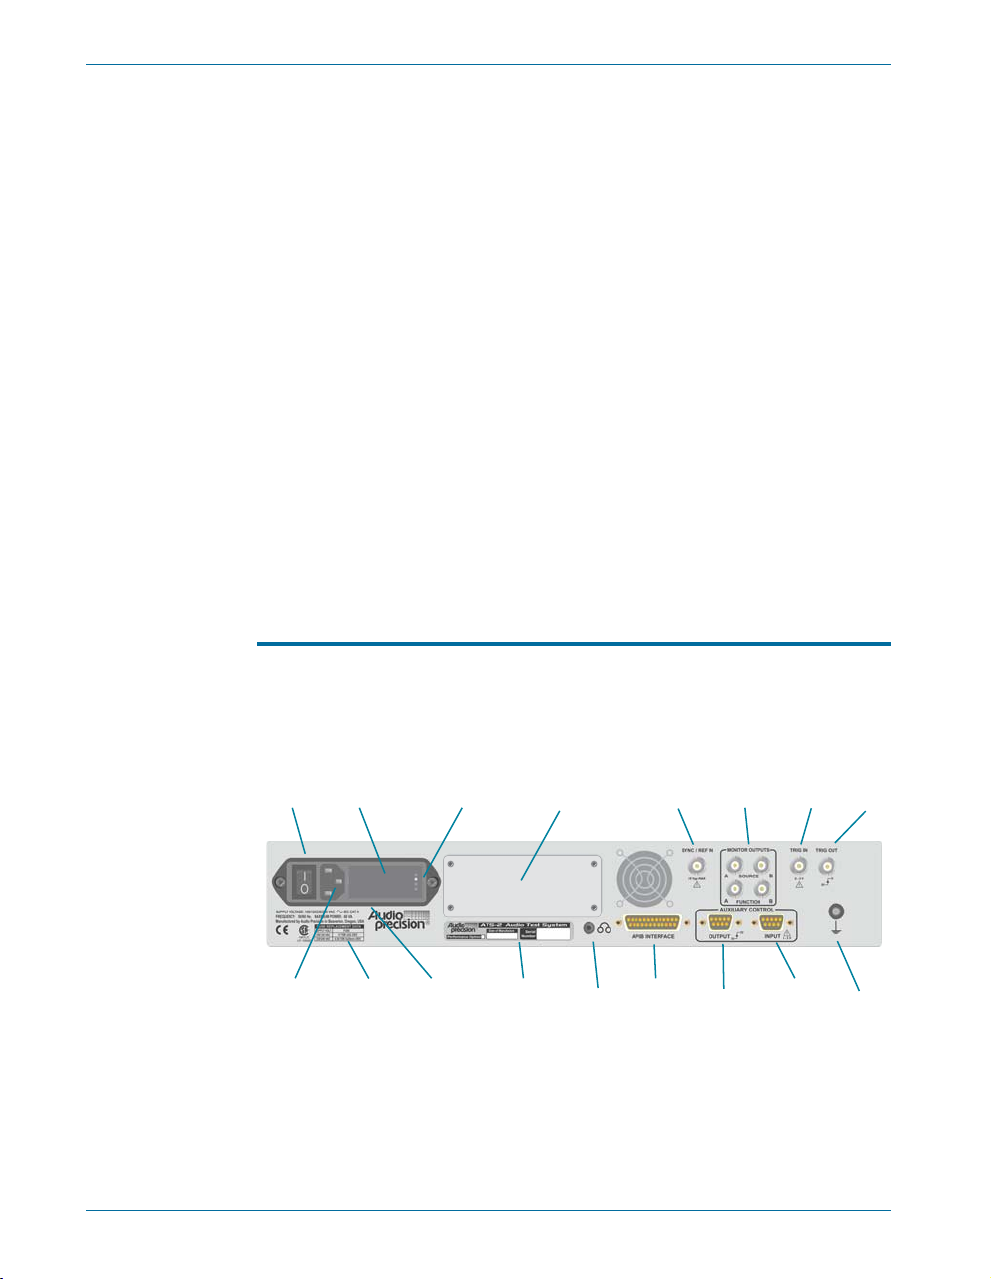
The ATS-2 interface, monitor, headphone, trigger, sync, and utility
connections are mounted on the rear panel.
Fuse Holder /
Power
Switch
Power
Cord
Connector
Mains Supply
Voltage Jumper
Fuse
Replacement
Information
Mains Voltage
Indicator
Power
Entry
Module
S/N, Option
Reserved for
GPIB Panel
Label
Headphone
Jack
Sync/RefIn
APIB
Monitor
Outputs
Auxiliary
Control Out
Trig In Trig Out
Auxiliary
Control In
Ground
Connecto
Figure 10. ATS-2 rear panel, APIB-only configuration.
POWER ENTRY MODULE—this module includes:
§
POWER SWITCH—This switch turns the mains power supply to
the ATS-2 hardware ON ( I ) or OFF ( O ).
16 Getting Started with ATS-2
Page 27

ATS-2 Rear Panel Chapter 3: Hardware Overview
POWER CORD CONNECTOR—This is a standard grounded
connector for the mains power supply cord.
FUSE HOLDER/MAINS SUPPLY VOLTAGE JUMPER—Contains
the mains power fuse and the mains supply voltage configuration
jumper card. See Chapter 2.
MAINS SUPPLY VOLTAGE INDICATOR—The white tip of the
plastic indicator on the voltage configuration jumper card appears
in one of four small holes to show the mains voltage selection.
FUSE REPLACEMENT INFORMATION—This chart lists the fuse
§
values required for correct operation at the four supply voltage
options.
SERIAL NUMBER/OPTIONS LABEL—The Audio Precision serial
§
number for this ATS-2 chassis, and the hardware options (if any)
included in the chassis.
MONITOR JACK—This is a 3.5 mm jack suitable for driving stereo
§
headphones or other audio monitors.
RESERVED FOR GPIB PANEL—This blank panel can be removed
§
for factory installation of the GPIB configuration option, adding
GPIB (IEEE-488.2 General Purpose Interface Bus) functionality to
ATS-2. If your ATS-2 is configured for GPIB, see Chapter 7.
SYNC/REF IN—This connector provides an input for an external
§
digital audio signal, a square wave, or an NTSC/PAL video signal for
sample rate synchronization (“house sync”).
AUDIO MONITORS—The “source” connectors monitor the signal
§
currently being analyzed. The “function” connectors monitor the
function meter in the audio analyzer. These signals can also be
monitored on the internal speaker.
TRIG IN—This connector provides an input to trigger or initiate
§
certain measurement functions.
TRIG OUT—This connector provides an output for triggering an
§
external oscilloscope or other equipment.
APIB INTERFACE—This connector provides the two-way Audio
§
Precision Interface Bus connection between ATS-2 and the personal
computer running the ATS software.
AUXILIARY CONTROL OUT—A 9-pin DSUB connector to enable
§
ATS-2 to control other instruments.
AUXILIARY CONTROL IN—A 9-pin DSUB connector for external
§
control and display input.
GROUND CONNECTOR—This is connected to chassis ground.
§
Getting Started with ATS-2 17
Page 28

Chapter 3: Hardware Overview ATS-2 Rear Panel
18 Getting Started with ATS-2
Page 29

Chapter 4
ATS-2 User Interface
Overview
ATS-2 is controlled by the ATS software running on the controller PC
via the Audio Precision Interface Bus (APIB). The hardware is configured
through settings in fields on software panels, and readings (measurements)
are taken from meters on other panels. It is also possible to change settings
and collect readings programmatically using the AP Basic language.
When ordered in the optional GPIB configuration (ATS2G), ATS-2 can
also be controlled by the industry-standard IEEE 488.2 General Purpose
Interface Bus (GPIB). GPIB operation is not covered in this chapter. See
Chapter 7 for more information about the ATS-2 GPIB configuration.
Like many Windows applications, the ATS user interface has a menu
bar, a status bar, toolbars, and a workspace. With these tools you can save
test and data files, export and print measurement results, configure the
hardware and software to your needs, access online help, design and
launch automated processes and, of course, open and operate the
instrument panels where the core test and measurement work is
performed.
The ATS software is a powerful and complex program. This chapter
provides a quick introduction to its features. For an in-depth discussion,
refer to the ATS-2 User’s Manual.
A Note on Nomenclature
In this chapter we use the following shorthand:
Menu > Item. This refers to choosing an item from one of the
§
pull-down menus located at the top of the workspace. For instance,
Getting Started with ATS-2 19
Page 30
Chapter 4: ATS-2 User Interface Starting up the ATS Software
‘choose Utilities > Restore’ means that you select the Utilities
pull-down menu, then click on the Restore item.
Starting up the ATS Software
As part of the ATS installation process, an ‘ATS’ icon is placed on the
desktop of your PC. Click on this icon to start the software. If you have
hardware connected and powered up, the software will automatically
detect the hardware and initialize it. If you do not have hardware
connected, or it is not powered up, the software will prompt you to start
demo mode. At this point, you have three options:
Yes. Choose this option to invoke demo mode. In this mode, the
§
software presents panels and menus as if hardware were connected,
but panel meters show random data. This mode can be used for
creating tests, editing data, etc.
Retry. Choose this option if you have since connected the hardware
§
and powered it up.
Exit. Choose this option to exit the software.
§
If you have chosen to run the software, ATS will start up and show the
workspace.
ATS Workspace
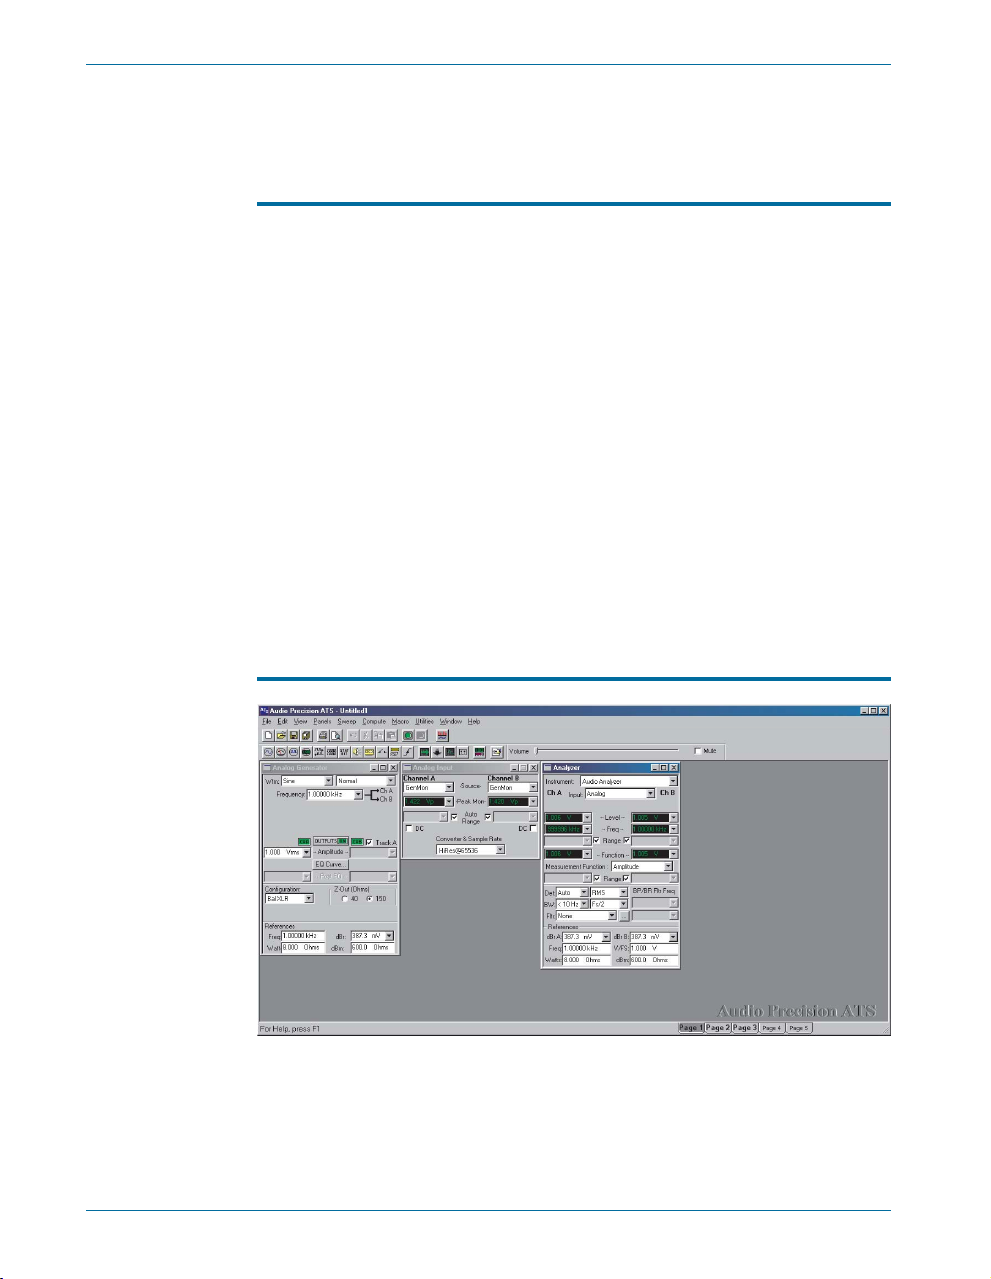
Figure 11. The ATS workspace.
The ATS workspace has five pages that you can select by menu
commands (View > Page #) or by clicking the numbered tabs on the
Status Bar. The workspace is a multi-layered desktop where you can
20 Getting Started with ATS-2
Page 31
ATS Panels Chapter 4: ATS-2 User Interface
display and organize the instrument panels you are using for a particular
set of tests.
ATS Panels
Interaction with ATS-2 is performed through control and measurement
windows called panels. These duplicate the function of physical control
panels found on conventional test and measurement equipment. The
panels are available through menu commands, toolbar icons, and
keyboard shortcuts.
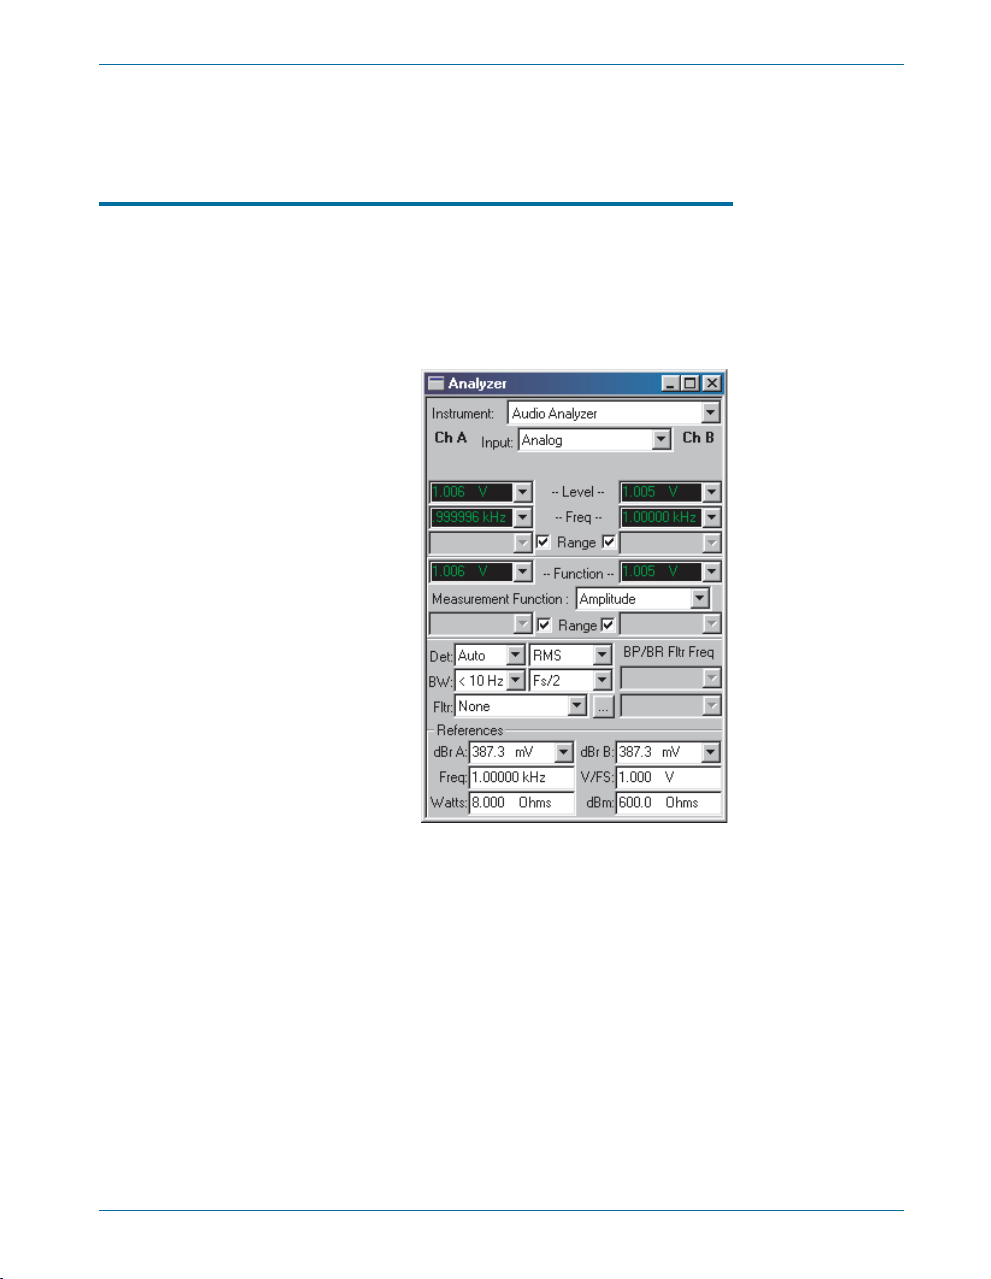
Figure 12.
An ATS instrument
panel.
A panel can be placed on one or more workspace pages. (Duplicate
panels show the same information.) Many panels come in two sizes, the
smaller having the most commonly used fields visible, and the larger
showing every option. Double-click on a panel title bar to expand or
contract the panel.
You can minimize or close a panel without canceling its function or
effect. For example, you can set a signal’s output voltage and frequency on
the generator panel, and then close the panel window. The signal will
continue at those settings until you turn the generator OFF.
Getting Started with ATS-2 21
Page 32
Chapter 4: ATS-2 User Interface ATS Panels
Panel Settings
Settings for tests and measurements are made using several different
controls on the panels:
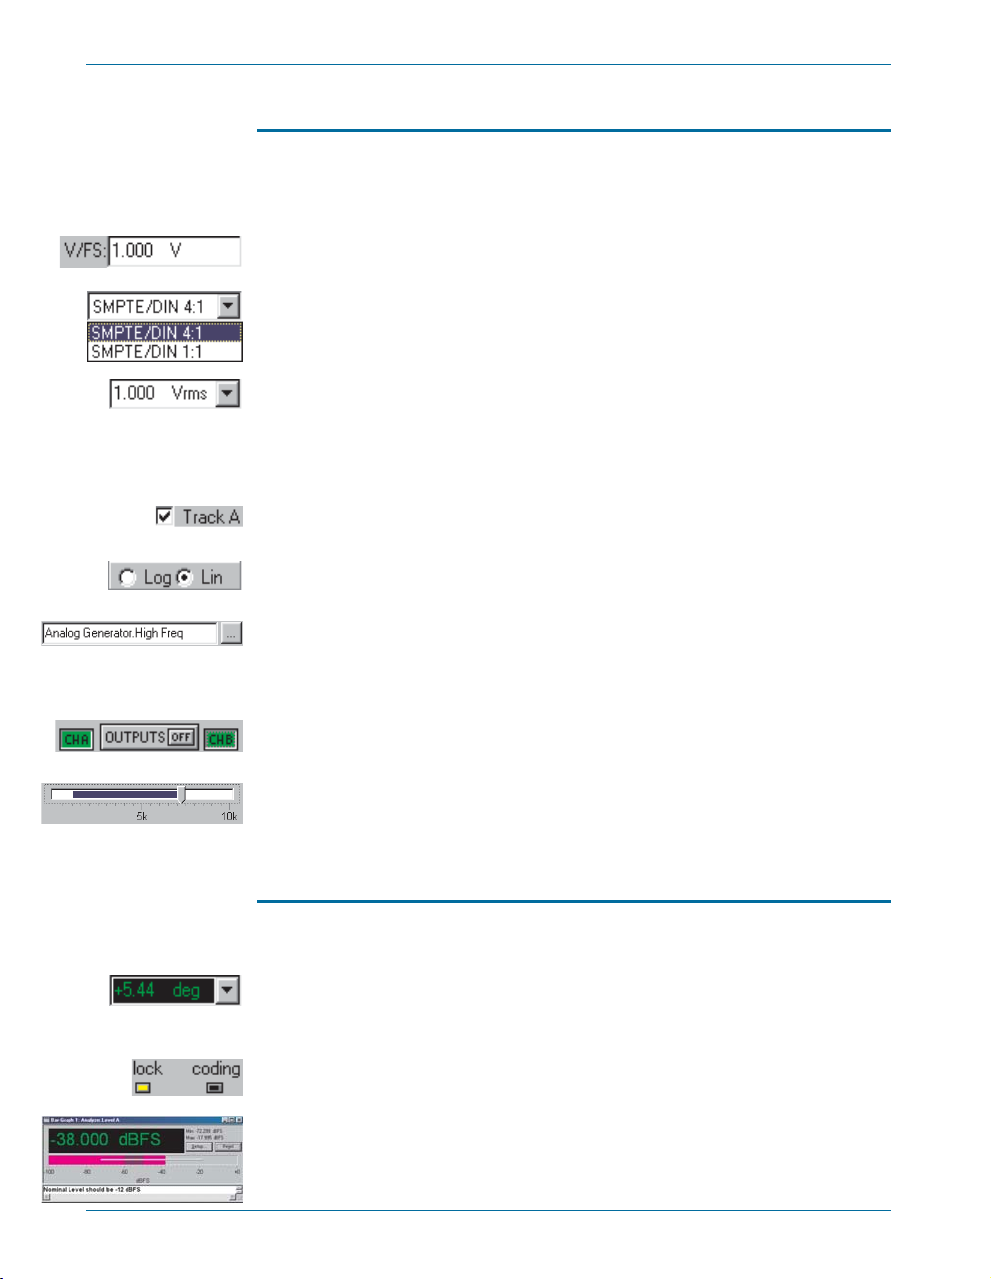
Setting fields, which come in several versions:
§
A Windows text box, in which you can directly enter a value from
the keyboard.
A Windows drop-down list box, from which you can make a
selection of a fixed number of choices.
A combination text box with an added drop-down list from which
you can choose the units to express your value.
Setting fields display black characters on a white field, except when
an EQ waveform is selected, when the generator amplitude fields
show blue text.
Check boxes, which allow you to set non-exclusive conditions.
§
Option buttons, which provide for exclusive conditions.
§
Browser buttons, which open Windows browsers. These allow you to
§
navigate lists of options, search for a file by browsing through a
hierarchy of folders, and so on. Browser buttons are identified by the
ellipsis mark ( … ).
Custom buttons, which have a special function, such as GO, ON,
§
OFF, and so on.
Sliders, with which you can continuously adjust a value. Sliders are
§
found on Bar-Graph panels and the Volume Bar. Sliders can be
operated by the mouse pointer or the arrow keys.
Panel Readings
Results of tests or measurements are called readings, which ATS-2 can
display in several ways:
Reading fields, sometimes called meters. Reading fields come in two
§
variations, with and without a drop-down list to select units. Reading
fields display green characters on a black field.
Status indicators, which show the presence or absence of a condition
§
by a small colored rectangle.
Bar-graphs, which display values as a continuous colored bar, like a
§
conventional analog meter.
22 Getting Started with ATS-2
Page 33

ATS Menus Chapter 4: ATS-2 User Interface
ATS Menus
The Menu bar extends across the top of the ATS workspace and is
always visible. Here, we give a brief overview of each menu item. Please
refer to Chapter 2 of the ATS-2 User’s Manual for more details.
File Menu
The File menu offers commands for opening, saving, appending,
importing, exporting and printing ATS files, and accessing the Quick
Launch menu.
Since there are several file types used by ATS, submenus are available
(at the small black arrows } accompanying some menu choices) to choose,
for example, whether to Save As a Test, Data,orMacro file.
The listings at the bottom of the File menu show the last tests opened by
ATS, and provide a convenient way to open a recent test.
Edit Menu
The Edit Menu provides editing commands. The standard Windows
editing functions Undo, Cut, Copy, and Paste are available, together
with functions unique to ATS. Consult the ATS-2 User’s Manual for details.
View Menu
The View menu allows you to select which workspace page is visible,
and which toolbars are displayed. A checkmark next to a View menu item
indicates that the selection is visible. See the Toolbars and Buttons section
below for more information on toolbars.
Panels Menu
The Panels menu allows you to select which panels are visible on the
current page. It duplicates the functions of the Panel toolbar, described
below.
Sweep Menu
The Sweep menu controls operation of the sweep. The sweep is the
fundamental method used to collect measurements in ATS. For more
information, see Chapter 5 of this manual, and Chapter 15 of the ATS-2
User’s Manual.
Getting Started with ATS-2 23
Page 34

Chapter 4: ATS-2 User Interface Status Bar
Compute Menu
The Compute menu gives access to ATS’s built-in post-processing
functions. Data collected during a sweep is available for post-processing.
See Chapter 19 of the ATS-2 User’s Manual for details.
Macro Menu
The Macro menu allows you to access the editing and debugging
functions for AP Basic macros. AP Basic is the programming language
supplied with ATS, and macros can be written to control all aspects of
ATS-2 functionality. See Chapter 23 of the ATS-2 User’s Manual for
details.
Utilities Menu
The Utilities menu allows you to initialize and configure the hardware,
and manipulate the system log file. It also launches the multitone creation
tool. See Chapter 25 of the ATS-2 User’s Manual for details.
Window Menu
The Window menu lists the current open panels and allows them to be
arranged automatically in the workspace.
Help Menu
The Help menu allows you to access ATS’s on-line help system. You can
also use the F1 key to access help for a particular control or panel field.
Status Bar
The Status bar runs across the bottom of the workspace. The left portion
displays the following information:
Current hardware status.
§
Information about the button or menu item currently under the
§
mouse pointer.
At the right, the Status bar shows the workspace page tabs. A bold tab
label indicates that a page contains at least one panel. The currently
displayed page is highlighted. Click on a tab to switch pages.
24 Getting Started with ATS-2
Page 35
Toolbars and Buttons Chapter 4: ATS-2 User Interface
Toolbars and Buttons
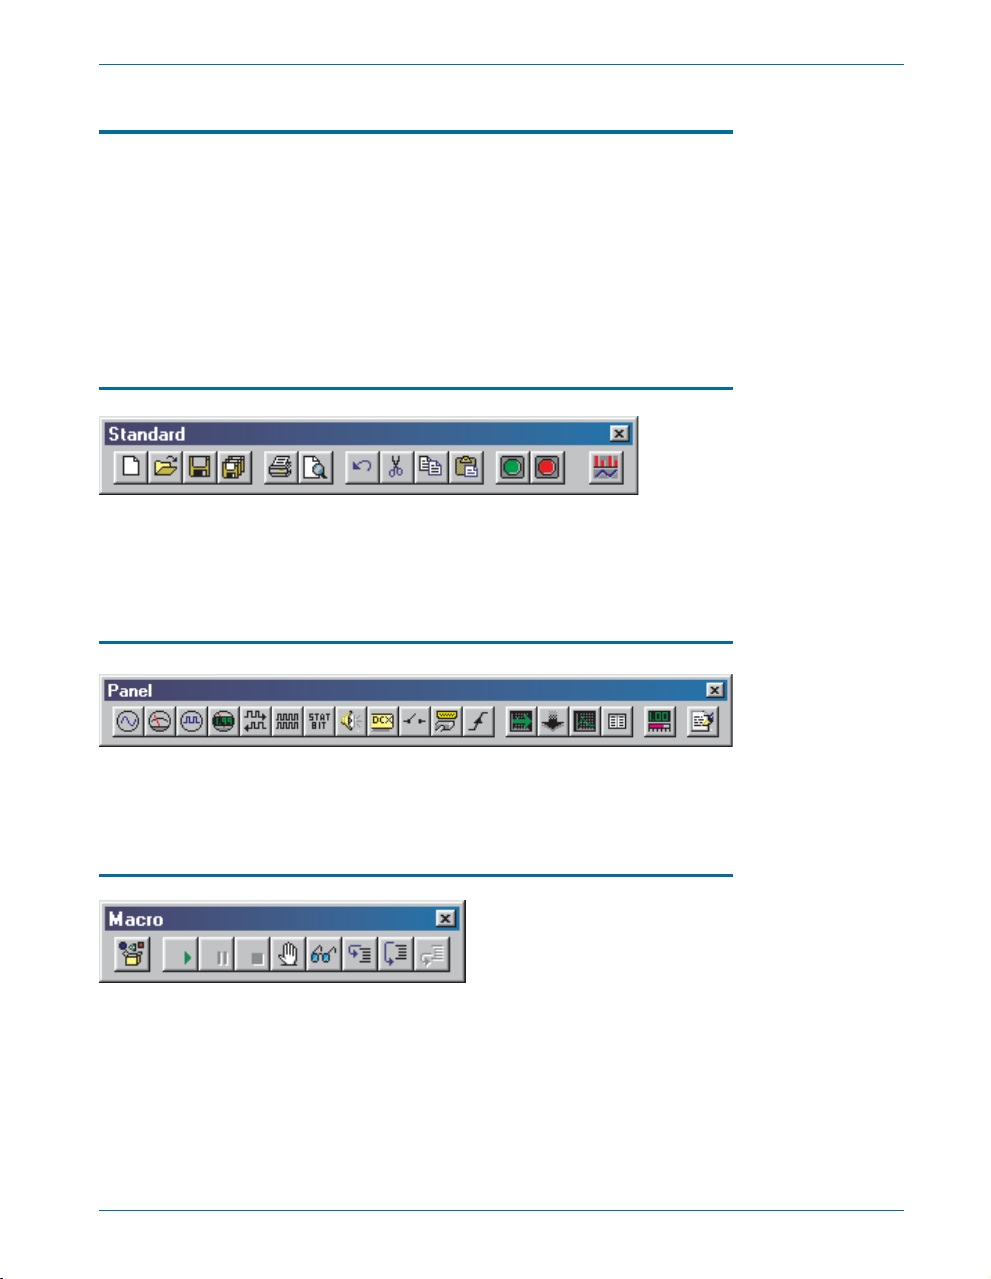
ATS has five toolbars for quick access to panels and common functions.
The toolbars can float at any location in the workspace, or they can be
docked to the Menu bar. Whether floating or docked, the toolbars appear
on every workspace page.
Buttons on the toolbars control ATS functions. A ToolTip describing the
button’s function appears when the mouse is held over a button for a short
time. See Chapter 2 of the ATS-2 User’s Manual for more information.
Standard Toolbar
The Standard toolbar gives you quick access to ATS file, printer and
editing operations, as well as Sweep Stop/Start and Sweep
Spectrum/Waveform switching.
Panels Toolbar
The Panels toolbar gives you quick access to commonly used ATS
panels. The panels are also available from the Panels menu.
Macro Toolbar
The Macro toolbar offers operations for running and editing an AP
Basic Macro. See Chapter 23 of the ATS-2 User’s Manual for explanations
of Macro toolbar button functions.
Getting Started with ATS-2 25
Page 36
Chapter 4: ATS-2 User Interface Using Files with ATS
Learn Mode Toolbar
The Learn Mode toolbar gives you the ability to turn Learn Mode on
and off. Learn Mode logs your ATS operations as you perform them,
building a macro for automation purposes. See Chapter 23 of the ATS-2
User’s Manual for more information on Learn Mode.
Quick Launch Toolbar
The Quick Launch toolbar allows you to access user-defined functions.
You can create Quick Launch buttons to open ATS tests, run AP Basic
macros, and launch other Windows programs. See Chapter 2 of the ATS-2
User’s Manual for instructions on customizing and using the Quick Launch
toolbar.
Using Files with ATS
Part of the power of ATS is its ability to create, store, load, and run files
which contain test setup and measurement data information. The primary
document in the ATS software is the test, although ATS uses other file
types as well.
Test Files
When you first launch ATS, a default setup is loaded. You can modify
this initial setup by opening or closing panels, changing configuration,
making settings, running a sweep, and so on. You can then save your
custom setup as a test. ATS saves the instrument and sweep setup
information, the input and output configuration, and the panel sizes and
positions. If you have run a sweep and collected data, the data is also
saved in the test file.
The filename extension for test files is:
ATS-2 test file—*.ats2
§
To return to the default setup, click the New Test button or the
File > New > Test command. ATS will discard your current settings and
data and reload the default setup.
You can open previously saved tests and use them as they are, or you
can modify and re-save the tests under the same name or a new name.
26 Getting Started with ATS-2
Page 37

Using Files with ATS Chapter 4: ATS-2 User Interface
Sample tests are included with ATS-2, and you can use them as starting
points for your own custom tests.
Macro Files
A macro file is a programming script which automates program
functions. ATS macros are written in the AP Basic programming language,
which is included with ATS.
The filename extension for macro files is:
AP Basic macro file—*.atsb
§
Data Files
ATS stores data from test results in memory as the test is run. As
mentioned, this information is saved along with panel and sweep setup
information in a test file. The data can also be viewed and edited in the
Data Editor panel, and can be saved as a separate file.
ATS can open saved data files to attach previous data to a current test.
There are four different data file types:
AP data file—*.atsa
§
AP limit file—*.atsl
§
AP sweep file—*.atss
§
AP EQ file—*.atsq
§
The four ATS data file types are identical except for their
filename extensions. Data saved as *.atsa, *.atsl, *.atss or
*.atsq files can be opened or attached for any data function.
The four filename extensions serve as a way to organize your
data files.
It is also possible to export ATS data as an ASCII text file for use in a
spreadsheet or text editor program. The filename extension for an ASCII
data file is:
AP ASCII data file—*.atsx
§
Waveform Files
For certain functions, including FFT displays and some types of
interface analysis, ATS-2 acquires a sample of the input waveform. These
samples can be saved as waveform files and later opened by ATS for
further use.
Getting Started with ATS-2 27
Page 38

Chapter 4: ATS-2 User Interface Using Files with ATS
The filename extensions for waveform files are:
AP stereo waveform file (generator)—*.ags
§
AP stereo waveform file (analyzer)—*.aas
§
AP mono waveform file (generator)—*.agm
§
AP mono waveform file (analyzer)—*.aam
§
AP digital interface waveform file—*.aai
§
Log File
ATS can generate a log file for debugging. The log file contains error
messages, file and sweep activity, graph information, and pass/fail test
results.
The filename extension for the log file is:
AP log file—*.alg
§
The log file is enabled and set up on the Configuration panel, and is
discussed in detail in Chapter 25 of the ATS-2 User’s Manual.
Downloadable Filter Files
ATS-2 can make use of custom filters designed and downloaded by the
user. Downloadable filters are defined in text files whose format is
described in Appendix D of the ATS-2 User’s Manual.
The filename extensions for downloadable filter files are:
AP downloadable lowpass filter file—*.afl
§
AP downloadable highpass filter file—*.afh
§
AP downloadable weighting filter file—*.afw
§
The use of downloadable filters is described in detail in Chapter 10 of
the ATS-2 User’s Manual.
28 Getting Started with ATS-2
Page 39
Chapter 5
Quick Guides
Introduction
The Quick Guides in this chapter provide a way to get used to the ATS
user interface, and to get some immediate results from ATS-2. As you
become more familiar with the system, please refer to the ATS-2 User’s
Manual for further information.
The Quick Guides begin with the assumption that ATS-2 is turned on
and connected to your PC, and that the ATS software has been launched
and is properly controlling your instrument. No cables or external devices
are needed for the Quick Guides.
Quick Guide to the Analog Signal Path
When the ATS software is launched, the default workspace is loaded
with three panels, labeled Analog Generator, Analog Input, and
Analyzer. To return to this configuration at any time, click the New Test
button. Previous settings and data will be discarded.
Analog Input Panel
ATS-2 has two channels of analog input. Each channel can receive a
signal from its front panel XLR connector, its front panel BNC connector,
or via an internal path from the analog generator. The Source fields on
the Analog Input panel present these choices as a drop-down list.
Choose ‘GenMon’ for each channel to engage the internal path.
Analog Generator Panel
In the default configuration, the Analog Generator panel is set for a
1V, 1 kHz sine wave, but the analog outputs are disabled. To turn on
Getting Started with ATS-2 29
Page 40
Chapter 5: Quick Guides Quick Guide to the Analog Signal Path
the outputs, click the OUTPUTS “OFF” button near the center of the
panel. The button will turn green, and you will hear relays click in the
ATS-2 hardware. The peak meters in the analog input panel will show
approximately 1.414 Vpp. The peak meters indicate the presence of signal
at the analog inputs.
The stereo generator outputs can be individually disabled with the
‘CHA’ and ‘CHB’ buttons next to the ‘OUTPUTS’ field. Click on the ‘CHB’
button. The button will turn gray, relays will click in the hardware, and the
Channel B peak meter on the analog input panel will indicate a level close
to zero.
Analyzer Panel
The default Analyzer panel is a real-time audio analyzer. It provides
continuous readings of signal level and frequency. It also allows you to
filter the audio signal and measure parameters such as total harmonic
distortion, phase, and so on. It is a stereo instrument, with the meters on
the left of the panel reporting channel A readings, and those on the right
reporting channel B readings.
At this point, you should have the setup shown in Figure 13:
Analog generator channel A producinga1V,1kHzsine wave.
§
Analog generator channel B disabled.
§
Analog inputs A and B set to the internal generator path (GenMon).
§
Figure 13. Current
workspace.
The topmost meters in the default Analyzer panel show the audio level
in V rms. You should see approximately1Vintheleft-hand meter
(channel A), and approximately0Vintheright-hand meter (channel B).
Click the ‘CHB’ button on the Analog Generator panel to re-enable the
channel B generator signal. You now see approximately1Vinthe
30 Getting Started with ATS-2
Page 41
Quick Guide to the Analog Signal Path Chapter 5: Quick Guides
right-hand level meter on the Analyzer panel, since the channel B
generator is now active and its signal is being routed to the analyzer via
the GenMon internal path.
The meters in the next row of the Analyzer panel show the frequency of
the signal in each channel. Both of these meters should be showing 1 kHz,
the frequency of the analog generator.
Signal Monitor
ATS-2 has an internal mono speaker to monitor both analog and digital
input signals. In addition, the signal at the speaker is available (also in
mono) at the headphone jack on the back of the instrument. When a
headphone plug is inserted into the jack, the internal speaker is
disconnected.
By default, the volume control for the speaker is below the toolbars near
the top of the ATS workspace. Move the volume slider control to the right
with the mouse. You will hear the 1 kHz tone from the generator become
louder. In the default setup, the speaker monitors the signal presented to
channel A of the analog analyzer. Click the ‘CHA’ button on the analog
generator to disable the channel A generator. The speaker will no longer
emit the 1 kHz tone.
Controlling the Analog Generator
The topmost two fields in the Analog Generator panel control the
generator waveform. The analog generator is capable of producing sine
waves, square waves, noise, and other waveforms. At this point the
waveform should be set to Sine/Normal. Pull down the left-hand list box
and choose Square to change the waveform to a square wave. If you are
monitoring the signal with the internal speaker, you will hear the timbre of
the signal change. You will also see the signal level change in the Analyzer
panel. (The square wave has a higher rms level than the sine wave for a
given amplitude setting.)
The square waveform has one parameter or setting: the frequency.
This is set in the field below the waveform selection fields. We will now
change the generator frequency to 2 kHz, as follows:
Click in the Frequency field in the Analog Generator panel. The text
§
‘1.00000 kHz’ becomes highlighted in blue.
Use the keyboard to type ‘2k’, the new generator frequency. As you
§
can hear in the monitor speaker, the frequency does not change.
Hit ‘enter’. The text changes to ‘2.00000 kHz’, the pitch increases
§
from the monitor speaker, and the frequency reading in the Analyzer
panel changes to 2.00000 kHz.
Getting Started with ATS-2 31
Page 42
Chapter 5: Quick Guides Quick Guide to the Analog Signal Path
Now switch the waveform type back to sine. The current square wave
frequency is used for the sine wave.
You can enter standard SI prefixes for multipliers as you
enter the value in the setting field. For example, ‘2000’, ‘2k’,
‘0.002M’, and ‘2000000m’ all produce the same frequency.
All waveforms can be generated at any amplitude from 0 V to the
maximum output voltage of the instrument. The amplitude for each
channel is controlled by fields below the ‘OUTPUTS’ field. If the ‘Track A’
selection is checked, the amplitude is identical in both channels and is set
by the channel A Amplitude field at the left of the panel. If ‘Track A’ is
unchecked, a channel B Amplitude field appears at the right of the panel,
and the amplitudes of the two channels can be varied independently.
Change the channel A amplitude to 0.5 V by clicking in the Amplitude
field on the Analog Generator panel, typing ‘0.5’, and hitting enter. The
level meter reading on the Analyzer panel will change. (You will also hear
relays click if the system needs to change the analog range.) Now uncheck
‘Track A’ and set the channel B amplitude to 10 V. The level meters on the
Analyzer panel will show the different levels. Both frequency meters,
however, will show the same frequency. This is because the Sine/Normal
waveform generates identical frequencies in the two channels.
The Sine/Stereo waveform, which is obtained by choosing Sine from
the left-hand waveform field and Stereo from the right-hand waveform
field, generates independent frequencies in the two channels. You can
verify the frequency in each channel by referring to the frequency meters
on the Analyzer panel.
Units
Settings and readings consist of a value and a unit. ATS can convert the
units of a setting or reading to a related unit. For instance, the analog
generator amplitude can be set in Vp (volts peak), dBV (decibels relative to
1 V), and several other units. Similarly, readings can be displayed on a
meter in any of the related units.
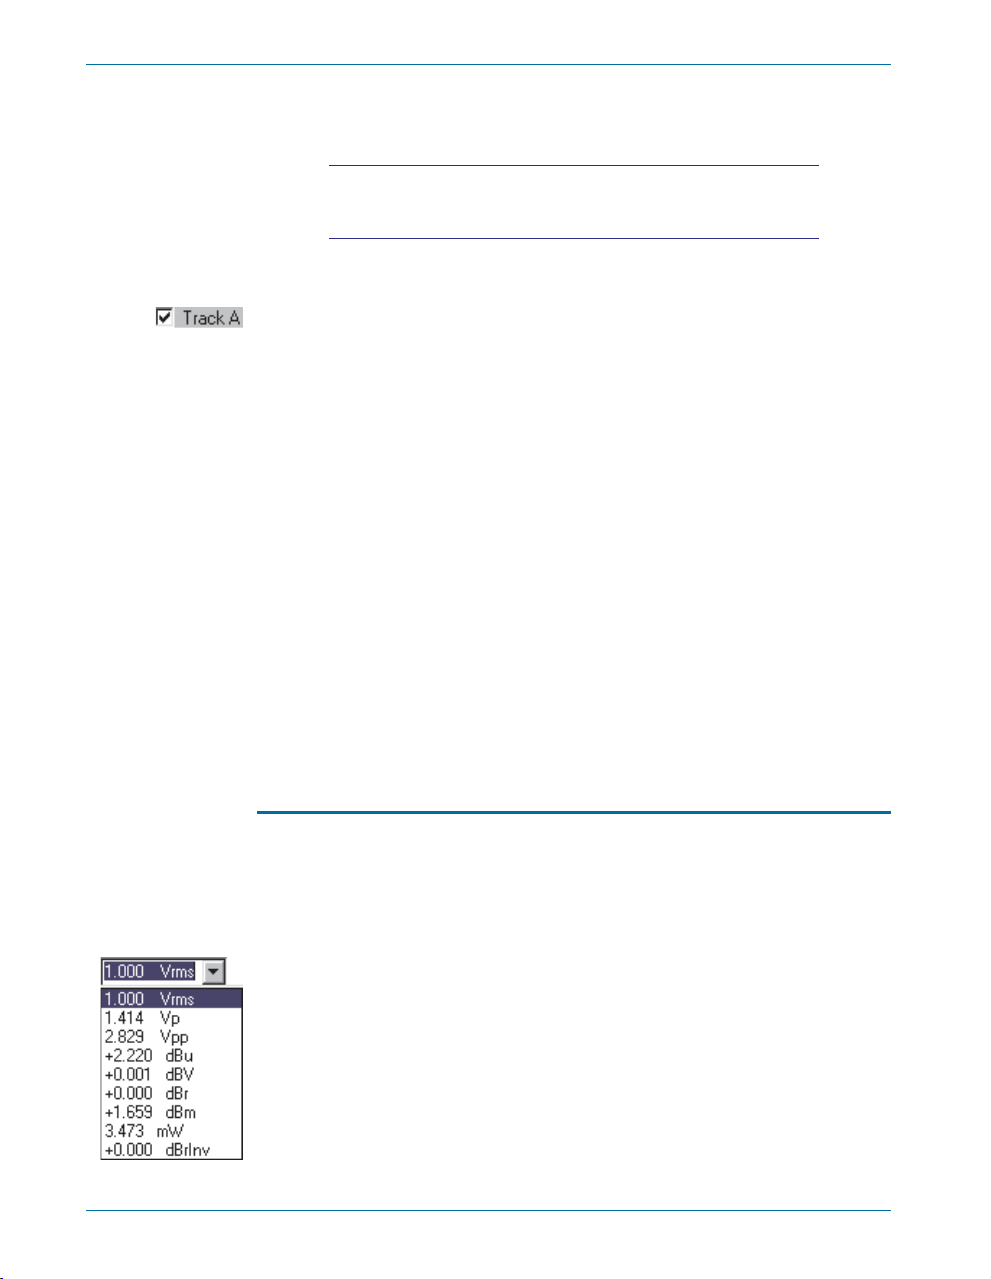
The list of units for a setting or reading can be viewed by clicking the
downward-pointing arrow next to the setting or reading field. For instance,
the list of units for the analog generator amplitude can be displayed by
clicking on the arrow next to the Amplitude field on the Analog Generator
panel. ATS displays the value currently in the field, converted to each
available unit. By clicking on the list, you can choose a setting unit.
As an example, if the amplitude is set to 1 Vrms, the drop-down list
includes conversions such as 1.414 Vp and 2.220 dBu. If you click on the
line displaying the amplitude in Vp, the setting changes to 1.414 Vp. The
32 Getting Started with ATS-2
Page 43
Quick Guide to Sweeps Chapter 5: Quick Guides
generator amplitude has not changed; the setting is displayed in a different
unit. You can now set the generator amplitude in Vp.
Some units, such as dBr, depend on a reference being set. Refer to
Appendix A of the ATS-2 User’s Manual for more information.
Quick Guide to Sweeps
Most device testing with ATS-2 is performed with sweeps. In a sweep, a
setting is stepped over a pre-defined range, while selected readings are
gathered. The result is a table of data relating the readings to each value of
the setting.
For instance, if you wanted to measure the frequency response of an
analog amplifier, you might vary the frequency of the analog generator
from 20 Hz to 20 kHz in 30 logarithmic steps, while monitoring the
analyzer channel A and channel B level readings. The result would be a
table of data with 30 rows (one for each frequency step) and 3 columns
(one for the frequency setting, one for the channel A level reading, and
one for the channel B level reading).
You can force ATS-2 to perform a “single-point sweep” for
special purposes, but generally the term sweep indicates that
a number of data points are included in the measurement.
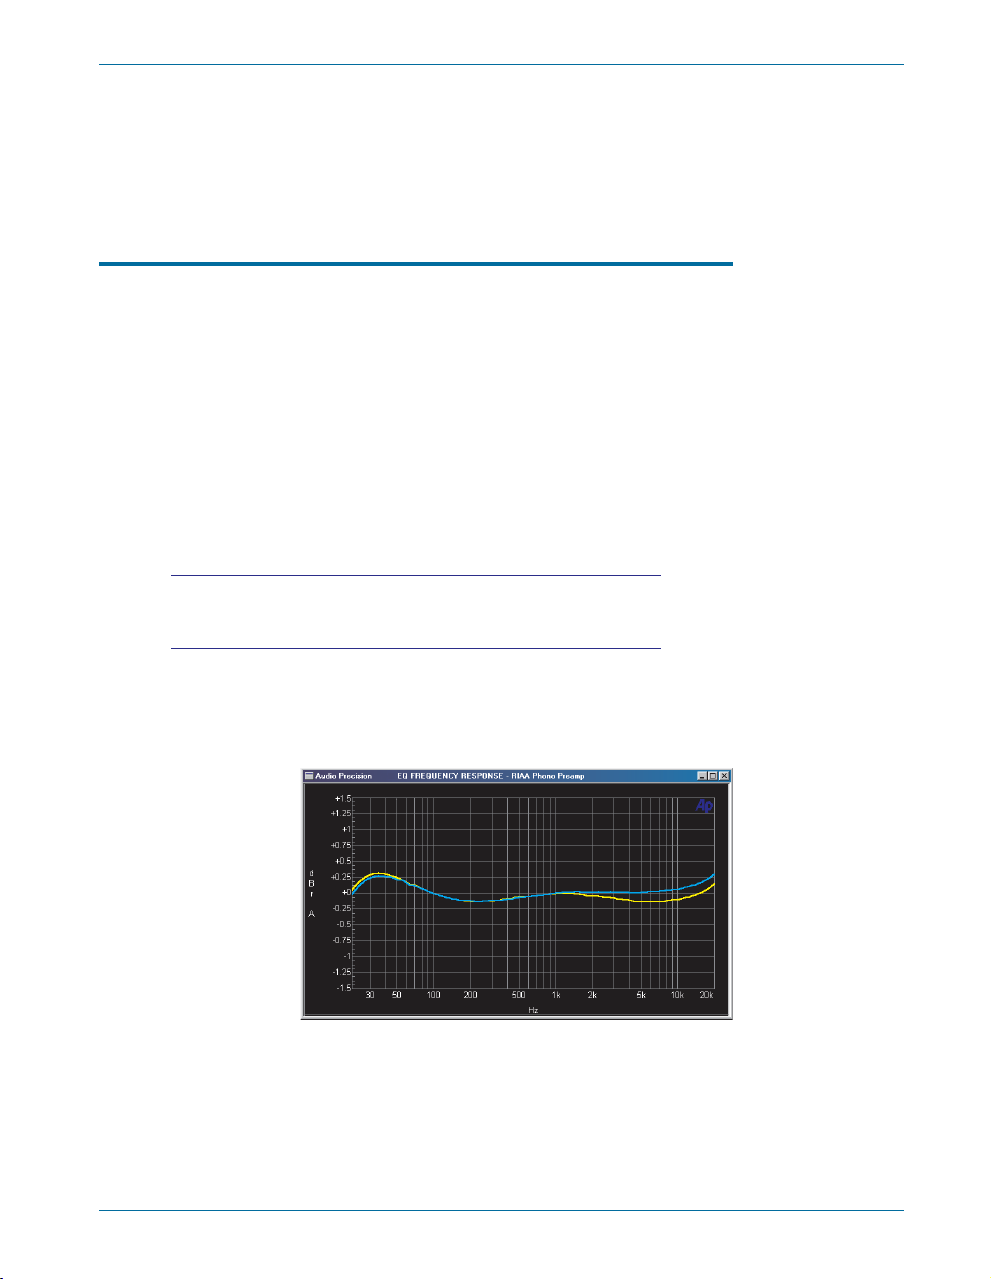
When a sweep is performed, a graph is also created. This is a graphical
representation of the data obtained during the sweep. Figure 14 shows an
example of a stereo frequency response graph.
Figure 14. A typical
frequency response graph.
This section is an introduction to sweeps. The Sweep panel contains
many more features that are described in Chapter 15 of the ATS-2 User’s
Manual.
Getting Started with ATS-2 33
Page 44
Chapter 5: Quick Guides Quick Guide to Sweeps
Sweep Fundamentals
Settings and Readings
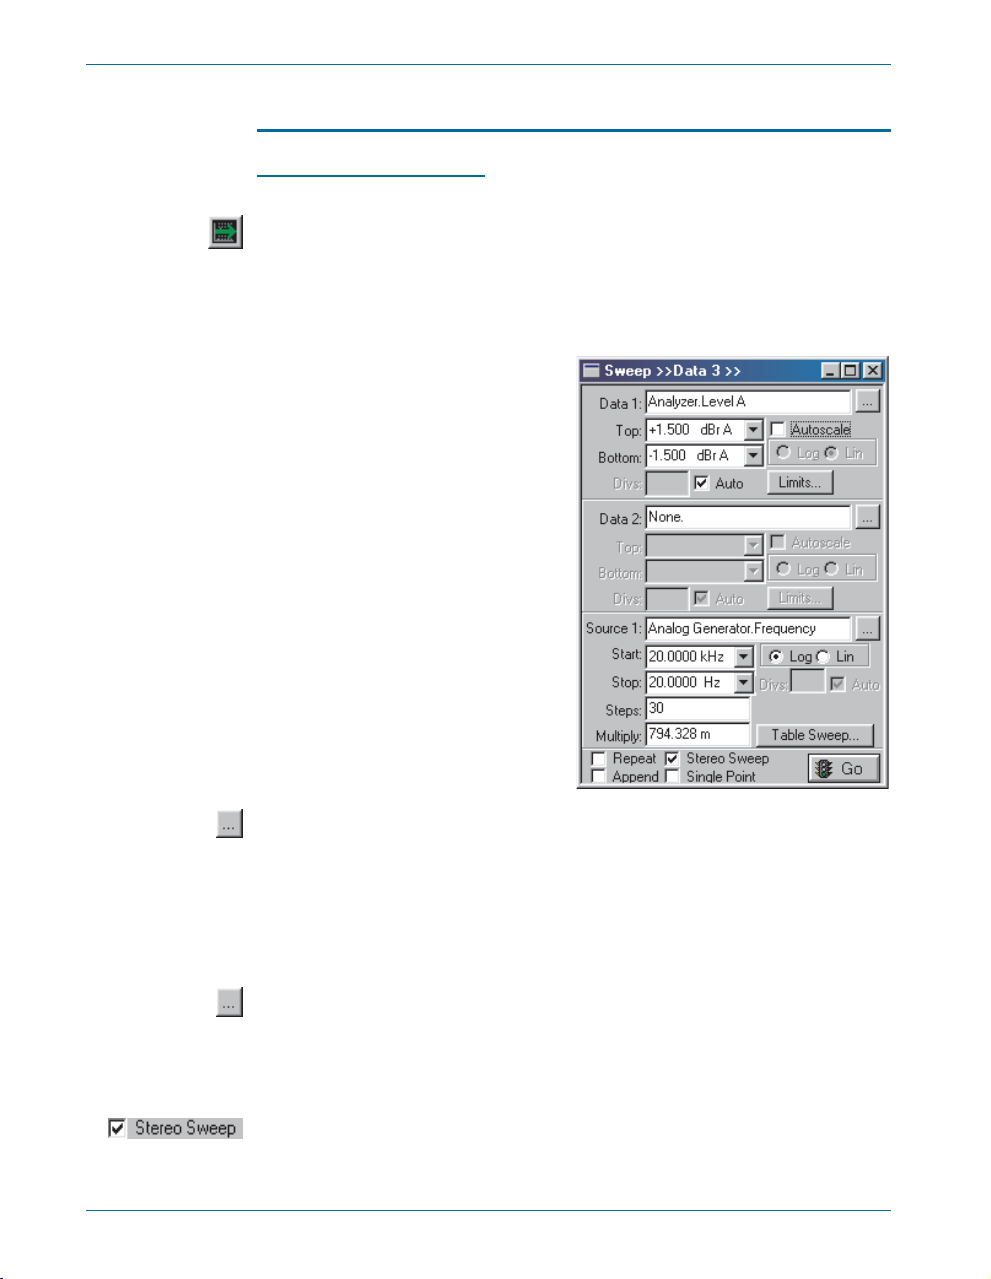
To set up a sweep, open the Sweep panel, either by choosing
Panels > Sweep, or by clicking on the Sweep button. The Sweep panel
is divided horizontally into two major areas: the Data (reading) area
above, and the Source (setting) area below. During the sweep, the setting
chosen in the Source 1 field is varied, and the readings specified in the
Data fields are gathered.
Figure 15. The Sweep panel. This
configuration was used to create the
graph of Figure 14.
To choose the setting to be varied, click on the ellipsis button to the
right of the Source 1 field. In the browser, choose an instrument from the
left pane and a setting from the right pane. For instance, if you choose
‘Analog Generator’ from the instrument side and ‘Frequency’ from the
setting side, the frequency of the analog generator will be varied during the
sweep. This is shown in the Source 1 field as ‘Analog
Generator.Frequency’.
To choose a reading to be gathered, click on the ellipsis button to the
right of the Data 1 field. The browser shows instruments in the left pane
and readings in the right pane. If you choose the ‘Analyzer’ instrument and
the ‘Level A’ reading, the level on channel A will be recorded during the
sweep. This is shown in the Data 1 field as ‘Analyzer.Level A’.
The Stereo Sweep checkbox near the bottom of the Sweep panel
automatically ensures that readings from both channels are gathered
34 Getting Started with ATS-2
Page 45
Quick Guide to Sweeps Chapter 5: Quick Guides
during the sweep. For instance, if you choose Analyzer.Level A as the
reading in Data 1 and then check the Stereo Sweep checkbox, the reading
Analyzer.Level B will also be gathered during the sweep.
Source Range, Steps, and Spacing
During the sweep, the setting in Source 1 is stepped from the Start
value to the Stop value shown in fields below Source 1. The number of
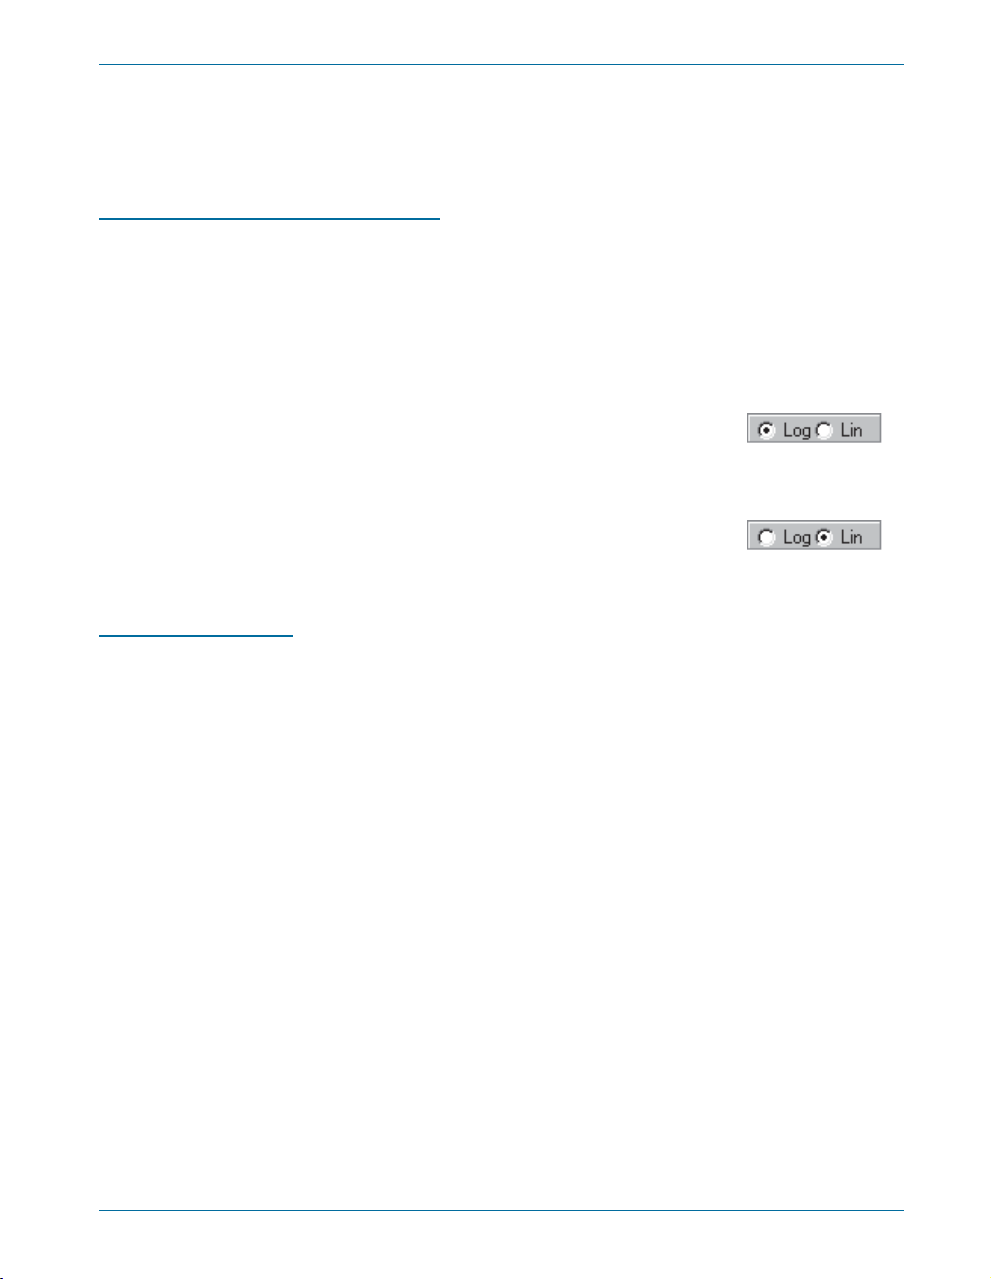
steps in the sweep is shown in the Steps field. A radio button to the right
of these fields controls whether successive settings are separated linearly
or logarithmically. In a linear sweep, the difference between successive
settings is constant. In a logarithmic sweep, the ratio between successive
settings is constant.
For example, if the start frequency is 20 Hz, the stop frequency is
20 kHz, there are 3 steps, and the spacing is logarithmic, ATS will first set
the generator to 20 Hz, then 200 Hz, then 2 kHz, and finally 20 kHz. That
is, the ratio between successive frequency settings is 10.
On the other hand, if the spacing is linear, the generator is first set to
20 Hz, then 6680 Hz, then 13340 Hz, and finally 20 kHz. That is, the
difference between successive frequency settings is 6660 Hz.
Data Display Range
A graph is automatically created when a sweep is run. The Start and
Stop values for Source 1 define the extent of the horizontal (x-) axis. The
extent of the vertical (y-) axis is determined by the values in the Top and
Bottom fields beneath Data 1.
The units of the y-axis are the same as the units in the Top and Bottom
fields. If you change the units of the Top or Bottom field, the units in the
other field will also change. See the Units section on page 32 for more
information on units.
Getting Started with ATS-2 35
Page 46
Chapter 5: Quick Guides Quick Guide to Sweeps
Review
To set up a sweep, you must:
set Source 1 to the setting to be varied during the sweep;
§
set Data 1 to the reading to be collected during the sweep;
§
click Stereo Sweep to collect data from both channels;
§
set the Start, Stop, Steps, and Lin/Log for Source 1; and
§
set the Top and Bottom values and units for Data 1.
§
Once the sweep is set up, you can run it by clicking the Go button at
the bottom of the Sweep panel.
We will now perform two example sweeps: a frequency response sweep,
and an amplitude linearity sweep.
Example Sweep: Frequency Response
For this example, we will measure the frequency response flatness of the
ATS-2 itself. We connect the analog output to the analog input, sweep the
frequency of the analog generator over the audio range, and plot the level
measured by the analyzer against frequency.
First, click the New Test button, turn the analog generator on, and set
both analog input channels to GenMon so that the generator signal is sent
directly to the analog input. Now open the Sweep panel. The default
sweep is a mono frequency response sweep, so we only have to make a
few modifications:
Check the Stereo Sweep box to create a stereo sweep.
§
Change the Steps from 30 to 100 for a more detailed response.
§
The default range for Data 1 is quite wide, and the units are Volts.
§
Change the units to dBV by clicking on the arrow next to the Top
field. From the list, choose the ‘dBV’ line. (Note that the units in the
Bottom field change also.) In the Top field, type ‘0.1’. In the Bottom
field, type ‘–0.1’.
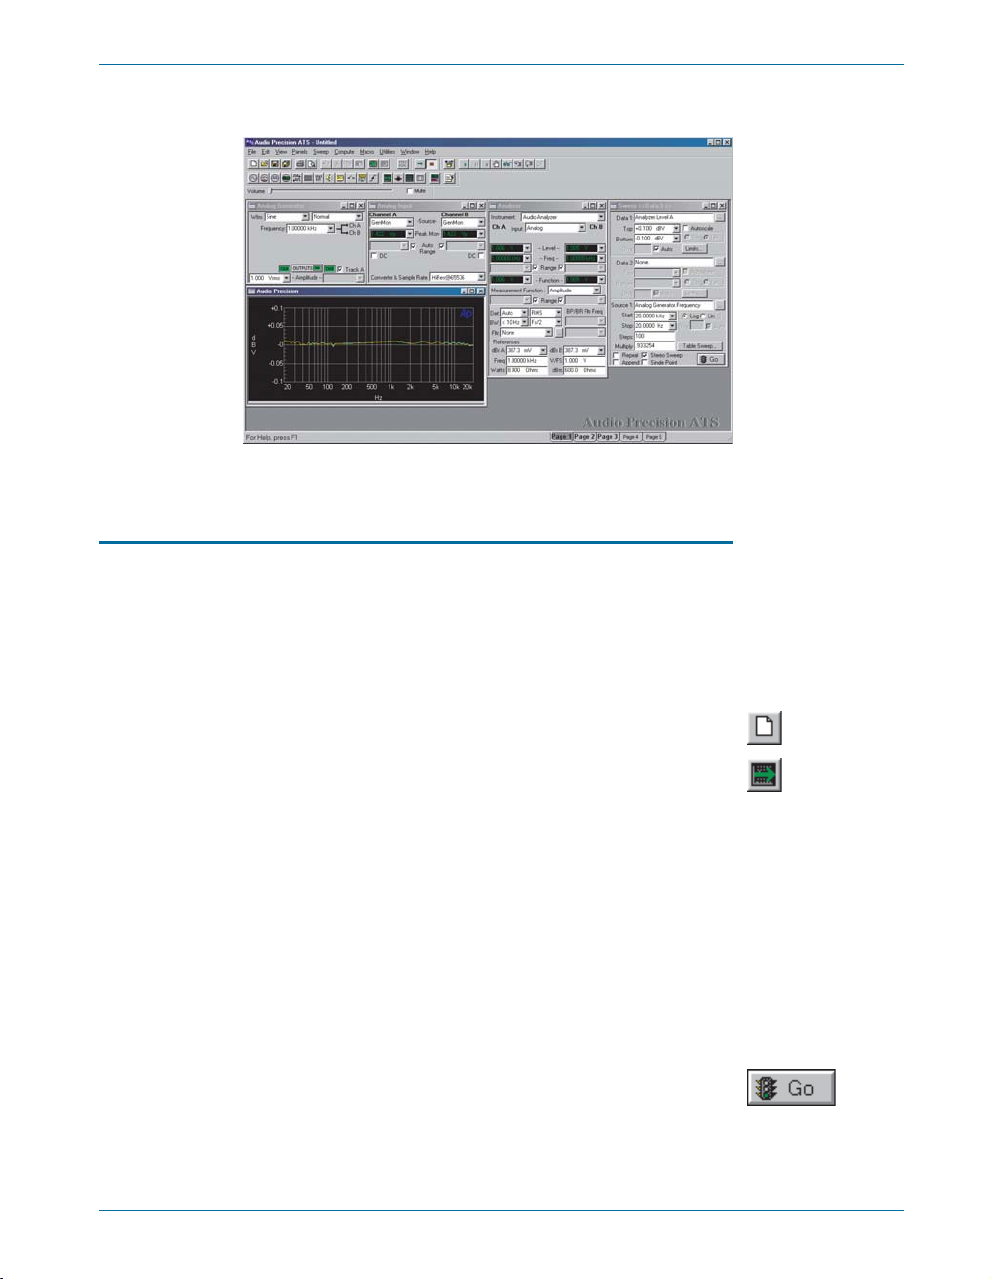
You can now click the Go button to run the sweep. A graph is created,
and the response is plotted as the sweep progresses. If you are monitoring
using the internal speaker, you will hear the analog generator frequency
step through the audio range. The result will be a response curve that
deviates only slightly from 0 dBV, as shown in Figure 16.
36 Getting Started with ATS-2
Page 47
Quick Guide to Sweeps Chapter 5: Quick Guides
Figure 16. Current
workspace after
frequency
response sweep,
showing typical
results.
Example Sweep: Amplitude Linearity
For this example, we will measure the amplitude linearity of the ATS-2.
With the analog output connected to the analog input, we sweep the
amplitude of the analog generator over its full range, and plot the ratio of
the level measured by the analyzer to the generator output level, in dB.
Any amplitude non-linearity in the system will show as a deviation from
0 dB.
First, perform a New Test, turn the analog generator on, and set both
analog input channels to GenMon so that the generator signal is sent
directly to the analog input. Now open the Sweep panel and make the
following changes:
Click the Source 1 browser button, and choose ‘Analog Generator’ as
§
the instrument and ‘ChA Amplitude’ as the setting.
Change the Start value for Source 1 to 100 µV. (ATS understands the
§
prefix ‘u’ to stand for ‘µ’.)
Choose the dBg A units for Data 1 by clicking on the arrow next to
§
the Top field, and choosing the ‘dBg A’ line from the list. The dBg A
units (decibels relative to generator channel A) show the ratio of the
reading to the level of the analog generator, in dB.
Set the Data 1 Top value to 0.1, and the Bottom value to –0.1.
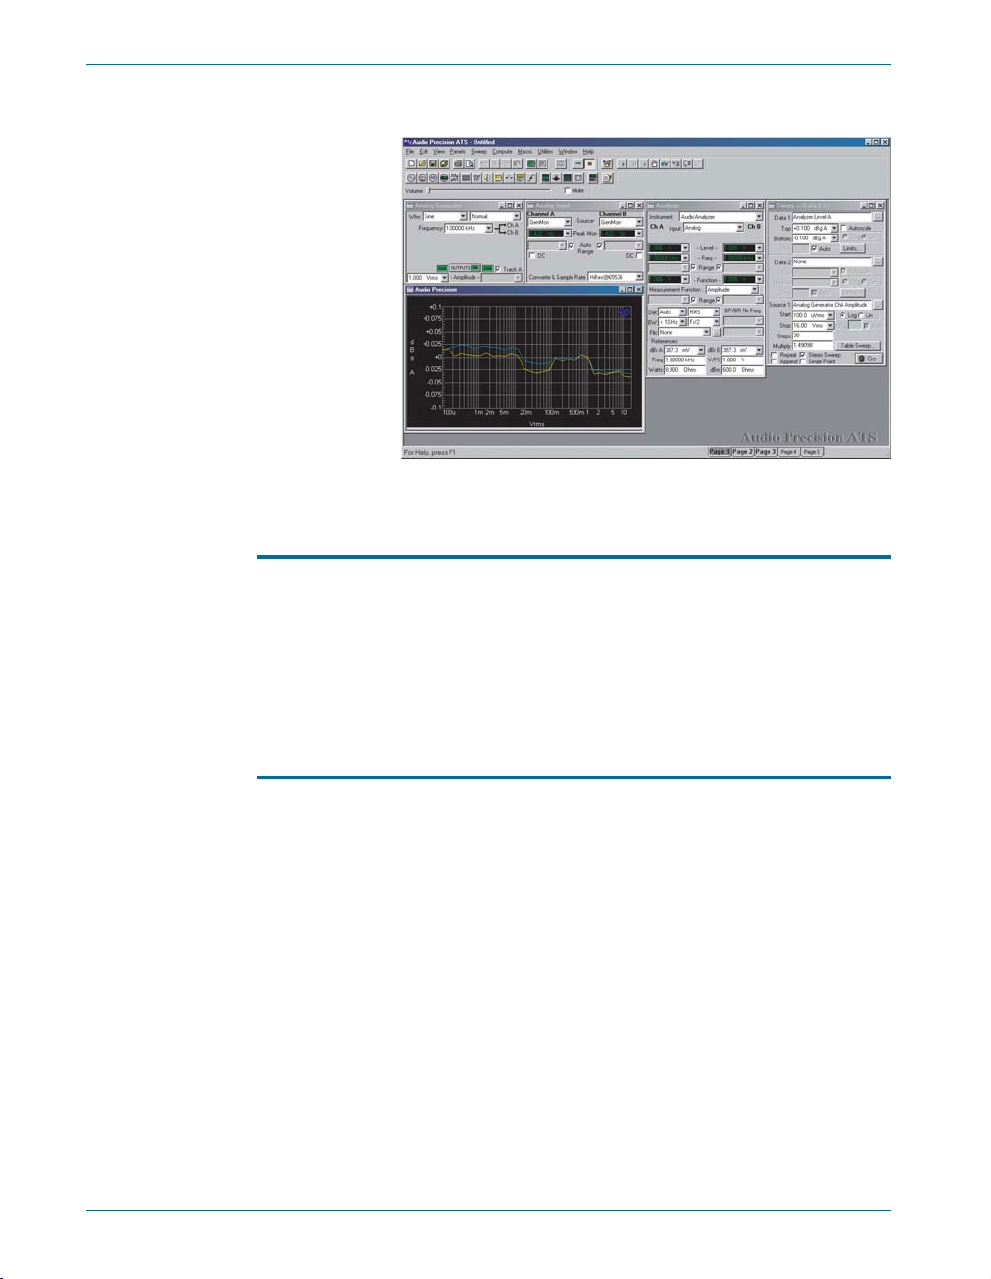
§
Click Go to start the sweep. The ranging relays will click as the
generator changes amplitude. The result will be a curve that deviates only
slightly from 0 dBg A, as shown in Figure 17.
Getting Started with ATS-2 37
Page 48
Chapter 5: Quick Guides Quick Guide to the FFT Spectrum Analyzer
Figure 17. Current
workspace after
amplitude linearity
sweep, showing
typical results.
Quick Guide to the FFT Spectrum Analyzer
At the top of the Analyzer panel is a drop-down list of the instruments
available in ATS. Up to this point, we have been using the audio analyzer
to make measurements. We will now take a look at the FFT spectrum
analyzer. This instrument displays audio signals in time (oscilloscope-style)
and in frequency (spectrum analyzer-style). It operates in a different
fashion from the audio analyzer, as explained next.
Real-Time vs. Batch-Mode Instruments
The audio analyzer is a real-time instrument. That is, it returns readings
continuously, whether or not a sweep is in progress. These readings
include level and frequency, as well as functions such as distortion or
phase. During a sweep, readings from the audio analyzer are diverted from
the panel meters to the sweep engine for graphing. After the sweep, the
readings are once again displayed in the panel meters.
By contrast, the FFT spectrum analyzer is a batch-mode instrument. It
does not generate readings if a sweep is not being performed. When a
sweep is started, the spectrum analyzer first acquires a segment of audio
by storing it in memory. This is indicated on the Status bar as ‘DSP
Acquiring Data’. Once the acquisition is complete, the spectrum analyzer
processes the data. This is indicated as ‘DSP Transforming Data’ on the
Status bar. Once processing is complete, ATS fetches a batch of readings
from the spectrum analyzer. At that point, the data is graphed.
38 Getting Started with ATS-2
Page 49

Quick Guide to the FFT Spectrum Analyzer Chapter 5: Quick Guides
The FFT Concept
The FFT (fast Fourier transform) is an efficient way to decompose a
periodic signal into its component frequencies. It transforms a time-domain
signal (such as you might see in an oscilloscope trace) into a
frequency-domain representation.
As an example, a high-quality power amplifier fed with a sinusoidal
input will produce harmonic distortion at its output that is invisible in an
oscilloscope trace. If an FFT is performed on the output signal, however,
the individual distortion harmonics can be seen. The pattern of harmonics
provides insight into the mechanisms responsible for the distortion.
The FFT process consists of the following steps:
Triggering. The system waits for a trigger event from the selected
§
source, for instance, a positive-going zero crossing of the analog
generator.
Acquisition. The system stores the input audio in memory until the
§
selected number of audio samples has been received. The more
audio data acquired, the more frequency points there will be in the
result, and hence the higher the resolution will be. However, longer
acquisitions take more time.
Windowing. Before transformation, the audio data is shaped in time
§
by multiplying it with a pre-defined envelope. This increases the
accuracy of the amplitude values returned from the FFT.
Transformation. The windowed audio data is transformed by the
§
FFT. This results in an array of points describing the magnitude and
phase of each frequency in the audio signal.
Display. ATS fetches the transformed audio data and graphs it.
§
Because the number of transformed points is typically larger than the
number of points in the graph, a peak-picking method is used to
ensure that peaks in the frequency data are not missed.
For more information, see Appendix C of the ATS-2 User’s Manual.
Setting up an FFT
After a New Test, ATS defaults to the audio analyzer. To switch to the
spectrum analyzer, click the down arrow next to the Instrument field at the
top of the Analyzer panel. From the list of instruments, choose FFT
Spectrum Analyzer. The panel changes to display the new instrument.
Getting Started with ATS-2 39
Page 50
Chapter 5: Quick Guides Quick Guide to the FFT Spectrum Analyzer
Panel Fields
There are two peak monitors near the top of the panel, one for each of
the stereo channels. These meters give an indication of the presence of
signal at the FFT input.
Below the peak meters is an array of fields for configuring the analyzer.
Here, we will use the default settings. For more details on the settings, see
Chapter 11 of the ATS-2 User’s Manual.
Time vs. Frequency
As mentioned, the FFT spectrum analyzer can display audio signals in
the time domain and the frequency domain. The choice of domain is
determined by the Source 1 field on the Sweep panel. If it is set to
FFT.Time, a time domain display results. If it is set to FFT.Frequency, a
frequency domain display results.
The Sweep Spectrum/Waveform button in the standard toolbar allows
FFT sweeps to be set up quickly. We will use this feature to examine
harmonic distortion in the ATS-2 system.
Quick Sweep Setup
First, perform a New Test, turn the analog generator on, and set both
analog input channels to GenMon so that the generator signal is sent
directly to the analog input. Choose FFT Spectrum Analyzer from the
Instrument field at the top of the Analyzer panel.
Bring up the Sweep panel and click the Sweep Spectrum/Waveform
button on the Standard toolbar. The sweep is automatically set up for a
stereo frequency domain display from 20 Hz to 20 kHz. Click Go to
perform the sweep. A graph similar to Figure 18 is created.
Figure 18. Typical default
FFT stereo frequency
domain graph.
40 Getting Started with ATS-2
Page 51
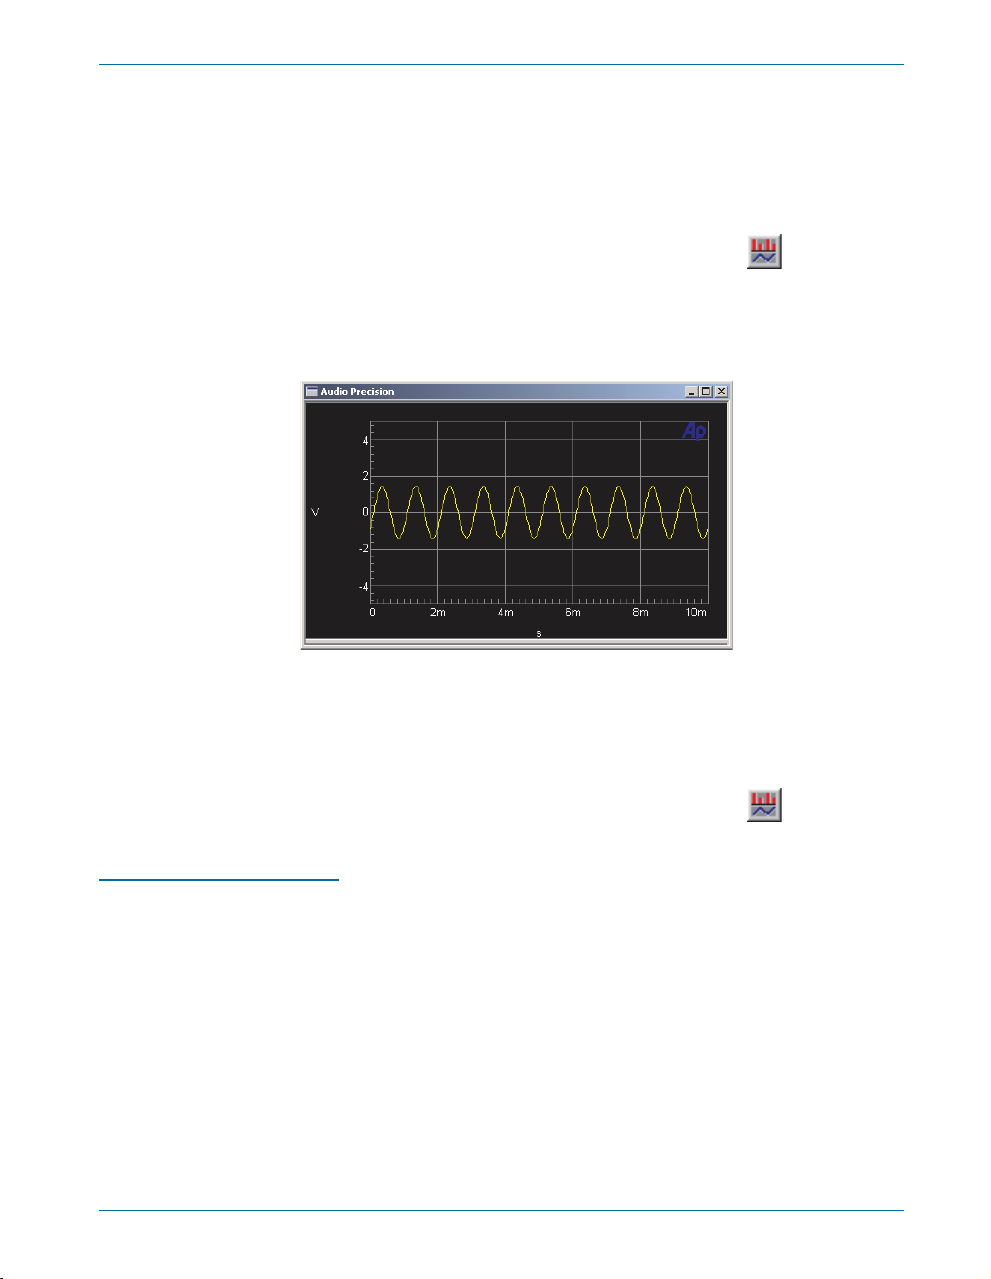
Quick Guide to the FFT Spectrum Analyzer Chapter 5: Quick Guides
The large peak in the middle of the spectrum is the 1 kHz, 1 V sine
wave fundamental produced by the analog generator. There are smaller
peaks spaced at 1 kHz intervals above the fundamental. These are
harmonic distortion components generated in the ATS-2 hardware. These
harmonics rise out of a wideband system noise floor.
To look at the audio signal in the time domain, click the Sweep
Spectrum/Waveform button again. Source 1 changes to FFT.Time and the
graph updates to show the new data. You should see a graph similar to
Figure 19.
Figure 19. Typical default
FFT stereo time domain
graph.
The display shows a sine wave with a period of 1 ms (corresponding to
a frequency of 1 kHz) and a peak excursion of 1.414 V (corresponding to
an amplitude of 1 Vrms). The effect of the distortion on the waveform is
not visible in the time domain.
You can switch between the time domain and frequency domain
displays at any time by clicking the Sweep Spectrum/Waveform button.
Fine-Tuning the Display
There are several ways to adjust the graph display to more closely
examine features of the acquired waveform:
Zoom. On the graph, draw a box by holding down the left mouse
§
button and moving the mouse. When you release the button, ATS
zooms the selected area to the full graph size.
Zoomout. After zooming, click the right mouse button on the graph.
§
From this right-click menu, choose Zoomout. The graph zooms out to
the pre-zoom size.
Optimize. From the right-click menu, choose Optimize Left Only. The
§
vertical axis changes to best fit the data in the graph.
Getting Started with ATS-2 41
Page 52
Chapter 5: Quick Guides Saving and Loading Tests
For more details, see Chapter 16 of the ATS-2 User’s Manual.
Saving and Loading Tests
At any time, the current workspace setup can be saved to a file. The file
contains the settings on all the panels (including panels that are not visible
in the workspace), the panel positions, and references to any other files
that were attached, such as limit data. The file also contains the most
recent data obtained from any sweeps that were run.
When a test is loaded, the workspace reverts to the exact configuration
it had when the test was saved. The data from the test is available and can
be further processed. It can also be re-graphed automatically when the test
is loaded. See Chapter 25 of the ATS-2 User’s Manual for more details.
To save the current workspace, choose File > Save > Test, or click
the Save Test button in the Standard toolbar. To load a lest, choose
File > Open > Test, or click the Open Test button in the Standard
toolbar.
The Next Step
In this chapter, we have introduced two instruments: the audio analyzer,
and the FFT spectrum analyzer. ATS has other instruments to measure
audio signals in different ways. The ATS-2 User’s Manual describes all the
instruments in detail.
We have also introduced the sweep, which is at the heart of ATS
automated measurements. The sweep engine and its features are
described in more detail in Chapter 15 of the ATS-2 User’s Manual.
We set up tests by hand using the mouse and keyboard, and saved
them to disk. ATS also contains a complete programming language to
allow you to execute complex measurement sequences programmatically.
Chapter 23 of the ATS-2 User’s Manual describes how to program the
instrument, and the AP Basic User’s Guide and Language Reference
describes the language itself.
42 Getting Started with ATS-2
Page 53

Chapter 6
Specifications
Unless otherwise noted, all analyzer specifications assume dc coupling, rms
detection, autoranging on, and high resolution conversion at 65.536 kS/s. The
abbreviation “SR” refers to the relevant output or input sample rate
(1 kS/s = 1 kHz).
Analog Signal Generator
Waveforms
Sine Family (Normal, Var Phase, Stereo, Dual,
Shaped Burst, EQ)
IMD (SMPTE/DIN 4:1, 1:1)
Square
Noise
Arbitrary Waveform (Multitone)
Special (Polarity, Pass Thru)
Sine Family Characteristics
Frequency Range 2 Hz–61.6 kHz (SR=131.072 kS/s)
Frequency Resolution 0.015625 Hz
Flatness (500 Hz ref)
20 Hz to 20 kHz ±0.01 dB
10 Hz to 50 kHz +0.06/–0.1 dB
THD+N2(20 Hz–20 kHz) £0.0009% [–101 dB] +1.6 µV
Variable Phase Range –180.00 to +179.99 deg
Dual Sine Ratio Range 0 dB to >100 dB
1
Shaped Burst
Envelope Raised cosine
Burst Interval 2 to 65536 cycles (max number of cycles may be
Burst On Time
1
Significant alias products may appear for frequency settings above 53.5 kHz.
2
System specification including contributions from both generator and analyzer, 20 kHz
measurement bandwidth.
Getting Started with ATS-2 43
limited at low frequencies)
1 to number of interval cycles minus 1
NP0020.0002.002
Page 54

Chapter 6: Specifications
Other Waveforms
Arbitrary Waveform (Multitone)
Sample Rates (SR) 65.536 kS/s, 131.072 kS/s, OSR (programmed
Length 256 to 16384 points per channel
Frequency Range DC to 0.47´SR
Frequency Resolution Sample Rate / Length
Maximum Number of Tones (Length / 2) minus 1 [8191 with Length=16384]
IMD Test Signal (SMPTE/DIN)
LF Tone Range 40 Hz to 500 Hz
HF Tone Range 2 kHz to 60 kHz
Mix Ratio 4:1 or 1:1 (LF:HF)
Residual IMD
Square wave
Frequency Range 10 Hz to 20 kHz
Risetime Typically 2.0 µs
Noise Signal
White Pseudo-Random, Rectangular PDF, 60 kHz BW
output rate), or ISR (selected input sample rate)
3
£0.0025% [–92 dB]
Polarity Test Signal
(Sum of two sinewaves phased for reinforcement with normal polarity.)
Frequency Range 2Hzto30kHz
Pass Thru
(Passes the embedded audio signal from the rear panel Sync/Ref Input. Output
Sample Rate (OSR) must be within the range of 0.334 to 3.000 of the Sync/Ref
Input sample rate.)
Frequency Accuracy ±0.0002% [2 PPM] internal reference, lockable to
external reference
Analog Signal Generator Outputs
Analog Output Characteristics
Source Configurations Balanced (XLR), Unbalanced (XLR and BNC), or
3
System specification with 60 Hz/7 kHz or 250 Hz/8 kHz test signal combinations and
Vin ³ 200 mV.
44 Getting Started with ATS-2
Common Mode Test (XLR)
Page 55

Source Impedances (Rs)
Balanced or CMTST Nominally 40 W or 150 W, standard configuration
Unbalanced Nominally 20 W or 50 W
Amplitude Range
(all Waveforms) Each analog output is independently settable
Balanced <250 µVrms to 16.00 Vrms [700 µVpp to
Unbalanced or Common
Mode Test <250 µVrms to 8.00 Vrms [700 µVpp to 22.6 Vpp]
Amplitude Accuracy ±0.09 dB [±1.0 %]
Amplitude Resolution 0.007 dB or 0.60 µVrms, whichever is larger
Max Output Power into 600 W
Balanced +24.1 dBm (Rs = 40 W)
Unbalanced +18.4 dBm (Rs = 20 W)
Output Current Limit Typically >50 mA
DC Offset £0.25% of Vpp setting [0.7% of Vrms setting]
Output Related Crosstalk £(–100 dB + 3 µV), 20 Hz to 20 kHz
Nominally 40 W or 200 W, EURZ option
Nominally 40 W or 600 W, 600Z option
45.2 Vpp] [–70.0 dBu to +26.30 dBu]
[–70.0 dBu to +20.28 dBu]
Digital Signal Generator
Waveforms
Sine Family (Normal, Var Phase, Stereo, Dual, Shaped Burst,
Common Sine Family Characteristics
Frequency Range 2 Hz to <0.50´SR
Frequency Resolution SR / 2
Flatness ±0.001 dB
Harmonics and
Spurious Products 0.000001% [-160 dB]
Variable Phase Range –180.00 to +179.99 deg
Dual Sine Ratio Range 0 dB to >100 dB
Sine + Offset Amplitude Range Sinewave amplitude + |offset amplitude|<1FFS
EQ, Burst, Offset)
IMD (SMPTE/DIN 4:1, 1:1)
Square
Noise
Arbitrary Waveform (Multitone)
Special (Polarity, Pass Thru, Monotonicity, J-Test,
Walking Ones, Walking Zeros, Constant Value,
Random)
23
Chapter 6: Specifications
Burst and Shaped Burst
Envelope Burst signal envelope is rectangular, Shaped
Burst Interval 2 to 65536 cycles (max number of cycles may be
Burst On Time
Getting Started with ATS-2 45
Burst envelope is raised cosine.
limited at low frequencies)
1 to number of interval cycles minus 1
Page 56

Chapter 6: Specifications
Squarewave
Frequency Range 2 Hz to SR / 6, in even integer sub-multiples of
SMPTE/DIN Test Signal
Lower Tone Range 40 Hz to 500 Hz
Upper Tone Range 2 kHz to 0.47´SR
Mix Ratio 1:1 or 4:1 (LF:HF)
Noise Signal
White Pseudo-Random White, Rectangular PDF,
Special Signals
Polarity Sum of two sinewaves phased for reinforcement
Pass Thru Passes the embedded audio signal from the rear
Monotonicity Staircase waveform of lowest 10 levels for D/A
J-Test Produces a maximum amount of data-induced
Walking Ones A single binary one value “walked” from LSB to
Walking Zeros A single binary zero value “walked” from LSB to
Constant Value
Random Random binary states of all bits
SR
Bandwidth = 0.50´SR
with normal polarity
panel Sync/Ref Input. Output Sample Rate (OSR)
must be within the range of 0.334 to 3.000 of the
Sync/Ref Input sample rate.
linearity testing
jitter on low-bandwidth transmission links
MSB
MSB
(Digital DC) 32-bit resolution when using triangular dither
Arbitrary Waveform (Multitone)
Sample Rates (SR) 65.536 kS/s, 131.072 kS/s, OSR (programmed
Length 256 to 16384 points per channel
Frequency Range DC to 0.47´SR
Frequency Resolution Sample Rate / Length
Maximum Number of Tones (Length / 2) minus 1 [8191 with Length = 16384]
output rate), or ISR (selected input sample rate)
Dither
Applies to all waveform except Monotonicity, J-Test, Walking Ones, Walking
Zeros, Random
Types None, Triangular, Rectangular, or Shaped
Amplitude 8to24bit
46 Getting Started with ATS-2
Page 57

Pre-Emphasis Filters
(Applies to all waveforms)
Filter Shapes 50/15 µs or J17
Response Accuracy ±0.02 dB, 10 Hz to 0.45´SR
Residual Distortion 0.00003% [–130 dB]
Digital Signal Generator Outputs
Formats
Balanced (XLR) AES3 per AES3-1997
Unbalanced (BNC) SPDIF-EIAJ per IEC 60958
Optical (Toslink®) per IEC 60958-3
Digital Output Characteristics
Sample Rate Range 28.8 kHz to 108 kHz per connector
Sample Rate Accuracy ±0.0002% [2 PPM] internal reference, lockable to
external reference
Word Width 8 to 24 bits
Output Impedance
Balanced (XLR) Nominally 110 W
Unbalanced (BNC) Nominally 75 W
Output Amplitude, balanced
into 110 W
Range 0 to 5.10 Vpp
Resolution 20 mV
Accuracy ±(10% + 60 mV)
Output Amplitude, unbalanced
into 75 W
Range 0 to 1.275 Vpp
Resolution 5 mV
Accuracy ±(8% + 15 mV)
Output Amplitude,
Optical (Toslink®) Nominal intensity, not variable
Channel Status Bits Full implementation per IEC 60958, English
language decoded, common to both channels
Formats Professional or consumer; or Direct Hex source
User Bits Set to 0
Validity Flag Selectable–set or cleared, common to both
channels
Chapter 6: Specifications
Jitter Generator
Waveform Sine
Frequency Range 20 Hz to 200 kHz, <0.1 Hz resolution
Amplitude Range 0.05 to 0.1275 UI in 0.0005 UI steps
Accuracy (500 Hz) ±(10%+2ns)
Getting Started with ATS-2 47
0.130 to 1.275 UI in 0.005 UI steps
1.30 to 12.75 UI in 0.05 UI steps
Page 58

Chapter 6: Specifications
Flatness
Residual Jitter
4
5
±1 dB, 100 Hz to 20 kHz
£2 ns [0.012 UI at 48 kS/s, 0.024 UI at 96 kS/s]
Spurious Jitter Products typically <0.003 UI [–50 dBUI] or 30 dB below
jitter signal, whichever is larger
Audio Analyzer
Level and Amplitude Measurement
(Independent level and amplitude meters per channel)
Measurement Range
Analog <1 µV rms to 140 V rms [–118 dBu to +45.1 dBu]
Digital –120 dBFS to 0 dBFS (usable to –140 dBFS)
Accuracy (1 kHz)
Analog ±0.09 dB [±1.0%]
Digital ±0.002 dB [±0.023%]
Flatness
Detection RMS, FAST RMS, or QPK per IEC 468 (CCIR)
Frequency Measurement
(Two independent meters, one per channel)
Range
Accuracy ±0.0002% [2 PPM]
Resolution 0.00001% of SR [0.007 Hz at 65.536 kS/s]
Minimum Input
6
Analog ±0.01 dB, 20 Hz to 20 kHz (0.45´SR if less);
±0.10 dB, 10 Hz to 120 kHz (with performance
option)
Digital ±0.002 dB, 10 Hz to 0.45´SR
Analog <10 Hz to 30 kHz (SR = 65.536 kS/s),
<10 Hz to 120 kHz (with performance option)
Digital <10 Hz to 0.47´SR
Analog 1 mV (S/N >40 dB)
Digital
–100 dBFS (S/N >40 dB)
Phase Measurement
Measurement Ranges ±180, –90 to +270, or 0 to +360 deg
4
System specification including contributions from both analyzer and generator. Valid at
32.0, 44.1, 48.0, 65.536, 88.2, and 96.0 kS/s only. Flatness may degrade at other
sample rates.
5
System specification valid only if (1) the jitter generator amplitude is turned off; (2) the
digital input is ³ 1.0 Vpp (XLR) or ³ 250 mVpp (BNC); and (3) the analyzer is set for
700 Hz–100 kHz bandwidth.
6
1 kHz ref. Flatness derates above 5 kHz by an additional ±0.02 dB in the 22.4 V, 45 V,
90 V, and 200 V input ranges.
48 Getting Started with ATS-2
Page 59

Chapter 6: Specifications
Accuracy
Analog
7
±2 deg, 10 Hz to 5 kHz
±3 deg, 5 kHz to 20 kHz
±4 deg, 20 kHz to 50 kHz (with performance
option)
Digital ±2 deg, 10 Hz to 0.45´SR
Resolution 0.01 deg
Minimum Input (both channels)
Analog 1 mV (S/N >40 dB)
Digital
–60 dBFS (S/N >40 dB)
Residual Noise
(Amplitude Function only)
Analog
A-weighted £1.2 µV rms
Dolby 2K £2.0 µV rms
IEC 468 (CCIR) £6.0 µV Qpk
20 kHz LP £1.6 µV rms
Digital
A-weighted £–142 dBFS
Dolby 2K £–134 dBFS
IEC 468 (CCIR) £–127 dBFS
20 kHz LP
£–140 dBFS
THD+N Function
Fundamental Range 10 Hz to 0.47´SR
Measurement Range 0 to 100%
Accuracy ±0.3 dB, 10 Hz to 0.45´SR (no filters selected)
Residual THD+N
Analog £0.0009% [–101 dB] + 1.6 µV (with 20 kHz LP)
Digital –138 dBFS
Minimum Input for Counter Tuning
Analog 1 mV (S/N > 40 dB)
Digital –65 dBFS (S/N > 40 dB)
Notch Tuning Modes Counter Tuned, Sweep Track, Agen Track, Dgen
Track, or Fixed (set by direct entry)
Amplitude & THD+N Filters
(One filter from each of the following 3 groups may be enabled for 3 filters total)
Low Pass Group Fs/2 (no BW limiting)
7
Both analyzer input channels must have same coupling (ac or dc) selection. Analog
accuracy is valid for any input signal amplitude ratio up to ±30 dB.
Getting Started with ATS-2 49
20 kHz (6-pole elliptic, 0.1 dB ripple, 110 dB
stopband)
15 kHz (6-pole elliptic, 0.1 dB ripple, 110 dB
stopband)
User defined (6-pole max)
Page 60

Chapter 6: Specifications
High Pass Group <10 Hz (4-pole)
Weighting Filter Group None
22 Hz (4-pole Butterworth)
100 Hz (4-pole Butterworth)
400 Hz (4-pole Butterworth, or 10-pole elliptic if
no other filters are enabled)
User defined (4-pole max)
ANSI-IEC “A” weighting, per IEC 179
IEC 468 (CCIR) Qpk
Dolby 2K (CCIR-ARM)
C-message per IEEE 743-1978
CCITT per Rec O.41
“F” weighting per 15 phon loudness contour
HI-2 Harmonic weighting
User defined (8-pole max)
Bandpass & Crosstalk Functions
Tuning Range 20 Hz to 0.47´SR
Bandpass Response 10-pole, Q=19
Accuracy (at center frequency)
Analog ±0.2 dB
Digital ±0.1 dB
Residual Noise
Analog
10 Hz to 5 kHz £0.5 µV [–124 dBu]
5 kHz to 20 kHz £1.0 µV [–118 dBu]
20 kHz to 50 kHz £2.0 µV [–112 dBu]
Digital
£-150 dBFS
SMPTE (DIN) IMD Function
Test Signal Compatibility Any combination of 40 Hz to 250 Hz (LF) and
IMD Measured Amplitude modulation products of the HF tone.
Measurement Range 0 to 20%
Accuracy ±0.5 dB
Residual IMD
Analog £0.0025% [–92 dB]
Digital
8
2 kHz to 0.45´SR (HF), mixed in any ratio from
1:1 to 5:1 (LF:HF)
Measurement bandwidth is typically 20 Hz to
750 Hz
£0.00003% [–130 dB] at 0 dBFS
£0.0003% [–110 dB] at –25 dBFS
FFT Analyzer
Acquisition Length 800 to 256 k samples in 11 steps
Transform Length 256 to 32768 samples in binary steps
8
System specification with 60 Hz/7 kHz or 250 Hz/8 kHz test signal combinations and
Vin ³ 200 mV.
50 Getting Started with ATS-2
Page 61

Chapter 6: Specifications
Windows None
None-move-to-bin-center
Hann
Hamming
Blackman-Harris (4 term, –92 dB sidelobes)
Equiripple (AP design with –160 dB sidelobes)
Flat-top
Gaussian
Rife-Vincent 4-term
Rife-Vincent 5-term
Amplitude Accuracy (Flat-top window)
Analog ±0.10 dB [±1.2%]
Digital ±0.001 dB [±0.012%]
Phase Accuracy
Analog
9
±0.5 deg, 10 Hz to 5 kHz
±1 deg, 5 kHz to 20 kHz
±2 deg, 20 kHz to 50 kHz (with performance
option)
Digital ±0.05 deg, 10 Hz to 0.45´SR
Averaging
Number of averages 1 to 4096 in binary steps
Algorithm Power-based (frequency domain)
Synchronous (time domain)
Display Modes
Time Domain Normal, Interpolate, Peak, Absolute Value
Frequency Domain
Displays highest FFT bin between graph points
None-Move-to-Bin-Center Window
Frequency Range ±4% of input frequency, 7th FFT bin (low limit) to
0.45´SR (high limit)
Spurious Products £120 dB
Residual Distortion
Analog £–105 dB, SR=65 kS/s
£–90 dB, SR=262 kS/s (with performance option)
Digital £–180 dB
Analog Alias Rejection
Standard (High
Resolution) A/D typically >115 dB for signals >0.554´SR
Performance
option A/D
typically >85 dB for signals >0.540´SR
Multitone Audio Analyzer
Acquisition Length 512 to 32768 samples in binary steps
Transform Length 512 to 32768 samples in binary steps
Measurements Amplitude vs Frequency, Total Distortion vs
Frequency Resolution SR / Length [2.0 Hz with SR = 65.536 kS/s and
9
Both analyzer input channels must have same coupling (ac or dc) selection. Analog
accuracy is valid for any input signal amplitude ratio up to ±30 dB.
Getting Started with ATS-2 51
Frequency, Noise vs Frequency, Phase vs
Frequency, Crosstalk vs Frequency, and Masking
Curve
Length = 32768]
Page 62

Chapter 6: Specifications
Frequency Correction
Residual Distortion
Input Ranges 355 mVp to 200 Vp [250 mVrms to 140 Vrms] in
Maximum Rated Input 200 Vp, 140 Vrms (dc to 20 kHz); overload
Input Impedance
CMRR
Input Related Crosstalk £(–100 dB + 3 µV) at 20 kHz
Frequency Range ±4% of input frequency, 7th FFT bin (low limit) to
Spurious Products <–120 dB
Analog £–105 dB, SR=65 kS/s
Digital
0.45´SR (high limit)
£–90 dB, SR=262 kS/s (with performance option)
–140 dBFS
Analog Input Characteristics
binary (6.02 dB) steps
protected in all ranges
Balanced Nominal 200 kW // 95 pF
Option 600Z adds Nominal 600 W
Unbalanced Nominal 100 kW // 185 pF
Option 600Z adds Nominal 600 W
10
355 mVp to 5.6 Vp
ranges ³80 dB, 10 Hz to 20 kHz
11.2 Vp to 200 Vp
ranges ³50 dB, 10 Hz to 1 kHz
Digital Input Characteristics
Formats
Balanced (XLR) AES3 per AES3-1997
Unbalanced (BNC) SPDIF-EIAJ per IEC 60958
Optical (Toslink®) per IEC 60958-3
Sample Rates 28.8 kHz to 108 kHz per connector
Word Width 8 to 24 bits
Input impedance
Balanced (XLR) Nominally 110 W or >2.5 kW
Unbalanced (BNC)
Nominally 75 W or >3 kW
Digital Interface Measurements
Input Sample Rate
Internal Reference ±0.0003% [±3 PPM]
External Reference ±0.0001% [±1 PPM]
Input Voltage
Balanced (XLR) 200 mV to 5.10 Vpp, ±(10% + 50 mV)
Unbalanced (BNC)
10
CMRR performance below 50 Hz degrades substantially with AC coupling.
52 Getting Started with ATS-2
100 mV to 1.275 Vpp, ±(10% + 12 mV)
Page 63

Chapter 6: Specifications
Jitter Amplitude (peak calibrated)
50 kHz–100 kHz BW 0 to 3.00 UI, ±(10%+2ns)
other BW selections 0 to 1.00 UI, ±(10%+2ns)
Jitter Flatness
Residual Jitter
11
12
±1 dB, 100 Hz to 20 kHz
£2 ns [0.012 UI at 48 kS/s, 0.024 UI at 96 kS/s]
Jitter Spectrum Spurious products are typically <0.003 UI
[–50 dBUI] or 30 dB below jitter signal, whichever
is larger
Channel Status Bits Full implementation per IEC 60958, English
language decoded, common to both channels
Formats Professional or consumer, or Direct Hex source
User Bits Not displayed
Validity Flag Displayed for each channel
Parity Displayed for total signal (both channels
combined)
Signal Confidence Displayed for total signal (both channels
combined)
Receiver Lock Displayed for total signal (both channels
combined)
Coding Error Displayed for total signal (both channels
combined)
Sync/Reference Input Characteristics
Signal Compatibility
AES3 AES3id 1995, SPDIF (IEC 60958); 28.8–100 kHz
Video NTSC, PAL, or SECAM
Squarewave 8.0 kHz to 10.0 MHz
Minimum Input Amplitude 200 mVpp
Input Impedance Nominally 75 W or >5 kW
Lock Range ±0.0015% [±15 PPM]
Auxiliary Signals
Monitor Outputs
Signals Replicas of both analyzer inputs plus two
Typical Amplitude 0 to 4 Vpp (Rs= 422 W)
11
System specification including contributions from both analyzer and generator. Valid at
32.0, 44.1, 48.0, 65.536, 88.2, and 96.0 kS/s only. Flatness may degrade at other
sample rates.
12
System specification valid only if (1) the jitter generator amplitude is turned off; (2) the
digital input is ³ 1.0 Vpp (XLR) or ³ 250 mVpp (BNC); and (3) the analyzer is set for
700 Hz–100 kHz bandwidth.
Getting Started with ATS-2 53
additional signals depending on the
measurement mode. Not guaranteed to operate
with sample rates above 108 kS/s.
Page 64

Chapter 6: Specifications
Auxiliary Control I/O
Inputs (8 bits) 5 V TTL-compatible CMOS
Outputs (8 bits) 5 V TTL-compatible CMOS
Trigger Input
Absolute Maximum Range –0.5 V to 30 V
Minimum High Voltage 1.25 V
Maximum Low Voltage 0.5 V
Input Impedance >50 kW
Trigger Output
Voltage Range 0–5 V nominal
Output Impedance 150 W nominal
Source Analog Generator
Absolute maximum range –0.5 V to 5.5 V
Float State 20 kW pull-up to +5 V
Voltage Range
Contact resistance
(for short control)
0to5V
5kW maximum
Digital Generator
Jitter Generator
External Trigger Input
Line (Mains)
Channel A Receive Sub-Frame
Channel B Receive Sub-Frame
Channel A Receive Sub-Frame De-jittered
Channel B Receive Sub-Frame De-jittered
Receive Block
Receive Error
Channel A Transmit Sub-Frame
Channel B Transmit Sub-Frame
Channel A Transmit Sub-Frame De-jittered
Channel B Transmit Sub-Frame De-jittered
Transmit Block
Channel A Sync/Ref Receive Sub-Frame
Channel B Sync/Ref Receive Sub-Frame
Sync/Ref Receive Block
Sync/Ref Receive Error
General/Environmental
Power Requirements 100/120/230/240 Vac (–10% +6%), 50–60 Hz,
Temperature Range
Operating +5°C to +45°C
Storage –40°C to +75°C
Humidity 90% RH to +40°C (non-condensing)
54 Getting Started with ATS-2
75 VA max
Page 65

Max Operating Altitude 3000 m
13
EMC
Complies with 89/336/EEC, CISPR 22 (class B),
and FCC 15 subpart J (class B)
Dimensions
Width 16.8 inches [42.7 cm]
Height 3.0 inches [7.6 cm]
Depth 14.2 inches [36.1 cm]
Weight Approximately 16.2 lbs [7.4 kg] unpacked, all
hardware options installed.
Safety Complies with:
73/23/EEC, 93/68/EEC, and EN61010-1 (1990)
+ Amendment 1 (1992) + Amendment 2 (1995).
Installation Category II, Pollution Degree 2
CAN/CSA-C22.2 No 1010.1-92, Safety
Requirements for Electrical Equipment for
Measurement, Control, and Laboratory Use,
Part 1: General Requirements (Includes
Amendment 1)
CAN/CSA-C22.2 No 1010.1B-97, Amendment 2
to CAN/CSA-C22.2 No 1010.1-92, “Safety
Requirements for Electrical Equipment for
Measurement, Control, and Laboratory Use,
Part 1: General Requirements”
UL Std No 3111-1, Equipment for Measurement
Use; Part I: General Requirements
Chapter 6: Specifications
13
Emission and immunity levels are influenced by the shielding performance of the
connecting cables. EMC compliance was demonstrated using Audio Precision part
numbers CAB-XMF and CAB-AES2.
Getting Started with ATS-2 55
Page 66

Chapter 6: Specifications
56 Getting Started with ATS-2
Page 67
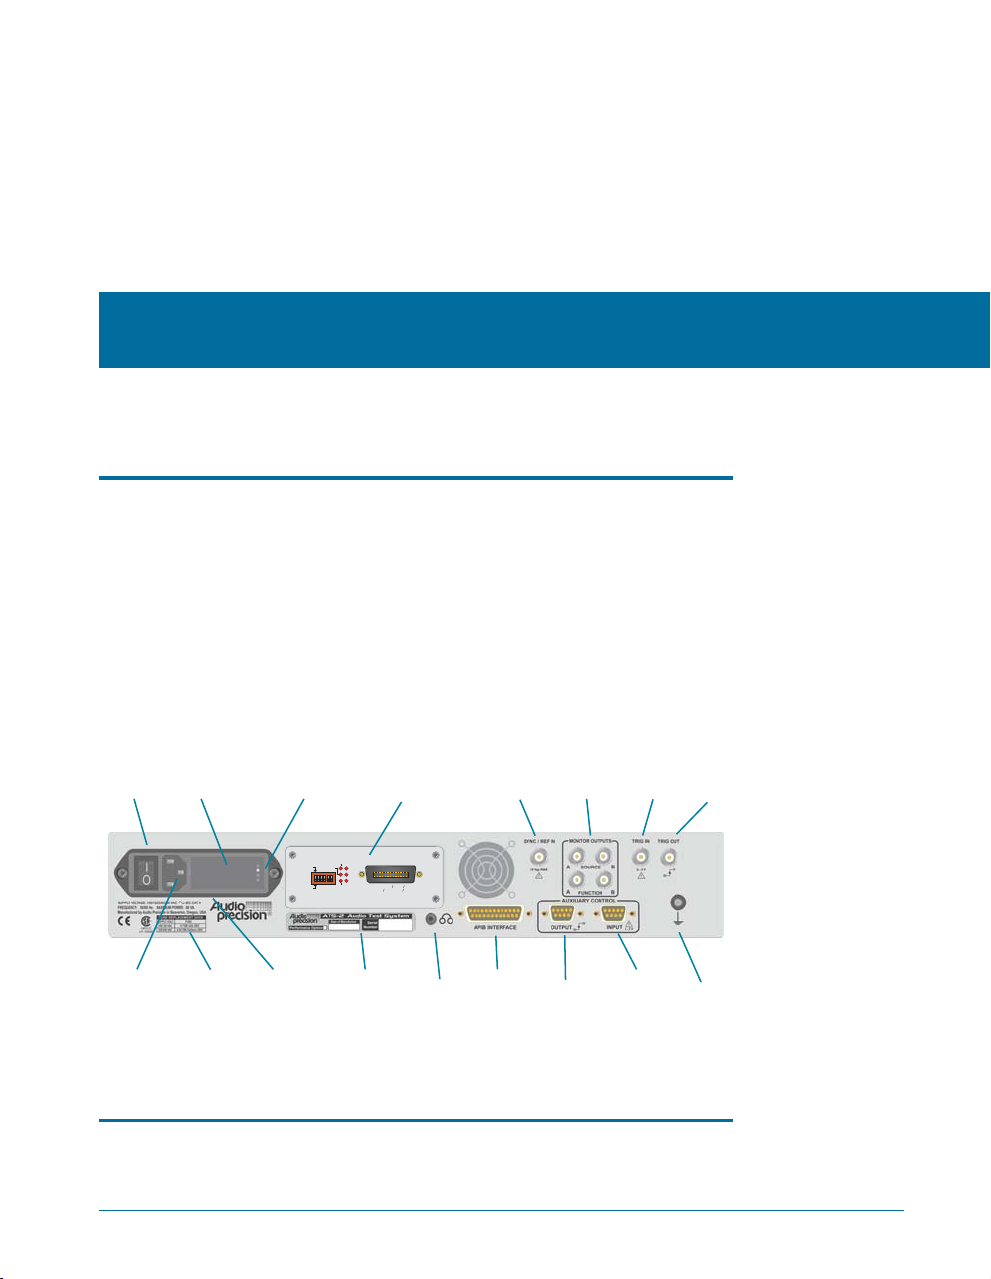
Chapter 7
r
GPIB Configuration
Introduction
As an option, ATS-2 can be ordered in its GPIB configuration, model
ATS2G. GPIB capabilities can also be added to ATS-2 after purchase with
the installation of a GPIB upgrade at the Audio Precision factory or at a
factory-authorized representative.
The GPIB configuration brings the IEEE-488.2 interface standard, also
known as the General Purpose Interface Bus or GPIB, to ATS-2. Hardware
for GPIB consists of a circuit board mounted on a connector panel
assembly that is fitted in the reserved space on the ATS-2 rear panel, as
shown below.
Fuse Holder /
Power
Switch
Mains Supply
Voltage Jumper
Mains Voltage
Indicator
APIB
GPIB
1
0
4
21816
GPIB
ADDRESS
SRQ
ERR
MAV
LA
TA
GPIB Panel
IEEE-488.2(GPIB)
SH1,AH1, T6,TE0, L4, LE0, SR1,
RL1,PP0, DC1, DT1, C0, E2
Sync/RefIn
Monitor
Outputs
Trig In Trig Out
Power
Cord
Connector
Fuse
Replacement
Information
Power
Entry
Module
S/N, Option
Label
Headphone
Jack
APIB
Auxiliary
Control Out
Auxiliary
Control In
Ground
Connecto
Figure 20. Rear panel, ATS-2 with GPIB Option.
APIB or GPIB?
ATS-2 is normally controlled by Audio Precision’s ATS measurement
software using the APIB interface bus. In the GPIB configuration, ATS-2
Getting Started with ATS-2 57
Page 68

Chapter 7: GPIB Configuration The GPIB Software Development Process
can be controlled by either GPIB or APIB as selected by a switch on the
GPIB hardware mounted on the ATS-2 rear panel.
The GPIB configuration makes it possible to integrate ATS-2 hardware
into a system that may include other GPIB-compatible instruments and
devices under operated by your choice of GPIB control software.
Audio Precision does not provide control software for GPIB
applications. We do offer full documentation of the ATS-2 functions
controllable by GPIB in the ATS-2 GPIB Programmer’s Reference Manual,
which contains a listing of all ATS-2 GPIB commands and detailed
explanations of command parameters. The reference manual comes with a
companion CD-ROM that contains sample programs written for Microsoft
Visual Basic. These programs provide examples of how to control ATS-2 to
perform many common audio measurements.
With this information and some knowledge of ATS-2 theory and
operation, you can develop custom software to control your GPIB system.
A recommended path of software development is discussed in the
following topics.
The GPIB Software Development Process
A practical working knowledge of ATS-2 is required in order to develop
effective GPIB software for it. Figure 21 illustrates a typical software
development scenario in which the Audio Precision ATS measurement
software is used to develop expertise with the ATS-2 before attempting to
integrate the instrument into a larger system controlled by a GPIB interface
software program.
Since the GPIB programming commands for ATS-2 are modeled
directly on the ATS user interface, the fastest path for GPIB software
development involves the use of the ATS measurement software as a
learning tool.
Working in ATS you can develop test methods for your DUT and build
confidence that your methods are correct. You can use AP Basic and the
Learn Mode button on the tool bar to develop AP Basic macros that
perform the tests you wish to develop for GPIB. As you learn how ATS-2
best operates under ATS control, the tasks involved in developing
equivalent code for the GPIB port will be greatly simplified.
58 Getting Started with ATS-2
Page 69
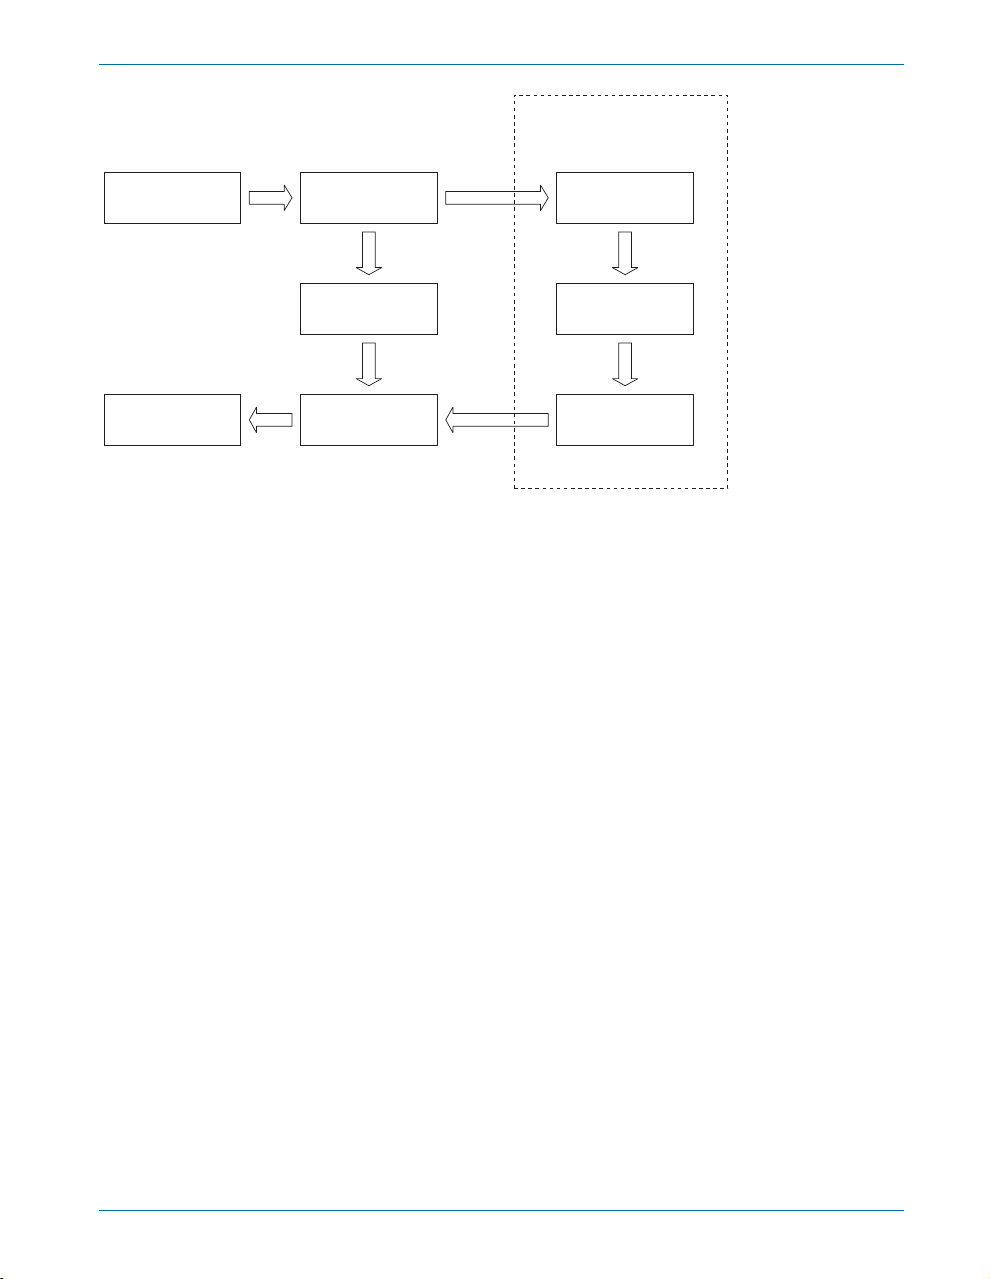
The GPIB Software Development Process Chapter 7: GPIB Configuration
ATS-2
GPIB Developer's Kit
Define the Test
System HW & SW
Automated Testing
with GPIB Test
System
Assemble GPIB Test
Equipment and
System Hardware
Develop Test
Procedures with
GPIB
Integrate HW
and SW
Learn ATS-2
using ATS software
Develop Test
Procedure with
ATS software
Develop Test
Procedure with GPIB
Figure 21. Recommended GPIB software development process using ATS software.
While developing tests in ATS, refer to the ATS-2 GPIB Programmer’s
Reference Manual for the equivalent GPIB commands. It contains detailed
information on every GPIB command for ATS-2, along with general
programming information, code examples and reference material. It is
available separately from Audio Precision.
Included with the ATS-2 GPIB Programmer’s Reference Manual is a
CD-ROM containing GPIB sample files.
The command description sections of the Programmer’s Reference
Manual show ATS software control panels for each of the major
subsections of ATS-2. Each panel is illustrated with GPIB command
call-outs to help you convert your ATS software setup to GPIB commands.
Figure 22 illustrates this for the ATS-2 Analog Generator panel.
Getting Started with ATS-2 59
Page 70
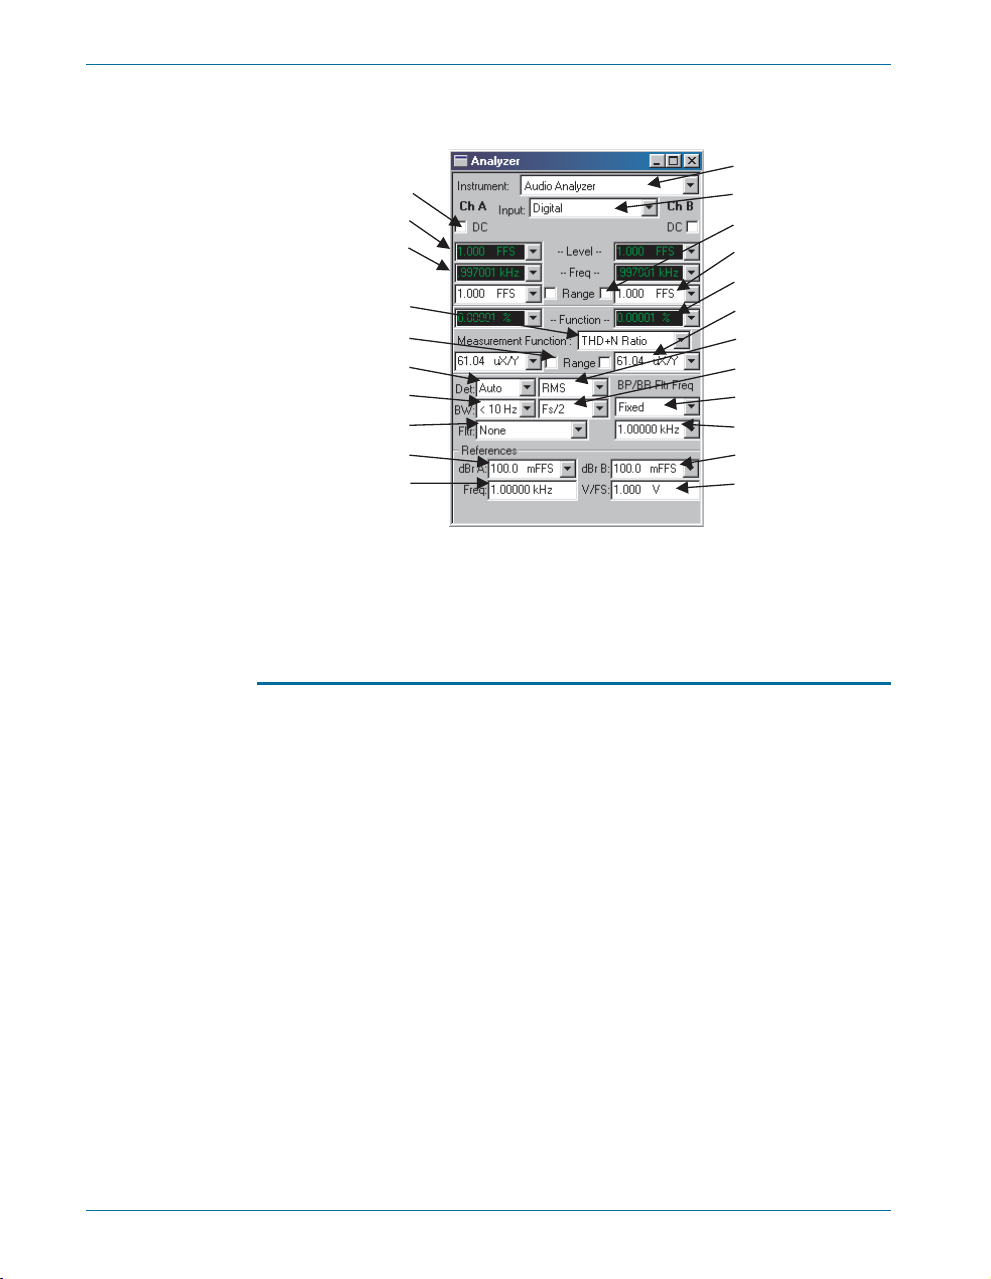
Chapter 7: GPIB Configuration The GPIB Software Development Process
?
:DSP:PROGram
:DSP:DANLr:COUPling
:DSP:DANLr:LEVel?
:DSP:DANLr:FREQ?
:DSP:DANLr:MODE
:DSP:DANLr:FAUTorange
:DSP:DANLr:RDGRate
:DSP:DANLr:HPFilter
:DSP:DANLr:WTG
:DSP:REF:DBRA
:DSP:REF:FREQ
:DSP:DANLr:INPut
:DSP:DANLr:AUTorange
:DSP:DANLr:RANGe
:DSP:DANLr:FUNCmeter
:DSP:DANLr:FRANge
:DSP:DANLr:DETector
:DSP:DANLr:LPFilter
:DSP:DANLr:TUNingsrc
:DSP:DANLr:FILTerfreq
:DSP:REF:DBRB
:DSP:REF:VFS
Figure 22. ATS-2 Audio Analyzer panel with GPIB command call-outs.
Using both GPIB and APIB for Software Development
Your ATS-2 already has an APIB port on the rear panel. The GPIB
option adds a GPIB port and configuration switches and indicators. The
rear panel switches provide a means to select which port is to be used to
control ATS-2 and to assign the instrument’s GPIB address. During the
software development process you may switch between the two modes in
order to take advantage of the interactive development environment of the
ATS measurement software.
The two ports cannot control ATS-2 simultaneously. You must select
GPIB or APIB as the control port.
To use GPIB to control ATS-2, connect an appropriate cable from the
GPIB interface card on the controlling computer to the port on ATS-2, and
select GPIB on the rear-panel switch as shown in Figure 23 (left-most
switch clicked down to “0”). An LED will light to indicate that GPIB is
selected.
When the GPIB port is in control, the APIB port on ATS-2 must be
disconnected from the APIB interface card in the computer.
60 Getting Started with ATS-2
Page 71
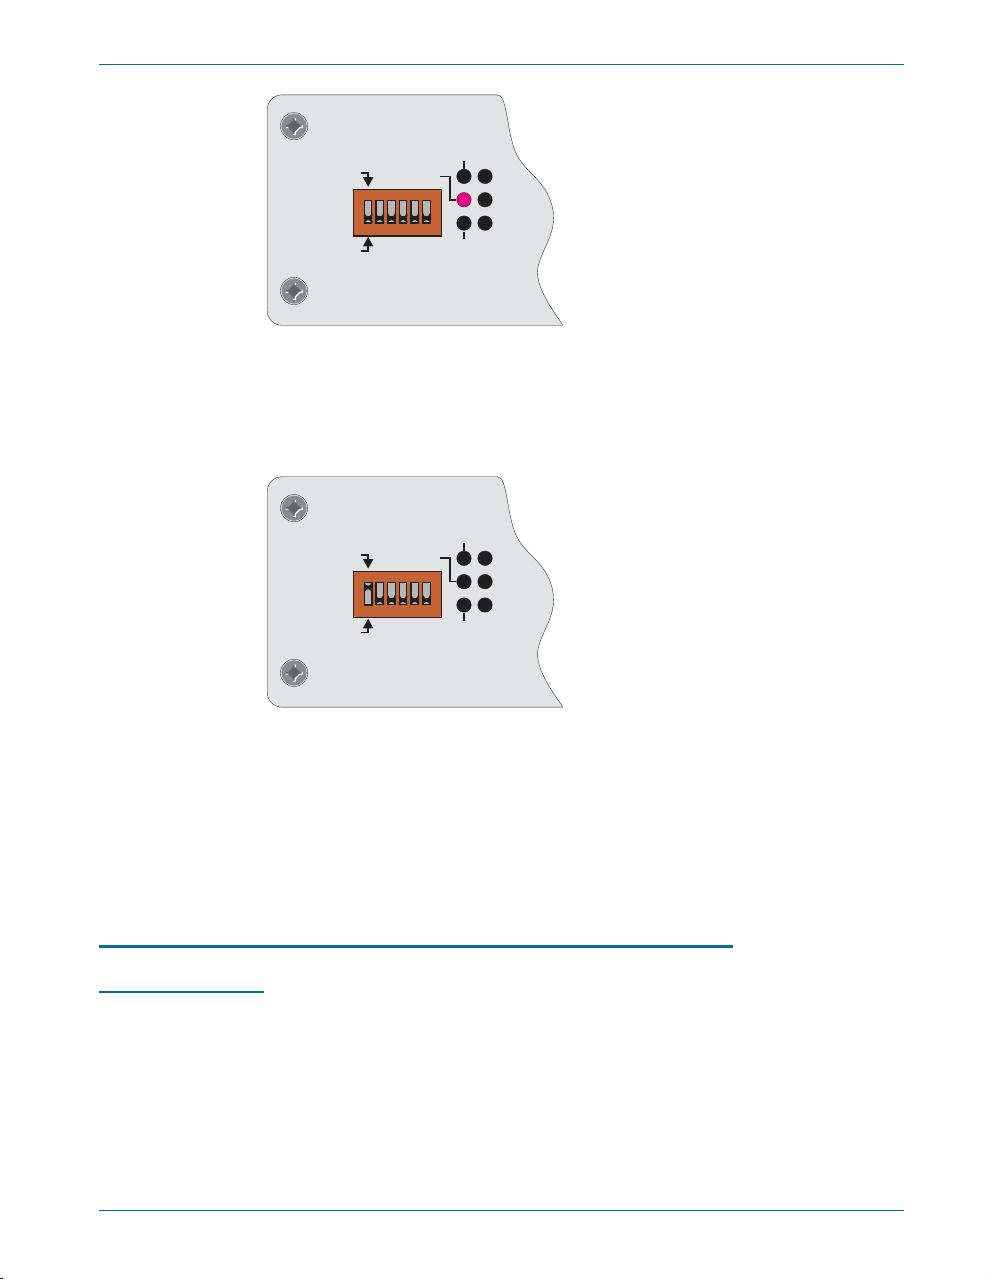
The GPIB Software Development Process Chapter 7: GPIB Configuration
APIB
1
0
GPIB
ADDRESS
SRQ
GPIB
4
21816
ERR
MAV
LA
TA
Figure 23. The ATS-2 Option GPIB panel; detail, shown in GPIB mode.
To use APIB to control ATS-2, select APIB on the rear-panel switch as
shown in Figure 24 (left-most switch clicked up to “1”), and connect a
cable from the APIB interface card on the controlling computer to the port
on ATS-2.
APIB
1
0
GPIB
ADDRESS
SRQ
GPIB
4
21816
ERR
MAV
LA
TA
Figure 24. The ATS-2 Option GPIB panel; detail, shown in APIB mode.
Whether controlled by APIB or GPIB, ATS-2 still uses APIB to control
other Audio Precision APIB instruments and accessories such as the
DCX-127 and the SWR-2122 family of switchers. Figure 25 illustrates how
to connect these devices to the ATS-2 when the GPIB port is the control
port; Figure 26 illustrates how to connect an APIB controller to this system
when the GPIB port is disabled.
Establishing GPIB Communication
GPIB Connection
The ATS-2 with Option GPIB installed has a 24-pin GPIB-compatible
connector on the rear panel. This D-shell connector conforms to the
mechanical requirements of IEEE-488.1-1987. The instrument is
connected to the instrument controller via an appropriate cable. The
instrument controller (a computer) must have a corresponding GPIB
interface port. Standard GPIB cables are designed so they can be stacked
if needed to connect multiple instruments into your GPIB system.
Getting Started with ATS-2 61
Page 72
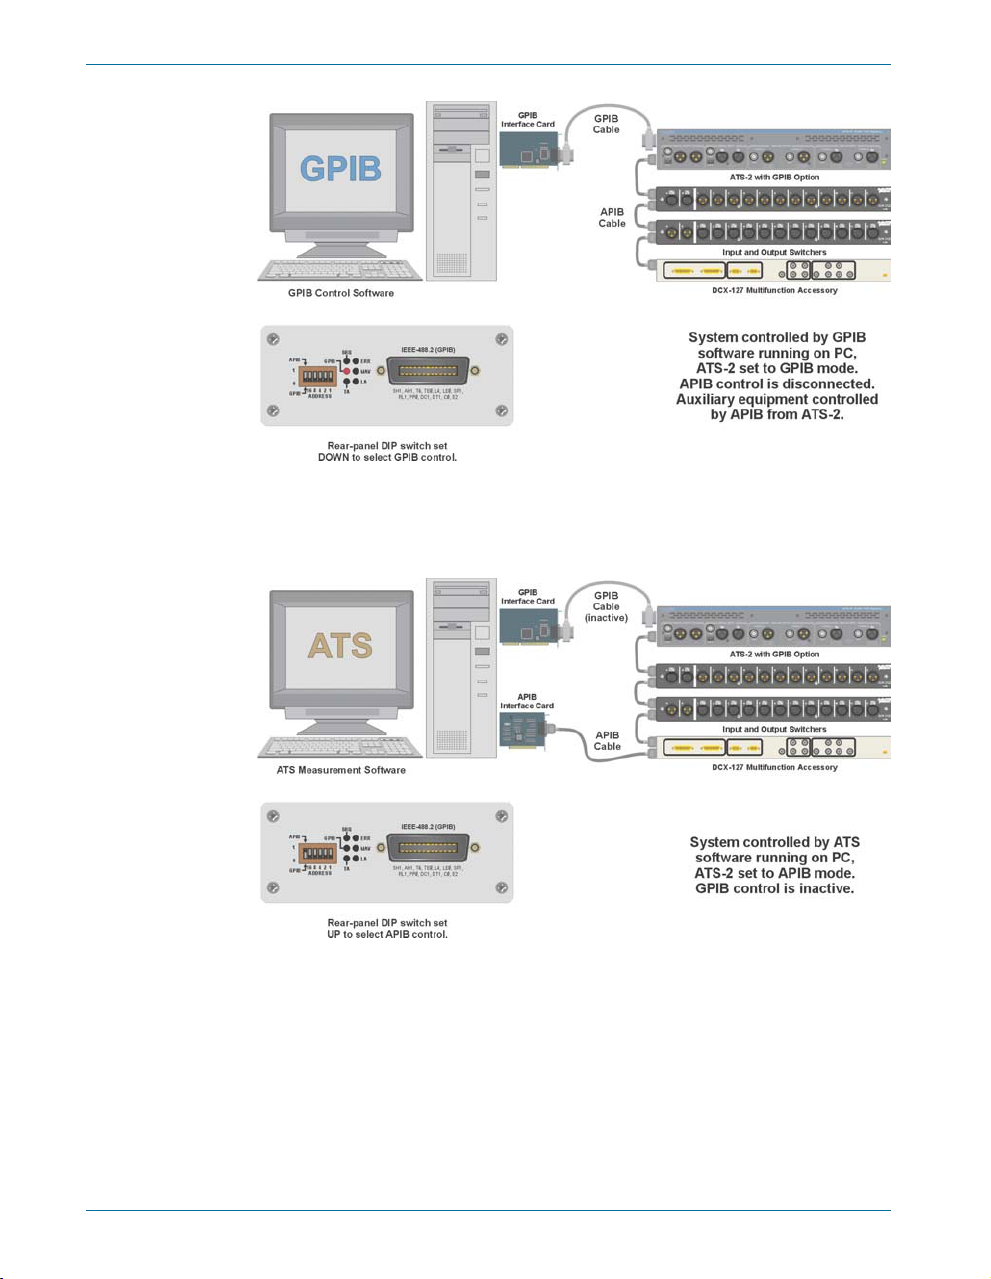
Chapter 7: GPIB Configuration The GPIB Software Development Process
Figure 25. APIB connections to ATS-2 with GPIB option in GPIB control mode. SWR-2122
Switcher and DCX-127 connected to the APIB connector of the ATS-2. The computer
APIB cable is not connected.
Figure 26. APIB controller connections, ATS-2 with GPIB option in APIB control mode.
Computer APIB cable connected to DCX-127, then to SWR-2122, then to ATS-2.
When connecting instruments into a GPIB system, observe the following
rules:
Connect and disconnect instruments from the bus only when the
§
power to all instruments in the system is off.
Assign a unique GPIB address to each instrument (device) on the
§
bus.
62 Getting Started with ATS-2
Page 73

The GPIB Software Development Process Chapter 7: GPIB Configuration
Avoiding accidental EEPROM failure
Your ATS-2 stores system information and calibration constants in a
non-volatile EEPROM memory circuit with the instrument.
It is possible to accidentally change or erase the data stored in the
EEPROM memory. The loss of this data could cause your instrument to
perform out of specification, behave erratically or even fail entirely.
Accidental EEPROM erasure is rare, but it can be caused by
simultaneous use of both the APIB and GPIB buses, which can occur
when you are changing operation from one control bus to the other.
To prevent EEPROM erasure when switching control buses, you
should always follow these orders of operation:
APIB to GPIB changeover:
1. Exit the ATS-2 control software (ATS), then disconnect the APIB
cable.
2. Select GPIB operation using the rear panel switch and proceed
with GPIB operation.
GPIB to APIB changeover:
1. Select APIB operation using the external switch on the ATS-2
rear panel.
2. Connect the APIB cable, launch the ATS-2 control software
(ATS) and proceed with APIB operation.
The GPIB cable can safely remain connected during APIB
operation.
Devices may be connected in a star or linear configuration (see
§
Figure 27), or a combination of star and linear configurations.
Do not attach more than 15 devices (including the controlling
§
computer) to one bus.
Cable length between devices must not exceed 2 meters (6 feet).
§
One device must be attached to the bus for every two meters (6 feet)
§
of cable.
Total cable length must not exceed 20 meters (66 feet).
§
At least two-thirds of the devices on the bus must be powered up for
§
proper system operation.
ATS-2 GPIB Address and I/O Mode Switch
Like all instruments on the bus, ATS-2 must be set to a unique GPIB
address.
An address select switch bank with six slide switches sets the GPIB
address and the I/O Mode. The switch is shown below in Figure 28. The
five switches to the right of the bank set the 5-bit binary primary address of
Getting Started with ATS-2 63
Page 74
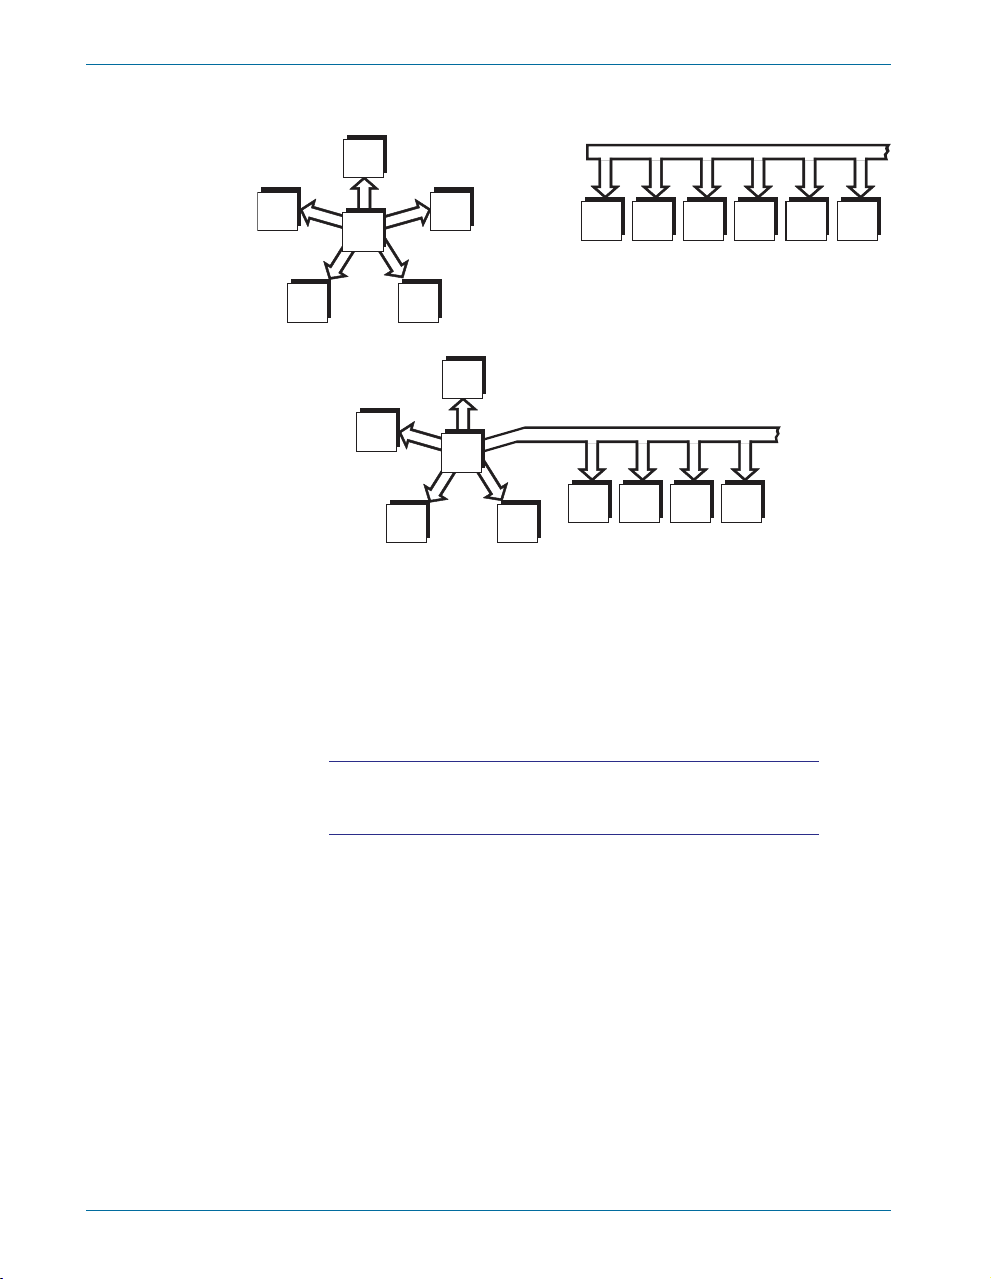
Chapter 7: GPIB Configuration The GPIB Software Development Process
STAR CONFIGURATION
C
B
A
F
E
C
D
D
B
A
COMBINATION STAR AND
LINEAR CONFIGURATION
E
LINEAR CONFIGURATION
A F
FBGCH
DIE
Figure 27. GPIB devices may be connected in star, linear,
or combination star/linear configurations.
the instrument. Legal addresses are 0 through 30. Set each switch up for a
binary 1 or down for a binary 0.
The left-most switch in the bank sets the control mode, independent of
the GPIB address switch settings. Click the switch to 0 (down) to set the
control mode to GPIB.
The APIB port must not be connected to an active Audio
Precision APIB interface card when the GPIB mode is
selected.
Set the switch to 1 (up) to set the control mode to APIB. The APIB
mode disables the GPIB interface (the pins are all set to the
high-impedance state) and enables APIB to control the ATS-2.
64 Getting Started with ATS-2
Page 75
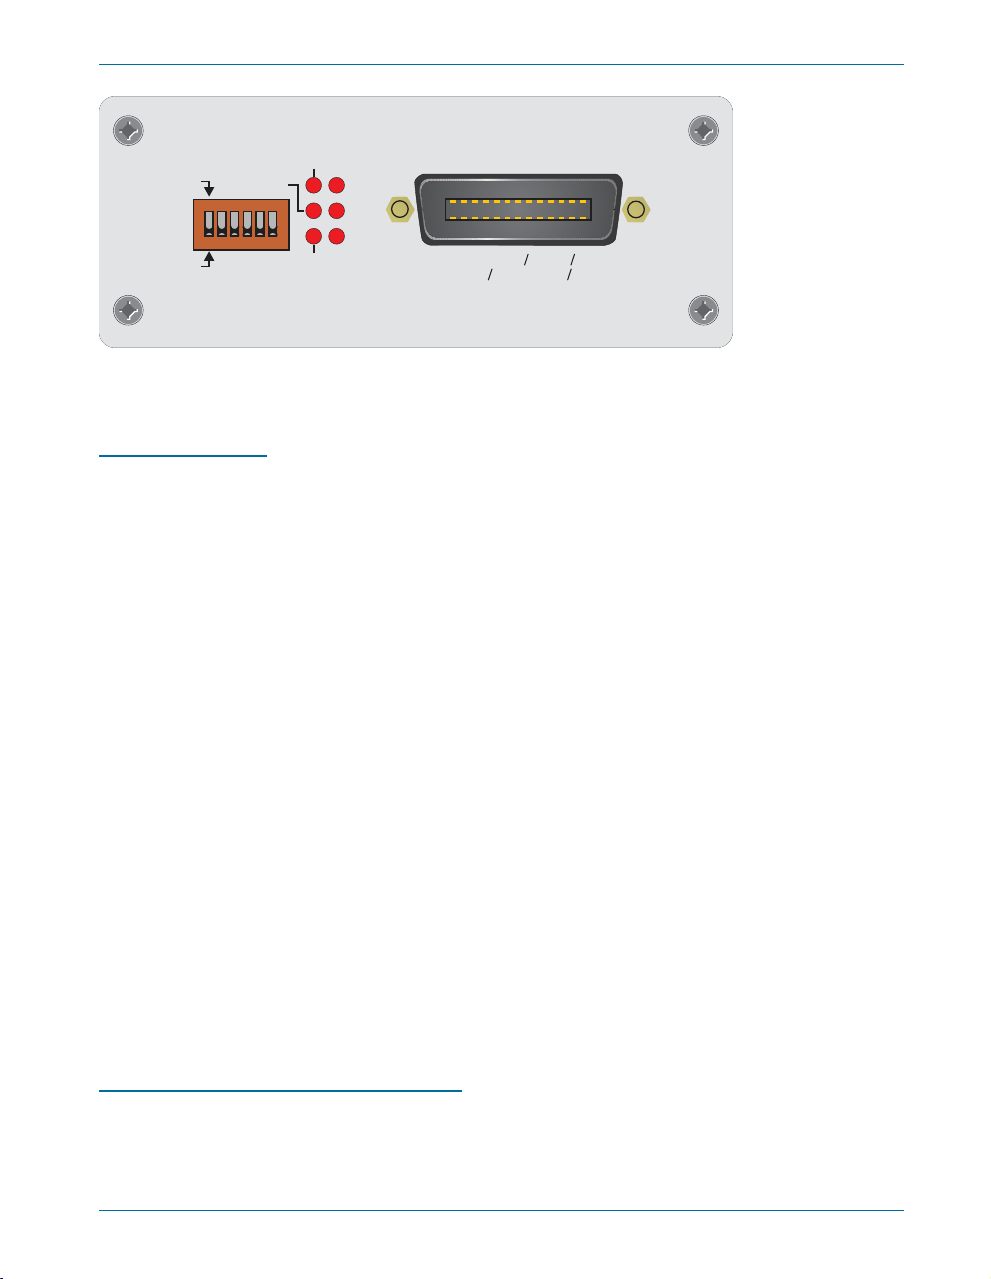
The GPIB Software Development Process Chapter 7: GPIB Configuration
IEEE-488.2 (GPIB)
SH1, AH1, T6, TE0, L4, LE0, SR1,
RL1, PP0, DC1, DT1, C0, E2
Figure 28. ATS-2 GPIB Option panel:
Address Switch, Status LEDs and GPIB port.
APIB
1
0
GPIB
GPIB
4
21816
ADDRESS
SRQ
ERR
MAV
LA
TA
GPIB Status LEDs
The six GPIB Status LEDs shown in Figure 28 indicate the current status
of the GPIB bus. When an LED is illuminated, the status indicated is as
follows:
SRQ (SRQ interrupt)
§
The instrument has asserted the SRQ line in order to request service
from the GPIB controller.
GPIB
§
The instrument is under the control of the GPIB interface, set by the
control mode switch. The APIB connector will be driven internally by
the instrument GPIB interface board.
TA (Talk Addressed)
§
The instrument is talk addressed by the GPIB controller.
LA (Listen Addressed)
§
The instrument is listen addressed by the GPIB controller.
MAV
§
The instrument has one or more bytes in the output queue and has
asserted the MAV (Message AVailable) bit in the Status Byte Register.
ERR
§
The instrument has detected an error condition that has not been
reported to the system controller. This LED goes off when the error
condition has been reported in response to the :ERRM? or :ERRS?
error queries.
GPIB Program Message Terminators
When the instrument is addressed as a listener, two program message
terminators (PMT) are supported:
Getting Started with ATS-2 65
Page 76

Chapter 7: GPIB Configuration The GPIB Software Development Process
EOI line asserted with the NL character (ASCII 10, the linefeed
§
character);
EOI line asserted with the last byte of a message.
§
The NL character alone without EOI is not supported.
When the instrument is addressed as a talker, one PMT is supported:
EOI line asserted with the NL character (ASCII 10, the linefeed
§
character).
66 Getting Started with ATS-2
 Loading...