

Page 1

User's Guide
AudioCodes Utilities for Session Border Controllers and Media Gateways
Syslog Viewer
Version 1.4 and Later
Page 2

Page 3

User's Guide Contents
Table of Contents
1 Introduction ......................................................................................................... 7
2 Installing Syslog Viewer ..................................................................................... 9
3 Configuring the Device for Syslog ................................................................... 11
4 Getting Started .................................................................................................. 13
4.1 Capturing Data ..................................................................................................... 14
4.1.1 Receiving Logs from Device's Web Interface ..........................................................16
4.2 Loading Files ........................................................................................................ 18
4.2.1 Supported File Formats ...........................................................................................18
4.3 Writing Logs to Disk .............................................................................................. 18
4.4 Searching for Strings ............................................................................................ 19
4.5 Editing a Line Entry .............................................................................................. 19
4.6 Filtering Logs ........................................................................................................ 19
4.7 Configuring Syslog Listener .................................................................................. 22
4.8 Using the Command Line ..................................................................................... 22
5 Analyzing Syslog Messages ............................................................................ 23
5.1 Syslog Message Types ........................................................................................ 23
5.1.1 SIP Call Session Logs .............................................................................................24
5.1.2 Board Logs ..............................................................................................................25
5.1.3 SNMP Alarms ..........................................................................................................26
6 Analyzing Calls with SIP Ladder (Call Flow) ................................................... 27
7 Configuring Display Settings ........................................................................... 31
7.1 Changing the Scroll Buffer Default ........................................................................ 31
7.2 Rotating Log Files ................................................................................................ 31
7.3 Freezing Display ................................................................................................... 31
7.4 Disabling Auto-Scroll ............................................................................................ 31
7.5 Saving Captured Buffer ........................................................................................ 32
7.6 Configuring External Editor ................................................................................... 32
7.7 Detecting Missing and Out-Of-Order Logs ............................................................ 32
7.8 Filtering Incoming Traffic ...................................................................................... 32
7.9 Coloring and Formatting ....................................................................................... 33
7.9.1 Saving Window Position ..........................................................................................35
7.9.2 Configuring Font Type .............................................................................................35
A Syslog Error Abbreviations .............................................................................. 37
B Message Severity Levels .................................................................................. 39
Version 1.40 3 Diagnostics and Analysis
Page 4

Syslog Viewer
This page is intentionally left blank.
User's Guide 4 Document #: LTRT-40031
Page 5

User's Guide Notices
Notice
Information contained in this document is believed to be accurate and reliable at the time of
printing. However, due to ongoing product improvements and revisions, AudioCodes cannot
guarantee accuracy of printed material after the Date Published nor can it accept responsibility
for errors or omissions. Updates to this document can be downloaded from
https://www.audiocodes.com/library/technical-documents.
This document is subject to change without notice.
Date Published: October-22-2020
WEEE EU Directive
Pursuant to the WEEE EU Directive, electronic and electrical waste must not be disposed of
with unsorted waste. Please contact your local recycling authority for disposal of this product.
Customer Support
Customer technical support and services are provided by AudioCodes or by an authorized
AudioCodes Service Partner. For more information on how to buy technical support for
AudioCodes products and for contact information, please visit our website at
https://www.audiocodes.com/services-support/maintenance-and-support.
Stay in the Loop with AudioCodes
Abbreviations and Terminology
Each abbreviation, unless widely used, is spelled out in full when first used.
Document Revision Record
LTRT Description
40030 Initial document release.
40031 Updated to Ver. 1.44. Note added to indicate no support by MP-1xx for “Receiving
Logs from Device's Web Interface”; Syslog format updated to indicate SID and BID
contains serial number instead of MAC for Mediant Software and 9000; installation
updated
Version 1.40 5 Diagnostics and Analysis
Page 6

Syslog Viewer
Documentation Feedback
AudioCodes continually strives to produce high quality documentation. If you have any
comments (suggestions or errors) regarding this document, please fill out the Documentation
Feedback form on our website at https://online.audiocodes.com/documentation-feedback.
User's Guide 6 Document #: LTRT-40031
Page 7
User's Guide 1. Introduction
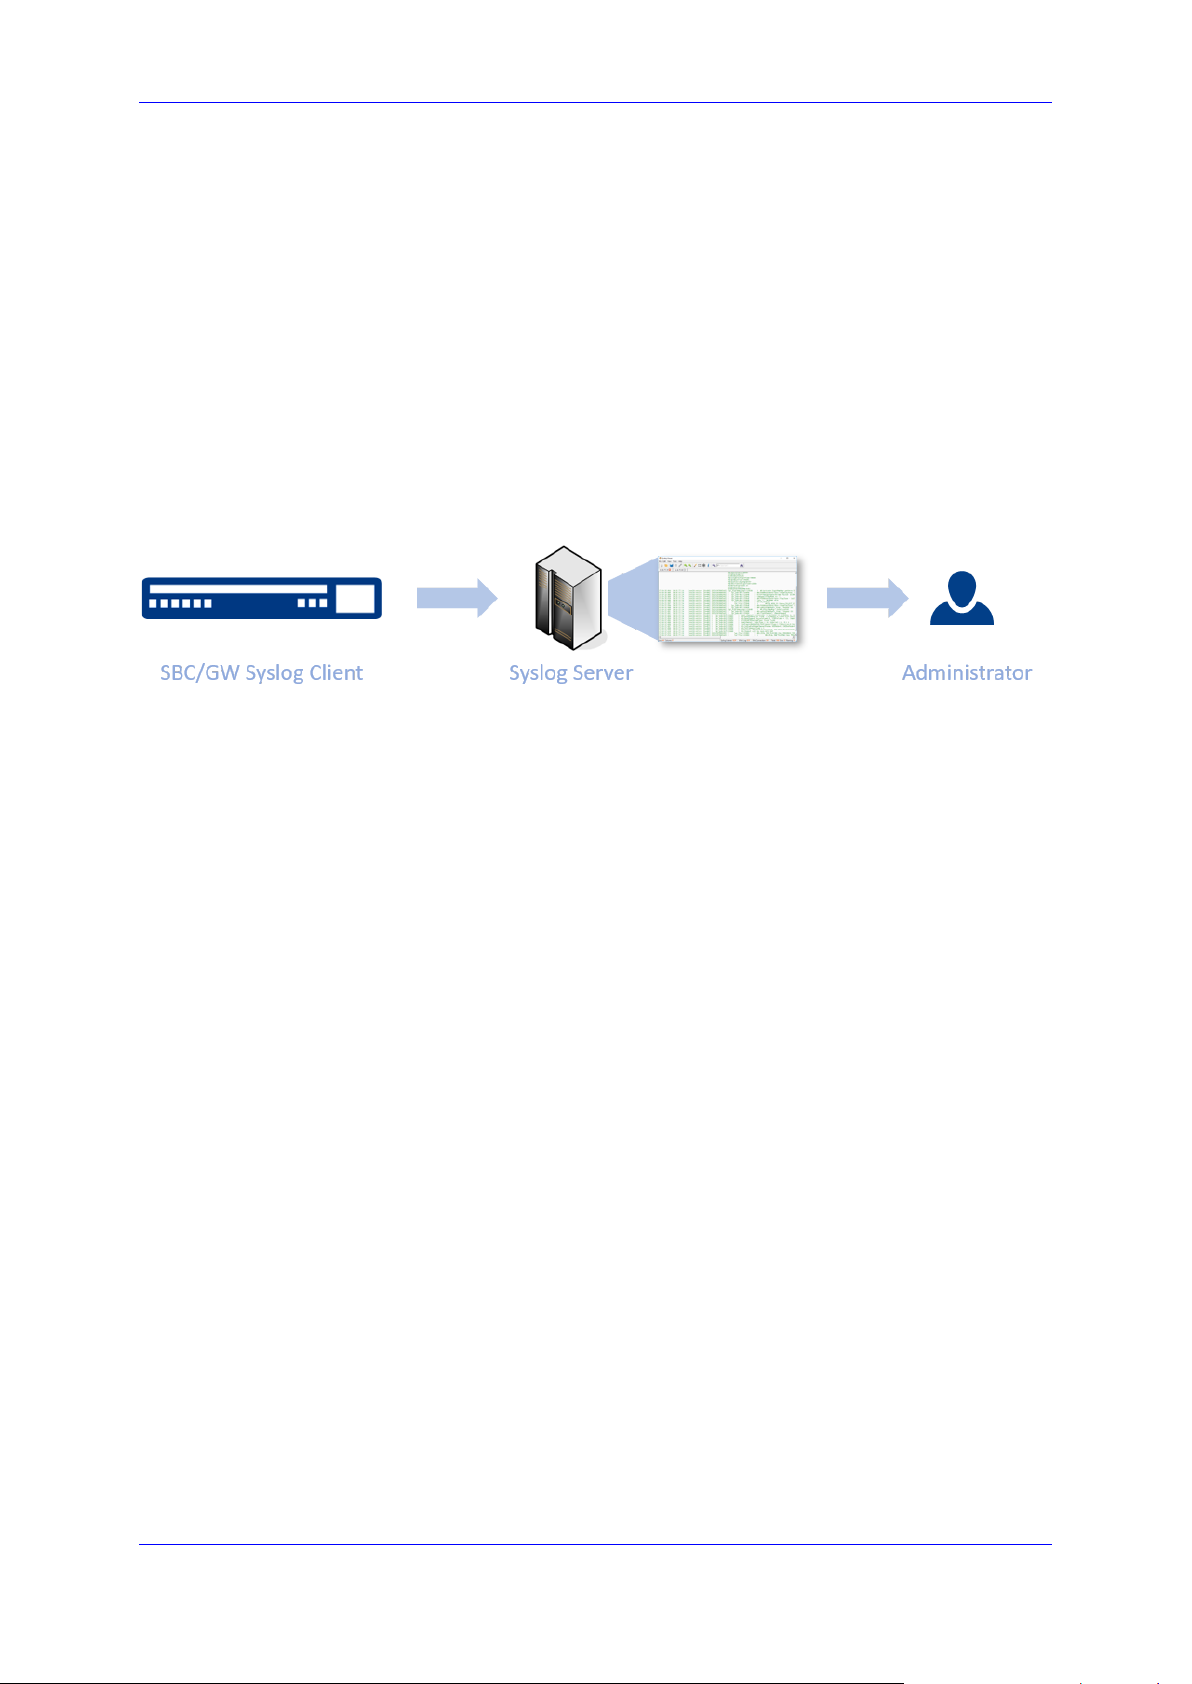
1 Introduction
Syslog is an event notification protocol that enables a device to send event notification
messages across IP networks to event message collectors, also known as Syslog Servers
The device (SBC/GW) contains an embedded Syslog client, which sends error
reports/events that it generates to a remote Syslog server
This information is a collection of error, warning, and system messages that records every
internal operation of the device
AudioCodes Syslog Viewer utility can be used for the following major tasks:
Recording and displaying syslog messages from your AudioCodes device
Analyzing recorded logs (including support for interactive SIP ladder diagram)
This document describes how to install, setup, configure the use the Syslog Viewer. The
figure below illustrates the syslog deployment.
Figure 1-1: Syslog Monitoring
Version 1.40 7 Diagnostics and Analysis
Page 8

Syslog Viewer
This page is intentionally left blank.
User's Guide 8 Document #: LTRT-40031
Page 9
User's Guide 2. Installing Syslog Viewer
2 Installing Syslog Viewer
This section describes how to install the Syslog Viewer on your PC. Installation of Syslog
Viewer is performed on the computer that has access to the device.
To install Syslog Viewer:
1. Download the Syslog Viewer installation file from AudioCodes website at
https://www.audiocodes.com/library/firmware.
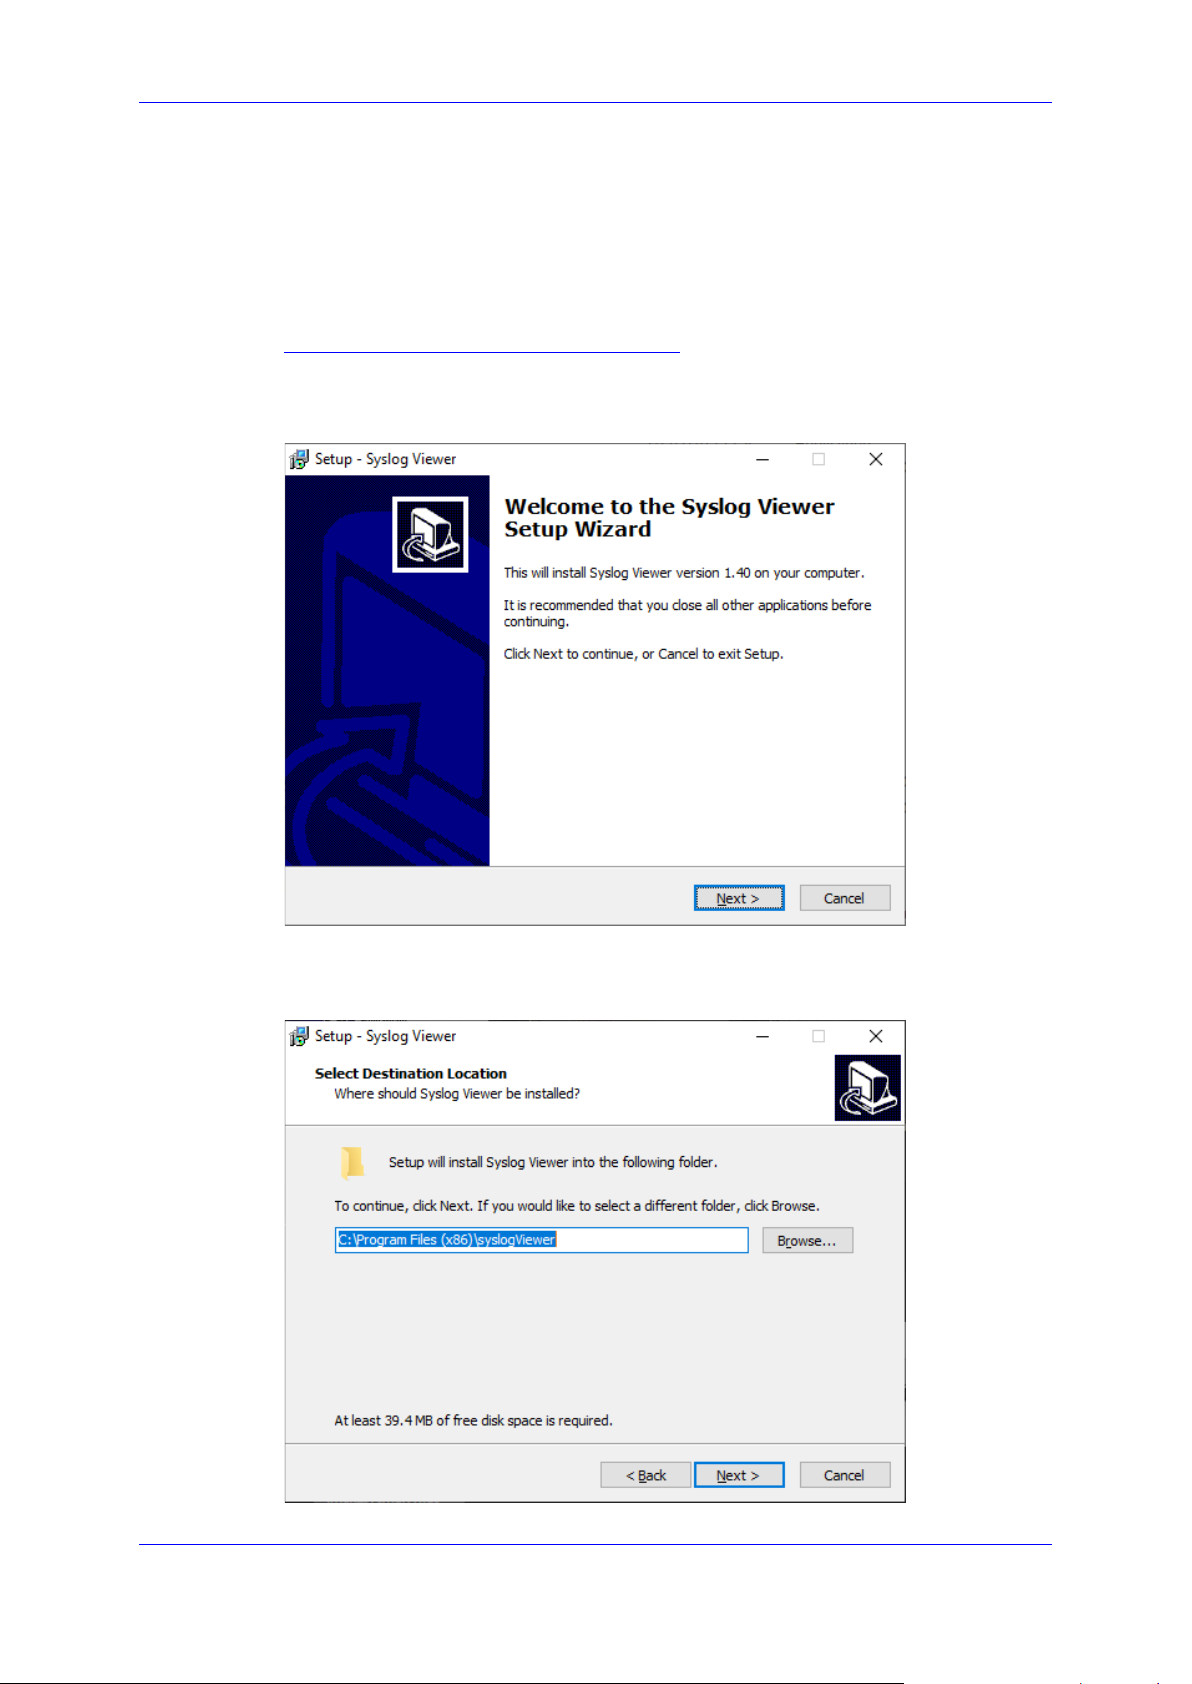
2. Click the downloaded .exe file; the installation wizard starts:
Figure 2-1: Syslog Viewer-Welcome Screen
3. Click Next; the following appears:
Figure 2-2: Select Destination Location
Version 1.40 9 Diagnostics and Analysis
Page 10
Syslog Viewer
4. Select the location on your computer where you want to install Syslog Viewer, and then
click Next; the following appears:
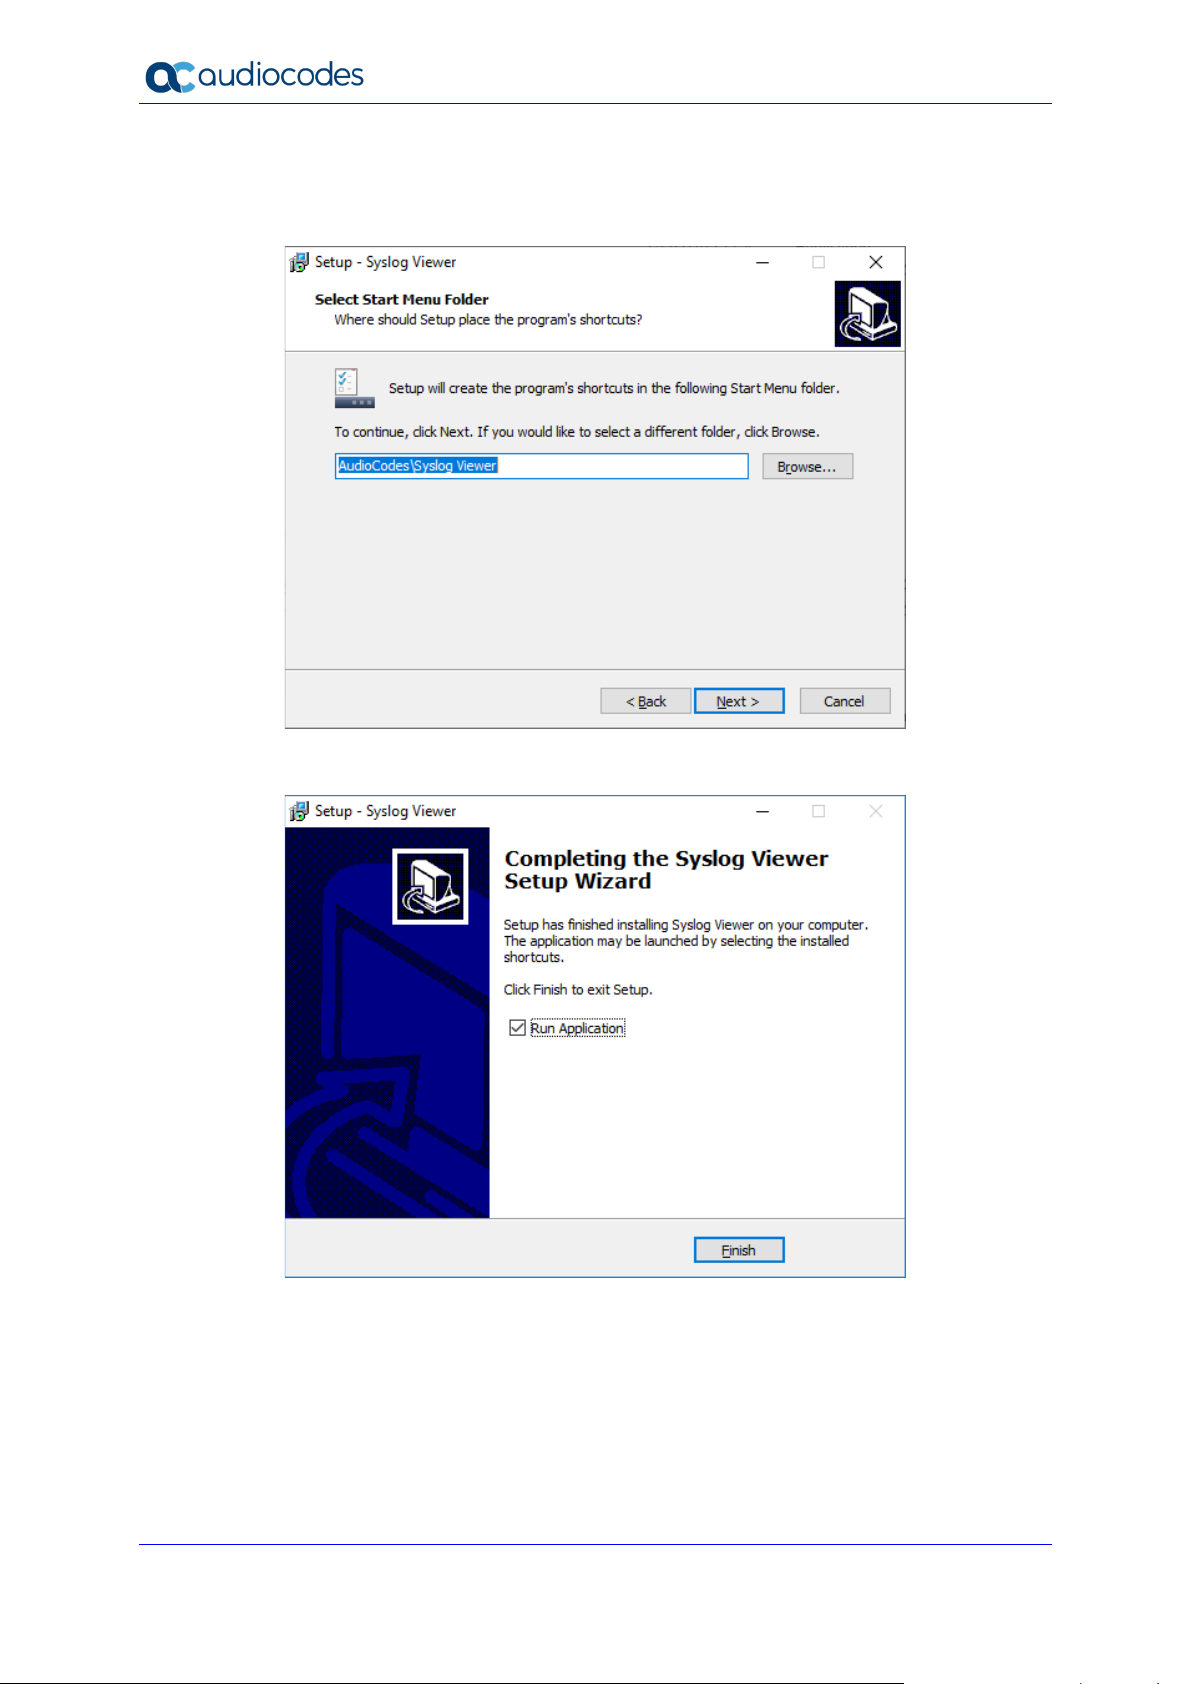
Figure 2-3: Select Location of Shortcut Menu
5. Select where you want to add Syslog Viewer's shortcut menu, and then click Next; the
program starts to install. When installation completes, the following appears:
6. Click Finish; the main window of the Syslog Viewer is displayed. For a description of
the main areas of the window, see Section Getting Started.
User's Guide 10 Document #: LTRT-40031
Page 11
User's Guide 3. Configuring the Device for Syslog
3 Configuring the Device for Syslog
Before you can start receiving any Syslog messages from the device, you need to configure
the device to send generated Syslog messages to the Syslog Viewer.
Enabling syslog on device:
1. Run the Syslog Viewer tool.
2. On the same computer, connect to the device's Web interface, and then log in using the
device's username-password credentials.
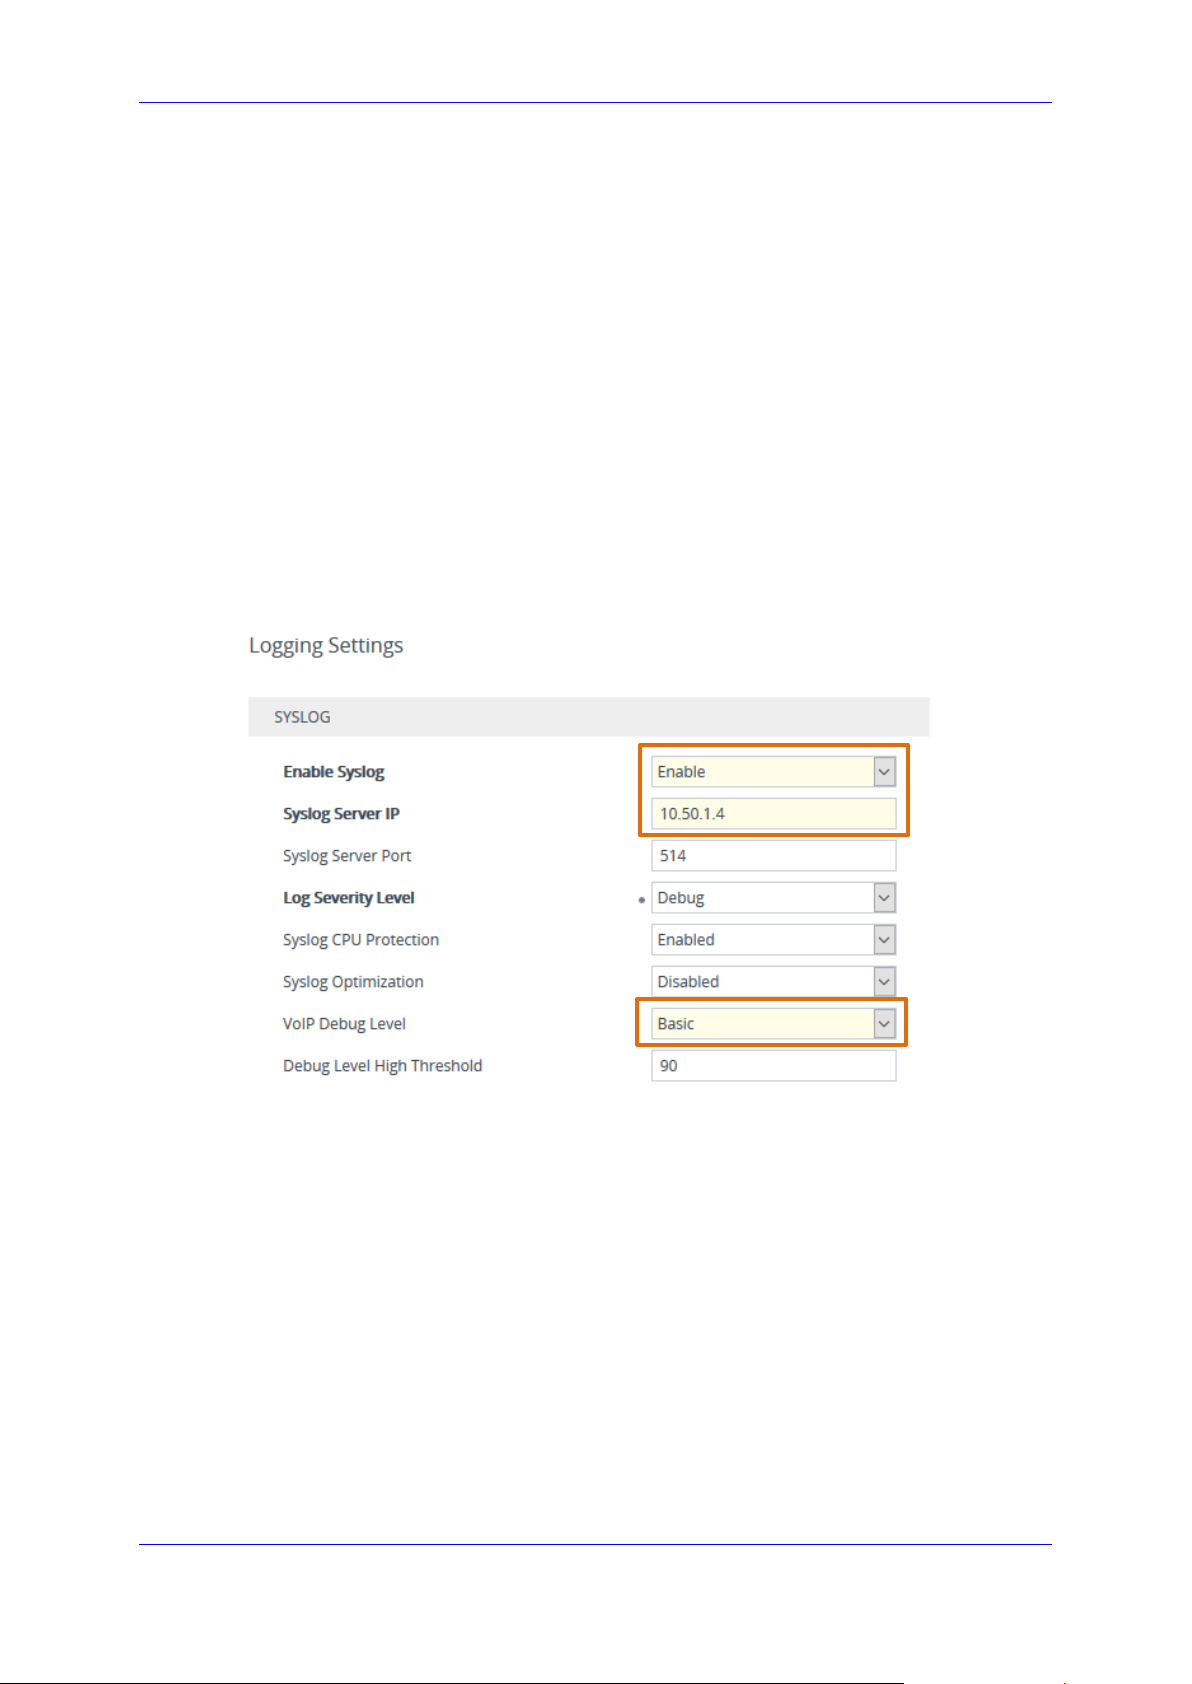
3. Open the Logging Settings page (Troubleshoot menu > Troubleshoot tab > Logging
folder > Logging Settings).
4. Configure the following parameters:
• From the 'Enable Syslog' drop-down list, select Enable.
• In the 'Syslog Server IP' field, enter the IP address of the computer where Syslog
Viewer is running.
• From the 'VoIP Debug Level' drop-down list, select Basic.
Figure 3-1: Enabling Syslog on Device
5. Click Apply, and then click Save to save your settings.
Version 1.40 11 Diagnostics and Analysis
Page 12

Syslog Viewer
This page is intentionally left blank.
User's Guide 12 Document #: LTRT-40031
Page 13

User's Guide 4. Getting Started
4 Getting Started
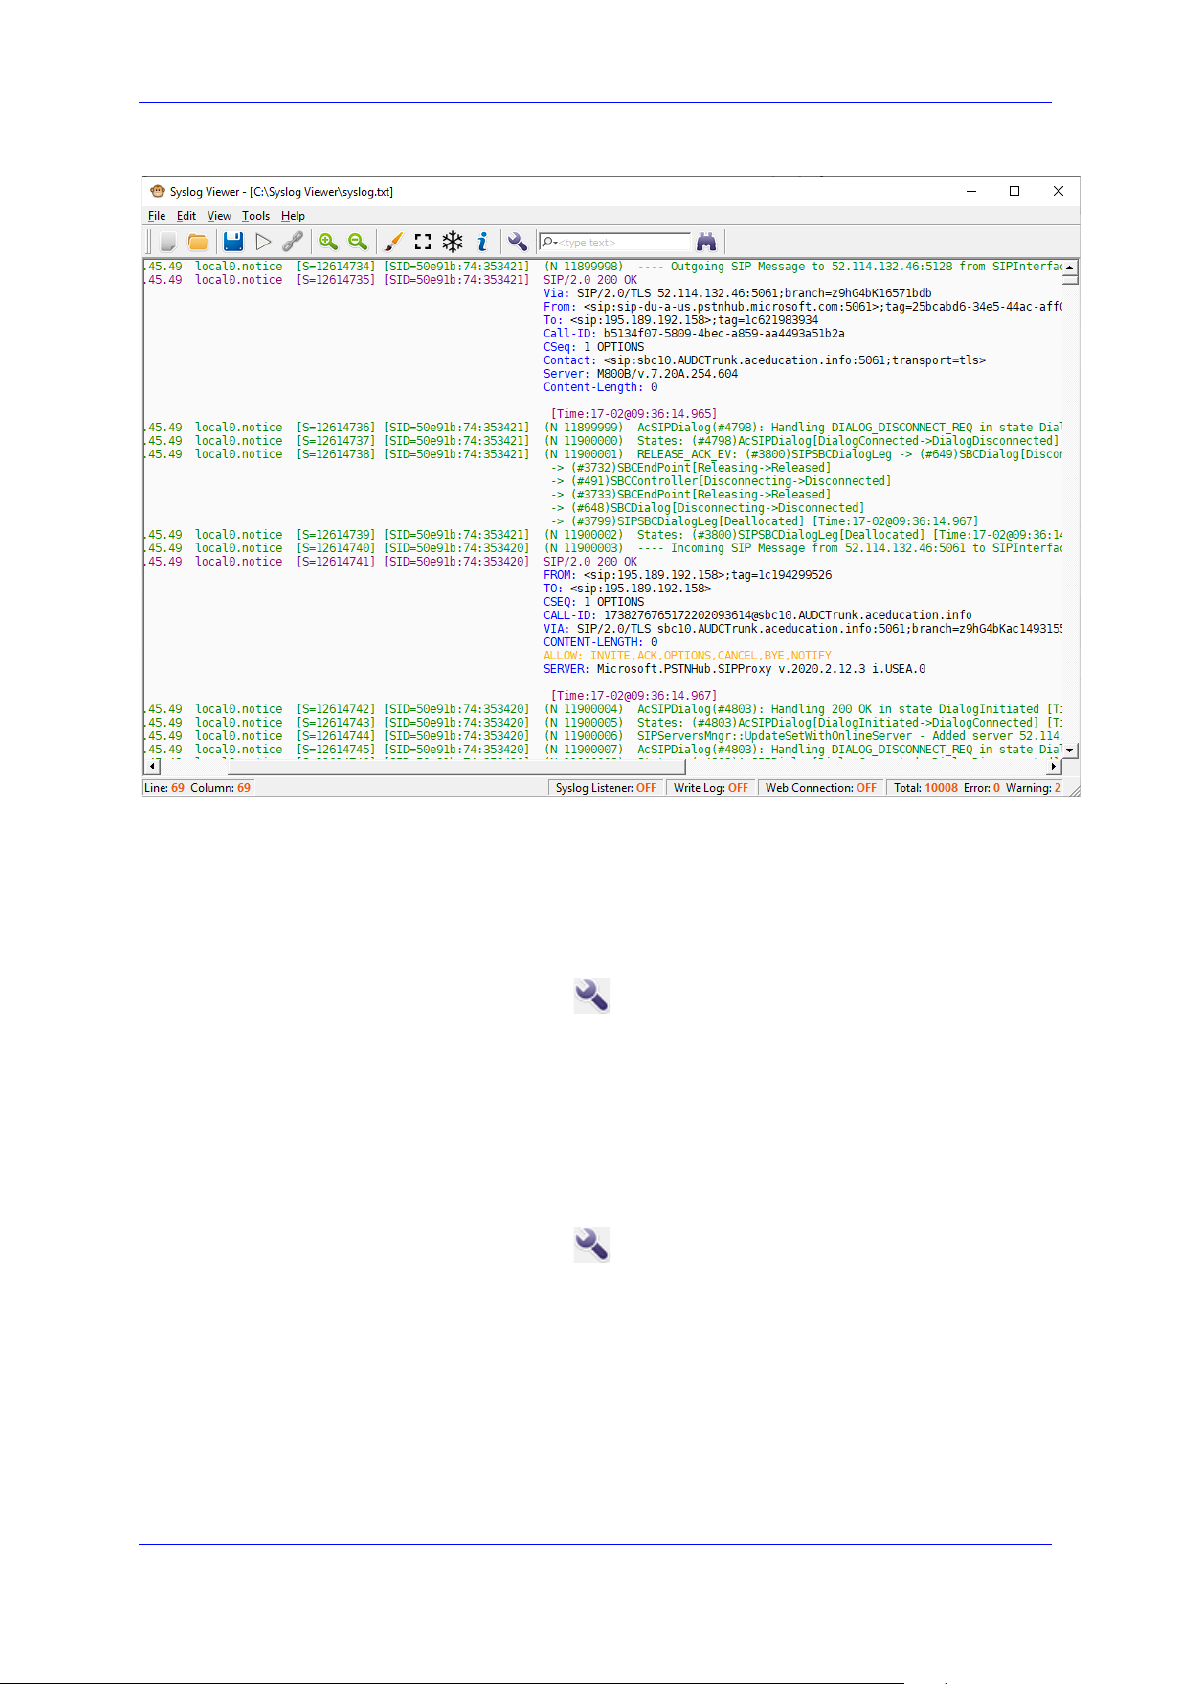
Open the Syslog Viewer application. The figure below illustrates the main components
of the Syslog Viewer screen.
Figure 4-1: Syslog Viewer
Table 4-1: Toolbar
Icon Description
Clears the screen.
Browses to open syslog file. See Section 4.1.
Writes log to file. See Section 4.3.
Resumes receiving syslog messages.
Pauses the receiving of syslog messages.
Connects to the web interface of an AudioCodes device.
Magnifies the screen display.
Configures an external editor. See Section 7.6.
Disables auto-scroll. See Section 7.3.
Freezes display. See Section 7.3.
Version 1.40 13 Diagnostics and Analysis
Page 14

Syslog Viewer
Icon Description
Opens the SIP flow diagram. See Chapter 5.
Opens the Options screen.
Searches for a string.
Table 4-2: Status Bar
Status Description
“Line and
Column”
“Syslog
Listener”
“Write Log” Indicates when a log is currently being written to a file.
“Web
Connection”
“Total” Indicates the total number of lines in the file.
“Errors” Indicates the number of errors in the file
“Warning” Indicates the number of warnings in the file.
Line and Column reference
Indicates whether the Syslog Listener is active. When inactive indicates OFF. When
active indicates the active protocol (UDP or TCP).
Indicates the IP address of the AudioCodes device connection from which syslog is
captured (see Section 4.1.1). Syslog can be enabled simultaneously to report to the
same Syslog server.
4.1 Capturing Data
Once you have setup the managed device to send syslog messages, you are ready to start
capturing data.
To start capturing data:
1. Make a few calls or perform a basic configuration action such as reset on the managed
device.
2. On the toolbar, use the Resume button or from the File menu, choose Resume to
start capturing data from the device; on the status bar, you notice that the Syslog
Listener status changes to “UDP” or “TCP”.
Figure 4-2: Syslog Listener
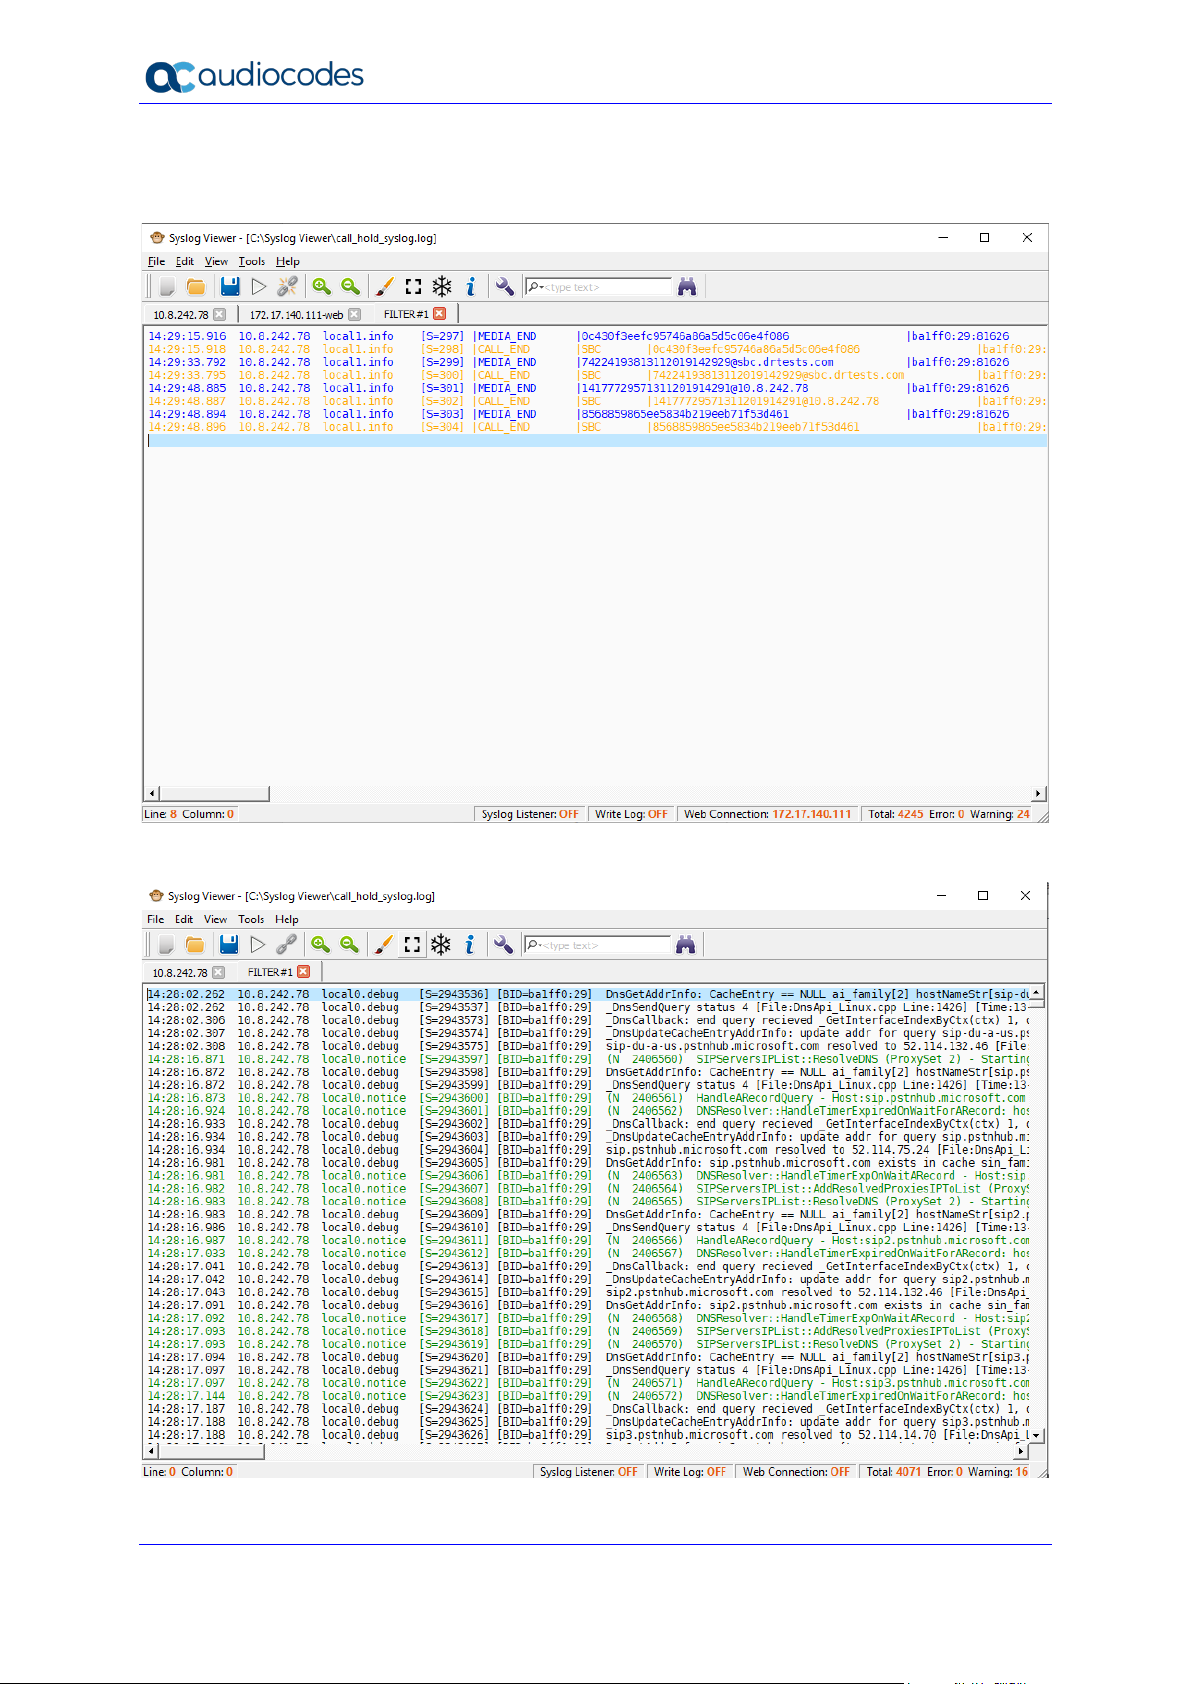
3. Detailed logs, including all the send and received SIP messages are displayed in the
Syslog Viewer.
User's Guide 14 Document #: LTRT-40031
Page 15
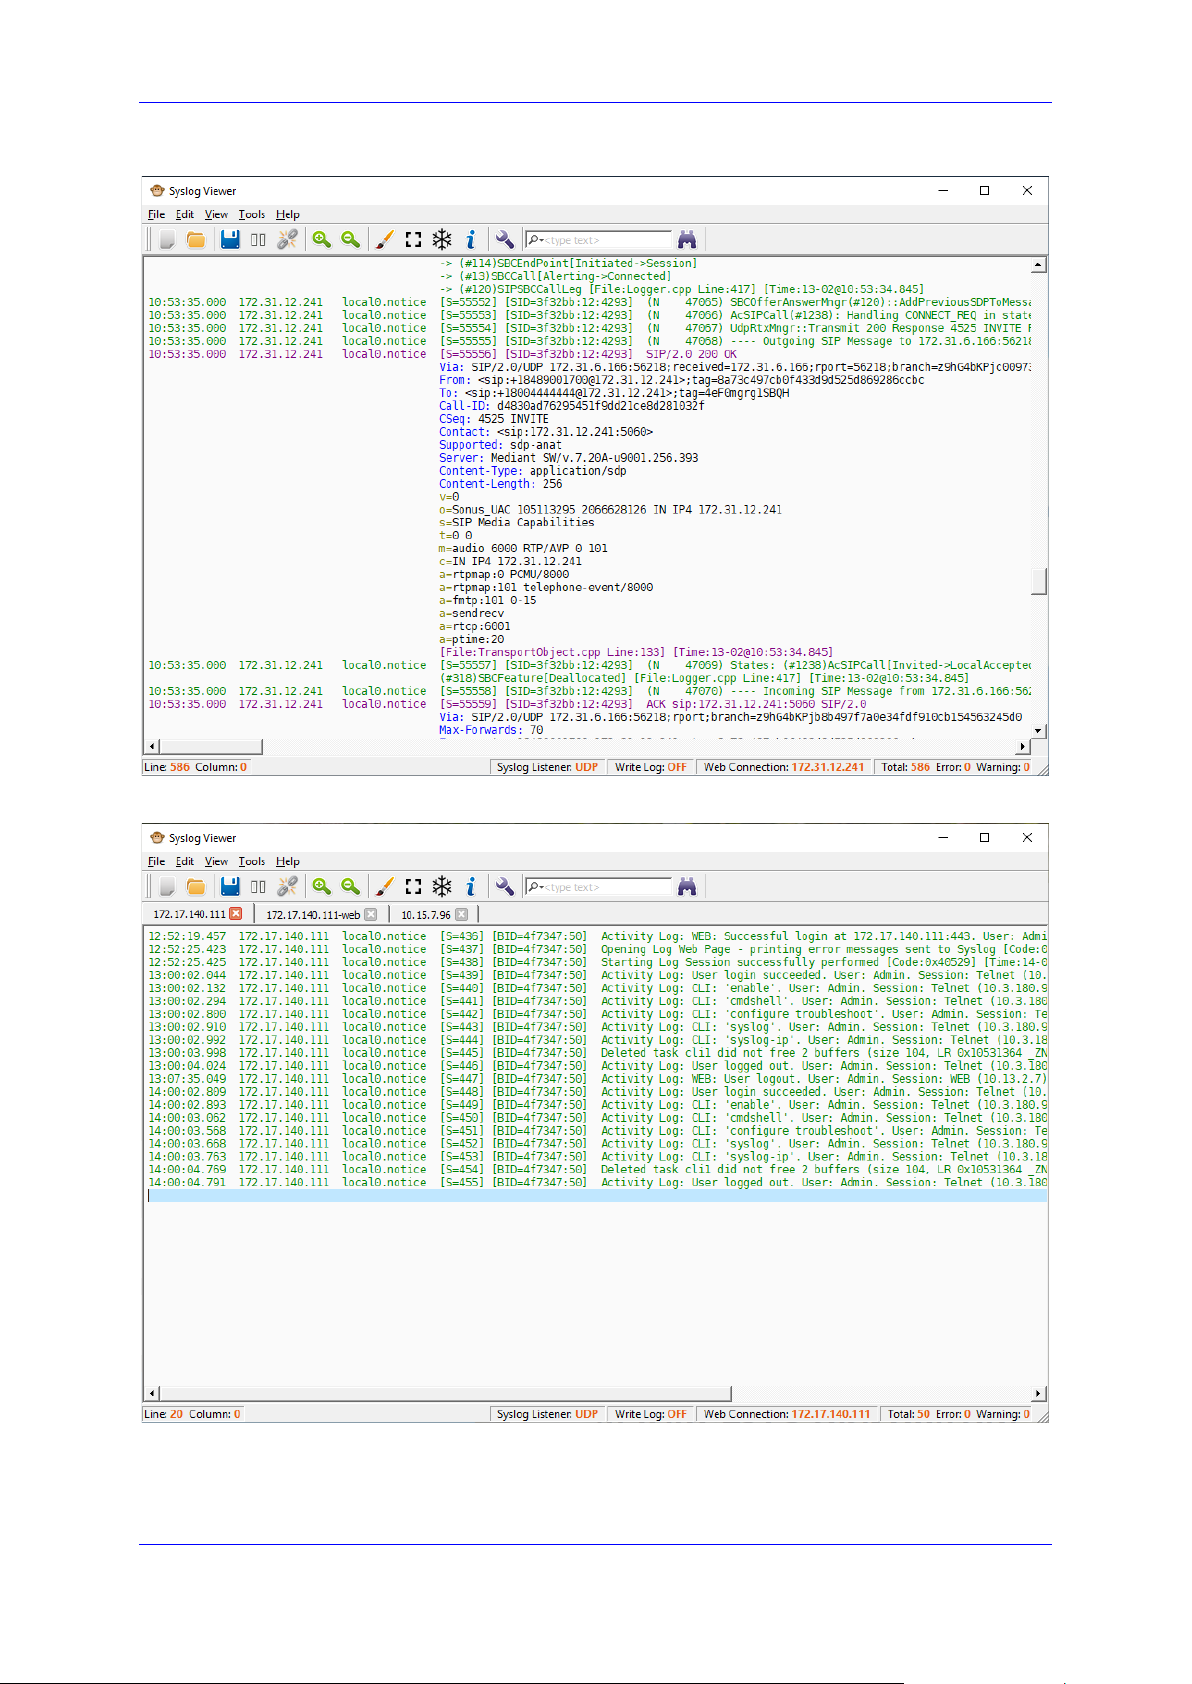
User's Guide 4. Getting Started
Figure 4-3: SIP Call
Figure 4-4: Activity Log
Version 1.40 15 Diagnostics and Analysis
Page 16
Syslog Viewer
Note: The above procedure configures the SBC to send syslog messages to the PC
where Syslog Viewer is installed. If such communication is not possible (e.g., due to a
firewall or NAT devices in the middle), you may use the Web Connect feature in the Syslog
Viewer to establish an HTTP connection with the SBC and retrieve logs from it (see
Section 4.1.1 below).
4.1.1 Receiving Logs from Device's Web Interface
In addition to collecting syslog messages, the utility supports receiving logs from the
SBC/Gateway device's Web interface. This method is useful, for example, when the SBC is
deployed in a public cloud and syslog messages are blocked by a corporate firewall.
Note:
• The Web connection feature has limited log capturing capacity. For high volume of
logs, use the regular Syslog protocol instead.
• Receiving logs from the Web interface is not supported by the MP-1xx product
series.
To connect to the SBC/Gateway device's Web interface:
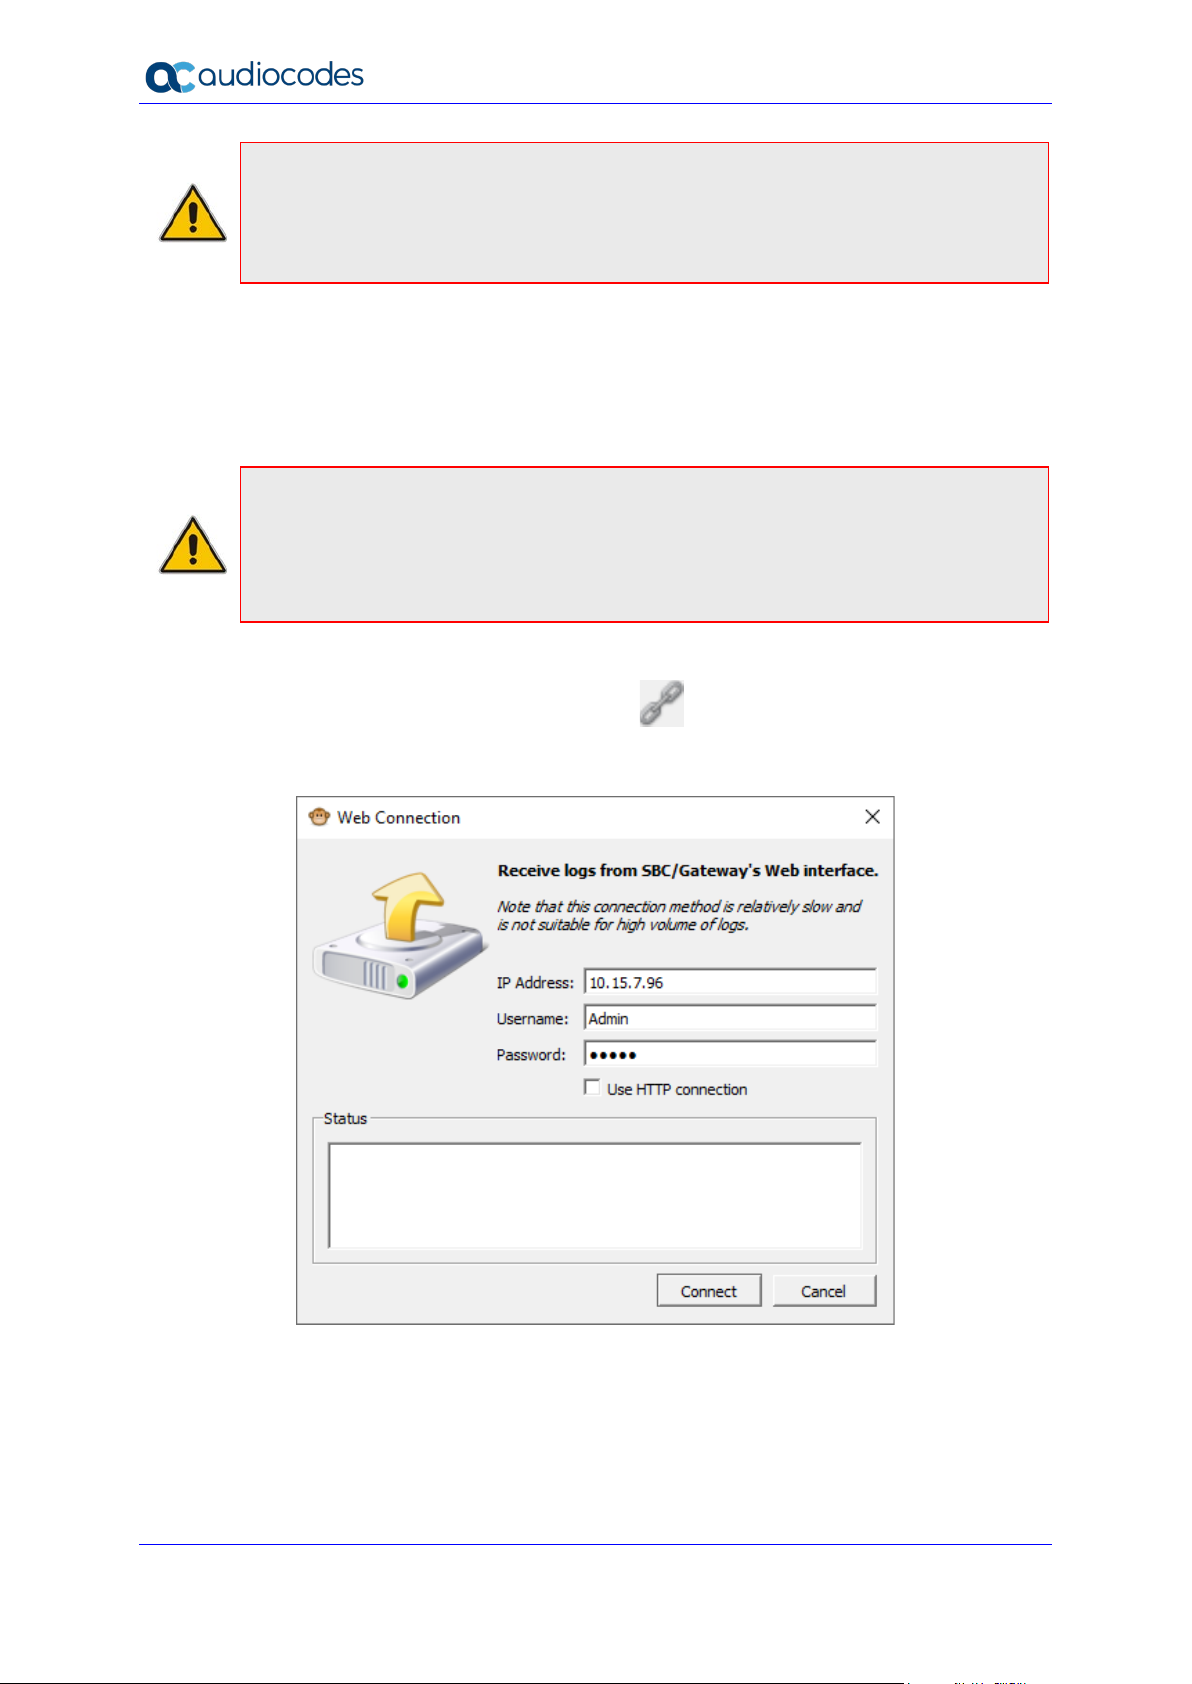
1. On the toolbar, use the Connect To button or from the File menu, choose
Connect To to establish connection with the device.
Figure 4-5: Web Connection
2. Enter the IP address and device credentials, and then click Connect.
3. Select the “User HTTP Connection” check box to enable an HTTP connection.
User's Guide 16 Document #: LTRT-40031
Page 17
User's Guide 4. Getting Started
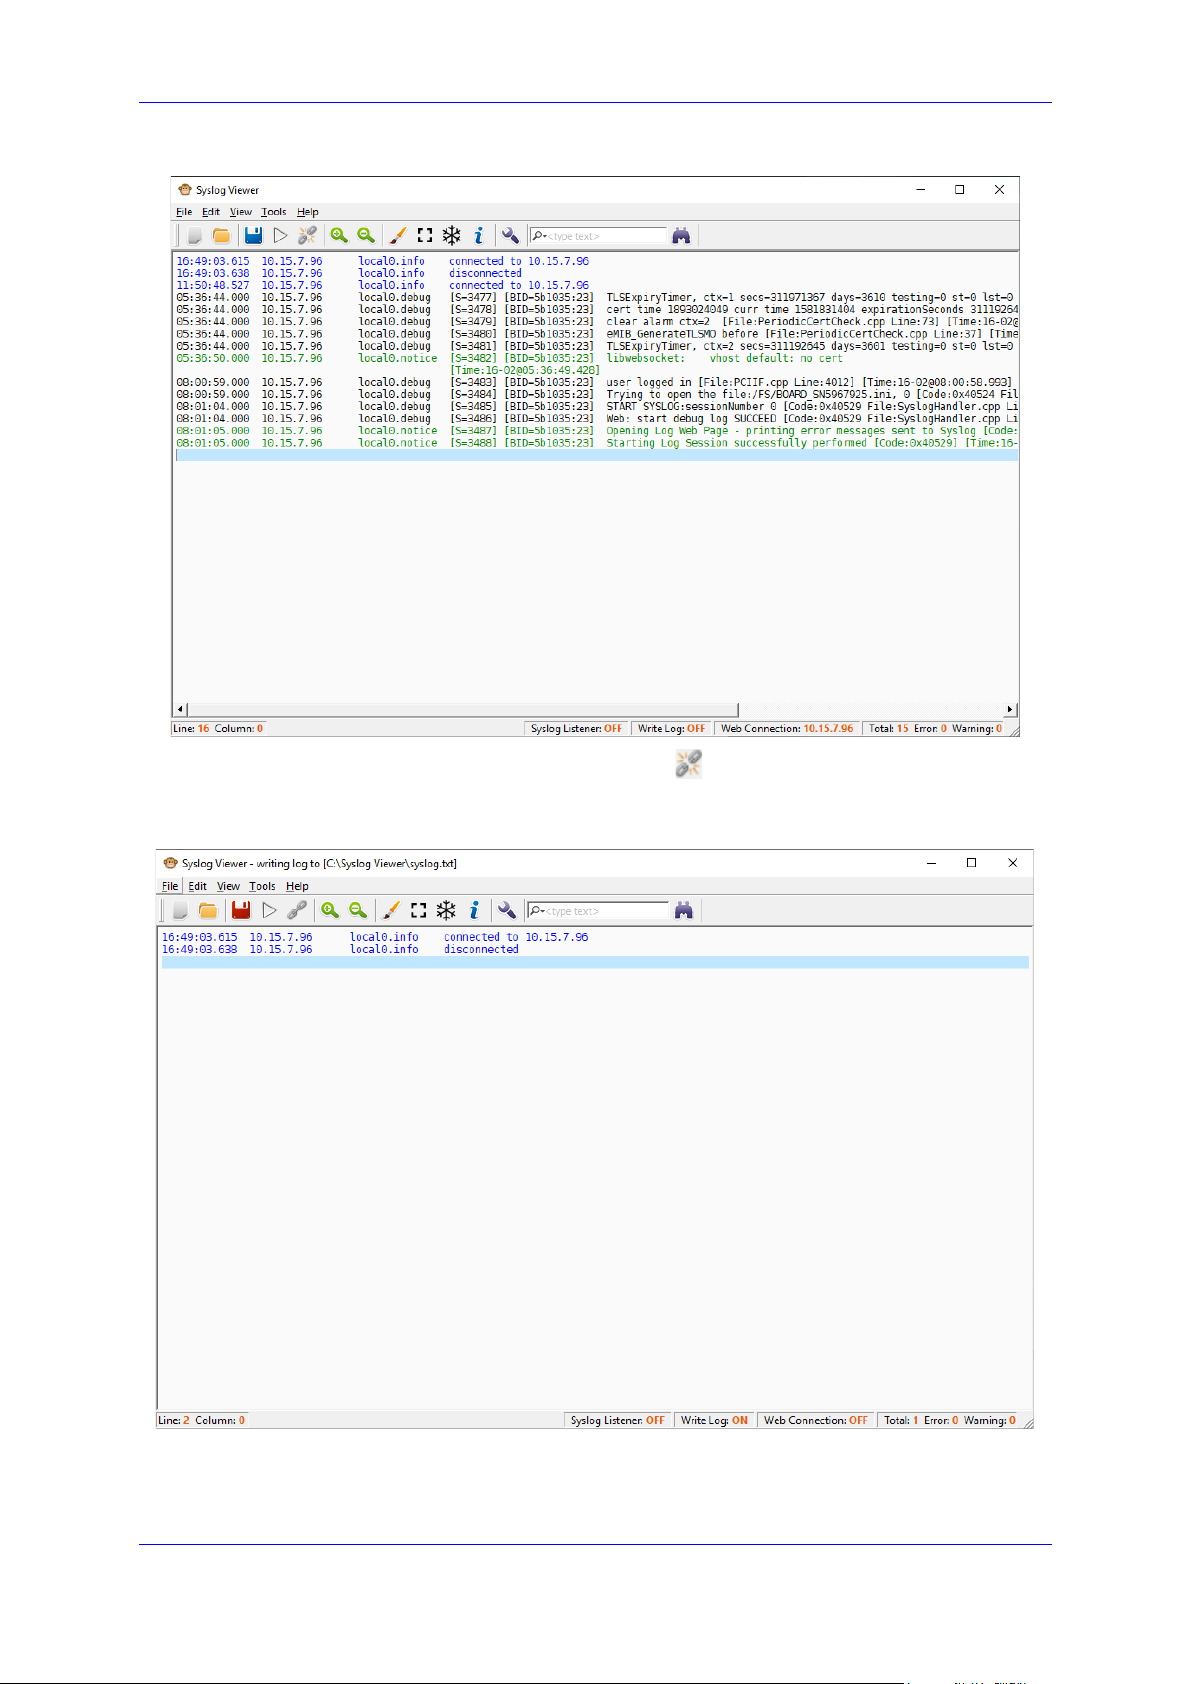
Figure 4-6: Connected Web Interface
4. On the toolbar, use the Disconnect From button or from the File menu, choose
Disconnect From to disconnect from the device.
Figure 4-7: Disconnected Device Connection
Version 1.40 17 Diagnostics and Analysis
Page 18
Syslog Viewer
4.2 Loading Files
The Syslog Viewer can be used to view files saved to the disk. On the toolbar, use the Open
button or from the File menu; choose Open to open a syslog file. Alternatively, you may
drag and drop the file on the utility's main window.
You may also paste logs from the Clipboard via Ctrl-V. Note however that you need to clean
the buffer prior to performing this action.
Note: The "Syslog Listener" will automatically be paused when you open the file.
Files loaded from disk are loaded to the "full view" (i.e. the display is not limited by scroll
buffer). Note however that for large files it may take several seconds to fully load them check that "Total:" counter on the status bar stabilizes to ensure that the file is fully loaded.
4.2.1 Supported File Formats
The Syslog Viewer currently "reads" the following formats:
Native format (as produced by Syslog Viewer)
Legacy format (as produced by ACSyslog)
PCAP files (files will be automatically converted based on .pcap or .pcapng extension;
Wireshark must be installed in %PROGRAMFILES% to enable this functionality)
3rd party syslog format (based on customer inputs)
If the loaded files contain logs from multiple devices, they will be separated into multiple tabs.
You may open multiple instances of Syslog Viewer - e.g. for analyzing multiple files.
4.3 Writing Logs to Disk
Syslog may be recorded on disk and automatically saved to the desired location.
Note: "Write Log" state is persistent. This means that if you close Syslog Viewer while it
is writing the log - it automatically resumes the write process on the next start.
To start writing logs to disk:
On the toolbar, use the Write Log button or from the File menu, choose Write
Log. You are prompted to choose the directory where the logs are stored and under
which name. After you choose the desired location, the save button becomes red ,
and all incoming messages are written to this location.
To stop writing logs to disk:
To stop writing logs, on the toolbar, use the Stop Writing Log button, and it
becomes . If you later click this button, logs are written to the same location. If you
wish to change the location, from the File menu, choose Write Log As.
User's Guide 18 Document #: LTRT-40031
Page 19
User's Guide 4. Getting Started
4.4 Searching for Strings
You can search for specific lines by clicking Find Next on the toolbar or by pressing
Ctrl-F. The search toolbar supports regular expressions and some additional features, click
the drop-down arrow adjacent to the search box to display the options.
4.5 Editing a Line Entry
You can add comments to any syslog line entry.
To edit a line entry
1. From the Edit menu, choose Enable Editing.
2. Place your cursor on the line position where you wish to add text, and then start typing.
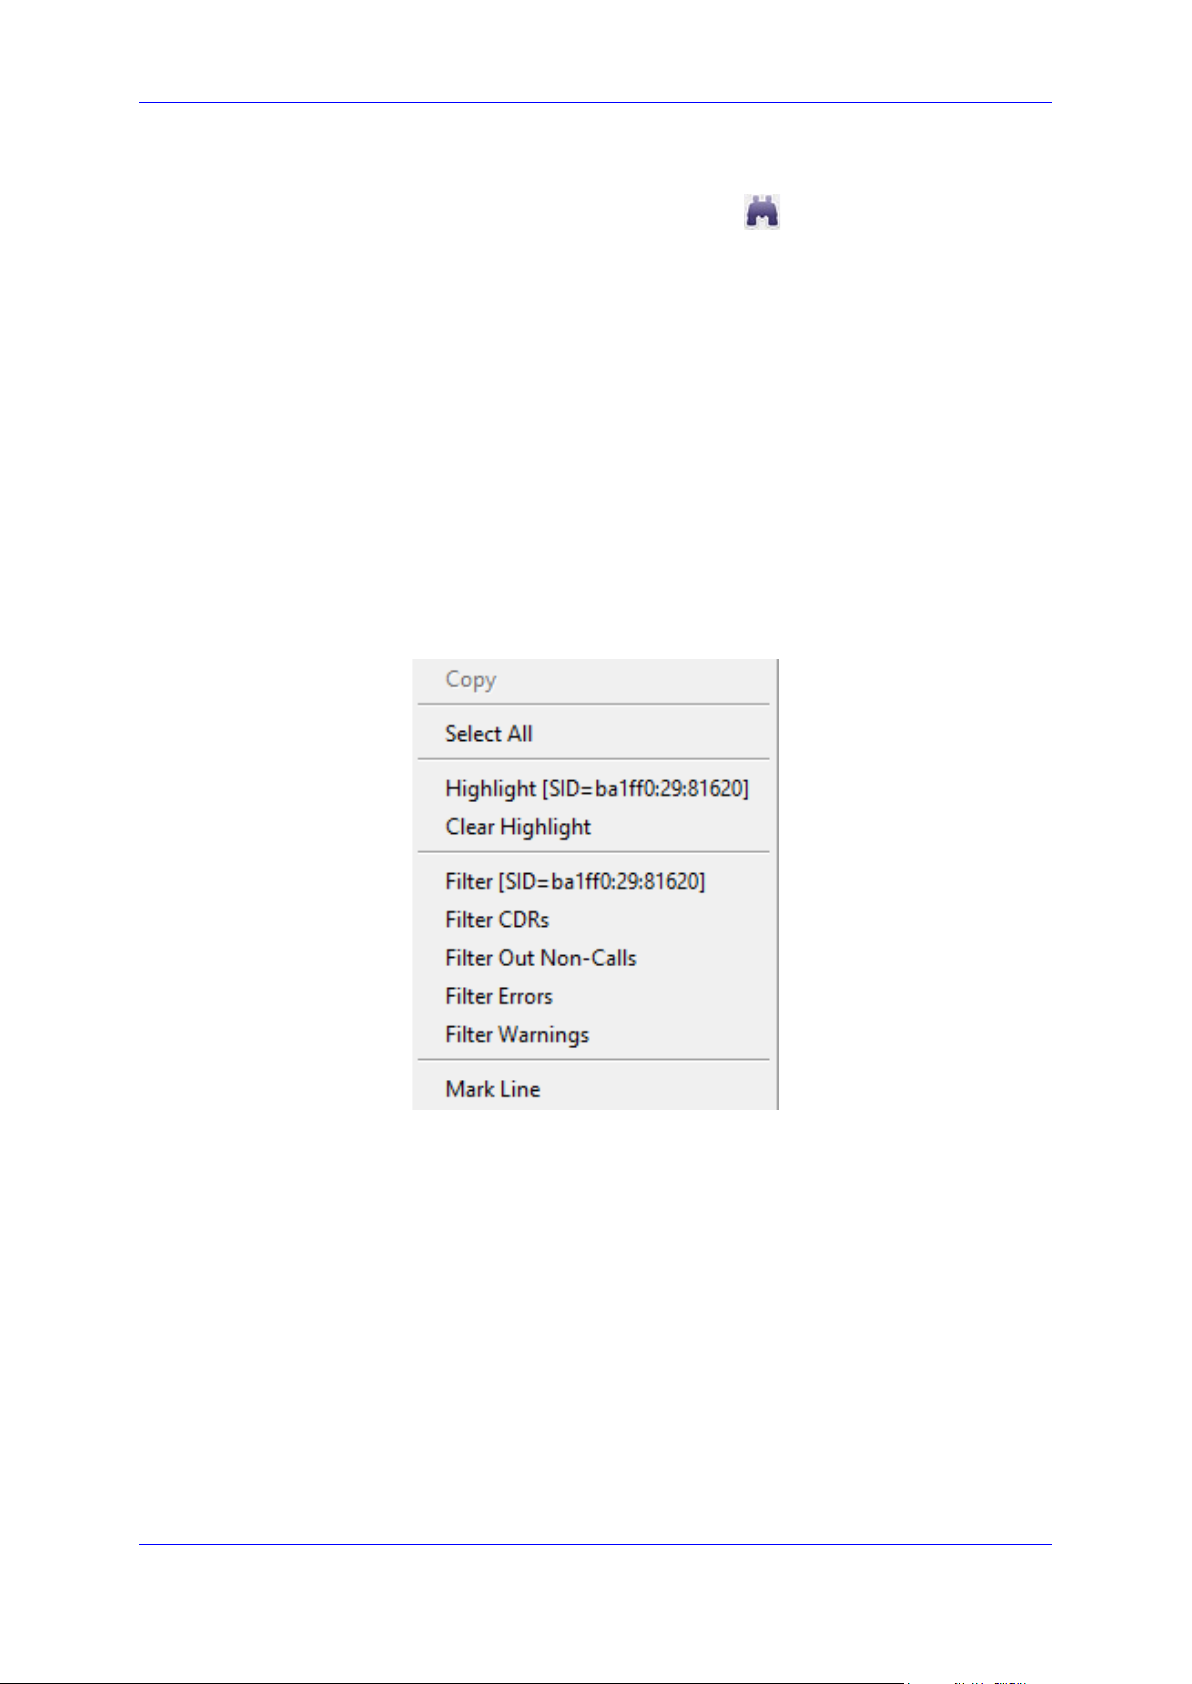
4.6 Filtering Logs
You can use the right-click drop-down menu to filter logs.
Figure 4-8: Filters
Filter with the following options:
Filter according to SID
Filter CDRs
Filter out Non-Calls
Filter Errors and Warnings
Version 1.40 19 Diagnostics and Analysis
Page 20
Syslog Viewer
The filtered output is opened in a new tab. The example below shows filtered CDR records.
Figure 4-9: Filtered CDRs
Figure 4-10: Filtered Non-Calls
User's Guide 20 Document #: LTRT-40031
Page 21
User's Guide 4. Getting Started
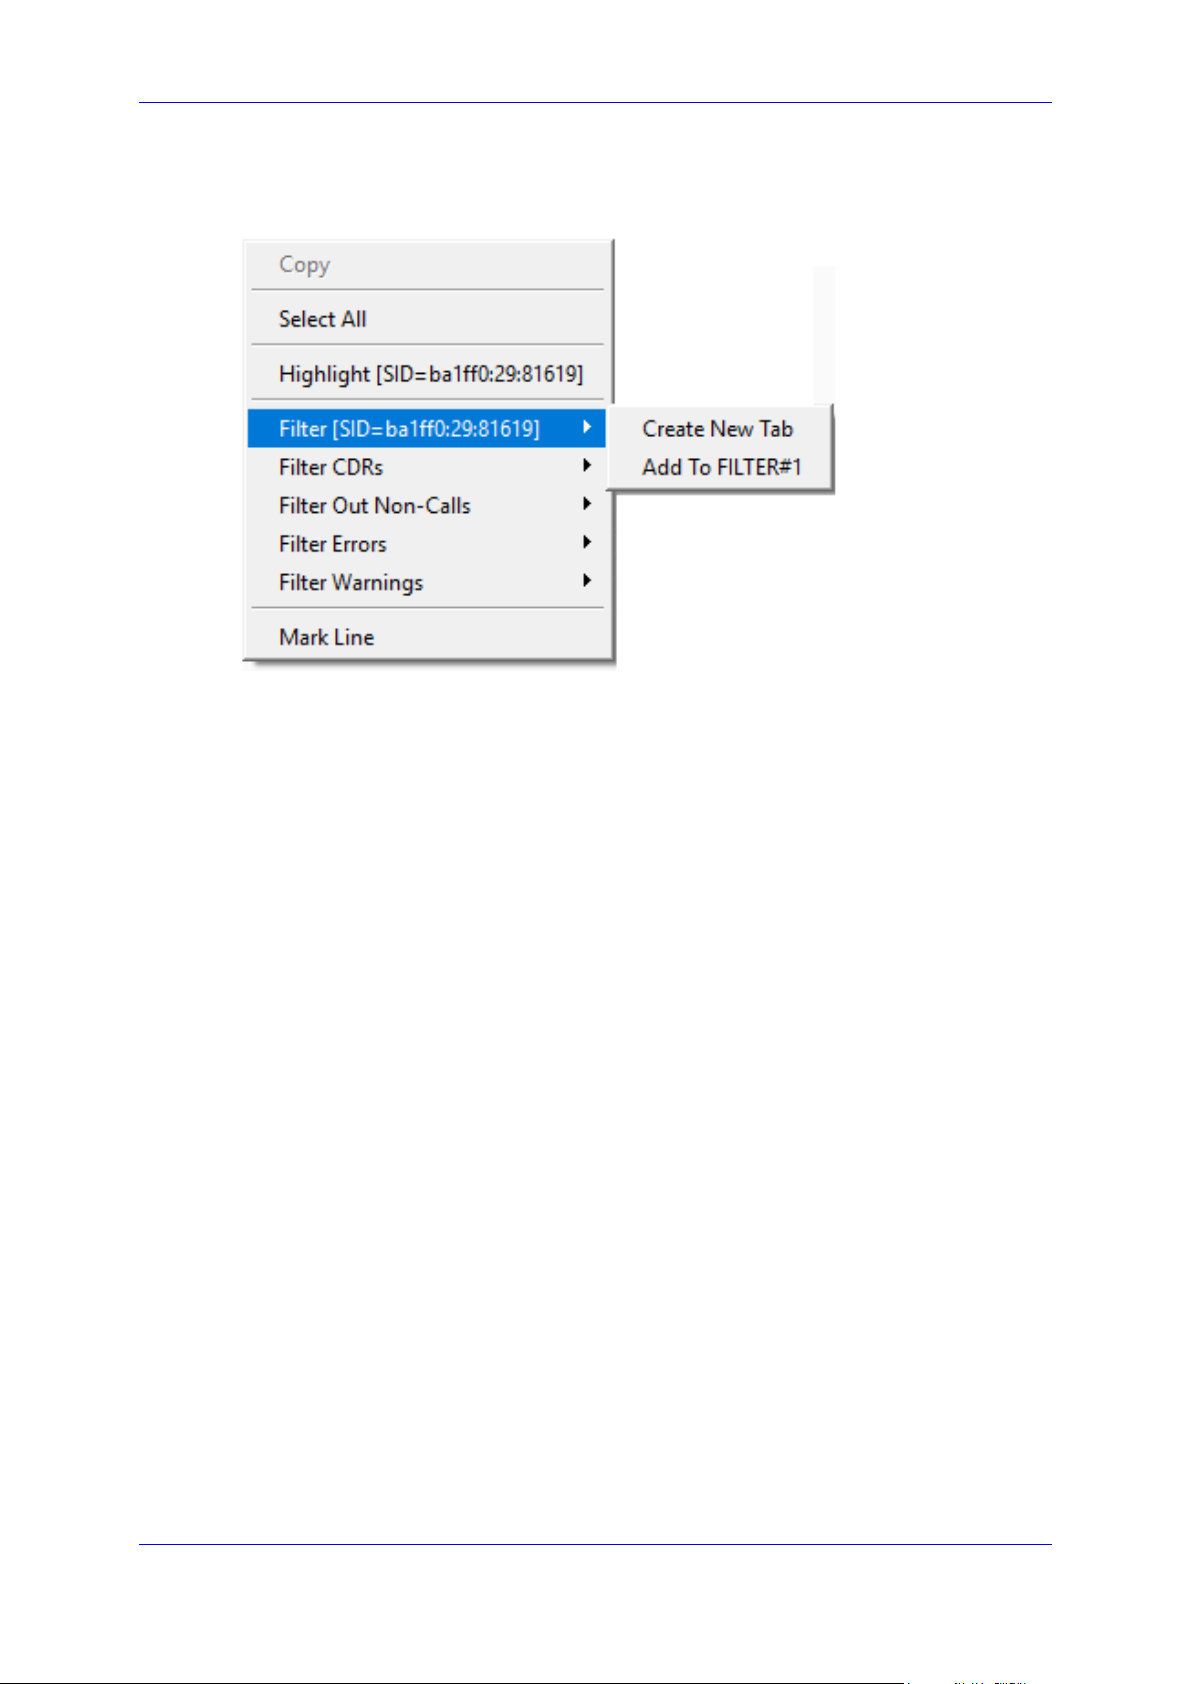
You can add multiple sessions to the same filter tab by choosing Add to FILTER#x tab
option in the drop-down menu.
Figure 4-11: Adding Multiple Sessions to Log Filters
Version 1.40 21 Diagnostics and Analysis
Page 22

Syslog Viewer
4.7 Configuring Syslog Listener
The Syslog Viewer utility starts by default on port 514 and records any incoming syslog
message. You may pause and resume "Syslog Listener" via and buttons
correspondingly. You can change the default port upon which syslog listens (UDP port 514).
To change the listening port and interface:
1. On the toolbar, use the Options button or from the Tools menu, choose Options.
2. In the Syslog pane, from the Syslog interface drop-down list, change the current
interface, and then enter the desired values in either the UDP port and TCP port fields.
4.8 Using the Command Line
You can run syslog Viewer from the command line and write to disk.
To run Syslog Viewer commands:
1. Open a command shell.
2. Change to the directory where the Syslog Viewer is installed.
3. To run the Syslog Viewer:
syslogViewer.exe
4. To open an existing log file:
syslogViewer.exe D:\logs\sbc_lync.txt
5. To write logs to disk:
syslogViewer.exe --writeLog
6. To write logs to disk at specific location:
syslogViewer.exe --writeLog D:\logs\syslog.txt
User's Guide 22 Document #: LTRT-40031
Page 23
User's Guide 5. Analyzing Syslog Messages
5 Analyzing Syslog Messages
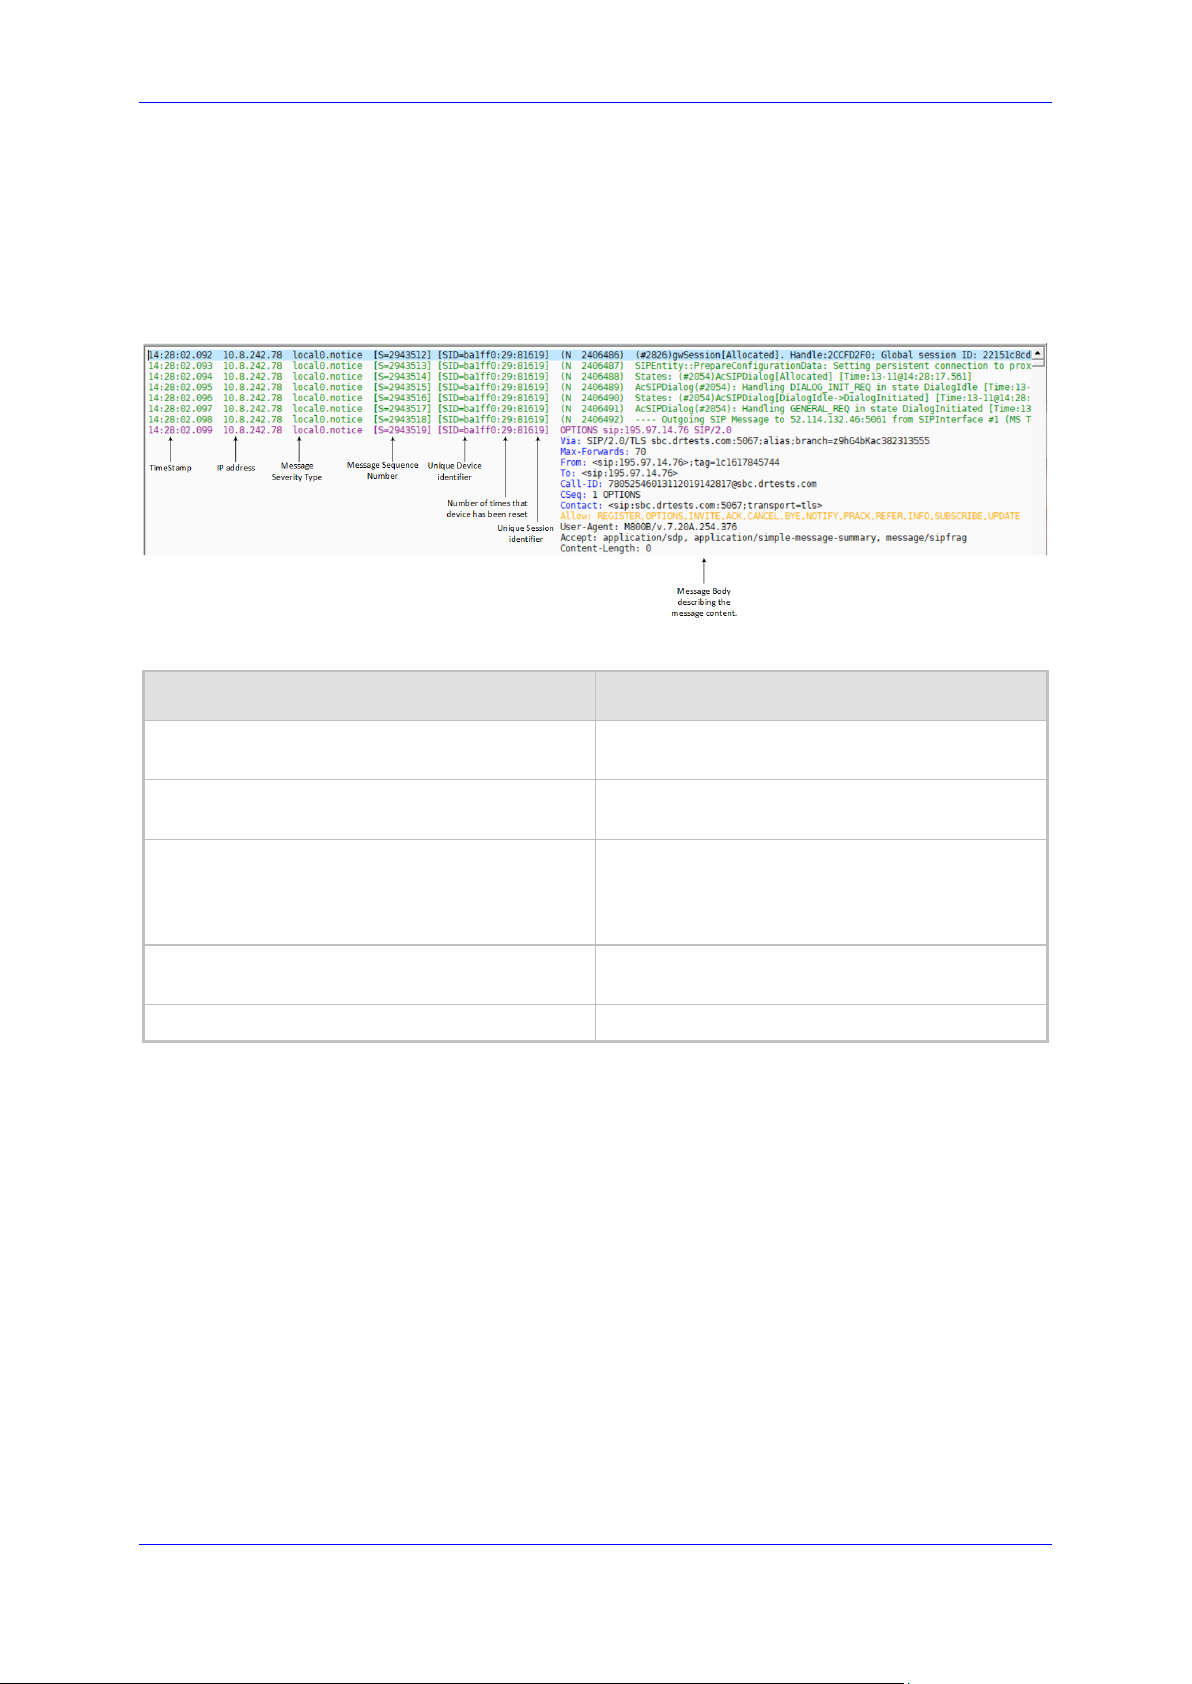
The Syslog message is sent from the device to a Syslog server as an ASCII message. All
Syslog messages are indicated with a sequential number including the time the message
was received and the source IP address. The figure below describes the different types of
information that are displayed in the syslog message.
Figure 5-1: Basic Message Format
Table 5-1: Syslog Message Components
Component Description
Timestamp
IP address Indicates the IP address of the managed
Message Sequence Number Indicates the sequence number of the
Unique SIP Call Session and device identifier Indicates the ID for the call session (MAC
Message Body
Indicates the time that the event was sent to
syslog.
device.
message. This number increments for each
consecutive message that is sent to syslog for
the managed device.
address).
5.1 Syslog Message Types
Syslog sends two types of log messages:
SIP call session logs: Logs relating to call sessions (e.g., call established) (see
Section 0)
Board logs: Logs relating to the operation of the device (infrastructure) that are non-
call session related (e.g., device reset or Web login)
SNMP Alarms: logs including the SNMP information from the alarms raised on the
managed device
Version 1.40 23 Diagnostics and Analysis
Page 24
Syslog Viewer
5.1.1 SIP Call Session Logs
These logs are identified by a session ID ("SID").Example of a SIP-session related Syslog
message:
13:10:57.811 : 10.13.4.12 : NOTICE : [S=235][SID:2ed1c8:96:5]
(lgr_flow)(63) UdpTransportObject#0- Adding socket event for
address 10.33.2.42:5060 [Time: 04-19-2012@18:29:39]
The SID (Session ID) is a unique SIP call session and device identifier for the following types
of SIP calls:
Gateway application: A call session is either a Tel-to-IP or an IP-to-Tel leg, where
each leg is assigned a unique session number
SBC application: A session includes both the outgoing and incoming legs, where
both legs share the same session number
Forked legs and alternative legs share the same session number:
The device identifier facilitates debugging by clearly identifying the specific device that sent
the log message. Unique numbering enables filtering the information (SIP, Syslog, and
media) according to device or session ID
Syntax of the session and device identifiers:
[SID=<last 6 characters of device's MAC address>:<number of times device has
reset>:<unique SID counter indicating the call session; increments consecutively for
each new session; resets to 1 after a device reset>]
Example:
14:32:52.028: 10.33.8.70: NOTICE: [S=9369] [SID=2ed1c8:96:5]
(lgr_psbrdex)(274) recv <-- OFF_HOOK Ch:4
Where:
2ed1c8 is the device's MAC address
96 is the number of times the device has reset
5 is a unique SID session number (in other words, this is the fifth call session since the
last device reset)
Note: For later software versions of Mediant Software and Mediant 9000, instead of MAC
address, the SID contains the serial number.
Example: SIP Message with OPTIONS:
The below shows an event in syslog with SIP message with OPTIONS:
11:36:54.582 10.15.45.49 local0.notice [S=12614840]
[SID=50e91b:74:353424] OPTIONS sip:195.189.192.135 SIP/2.0
Via: SIP/2.0/TLS
sbc11.AUDCTrunk.aceducation.info:5061;alias;branch=z9hG4bKac1026719750
Max-Forwards: 70
From: <sip:195.189.192.135>;tag=1c942573283
To: <sip:195.189.192.135>
Call-ID: 286566002172202093652@sbc11.AUDCTrunk.aceducation.info
CSeq: 1 OPTIONS
Contact: <sip:sbc11.AUDCTrunk.aceducation.info:5061;transport=tls>
User's Guide 24 Document #: LTRT-40031
Page 25
User's Guide 5. Analyzing Syslog Messages
Allow:
REGISTER,OPTIONS,INVITE,ACK,CANCEL,BYE,NOTIFY,PRACK,REFER,INFO,SUBSCRIBE,
UPDATE
User-Agent: M800B/v.7.20A.254.604
Accept: application/sdp, application/simple-message-summary,
message/sipfrag
Content-Length: 0
Example: Outgoing SIP message:
11:36:18.833 10.15.45.49 local0.notice [S=12614761]
[SID=50e91b:74:353422] (N 11900023) ---- Outgoing SIP Message to
52.114.75.24:5061 from SIPInterface #2 (Teams) TLS TO(#206)
SocketID(10518) ---- [Time:17-02@09:36:17.003]
Example: successful classification of an IP Group entity:
11:36:18.949 10.15.45.49 local0.notice [S=12614774]
[SID=50e91b:74:353423] (N 11900034) Classification Succeeded - Source
IP Group #2 (Teams) [Time:17-02@09:36:17.093]
5.1.2 Board Logs
These logs are identified by a board ID ("BID"). Example of a board Syslog message:
10:21:28.037 : 10.15.7.95 : NOTICE : [S=872] [BID=3aad56:32]
Activity Log: WEB: Successful login at 10.15.7.95:80. User: Admin.
Session: HTTP (10.13.22.54)
Unique non-SIP session related (e.g., device reset or a Trunk alarm) and device identifier
The device identifier facilitates debugging by clearly identifying the specific device that sent
the log message, especially useful in deployments consisting of multiple devices
In addition, the benefit of unique numbering is that it enables you to filter the information
according to device
Syntax of the BID:
[BID=<last 6 characters in MAC>:<number of times device has reset>]
Example:
14:32:52.062: 10.33.8.70: WARNING: [S=9399] [BID=2ed1c8:96] invalid Physical index
Where:
2ed1c8 is the device's MAC address.
96 is the number of times the device has reset.
Note: For later software versions of Mediant Software and Mediant 9000, instead of MAC
address, the BID contains the serial number.
Example: Event in syslog indicating a TLS socket debug message:
11:36:55.220 10.15.45.49 local0.notice [S=12614860] [BID=50e91b:74]
(N 11900116) TLSSocketAPI(#67) Socket debug message:
CTcpClientSocket::HandleSocketEvent socket close/resetSocketName:
SIPTcpChild, FileDesc: 75 [Time:17-02@09:36:
Version 1.40 25 Diagnostics and Analysis
Page 26

Syslog Viewer
5.1.3 SNMP Alarms
SNMP alerts are sent to the Syslog server using the following formats:
Raised Alarms:
RAISE-ALARM: <Alarm Name>; Textual Description: <Textual Description>;
Severity <Alarm Severity>; Source <Alarm Source>; Unique ID: <Alarm
Unique ID >
Cleared Alarms:
CLEAR-ALARM: <Alarm Name>; Textual Description: <Textual Description>;
Severity <Alarm Severity>; Source <Alarm Source>; Unique ID: <Alarm
Unique ID >
If additional information exists in the alarm, then these are also added as:
Additional Info1:/Additional Info2:/ Additional Info3
SNMP Alarm’s Severity:
• Critical
• Major
• Minor
• Warning
• Indeterminate
• Cleared
The following shows an example of an alarm sent when a device is reset.
Figure 5-2: Reset Alarm
User's Guide 26 Document #: LTRT-40031
Page 27

User's Guide 6. Analyzing Calls with SIP Ladder (Call Flow)
iagram currently supports the following call flows: Mediant SBCs,
6 Analyzing Calls with SIP Ladder (Call
Flow)
You can view the SIP call flow of a specific call in a diagram referred to as a SIP ladder. This
is very useful for analyzing the SIP messages of the call.
Note: SIP Flow d
Mediant Gateways (analog and digital), SmartTAP 360° and IP Phones.
To analyze the collected logs:
1. After collecting the call logs, use the SIP Flow Diagram feature; on the toolbar, use the
SIP Flow Diagram button or from the Tools menu, choose SIP Flow Diagram to
display a ladder diagram of the SIP call.
2. Click the call to display its SIP ladder diagram. Click the message in the SIP ladder
diagram to display its content.
Figure 6-1: SIP Flow (Ladder) Diagrams
3. Use the main Syslog Viewer screen to view additional logs sent by the SBC; these may
help you to identify the root cause of the problem.
• The top-right pane contains list of all sessions found in the current display buffer.
For each session useful summary information is displayed. The session that
corresponds to the line where the "main window" cursor is positioned will be
selected by default. Click on a row to switch between sessions.
• The bottom-right pane contains the details of the currently selected message.
• The left pane contains the ladder diagram. Click on one of the SIP messages in
the ladder. Note that when you select a specific message, the "message details"
pane is updated and the cursor in the "main window" is re-positioned on a line
that corresponds to the selected message, which you can then jump to it for more
details).
• Use the navigation keys and to jump between SIP
messages
• Use the Find key to search for a specific message.
Version 1.40 27 Diagnostics and Analysis
Page 28

Syslog Viewer
• Use the Export key to export sessions to a CSV file and to export the
SIP Ladder to text file.
• Select the CDR tab to display the Call Data Records for the call.
Figure 6-2: Call Detail Record (CDR)
Note: You can disable the parsing of CDR records in the Settings screen (on the toolbar,
use the Options button or from the Tools menu, choose Options, and then deselect
the “Parse CDR records” check box.
When a Syslog includes multiple calls, you can select the call whose details you wish to view.
The figure below shows multiple calls for a PSTN gateway log.
User's Guide 28 Document #: LTRT-40031
Page 29

User's Guide 6. Analyzing Calls with SIP Ladder (Call Flow)
Figure 6-3: Multiple Calls for PSTN Gateway
Version 1.40 29 Diagnostics and Analysis
Page 30

Syslog Viewer
This page is intentionally left blank.
User's Guide 30 Document #: LTRT-40031
Page 31

User's Guide 7. Configuring Display Settings
7 Configuring Display Settings
This section describes the global configuration settings for the Syslog Viewer.
7.1 Changing the Scroll Buffer Default
The Scroll buffer is by default set to 10,000 lines (lines of scroll back). You may increase it
to up to 100,000 lines with the consideration that a longer buffer adversely affects
performance. Total counters in the bottom right corner display total statistics for this utility
output; the total data statistics may be greater than what is actually shown on the screen,
which is acceptable.
To clean the scroll buffer:
On the toolbar, use the Clean button or from the File menu, choose Clean.
7.2 Rotating Log Files
Syslog Viewer automatically performs file rotation according to the size of the log and the
number of log files. Rotated (old) files have a sequential index inserted between the filename
and the suffix - e.g. "C:\syslog_0002.txt".
If "Log File Size" is 0, the current log file grows endlessly i.e. it is never rotated. If "Log File
Count" is 0, rotation is performed endlessly, where a timestamp is used instead of a
sequential index - e.g. "C:\syslog_2015-09-03_10-12-01-134.txt".
Note: The current file is always exactly the name that you specified - e.g. "C:\syslog.txt".
This is similar to the file rotation mechanism on Linux platform; however, different to the
AC Syslog implementation.
To configure log file rotation:
1. On the toolbar, use the Options button or from the Tools menu, choose Options.
2. In the Log File pane, set the ‘File size (Mbytes)’ parameter and ‘number of files’
parameter.
7.3 Freezing Display
If you wish to prevent new messages from being added to the screen without affecting the
writing of messages to disk, on the toolbar, use the Freeze Display button or from the
Tools menu, choose Freeze Display.
7.4 Disabling Auto-Scroll
If you wish to keep adding messages to the screen; however, disable auto-scroll, on the
toolbar, use the Disable Auto Scroll button or from the Tools menu, choose Disable
Auto Scroll. The auto-scroll functionality is disabled, unless the cursor is positioned on the
last buffer line.
Version 1.40 31 Diagnostics and Analysis
Page 32

Syslog Viewer
7.5 Saving Captured Buffer
To save the "displayed buffer" to disk, from the File menu, choose Save As.
You may also enable buffer editing via to remove unwanted lines prior to saving them to disk.
From the Edit menu, choose Enable Editing.
7.6 Configuring External Editor
You can open the currently displayed buffer in an external editor (text file); on the toolbar,
use the button or from the Tools menu, choose External Viewer to set the path to the
executable file to the desired editor.
To configure the path of the external editor executable file:
1. On the toolbar, use the Options button or from the Tools menu, choose Options.
2. In the Miscellaneous pane, click the Browse button to browse to the location of the
executable file for the external editor e.g. Notepad.exe.
7.7 Detecting Missing and Out-Of-Order Logs
The Syslog viewer keeps track of sequence numbers for incoming syslog messages and
produces "syslog.error" errors when missing or out-of-order messages are detected, for
example:
12:45:49.057 10.4.219.224 syslog.error 10 messages are missing
It also automatically handles packet reorder. In order to perform this action, a variation of
jitter buffer algorithm is implemented. This operation should function smoothly, except for the
very first few messages from the specific source.
If, for any reason, you expect this code may cause performance problems, deselect the
check box “Compensate for packet reorder”.
To disable the packet recorder compensation mechanism:
1. On the toolbar, use the Options button or from the Tools menu, choose Options.
2. In the Syslog pane, deselect the ‘Compensate for packet recorder’ check box.
7.8 Filtering Incoming Traffic
You can black list IP sources and specific messages. Content filters support RegEx matches.
For example, you may match multiple lines via "pattern1|pattern2". Note the difference
between the two available content filters:
Receive filter - applied to received syslog messages; affects both displayed data and
content written to the log files.
Display filter - affects displayed data only; applied to loaded files as well.
To filter incoming traffic:
1. On the toolbar, use the Options button or from the Tools menu, choose Options.
2. In the IP Filter pane, select the “Filter incoming traffic” check box.
3. In the “allowed IP addresses” field, enter the IP addresses that you wish to permit.
4. In the “blocked IP addresses” field, enter the IP addresses that you wish to block.
User's Guide 32 Document #: LTRT-40031
Page 33
User's Guide 7. Configuring Display Settings
7.9 Coloring and Formatting
Syslog messages are auto-formatted for easy reading of SIP messages and colored based
on message severity. Warnings and errors are displayed in magenta and red
correspondingly.
You may also define custom highlight keywords (with RegExp match)
Note: For performance reasons, this utility uses "text editor" UI widget, rather than table
format with columns like was the case for ACSyslog and in addition, you cannot select
multiple lines.
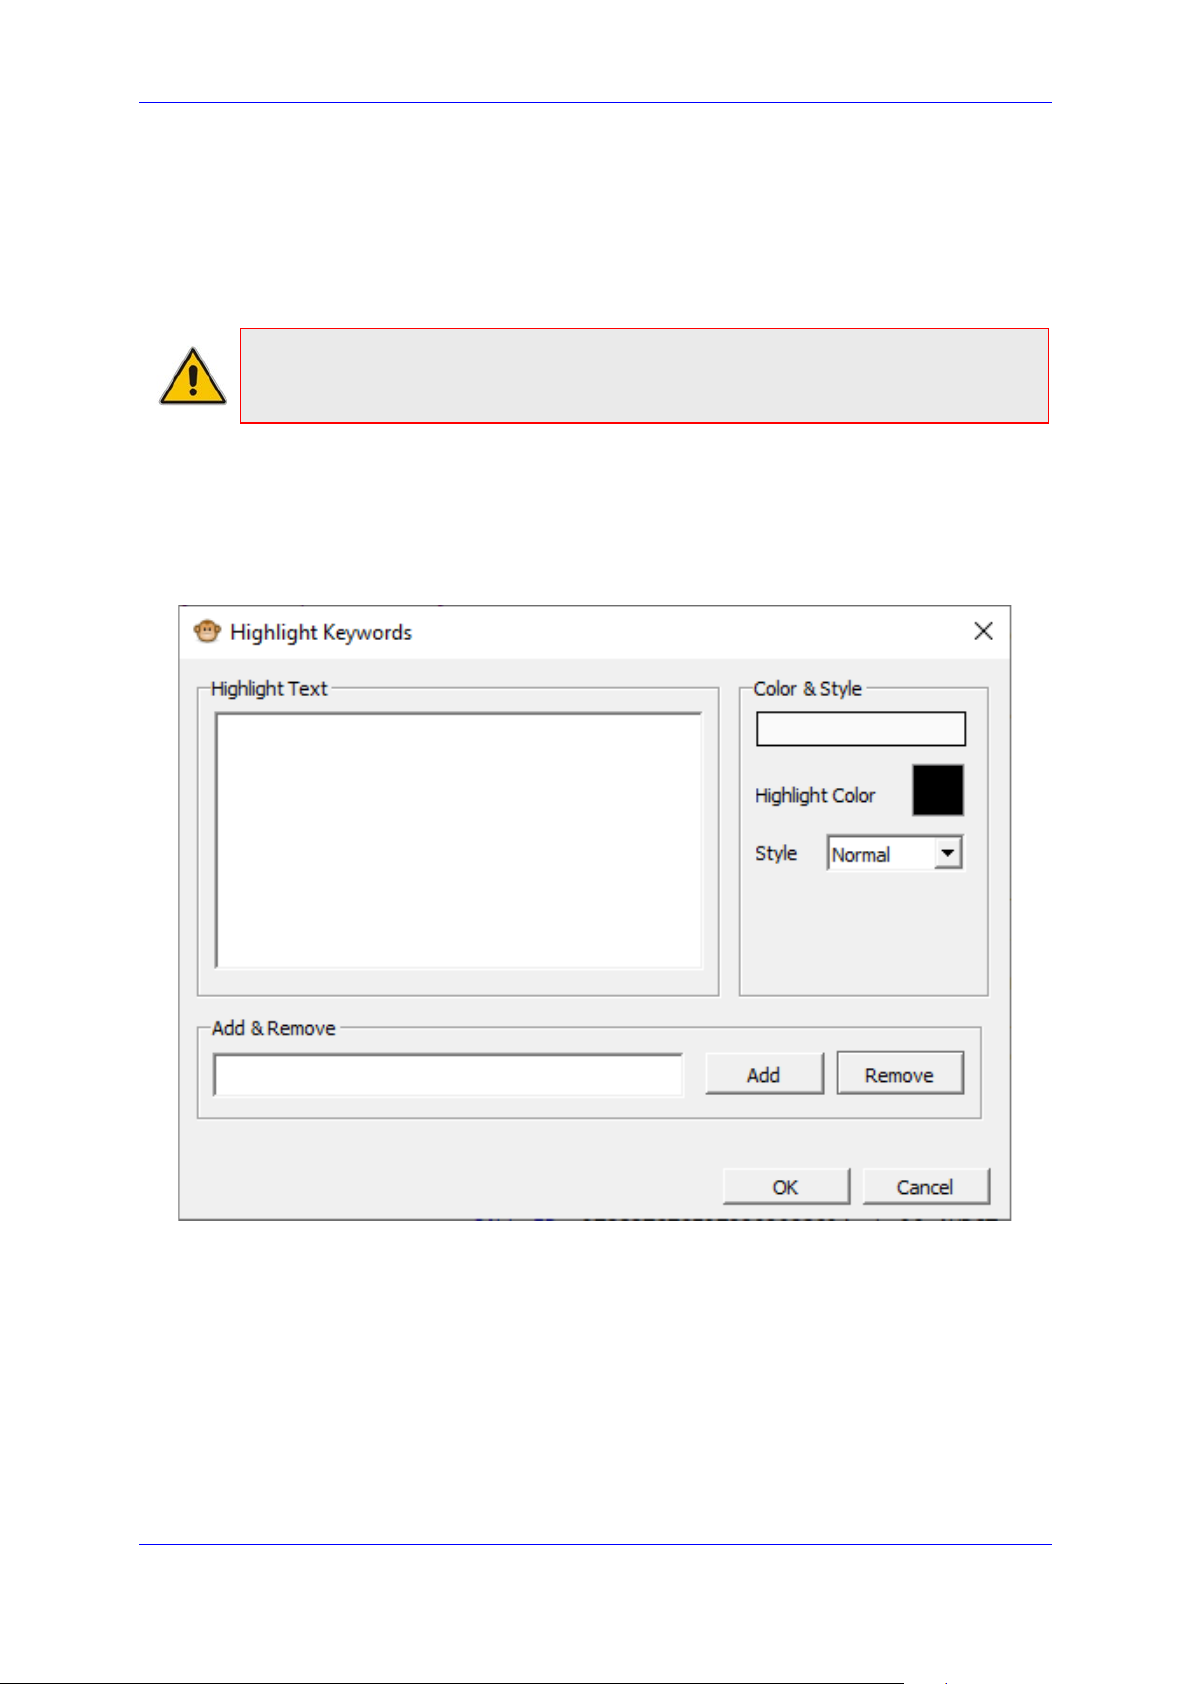
To format keywords in a text file:
1. From the Tools menu, choose Highlight Keywords.
2. In the Add & Remove text box, enter the text string that you wish to highlight (note that
the string is case-sensitive), and then click Add.
Figure 7-1: Highlight Keywords
The text appears in the “Highlight Text” box.
Version 1.40 33 Diagnostics and Analysis
Page 34
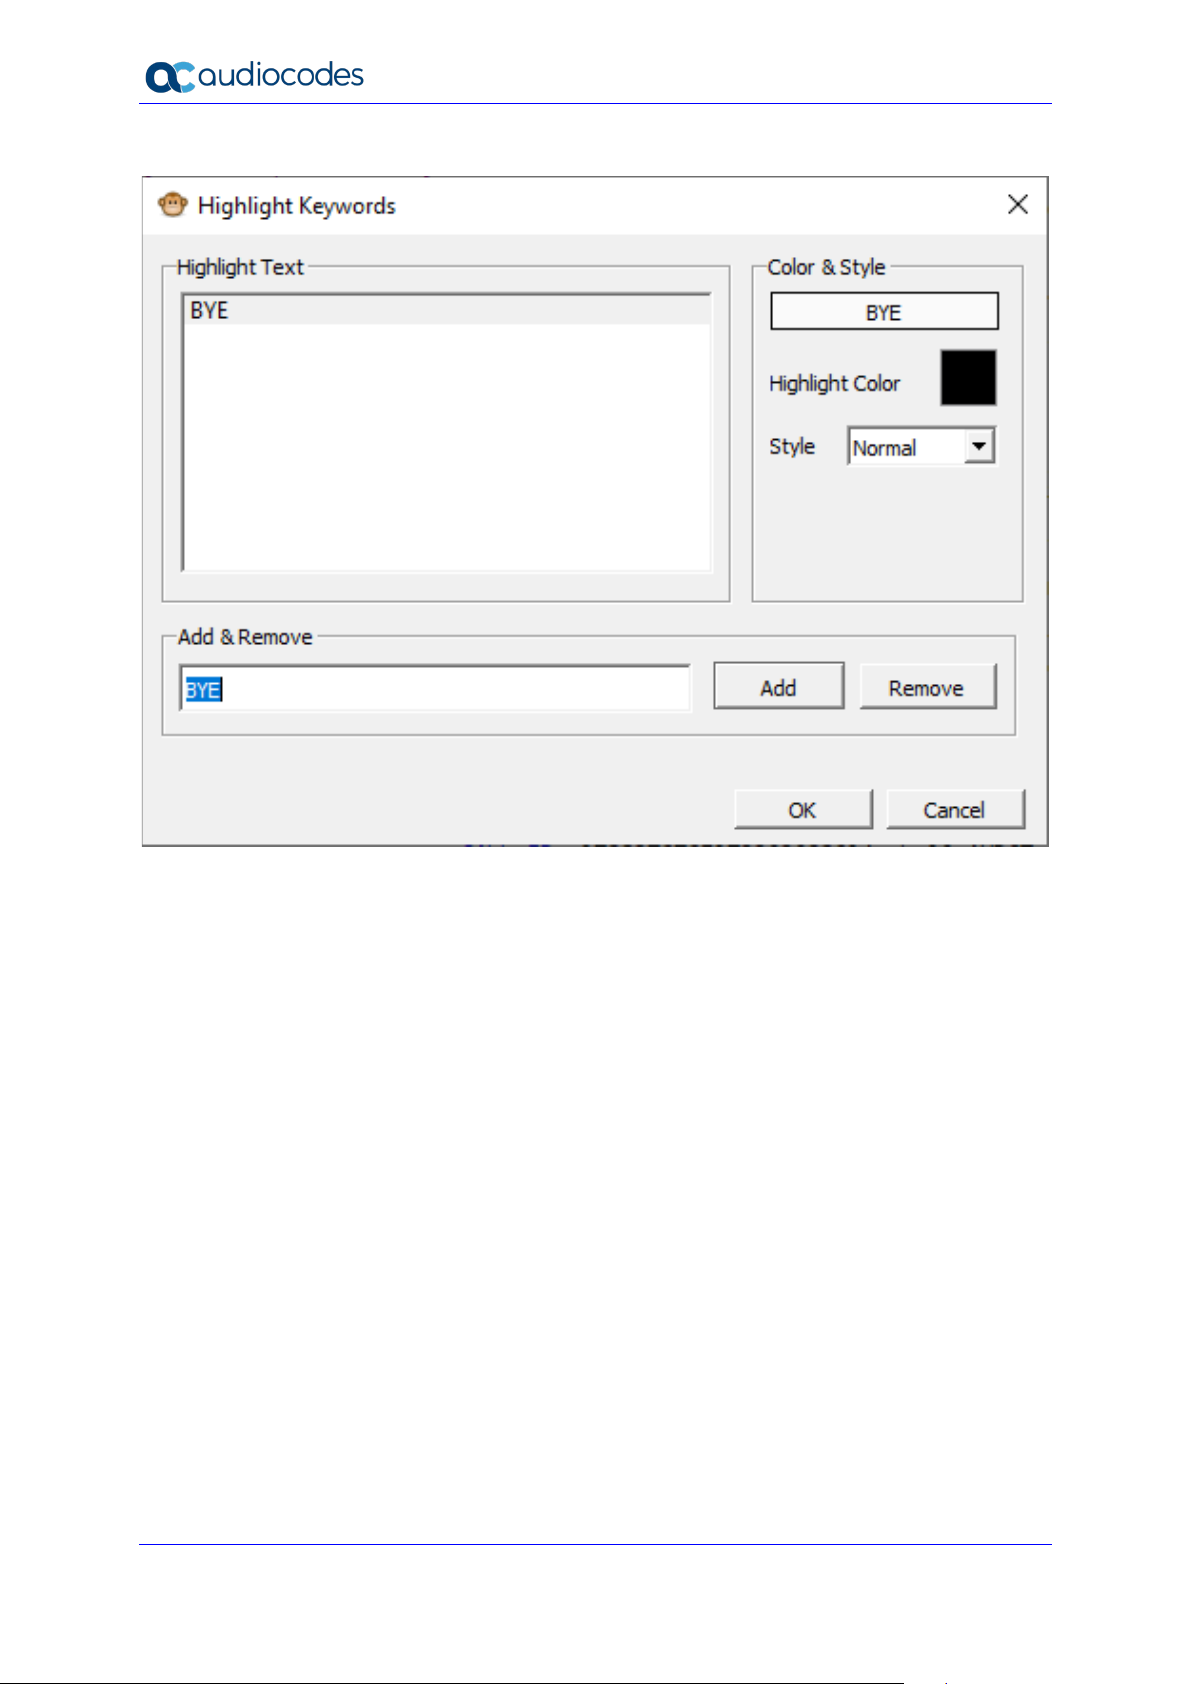
Syslog Viewer
Figure 7-2: Selected Text String
3. Select the entry, click the Highlight Color pallet, choose the desired color, and then click
OK.
Each line containing the text string appears in the chosen color. In the example below,
the string “BYE” appears in orange.
User's Guide 34 Document #: LTRT-40031
Page 35
User's Guide 7. Configuring Display Settings
Figure 7-3: Example Colored Keyword
7.9.1 Saving Window Position
You can save the window position so that utility restores to the same size/position on the
next start.
To save the window position:
1. On the toolbar, use the Options button or from the Tools menu, choose Options.
2. In the Viewer pane, select the ‘Save Window Position’ check box.
7.9.2 Configuring Font Type
You may change the font for the output display to your preference; however, its best to use
Monospaced fonts. The default font is ‘Bitstream Vera Sans Mono’.
To change the display font:
1. On the toolbar, use the Options button or from the Tools menu, choose Options.
2. In the Viewer pane, click to open the drop-down list, and then select the desired font.
Version 1.40 35 Diagnostics and Analysis
Page 36

Syslog Viewer
This page is intentionally left blank.
User's Guide 36 Document #: LTRT-40031
Page 37

User's Guide A. Syslog Error Abbreviations
A Syslog Error Abbreviations
The table below illustrates the error abbreviations that are used in the syslog error text.
Table A-1: Syslog Error Abbreviations
Error
Abbreviation
AA Invalid Accumulated Packets Counter
AC Invalid Channel ID
AL Invalid Header Length
AO Invalid Codec Type
AP Unknown Aggregation Payload Type
AR Invalid Routing Flag Received
AT Simple Aggregation Packets Lost
CC Command Checksum Error
CE Invalid Cell Coder Code
CS Command Sequence Error
Error Name Description
ES 8 sec Timeout Before Disconnect
HO Host Received Overrun
IA Invalid AMR Payload
IC Invalid CID Error
IG Invalid G723 Code
IP Invalid payload length
IR Invalid RTCP Packet
IS Invalid SID Length
LC Transmitter Received Illegal Command
LF Lost Fax Frames In High Speed Mode
LM Lost Modem Frames In High Speed Mode
MI Misalignment Error
Version 1.40 37 Diagnostics and Analysis
Page 38

Syslog Viewer
Error
Abbreviation
MR Modem Relay Is Not Supported
PD RTP Packet Duplicated
OR DSP JB Overrun
PH Packet Header Error
PL RTP Packet Loss
RB Counts the number of BFI Frames Received From The Host
RD No Available Release Descriptor
RO RTP Reorder
RP Unknown RTP Payload Type
RS RTP SSRC Error
Error Name Description
UF Unrecognized Fax Relay Command
User's Guide 38 Document #: LTRT-40031
Page 39

User's Guide B. Message Severity Levels
B Message Severity Levels
The following table shows the type of syslog messages that are generated based on
message severity.
Table B-1: Message Severity Levels
Severity Level
(Highest to
Lowest)
Fatal emergency (red) A panic condition (system is unstable)
Alert alert (red)
Critical critical (red) A problem has been identified that is critical
Error error (red) An error has been identified
Warning warning (magenta)
Notice notice (dark green) An unusual event has occurred
Informational info (blue) An operational message
Syslog String (displayed
color in the web
interface)
Description
A problem has been identified and an action
must be taken immediately
An error that might occur if measures are
not taken to prevent it
Debug debug (black) Debug message
Version 1.40 39 Diagnostics and Analysis
Page 40

International Headquarters
1 Hayarden Street,
Airport City
Lod 7019900, Israel
Tel: +972-3-976-4000
Fax: +972-3-976-4040
AudioCodes Inc.
200 Cottontail Lane
Suite A101E
Somerset NJ 08873
Tel: +1-732-469-0880
Fax: +1-732-469-2298
Contact us: https://www.audiocodes.com/corporate/offices-worldwide
Website:
©2020 AudioCodes Ltd. All rights reserved. AudioCodes, AC, HD VoIP, HD VoIP Sounds Better, IPmedia, Mediant,
MediaPack, What’s Inside Matters, OSN, SmartTAP, User Management Pack, VMAS, VoIPerfect, VoIPerfectHD, Your
Gateway To VoIP, 3GX, VocaNom, AudioCodes One Voice, AudioCodes Meeting Insights, AudioCodes Room
Experience and CloudBond are trademarks or registered trademarks of AudioCodes Limited. All other products or
trademarks are property of their respective owners. Product specifications are subject to change without notice.
https://www.audiocodes.com/
Document #: LTRT-40031
 Loading...