

Page 1
TA320
SPECIFICATIONS
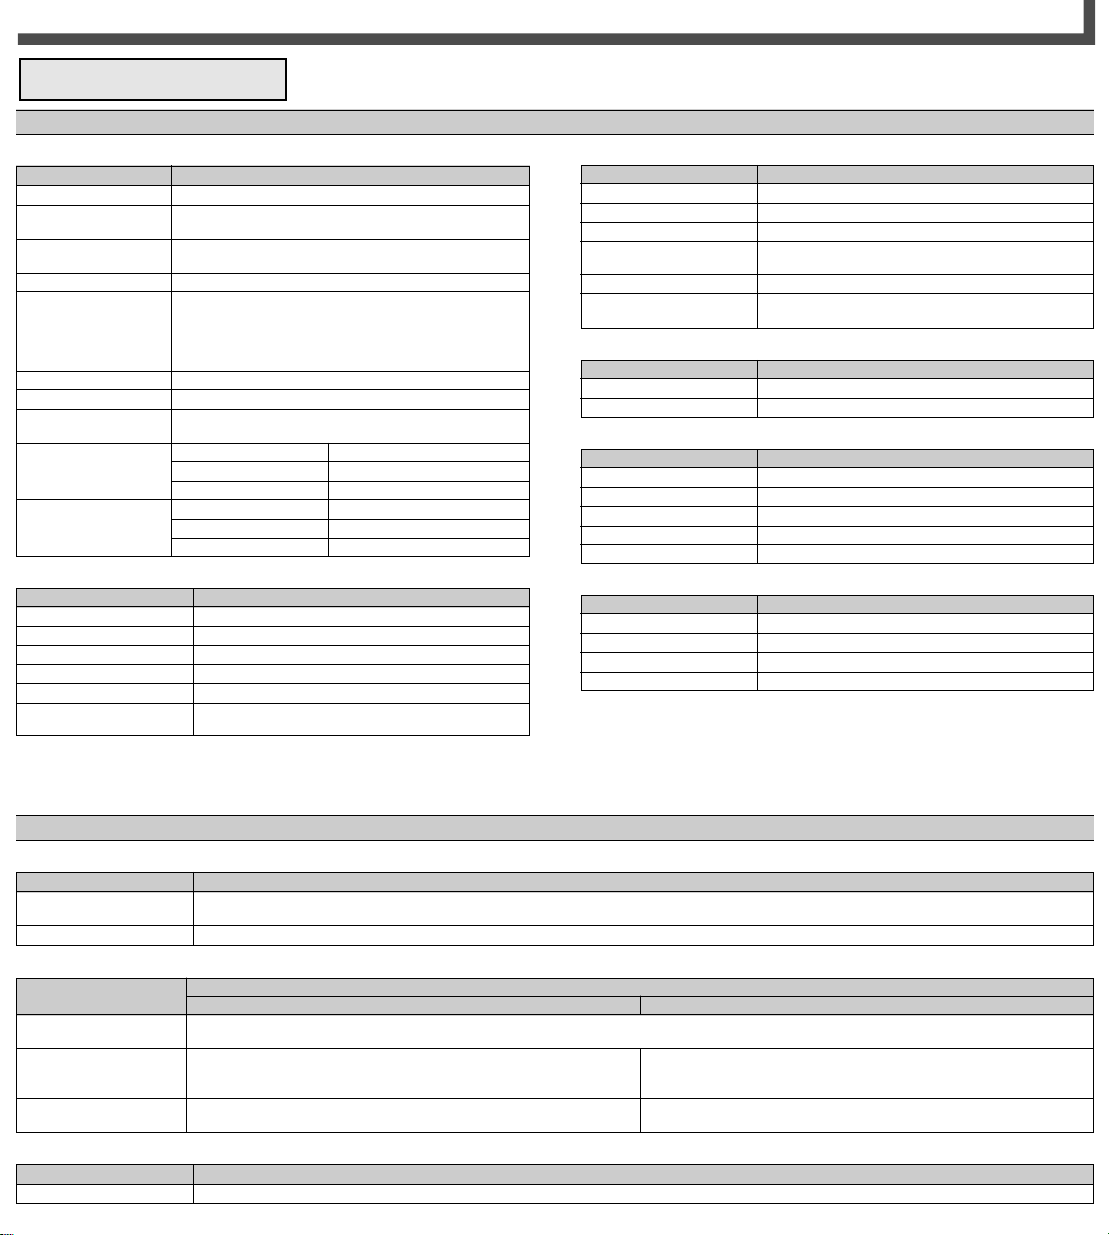
Specifications Related to Inputs/Outputs
● Inputs to A and B Channels
Item
1
Input impedance*
Frequency characteristics
1
(-3 dB)*
Input coupling
Operating voltage range
Maximum input voltage
Amplifier noise*
Sensitivity
Minimum input pulse
width
Trigger level
50 Ω /1 MΩ (input capacitance: 20 pF)
100 MHz
DC/AC (input impedance: 1 MΩ: cutoff frequency 35 Hz;
–5 to + 5 V
50 Ω: 5 Vrms
1 MΩ: 40 V (DC + ACpeak)
1
400 µVrms
100 mVp-p
10 ns
Voltage rangesetting
Accuracy *
2
Resolution
Auto trigger
Input signal condition
Method
Setpoint time*
● External Arming Input (the terminal is shared by external gating inputs)
Item
Impedance*
Coupling
Trigger level
Maximum voltage range
Minimum input pulse width
Setup time
1
10 kΩ
DC
TTL
–8 to +13 V (DC+ ACpeak)
30 ns
70 ns (In order for arming input to be valid, it must
precede the measured signal by no less than 70 ns.)
Specifications
: 50 Ω: cutoff frequency 680 kHz)
(DC ≤ input frequency ≤ 100 kHz)
3.5/f (MHz) + 5 V (DC + ACpeak)
(100 kHz < input frequency ≤ 100 MHz)
+5 to –5 V
±(10 mV + 4% of setpoint)
5 mV
1 kHz to 50 MHz
1
Singe/Repeat
0.7 s
Specifications
● External Inhibit Input
Item
Input impedance*
1
Input coupling
Trigger level
Maximum input voltage
range
Minimum input pulse width
Setup time
10 kΩ
DC
TTL
–8 to +13 V (DC + ACpeak)
30 ns
70 ns (In order for inhibit input to be valid, it must
precede the measured signal by no less than 70 ns.)
Specifications
● Monitor Outputs A and B
Outputs impedance*
Item
Outputs signal level*
1
50 Ω
3
Approximately 1/4 of the input signal (within ±5 V)
Specifications
● Reference Input
Frequency range
Item
Impedance
Coupling
Voltage level
Maximum voltage range
10 MHz ± 10 Hz
1 kΩ min.
AC
1 Vp-p min.
–10 to + 10 V
Specifications
● Reference Output
Item
Frequency*
Impedance*
Coupling
Voltage level*
Note: All inputs are diode-protected and terminal grounds are connected to the
1
: Typical value.
*
*2: The value when the warm-up time has expired under the reference operating
3
: The value when the output is received into 50 Ω at a 1 MΩ input impedance.
*
1
1
1
10 MHz
50 Ω min.
AC
1 Vp-p min.
enclosure’s ground.
conditon with the coupling and input impedance set at DC and 1 MΩ, respectively.
Specifications
Specifications Related to Measurement
● Sampling Modes
Time stamp mode
Hardware histogram mode
● Sampling
Maximum sampling rate
Sampling period
Maximum sample size
● Measurement Refresh Rate (hardware histogram mode only)
Refresh rate*
Item
Item
Item
1, *2
Acquires measurements along with “time stamp” data, which represent the time that the respective measurements occurred, to record a set of these
data as time-series data.
Records measurements as the frequency data for a histogram.
Time stamp mode
7 M samples/s (142-ns intervals) in the case of phase difference and duty ratio measurements
MIN (71ns)
1, 2, 4, 10, 20, 40, 100, 200, 400 µs, 1, 2, 4 ms.
The total sampling time is 320 seconds, including the time for arming.
Duty ratio and phase difference measurements: 16,000 samples
Other emasurements: 32,000 samples
Specifications
Specifications
Continuous 14 M samples/s (71-ns intervals);
The total sampling time is 320 seconds.
99,999,999 samples, (10
excluding duty ratio and phase difference measurements
Specifications
400 ms
Hardware histogram mode
8
-1)
Page 2
TA320
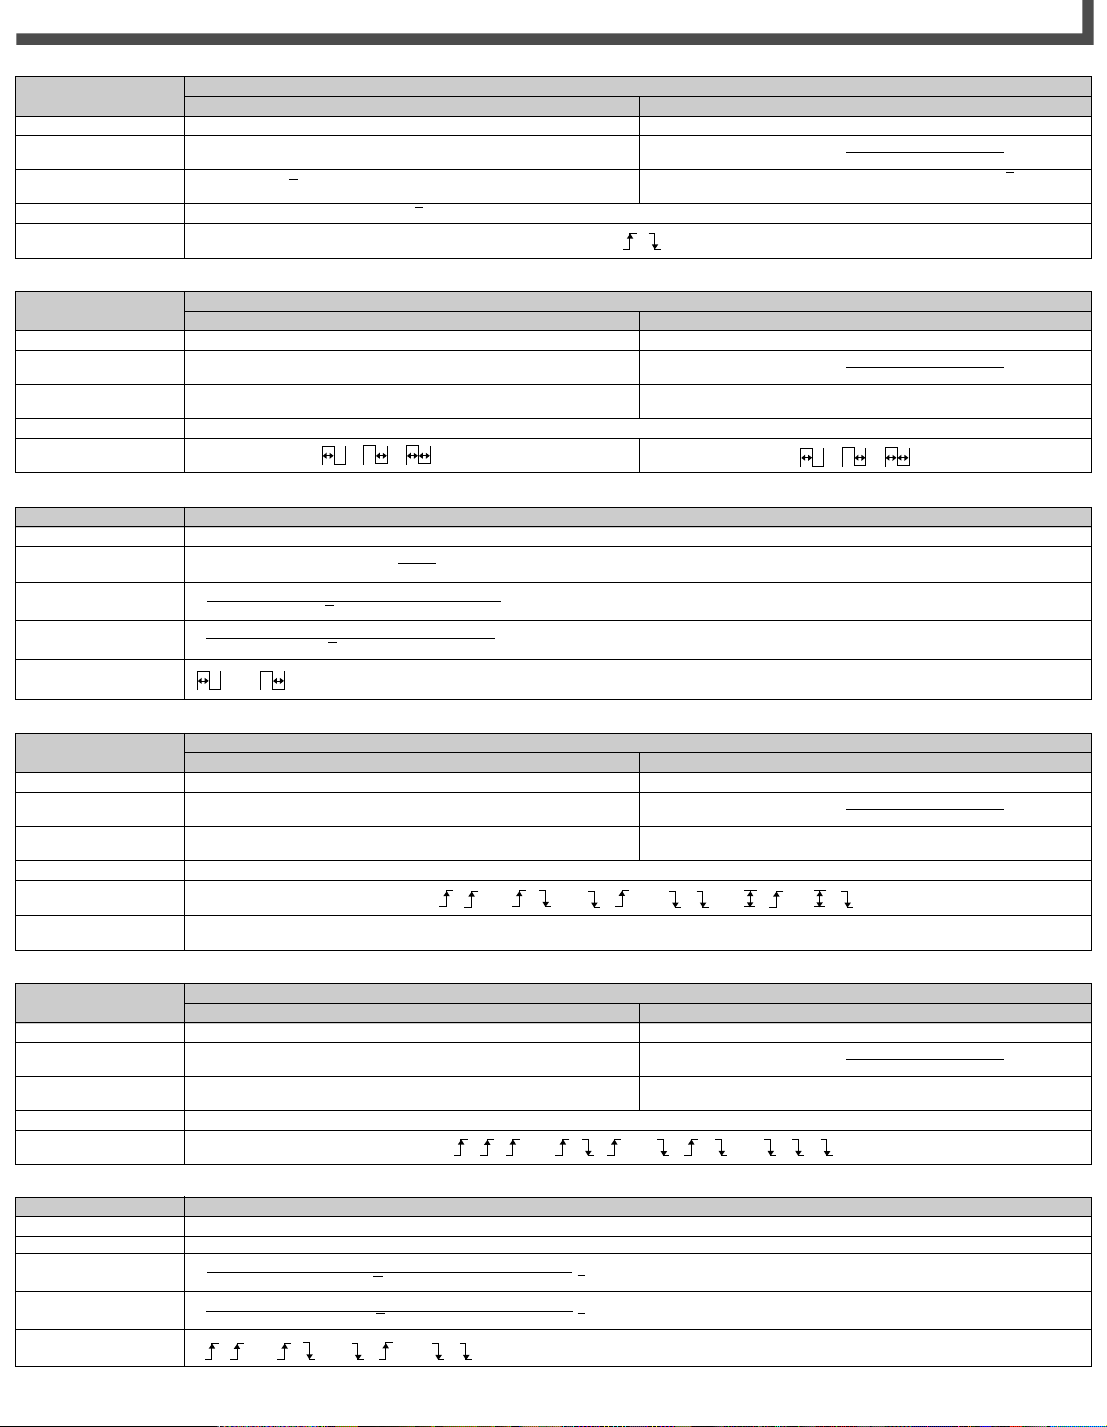
● Period
Item
Measuring range
Display resolution
Resolution*
Accuracy*
Trigger slopes
1
1
30 ns to 100 ms
100ps
±300 ps rms ± √2 × trigger error
● Pulse Width
Item
Measuring range
Display resolution
Resolution*
Accuracy*
Trigger slopes
1, *3
1
30 ns to 100 ms
100 ps
±300 ps rms ± rising trigger error ± falling trigger error
● Duty Ratio (time stamp mode only)
Measuring range
Display resolution
Resolution*
Accuracy*
Trigger slopes
Item
1
1
0 to 99.999% (pulse width: 71 ns to 100 ms)
The larger value, either 0.001% or
Period
measured pulse width + | pulse-width resolution |
±
( )
measured period –√2 × | pulse-width resolution |
measured pulse width + | pulse-width accuracy |
±
( )
measured period – √2 × | pulse-width accuracy |
Specifications
Time stamp mode
±300 ps rms ±√2 × trigger error ±(timebase frequency stability × measured period) ±300-ps systematic error
Time stamp mode
±300 ps rms ±(timebase frequency stability × measured pulse width) ± trigger level timing error ±1-ns systematic error
22T*
loops
4
× 100%
– measured duty ratio
– measured duty ratio
30 ns to 3.2 µs
The larger value, either 100 ps or
200
The larger value, either ±300 ps rms or display resolution, ± √2 × trigger
error
Specifications
30 ns to 3.2 µs
The larger value, either 100 ps or
200
The larger value, either ±300 ps rms or display resolution,
± rising trigger error ± falling trigger error
Specifications
Hardware histogram mode
the histogram span setting
Hardware histogram mode
the histogram span setting
● A-to-B Interval
Item
Measuring range
Display resolution
Resolution*
Accuracy*
Trigger slopes
Conditon for continuous
measurement*
1, *5
1
6
5 ns to 100 ms
100 ps
±300 ps rms ±A-input trigger error ±B-input trigger error
±300 ps rms ±(timebase frequency stability × measured A-to-B interval) ± trigger level timing error ±1-ns systematic error
Time stamp mode
A A
B
B
The B-to-A interval must be greater than 30 ns.
● A-to-B-to-A Interval
Item
Measuring range
Display resolution
Resolution*
Accuracy*
Trigger slopes
1
1
A to B: 30 ns to 100 ms; B to A: 30 ns to 100 ms
100 ps
±300 ps rms ± A-input trigger error ±B-input trigger error
±300 ps rms ±(timebase frequency stability × measured A-to-B-to-A interval) ± trigger level timing error ±1-ns systematic error
Time stamp mode
A
A
B
● Phase Difference (time stamp mode only)
Measuring range
Display resolution
Resolution*
Accuracy*
Trigger slopes
*1: The value when, under the reference operating conditon, the warm-up time has expired.
2
*
Item
1
1
: The value when the period of a 1-MHz sine wave is measured with an event size of 1000.
0 to 360 degrees (where, A to B: MIN (71 ns); B to A: 30 ns min.)
0.01 degree
measured A-to-B interval + | A-to-B interval resolution |
±
( )
measured A-input period –√2 × | A-to-B interval resolution |
measured A-to-B interval + | A-to-B interval resolution |
±
( )
measured A-input period – √2 × | A-to-B interval resolution |
A A
B
B
B
A
A
B
Specifications
5 ns to 3.2 µs
The larger value, either 100 ps or
200
The larger value, either ±300 ps rms or the display resolution,
± A-input trigger error ±B-input trigger error
B
A
Specifications
AA
B B
Specifications
measured phase difference
measured phase difference
A
B B
A to B: 30 ns to 3.2 µs; B to A: 30 ns to 3.2 µs
The larger value, either 100 ps or
200
The larger value, either ±300 ps rms or display resolution,
± A-input trigger error ± B-input trigger error
B
A
A
Hardware histogram mode
A
A
B
Hardware histogram mode
A
A
the histogram span setting
the histogram span setting
Page 3

TA320
3
: The specificatin changes as shown below if the trigger slope makes a transition represented as
*
±300 ps rms
± rising trigger error ± falling trigger error ± trigger level timing error
The larger value, either ±300 ps rms or display resolution, ± rising trigger error ± falling trigger error ± trigger
level timing error
The specification changes as shown below if the trigger slope is “22T”:
Time Stamp Mode
Time Stamp Mode
±300 ps rms
± √N × (rising trigger error + falling trigger error + trigger level timing error)
N: The number of edges that has passed through during a time interval of 22× T.
4
*
: Measurement takes place only when an interval between the edges of a 22T input signal matches the time interval of 22× T.
Hardware Histogram Mode
22 × T
(≠ 22 × T)
22 × T
T: any value of time keyed in
A
Measured Measured
*5: The specification changes as shown below if the trigger slopes make transitions represented as :
300 ps rms
± A-input trigger error ± B-input trigger error ± trigger level timing error
Not measured
Time Stamp Mode
A
A
B
B
Hardware Histogram Mode
The larger value, either ±300 ps rms or the display resolution, ±A-input trigger error ± B-input trigger error
± trigger level timing error
*6: Conditions for continuous measurement
A
MIN (71ns)
α
β
α
:The A-to-B interval must be greater than 5 ns.
β
: The B-to-A interval must be greater than 30 ns.
If the trigger slopes make transitions represented as
A
B
B
Measured Measured
Notes: The trigger error, rising trigger error, falling trigger error, A-input trigger error, and B-input trigger error are represented by:
X2 + En
S.R
En: Signal noise at a frequency within the bandwidth (100 MHz)
S.R: The slew rate of a signal being measured [V/s]
X: Noise of the input amplifier
2
The trigger level timing error is represented by:
±(15 mV/start signal’s slew rate – 15 mV/stop signal’s slew rate) ± trigger level setting accuracy/start signal’s slew rate ± trigger level setting accuracy/stop signal’s slew rate
Specifications Related to Functions
● Display Formats
Item
Display formats
Histogram *
Time variation*
List (time stamps, measurements and data numbers)*
Statistics (statistical data)*
1
2
Time stamp mode
3
● Statistical Computation (for statistics and histogram formats only)
Item
Maximum value
Minimum value
Average
Sandard deviation*
Peak-to-peak
Flutter
5
Jitter 1*
5
Jitter 2*
*1: The user can view up to two statistical values.
2
: The time resolution in the time stamp mode is 100 ns both for the X-axis of the time-
*
based variation format and for the time stamps of the list format.
3
: Allows the display of all statistical values and viewing of a bar-graph representation
*
of standard deviations.
4
: Standard deviation–when in pulse width measurement with a trigger slope of
*
σ
p + σa
MAX = [Xi] max
MIN = [Xi] min
AVE =
4
σ
Σ
n
i=1
n
1
= , where n = the number of samples
Σ
√
n
i=1
n
1
P–P = MAX – MIN
σ
σ
MELE = × 100%
σ
/AVE = × 100%
AVE
σ
/ T = × 100%
Ts
|AVE–X CENTER |
Xi
(Xi–AVE)
Ts
2
Time stamp mode
2
2
Specifications
Histogram*
List (measurements and their frequencies)
Statistics (statistical data)*
1
Hardware histogram mode
3
Specifications
Hardware histogram mode
MAX = [Xi] max
MIN = [Xi] min
AVE =
σ
= where n = the number of histograms
Xi × probability
Σ
n
i=1
n
1
(Xi–AVE)2 × probability
Σ
n
√
i=1
i
i
n
1
P–P = MAX – MIN
σ
σ
MELE = × 100%
σ
= Standard deviation for a fransition represented as “ to ”
a
σ
= Standard deviation for a transition represented as “ to ”
p
5
: Ts = Any constant keyed in
*
CENTER: The center value in a window in a case where the multi-window function
X
is in use
σ
/AVE = × 100%
AVE
σ
/ T = × 100%
Ts
|AVE–X
CENTER |
Ts
Page 4

TA320
● Arming (a function that specifies the time to begin one-block measurement)
Item
Arming source
Internal
External
Arming delay
Range of event
delay setpoint
Range of time
delay setpoint
Slopes
Measurement begins, after a delay as long as the preset number of events or event time, only when the arming source is external.
Time Stamp Mode
Measurement begins when the internal system of measurement goes into the ready state.
Measurement begins as triggered by the edge of an external input signal.
Measurement begins after a delay as long as the preset number of event.
1/,00002/,00003/,00004/,00005/,00006/,00007/,00008/,00009/0000
10/,00020/,00030/,00040/,00050/,00060/,00070/,00080/,00090/000
100/00,200/00,300/00,400/00,500/00,600/00,700/00,800/00,900/00
1,000/02,000/03,000/04,000/05,000/06,000/,07,000/08,000/09,000/
10,000/ 20,000/ 30,000
Measurement begins after a delay as long as the preset time.
1 µs to 5 ms (exclusive) (in 200-ns increments)
● Gating (a function that specifies the range of one-block measurement to be carried out)
Item
Event gating
Configurable
Number of events
End of measurement
Time gating
Onfigurable setpoint of
time
End of measurement
External gating
Allowable timeframe
End of
measurement
Polarities
Duty ratio and phase difference measurements: 1 to 16,000
Other measurements: 1 to 32,000
Sampling ends if the number of samples reaches 32,000
before the gate time expires.
Sampling ends if the number of samples reaches 32,000
before the gate time expires.
Time Stamp Mode
The analyzer measures as many data items as the preset number of events.
Sampling ends if 320 seconds elapse before the preset number of events is reached.
The analyzer measures data for as long a period as the preset gate time.
1 µs to 5 ms (exclusive) (in 200-ns increments)
The timeframe of measurement is determined by a signal applied to the arming terminal.
Specifications
5 ms to 1 s (in 1-ms increments)
Specifications
5 ms to 10 s (in 1-ms increments)
1 µs to 320 s
Hardware Histogram Mode
Hardware Histogram Mode
1 to 99,999,999
Sampling ends if the number of samples reaches 99,999,999 (10
before the gate time expires.
Sampling ends if the number of samples reaches 99,999,999 (10
before the gate time expires.
8
-1)
8
-1)
● Inhibit (a fuction that specifies the timeframe during which the analyzer inhibits
input signals from being captured)
Item
Allowable timeframe
Polarities
● Multi-window (a function that presents two or more different histogram
windows–available only in the hardware histogram mode)
Item
Functions
Configurable
number of windows
Setup of center value
and span
Period, pulse width, A-to-B interval and A-to-B-to-A interval
Specifications
1 µs to 320 s
Specifications
1 to 16
AUTO/MANUAL
● Histogram Data Addition (hardware histogram mode only)
Item
Histogram data
addition
The user can add data values to a histogram a round its center value for display on the screen only when the multi-window function (AUTO) is selected. The statistical computation is implemented according to a new array of data including the added data values.
Specifications
Timebase
Item
Internal reference
frequency
Frequency stability
External adjustment
10-MHz temperature-compensated crystal oscillator
(TCXO)
Aging rate: ±1.5 ppm/year
Temperature characteristics: ±2.5 ppm over 5 to 40°C
(with the reference point a +25°C)
Available
Specifications
General Spacifications
Item
Memory
Floppy disk drive
GP-IB communication
Reference operating
condition
Warm-up time
(Approx.)
Operating temperature
range
Operating humidity
range
Torage temperature
range
Ated supply voltage
range
Range of supply
voltage variation
Rated supply
frequency range
Range of rated supply
frequency variation
Power consumption
External dimensions
(Approx.)
Weight (Approx.)
Display
Non-volatile memory, allowing storage of and access to ten
kinds of panel information.
Size: 3.5"
Quantity: 1
Format: MS-DOS
Compatible with IEEE Standard 488-1978 (JIS C 1901-1987)
Functional specifications:
SH1, AH1, T5, L4, SR1, RL1, PP0, DC1, DT1 and C0
Protocol: Compatible with IEEE Standard 488.2-1987
Ambient temperature: 23±2°C
Ambient humidity: 50±10%RH
Supply voltage: Within 1% of rated voltage
30 minutes
(until all specifications are fulfilled)
5 to 40°C
20 to 80%RH
-20 to 60°C
100 to 240 V AC
90 to 264 V AC
50 to 60 Hz
48 to 63 Hz
125 VA max.
213(W)×132(H)×392(D) (mm)
8-3/8(W)×5-1/4(H)×15-1/2(D) (inch)
5 kg (main unit only)
4.7" STN monochromeLCD (320×240 pixels)
Specifications
(640, 720 KB, 1.2 or 1.44 MB)
Page 5

TA320
Application Software Specifications
● Optional Disk Analysis Software for the TA320
Readable data: Binary type data measured with the TA320(WVF), Binary data
Data acquisition: Via floppy disk or communications through GP-IB interface
Display of analysis results: Histogram display (graph display), vertical scale: log or lin-
Analysis range: Start cycle is limited to 1 to 3T.
Save/load functions: Analysis data and the software settings can be saved or loaded.
Database function: Data for each Pit/Land and the title to be given to the data can be
Printing function: Histograms, graphs, and tables can be printed out.
Judgment function: This function sets the median and allowable range for a delta av-
Comments: Comments can be attached to the analysis result.
Personal computer: Those running Windows 3.1, Windows 95, or Windows NT
GP-IB board: Those made by NATIONAL INSTRUMENTS.
■ BLOCK DIAGRAM OF THE TA320
saved using this software
ear, Delta average table, Jitter value (standard deviation) table,
Judgment line display, and Independent/overlapping display for
Pit/Land measured values
End cycle ranges from 1 to 16T.
Saving or loading of average values only is also available.
controlled as a bundle.
The printing direction can be specified.
erage and the criterion for standard deviation.
With the judgment function, the judgment line is displayed on
the graph and the data exceeding the criterion (NG) are marked
in a different color.
workstation
 Loading...