

Page 1

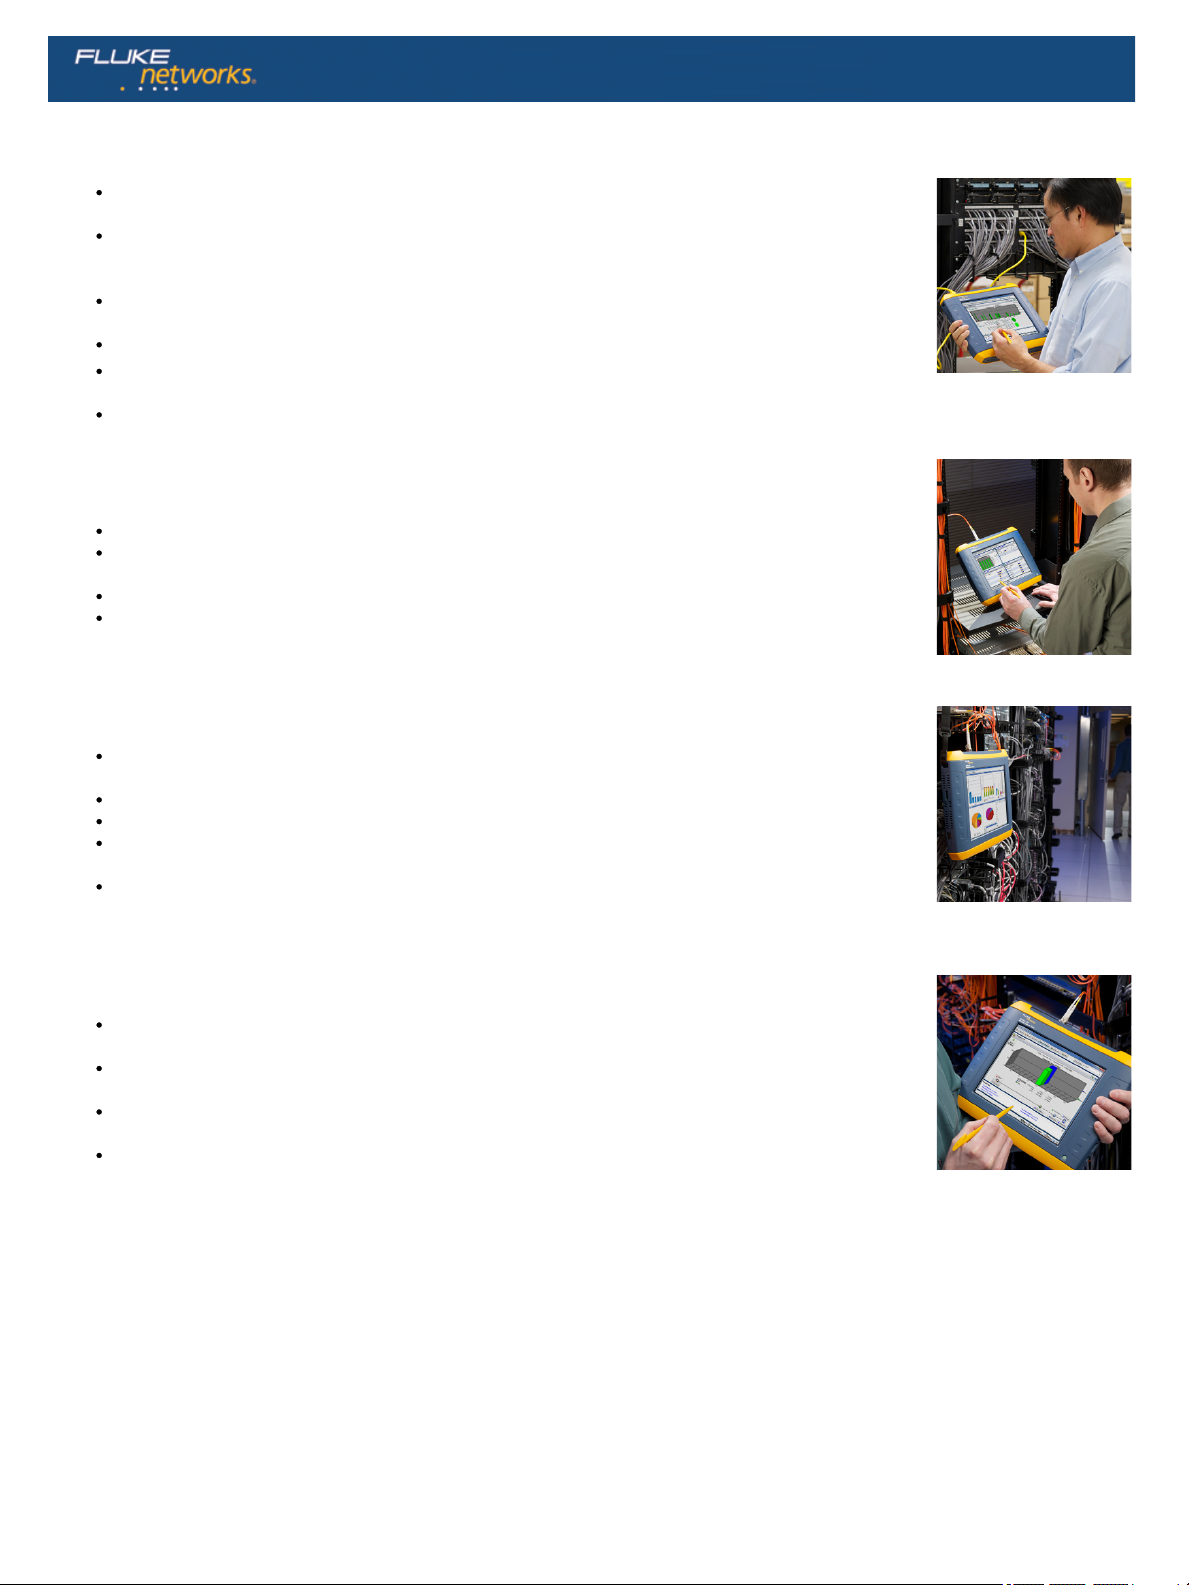
The OptiView® XG is the first tablet specifically designed for the network
engineer. It automates root-cause analysis of wired and wireless network and
application problems allowing the user to spend less time on troubleshooting
and more time on other initiatives. It is designed to support the deployment
and troubleshooting of new technologies, including unified communications,
virtualization, wireless and 10 Gbps Ethernet. The result is that new initiatives
get up and running faster and networks stay productive even in these days of
smaller teams.
Datasheet: OptiView XG Network Analysis Tablet - Overview and General
Information
Core capabilities
Network Analysis – Automated discovery, monitoring, analysis and guided troubleshooting of your network infrastructure
Traffic and Packet Analysis – The ONLY tablet with 10 Gbps "On the wire" analysis
Wireless Analysis – Integrated tools for deployment and troubleshooting of 802.11a/b/g/n WLANs
Performance Testing – Conduct network assessments, validate new infrastructure and devices, test service provider SLAs, and
troubleshoot problems from end to end, at up to a full line-rate of 10 Gbps
For detailed information about each one of these core capabilities, see additional data sheets.
The Tablet for Network Engineers
The OptiView XG's unique tablet form factor provides the mobility to connect, analyze and troubleshoot anywhere in the network – at the desk, in
the data center, or at the end user location. It can quickly analyze the performance and health of devices, interfaces and paths on your network—
which moves beyond traditional LAN/WAN switching and routing to a true network fabric that incorporates heterogeneous physical devices,
wireless networks, virtualized servers and networks.
Integrates the latest wired and wireless technologies with powerful dedicated hardware in a unique tablet form factor providing mobility to
connect, analyze and solve network and application problems anywhere on the network
Displays your network exactly the way you want to see it through intuitive, customizable dashboards
Provides performance testing, 'on-the-wire' and 'in-the-air' automated analysis up to 10 Gbps
Enables proactive analysis by analyzing the information you need before problems arise
Out-of-the-box and customizable reports
1 of 10
Page 2
Network Analysis
For further information, see detailed data sheet
Real-time discovery engine finds and tracks up to 30,000 devices – hosts, phones, switches, routers,
access points, servers and more
Unique Path Analysis provides graphical view of the path between a user and application resources (local,
remote, or cloud-based) and visually indicates performance data or problems on critical links and devices
along the path
Allows visibility of intermittent problems by collecting and monitoring granular data rather than the
aggregated data collected by typical network management systems
Automatically detects problems in the network and suggests resolution procedures
Measure performance of your VMware® environment, including hypervisor availability, interface utilization,
and resource usage levels
Real-time NetFlow data finds bandwidth hogs
Traffic and Packet Analysis
For further information, see detailed data sheet
Ensures line-rate packet capture up to 10 Gbps for troubleshooting difficult application problems
Performs application-centric analysis with a high-level view of the applications on the network with easy
drill down capability
Real-time traffic analysis shows top hosts, top conversations, top protocols – who is using your bandwidth
Go directly in-line (up to 1 Gbps) to observe traffic in real-time or capture at line rate without the need of
an external tap
Wireless Analysis
For further information, see detailed data sheet
Enables analysis of the WLAN environment using the award-winning AirMagnet WiFi Analyzer, Spectrum
XT, Survey and Planning tools
Find rogue clients and access points that could be jeopardizing the security of your network
Identify and find sources of RF interference that impact the performance of your WLAN
Quickly troubleshoot WLAN performance issues – configuration problems, co-channel interference, slow
clients
Discovery and querying of wireless LAN controllers provides information about wireless networks across
your enterprise
Performance Testing
For further information, see detailed data sheet
Test service provider SLAs, troubleshoot network bottlenecks, validate new architectures, and assess
networks for new technology or application deployments
Measures end-to-end network performance in terms of bandwidth, latency, jitter, loss and availability up to
10 Gbps
Testing at operational speeds (less than line-rate) in conjunction with Path Analysis reveals network
bottlenecks
Class-of-Service testing and multiple test streams (up to 8 simultaneous) ensures availability and
performance of QoS throughout your network, and whether carrier links are supporting QoS
2 of 10
Page 3

Innovative Design and Powerful Custom Hardware Speeds the Job of Network Engineers
Tablet Form Factor
OptiView XG provides a wide range of functionality to adapt to the dynamic and diverse networks of today, in a convenient tablet for use
anywhere in the network. It is the only tool that provides the capabilities to analyze and troubleshoot applications, wired networks (1 GbE, 10 GbE)
and wireless networks (802.11a/b/g/n) from the perspective of either remote or local users. The unique tablet form factor designed specifically for
network engineers provides the mobility to troubleshoot anywhere in the network, from the engineer's desk, in the data center or at the end-user
location.
USB
Network Under Test Port RJ45
10/100/1000 Mbps
Network Under Test Port SFP
100 Mbps/1 Gbps
Network Under Test Port SFP+
10 Gbps
External Antenna Connector
External
Monitor
(VGA)
Management Port USB 19V /4.7A Power Serial Number Hot Swappable Batteries Handstrap Points
Key Features
Portable - The XG is extremely portable. It is 14 inches (36 cm) measured diagonally. At just under 6 pounds (2.5kg) and 2 inches (5 cm) thin, the XG
can be used anywhere.
Multiple wireless adapters - The XG has two W i-Fi adapters and one spectrum adapter built-in. The multiple adapters along with the portability make
WLAN analysis and troubleshooting easy as you do not need to swap adapters or have extra external hardware.
High-resolution display - A large, 10.25 inch high-resolution 1024x728 LCD display is remarkably crisp and vivid making it perfect for viewing and
analyzing large amounts of data at once.
Extendable 2 hours of battery life - The XG can be used for up to 4 hours on the battery for wired and wireless analysis (or 2 hours for wired AND
wireless analysis). The batteries are hot swappable which means the XG can be used for a much longer time without losing data.
Connectivity - The XG supports 10 Gbps and 1 Gbps fiber, 10/100M and 1 Gbps dual-port copper and 802.11a/b/g/n WLAN.
Performance - The XG runs Windows® 7 (64-bit, SP1) with 4 GB of RAM. It has a 128 GB solid state removable drive. The XG obtains its processing
power from an Intel® Core™ Duo 1.2 GHz processor. The XG is capable of 10 Gbps full line-rate capture and has a 4 GB dedicated capture buffer.
3 of 10
Page 4

Intuitive User Interface with Customizable Dashboards, Smart Navigation and Easy Reporting
User Configurable Dashboards
Present the relevant data to the right audience. OptiView XG has
extensively customizable dashboards that transform collected data into
an actionable presentation. The dashboard can be customized for a
particular user or for the entire enterprise. Create dashboards for
keeping an eye on network and applications by site or even by business
function. Save and export them to different members of your team. The
dashboard provides an at-a-glance overview of the current status of your
network with critical metrics from routers, switches, firewalls, servers,
services, and other infrastructure devices. Even remote users can set up
dashboards to get their own view of network operations.
Customizable Dashboards
Network and Application Issue Reporting Engine
OptiView XG offers a number of built-in reports, making it quick and easy
to report on application and network problems. While viewing a screen,
press the Reports key to generate HTML or PDF reports on protocols,
top hosts, top conversations, devices, networks, problems and many
more.
Customize out-of-the-box reports and create completely customized
reports using the configurable dashboards in just a few clicks. The ability
to choose what data to populate in a report enables users to quickly see
the information needed. You can even create reports for specific user
profiles, making it easy to generate reports for specific departments or
recipients.
Customizable Reporting
Problem Alerting and Notification – SNMP Trap and Syslog Messages
OptiView XG scans the entire network infrastructure, identifying issues and bringing them to your attention. When problems are discovered, XG
utilizes the on-board Windows Event Log, SNMP service and syslog agent to send problem notifications to the user's network management
system (via SNMP Traps or syslog messages), where they can be routed to the appropriate technician.
4 of 10
Page 5

Problem Alerting and Notification – HeadsUp™ XG Mobile App
With the new HeadsUp XG mobile app for Apple iOS (available free via the Apple
iStore), you get real-time notifications from your OptiView XG tablet(s). Instant
notification means you're always "in touch" with your network, and seeing critical
problems even before users start calling the help desk!
Use HeadsUp XG to browse your OptiView XG units, and drill down into problems on
the Problem Log. The affected devices and specific problems are reported, along with
the severity of the problem (Error, Warning, Info) and time detected. Problems that
have been resolved are also indicated, and the time the resolution was detected. The
app also includes a detailed Help file, or onboard "expert", providing background
information about the type of problem, how it can be caused and what can be done to
resolve it. Having visibility of problems in the palm of your hand allows you to react
more quickly when problems occur, and help you decide whether the particular problem
is a "red alert" or something that can wait, helping you manage your time more
effectively. Multiple users can use HeadsUp XG to access and get notifications from
your XG(s).
You can "clear" problems on the XG remotely from your iPhone or iPad, and through
the app's synchronization capability, the problems are cleared on the XG
simultaneously, and vice versa – problems cleared on the XG are automatically cleared
on your handheld device.
HeadsUp XG app for iOS
Remote User Interface and Access
Simply point a web browser at the IP address of a correctly configured
OptiView XG tablet to retrieve saved reports and capture files. You can
also install a remote User Interface (UI) and use your PC to remotely
access an OptiView XG over a TCP connection. Once the remote UI is
installed, simply give the interface the IP address of the OptiView XG
and see the default dashboards. You can then create your own remote
dashboards to get your own view of the network.
Communication between the OptiView XG and remote UI can be
encrypted. A single portable OptiView XG supports thirty-two remote
sessions for collaborative troubleshooting or opening of multiple
sessions on a PC to provide a remote "NOC" view. The OptiView XG
features a separate management port for "out-of-band management"
independent of the network under test port. When using the remote
interface, all dashboards created are stored on the user's PC, allowing
further customization for each remote user.
Remote User Interface - OptiView Browser
5 of 10
Page 6

User Accounts
Add and modify security information for each individual OptiView XG user to prevent unauthorized use of certain features for compliance with
regulatory requirements or internal policies. For example, this allows users access to powerful troubleshooting features such as SNMP, while
keeping the community strings hidden. Features that can be disabled include packet capture and decode, traffic generation, remote user interface
and OptiView XG configuration.
Context Sensitive Help
Help is contextually linked to each screen in the OptiView XG. While the help screen is displayed, you may select other information from the table
of contents, choose an index entry, or perform a full text search on any help topic or term.
Removable Hard Drive
Essential for use on classified networks, this feature ensures any sensitive data stored on your network analyzer's hard drive never leaves that
environment. Network information discovered by the OptiView XG tablet is stored on the removable hard drive, allowing the OptiView XG to be
moved between classified environments and between classified and unclassified systems by simply removing and replacing the hard drive. Extra,
pre-configured drives are available (spare drives are pre-configured with Windows 7 OS and OptiView operating software).
Included with OptiView XG Network Analysis Tablet:
Leather carrying case with extra
storage
Shoulder and hand straps
AC adapter/charger
Stylus
Getting Started Guide
USB memory stick
1 m (6') shielded twisted-pair
patch cord
Internal removable hard drive
The OptiView XG tablet with wireless (WL, PRO,
PLUS and EXPT models) ship with one external,
directional wireless antenna with mounting
hardware and one omnidirectional antenna (not
shown).
6 of 10
Page 7

General Specifications
Physical Specifications
Dimensions (H,W,D) 9.45" x 12.43" x 2.03" (240 mm x 315.7 mm x 51.6 mm)
Weight 5.6 lb. (2.5 kg) with batteries; 4.5 lb. (1.8 kg) without batteries
Display Color active matrix TFT LCD, 1024 x 768 pixels, LED backlight, touch panel with 2 touch points
Security Kensington® security slot on rear panel for connection of security cable
Environmental Specifications
Operating
Temperature*
10°C to 30°C (50°F to 86°F) with up to 95% Relative Humidity. 0°C to 50°C (32°F to 122°F) with up to 75% Relative Humidity
Storage Temperature -40°F to +160°F (-40°C to +71°C)
Shock and Vibration Meets requirements of MIL-PRF-28800F for Class 3 equipment
Safety EN 61010-1 2nd Edition
Altitude** 4600 m (15000 ft) on batteries
Electrical Specifications
AC Adapter Input 100 V – 240 V, 50/60 Hz, 1.5 A
AC Adapter Output 19 VDC, 4.74 A, 90 W
Battery* Two user-replaceable, rechargeable, 45 Watt-hour, lithium-ion battery packs.
Battery Operating
Time
2 hr. (typical - can be extended to approximately four hours by disabling/powering down the network under test ports for doing extended WLAN
analysis)
Battery Charge Time* 3 hr. (typical). Charge time depends on residual battery charge
System Specifications
Operating System Window 7 Professional, 64 Bit, Service Pack 1
PC - Processor Intel® Core™ Duo CPU U9300 @ 1.2GHz
PC - RAM 4 GB
Capture Buffer 4 GB
* Battery charging is disabled when internal temperature rises above 113°F (45°C).
** Altitude specification applies to OptiView XG and batteries. Maximum altitude for AC adapter is 2000 m (6,600 ft.).
7 of 10
Page 8

Wired Network Connection Specifications
Ports
Network Analysis Ports
2 RJ-45 10/100/1000BASE-T Ethernet, Small form-factor pluggable (SFP) 100/1000BASE-X Ethernet, enhanced small form-factor
pluggable (SFP+) 10GBASE-X Ethernet
Management Port RJ-45 10/100/1000BASE-T Ethernet
Supported SFP Modules
1000BASE-SX - 850 nm (Standard)
100BASE-FX - 1300 nm
1000BASE-LX - 1310 nm
1000BASE-ZX - 1550 nm
Supported SFP+ Modules
10GBASE-SR - 850 nm (Standard)
10GBASE-LR - 1310 nm
10GBASE-LRM - 1310 nm
Fault Tolerance RJ-45 Ports are designed to withstand a maximum of 100 volts
USB Ports Three USB 2.0 ports
eSATA Port eSATA port for connecting external hard drive
Video Port Standard VGA port for connection to monitor or projector
Cables
Cable Types 100 Ohm UTP and ScTP category 5, 5E, 6, ISO/IEC Class C, D, E
Cable Length
Measurement
Measurable cable lengths are from 3 feet (0.9 meters) to 500 feet (152 meters)
Accuracy: ± 6 feet (± 2 meters)
Length measurement is based on Nominal Velocity of Propagation (NVP) for selected cable type
8 of 10
Page 9

Wireless Network Connection Specifications
Wireless Antennas
Internal Wireless
Antennas
Seven internal 2.4 GHz, 1.1 dBi peak, 5 GHz,
3.2 dBi peak antennas
External Omni-directional
Antenna
Antenna, WLAN, omnidirectional, 2.4 & 5 GHz
802.11 A/B/G, 50 Ω. Gain: 2.1 dBi (2.45 GHz)
2.4 dBi (4.9 GHz), 2.6 dBi (5.25 GHz), 2.5 dBi (5.875 GHz)
External Directional
Antenna
Antenna, frequency range 2.4 - 2.5 and 4.9 - 5.9 GHz
Minimum gain 5.0 dBi peak in the 2.4 GHz band, and 7.0 dBi peak in the 5 GHz band
External Antenna
Connector
Reverse SMA
Wireless Adapters
Data Rate
11a: 6/9/12/24/36/48/54 Mbps
11b: 1/2/5.5/11 Mbps
11g: 6/9/12/24/36/48/54 Mbps
11n (20 MHz): MCS0-23, up to 216 Mbps
11n (40 MHz): MCS0-23, up to 450 Mbps
Operating Frequency 2.4000 ~ 2.472 GHz (Industrial Scientific Medical Band) 5.180 ~ 5.825 GHz
Security 64/128-Bit WEP Key, WPA, WPA2, 802.1x
Transmit Output Power
(Tolerance: ±1.5 dBm)
802.11b: 18 dBm
802.11b: 18 dBm
802.11g: 17 dBm
802.11a: 11 dBm
802.11n: 2.4 GHz:17 dBm
802.11n: 5 GHz:13 dBm
Receive Sensitivity
(Tolerance: ±2 dBm)
802.11a: 10% PER -78 dBm
802.11b: 8% PER -90 dBm
802.11g: 10% PER -80 dBm
802.11n: 2.4 GHz 10% PER
-72 dBm@HT20
-70 dBm@HT40
802.11n: 5 GHz 10% PER
-70 dBm@HT20
-63 dBm@HT40
Power Consumption
(Typical )
Transmitting (Legacy mode, HT20 mode): 870 mA @5 GHz, 700 mA @2.4 GHz
Transmitting (HT40 mode): 900 mA @5 GHz, 750 mA @2.4 GHz
Receiving (Legacy mode, HT20 mode): 550 mA @5 GHz, 520 mA @2.4 GHz
Receiving (HT40 mode): 610 mA @5 GHz, 600 mA @2.4 GHz
9 of 10
Page 10

Standards and Compliance Specifications
Supported Network Standards
IEEE 10BASE-TX, IEEE
100BASE-TX,
IEEE 1000BASE-TX,
IEEE 1000BASE-X,
IEEE 10GBASE-X
RFCs: 1213, 1239, 1285, 1512, 1513, 1643, 2108, 2115, 2127, 2515, 2819, 3592, 3895, 3896, 4188, 4502
Compliance Statements
EMC Complies with IEC/EN61326-1:2006, class A
Safety
Complies with IEC/EN 61010-1:2001, CAN/CSA C22.2 No. 61010-1-04, ANSI/UL 61010-1:2004, EN/IEC 60825-1:2007, EN/IEC 60825-
2:2004+ A1:2007
Telephone*
The OptiView XG is NOT designed for connection to a telephone network
The OptiView XG is NOT designed for connection to an ISDN line
*Note: Do not connect to a telephone network or ISDN line except through a regulatory agency compliant computer network modem device.
Models*
Product Noun Description
OPVXG **OptiView XG – Network Analysis Tablet, 1 Gbps
OPVXG-LAN OptiView XG – Network Analysis Tablet, 1 Gbps, wired only
OPVXG-10G **OptiView XG – Network Analysis Tablet, 10 Gbps
OPVXG-LAN-10G OptiView XG – Network Analysis Tablet, 10 Gbps, wired only
OPVXG-PRO **OptiView XG – Network Analysis Tablet, 1 Gbps with AirMagnet WiFi Analyzer and Spectrum XT
OPVXG-PROPLUS **OptiView XG – Network Analysis Tablet with All WLAN Options
OPVXG-EXPT **OptiView XG – Network Analysis Tablet, 10 Gbps with AirMagnet WiFi Analyzer and Spectrum XT
OPVXG-EXPTPLUS **OptiView XG – Network Analysis Tablet, 10G with All WLAN Options
*Additional models, bundles, accessories and options are available. Go to www.flukenetworks.com/xg for details
**For sale only in countries where the XG wireless is certified.
Fluke Networks Gold Support
Our support plans give you exclusive services and 24/7 technical assistance. Sign up for our Gold Support plan and you'll enjoy outstanding
privileges to protect and add value to your investment in Fluke Networks equipment. They include unlimited technical assistance seven days a
week, 24 hours a day via phone or at our web support center. Repairs on covered items and "next day" dispatched loaner units for unin¬terrupted
service. Free software upgrades. Scheduled annual performance verification service. Web based training. Access to our extensive Knowledge
Base library of operation and application related technical articles. And Gold "Members Only" special prices and promotions. Some benefits are
not available in all countries.
See www.flukenetworks.com/goldsupport for more information.
For more information about OptiView XG, visit www.flukenetworks.com/xg
Fluke Networks operates in more than 50 countries worldwide.
To find your local office contact details, go to www.flukenetworks.com/contact.
© 2013 Fluke Corporation. Rev: 09/13/2013 3:10 pm (Literature Id: 4018231)
10 of 10
 Loading...