

Page 1
™
OptiView
Integrated Network Analyzer
Total integration. Total control.
Total Network SuperVision.
No one knows the value of an integrated solution better than
network engineers – and Fluke Networks. Our OptiView Network
Analysis Solution is a breakthrough in integrated portable and
distributed monitoring and analysis hardware and software. It
gives you quick, complete visibility into your entire Ethernet
network – from portable devices to workgroup analyzers to high-
performance gigabit line-rate link analyzers. For more
information visit www.flukenetworks.com/netanalysis.
™
OptiView Integrated Network Analyzer provides complete
seven-layer support in a single package. Features include:
• Expert automation, providing network information at a glance
• Advanced active discovery, even in switched environments
• Fully automatic IP configuration—even without DHCP
• SNMP device analysis
• Traffic generation
• RMON2 agent, capable of being managed by any standard
management package (Pro Models)
Fluke Networks OptiView™ Integrated Network Analyzer
Technical Data
• Packet capture and decode (Pro Models)
• Cable and patch cable testing
• Direct connection to 10BASE-T and 100BASE-TX
• Direct fiber connections for 100BASE-FX (Pro Models)
• Gigabit support with standard 1000BASE-SX, 1000BASE-LX or
1000BASE-T GBICs (Pro Gigabit Model)
• WAN Vision option
• Wireless Network Analyzer option
Vision on every level
1
Page 2

A new approach to network analysis
Imagine the ability to see what’s happening on your network by simply
connecting one single tool. Imagine automatically discovering network
devices and seeing inside your switches and routers. Imagine using the
power of one single tool to see and understand your network. Imagine
no further. Fluke Networks OptiView Integrated Network Analyzer is a
new approach to network analysis that provides you with the Network
SuperVision you need on all seven layers, along with the speed and
simplicity that your organization demands.
Get a complete view of your network and take control with Fluke
Networks OptiView Integrated Network Analyzer.
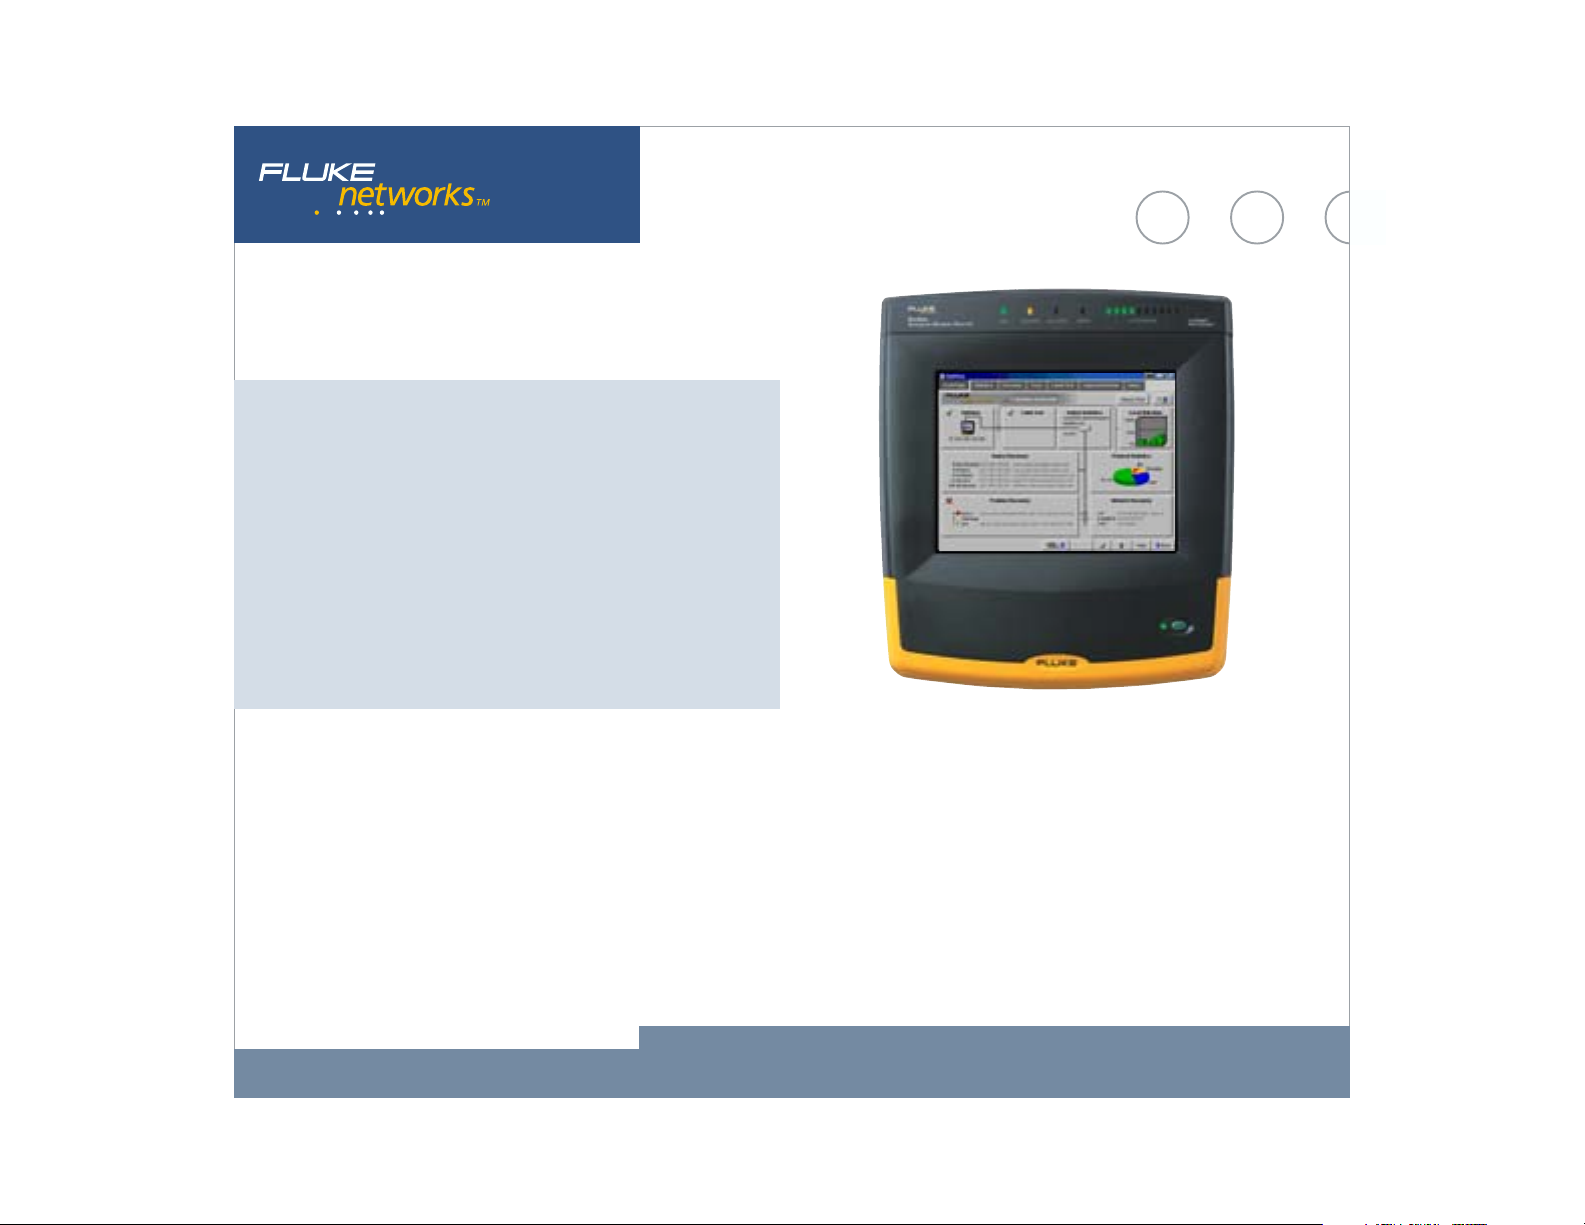
Turn it on, connect the network cable and your network appears
automatically. The information rich Network Front Page gives you
instant vision into what is happening on your network. The graphical
color display with touchscreen user interface provides information in an
easy to understand format, while giving you the ability to easily drill
down into any area by simply touching the target of interest. LEDs
continually display the current status of network activity in 10%
increments, providing visual notification when critical performance
problems exist. Additional LEDs indicate errors, collisions and
transmitted packets.
When a connection is made to a 10BASE-T or 100BASE-TX network,
the OptiView analyzer automatically performs a cable test, identifying
any problems with the cable and measuring the cable showing the
length to the attached port. The OptiView analyzer also configures
itself with a valid IP address, even without the use of DHCP. Then, the
advanced discovery system takes over to provide you with immediate
information such as percentage utilization of bandwidth, problems
detected, protocol statistics, devices and networks discovered. The
discovery system differentiates between hosts, interconnect devices
such as switches and routers, servers, printers and SNMP devices. The
discovery system also shows the number of IP subnets, IPX, NetBIOS
and AppleTalk networks.
Fluke Networks OptiView™ Integrated Network Analyzer
2
Page 3

Statistics at the touch of a button
Selecting the statistics tab on the OptiView Analyzer provides you with
a wealth of information on utilization, protocols, top hosts and
conversations.
Utilization and Errors
This function provides an historical analysis on the performance and
health of the network segment to which the OptiView analyzer, is
attached. The default data source is the OptiView analyzer but the Data
Source drop down menu lists all RMON and RMON2 devices that have a
history study enabled. This function allows you to select a device
anywhere on your network and display the information gathered by
that device. Even multi-port devices can be interrogated on an
interface-by-interface basis. The utilization graph shows percentage
utilization over time. Based on the pre-configured RMON history studies
for the selected device, you can choose from any of the existing history
durations. The OptiView analyzer time interval is selectable from 2.5
minutes to 15 hours. Each sample is time stamped and the cursor may
be moved over any sample to provide additional information shown in
the table below the graph. The utilization screen also allows you to
display the Top Talkers, Top Multicasters and Top Broadcasters.
Switching the view from utilization to error mode displays a graph of
errors by CRC Alignment errors, oversize and undersize packets, fragments
and jabbers. A touch of the Top Error Sources button displays the names
and addresses of the stations responsible for generating the errors.
Fluke Networks OptiView™ Integrated Network Analyzer
3
Page 4

Protocols
The protocols screen displays the current list of active protocols as
seen on the network segment to which the analyzer is connected. The
left side of the screen displays the protocol tree that may be expanded
to show all protocols, and sub-protocols running–from the MAC layer all
the way to the application layer. The protocol mix may be displayed at
any level in a pie chart or tabular format. When used in tabular mode
the protocols may be sorted by Packets or Octets by pressing the
Packets or Octets column header. The Top Hosts and Top Conversations
keys allow you to display the top hosts or conversations by protocol
type. For example, expanding TCP, selecting HTTP and pressing the Top
Conversations key will provide a display of all the conversations using
HTTP protocol.
Fluke Networks OptiView™ Integrated Network Analyzer
4
Page 5
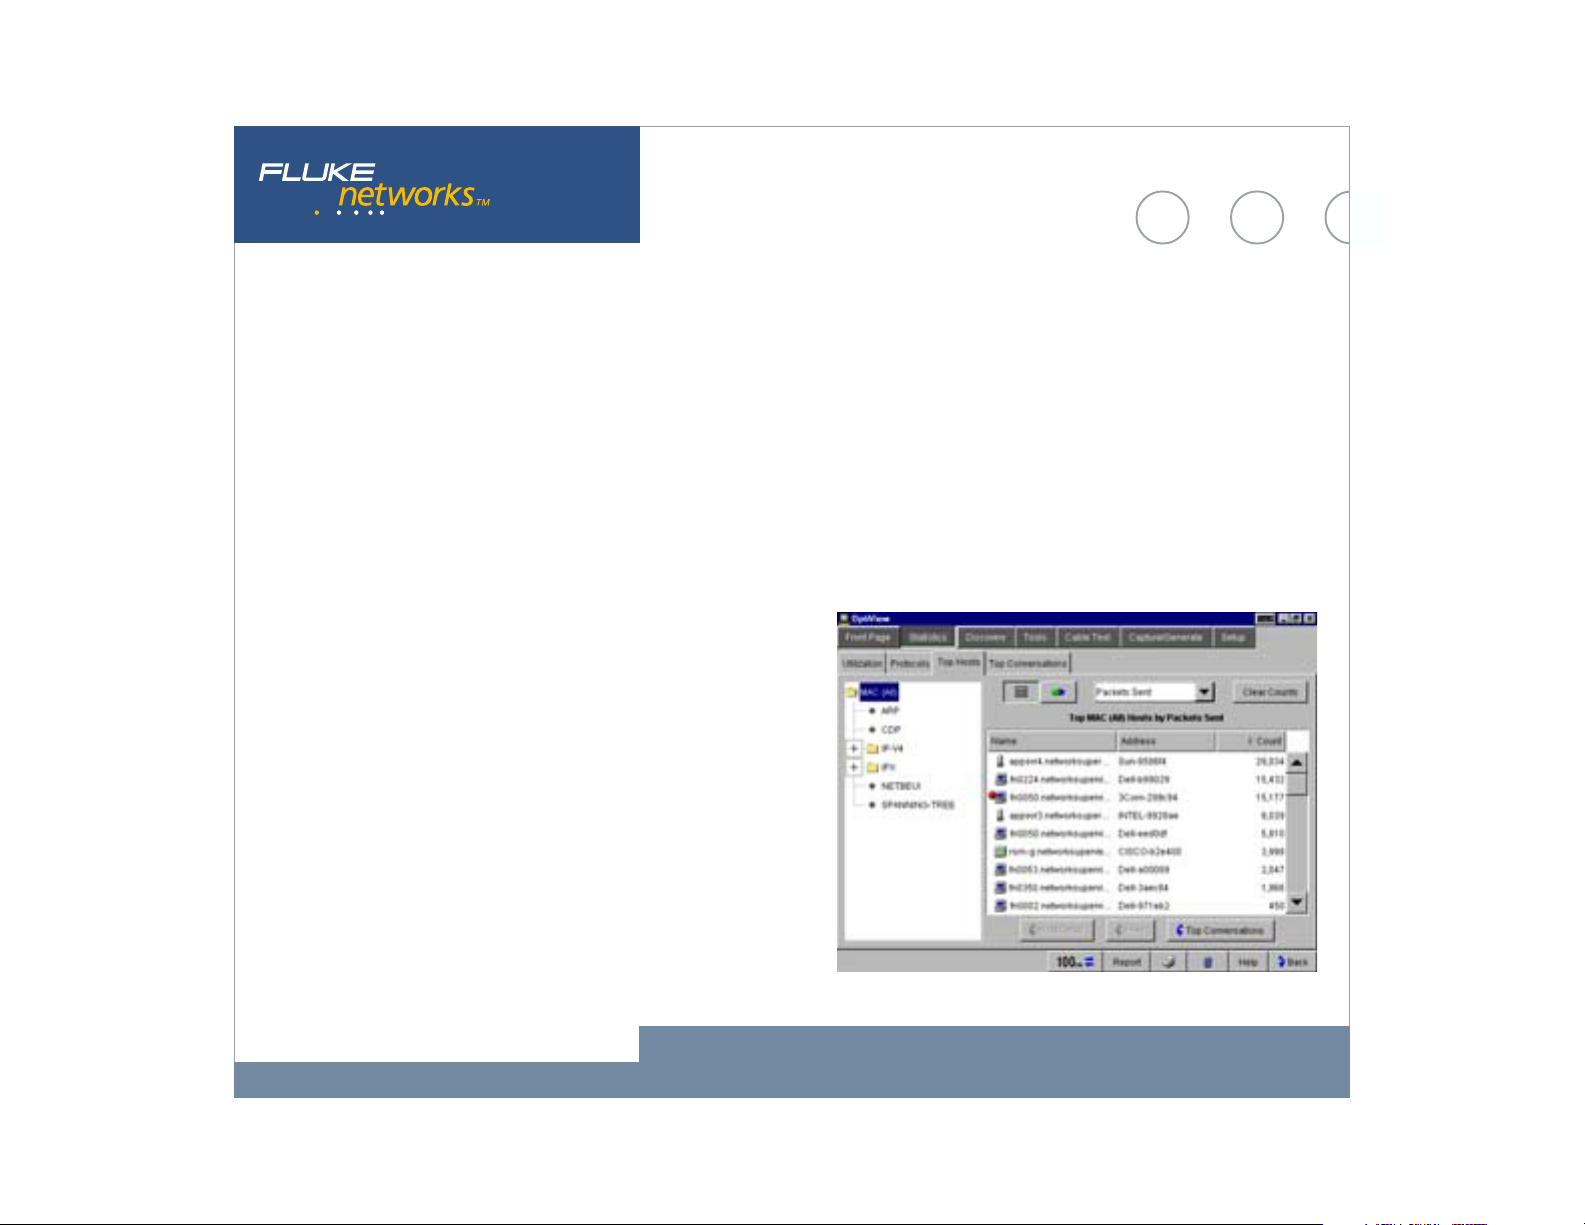
Top Hosts and Conversations
The Top Hosts screen displays the top transmitting or receiving devices
on the segment to which the analyzer is attached. When the MAC (All)
protocols is selected in the left hand pane, the host table may be
sorted by Packets sent or received, Octets sent or received, errors,
broadcast or Multicast packets. When a specific protocol or sub-
protocol is selected, the host table may be sorted by Packets or Octets.
The host table may be further sorted in ascending or descending order
by name or address. When Top Conversations is selected, the display
shows the conversations between hosts for the selected protocol. Top
conversations may also be sorted by packets or octets. You can view
additional information on the host devices by selecting a specific
conversation and touching Host A or Host B detail buttons.
Fluke Networks OptiView™ Integrated Network Analyzer
5
Page 6

Advanced Discovery Techniques
finds Devices, Networks and Problems
in seconds.
The OptiView analyzer starts its discovery process as soon as it is
connected to a network. Real-time results of devices, networks and
problems are discovered.
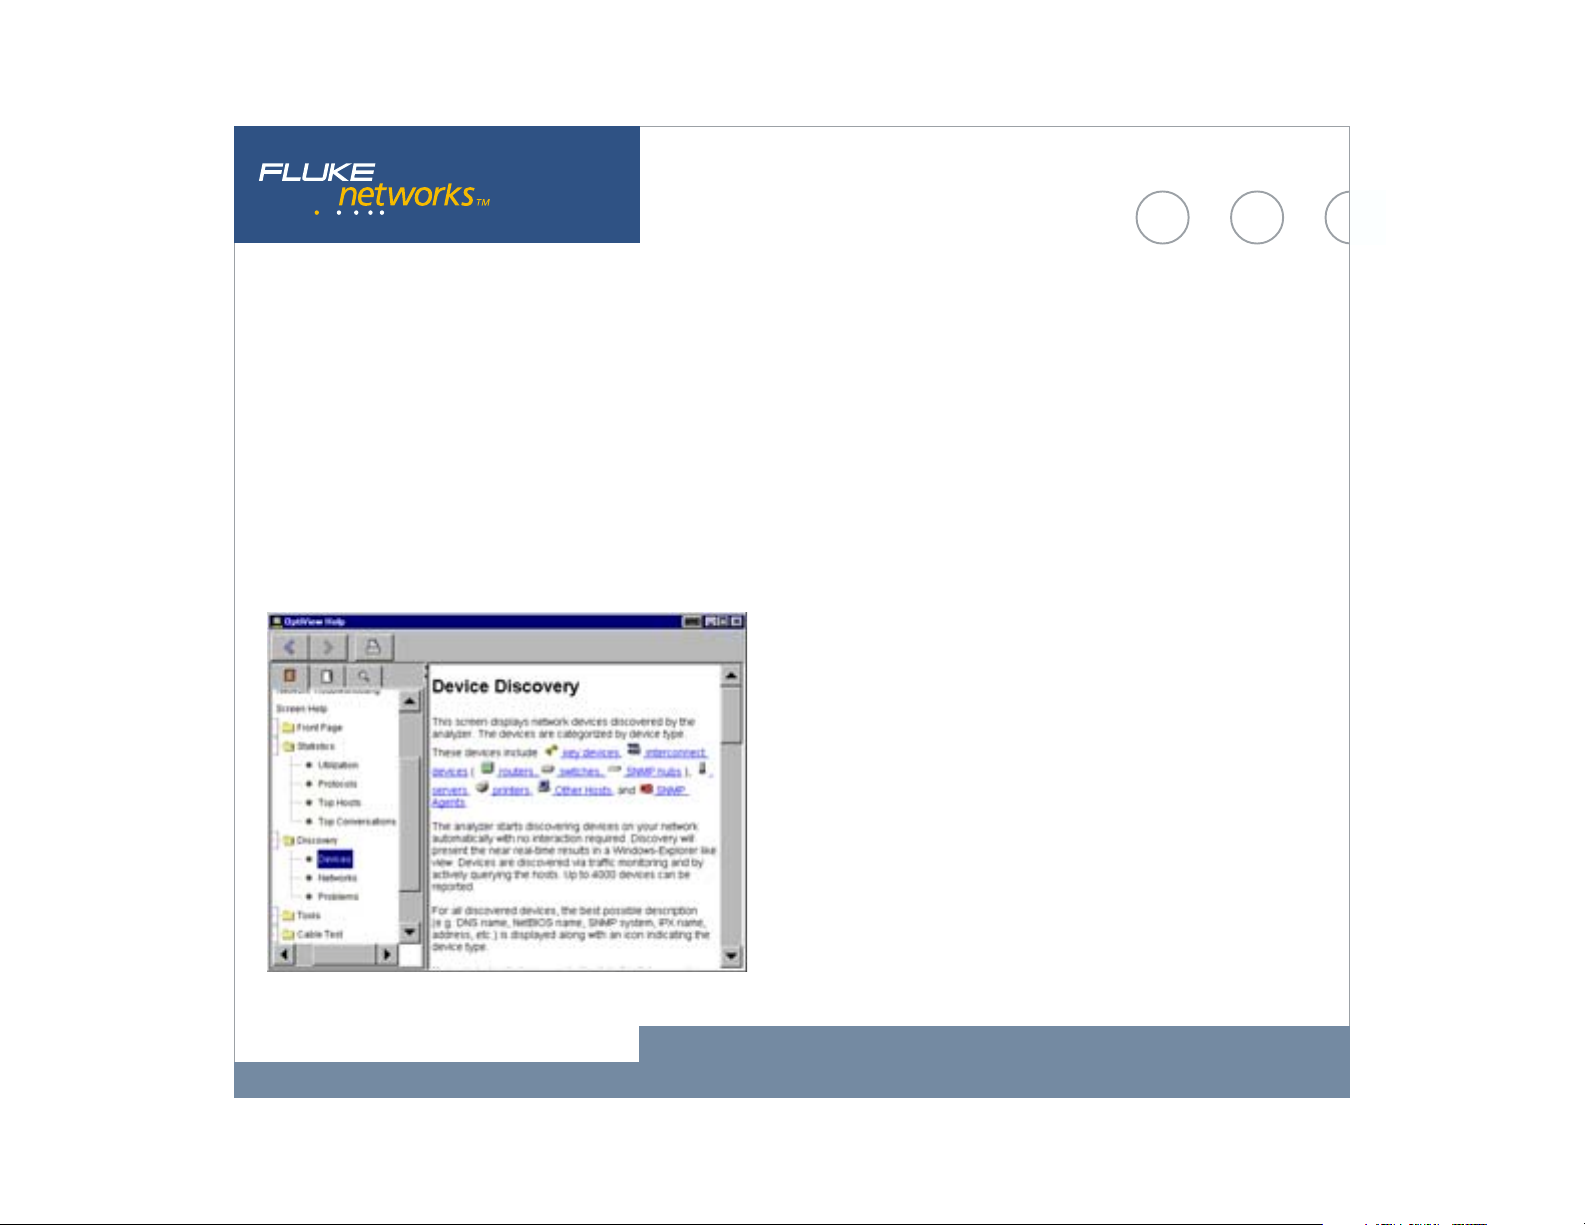
Device Discovery
Devices are discovered by monitoring traffic and by actively querying
hosts. For all discovered devices, the analyzer will present the best
possible information in terms of DNS Name, NetBIOS Name, SNMP
Name, IPX name and also addresses. The OptiView analyzer
differentiates between various types of host device. Interconnect
devices are further categorized by Routers, Switches, SNMP Hubs and
Wireless Access Points while Servers, Printers and SNMP agents are also
identified. The Device list will also include “Offnet” devices identified
by performing a ping or trace route to those devices. The devices listed
in the left hand pane is dependent on the category selected on the
device type. All devices may be sorted by in ascending or descending
order by Name, IP address or MAC address. By highlighting a specific
host and selecting the Host Detail button, you can obtain valuable
information on that host such as name, address, protocol and network
configuration. This overview screen allows you to add the device to the
“Key Device” category. By adding a device to Key Devices, the analyzer
will automatically test connectivity from the attached segment to that
device by performing an IP or IPX ping. A key device that fails to
respond, will show up in the Problem Discovery as “Key Device not
responding,” providing you with at-a-glance monitoring of critical
network devices.
Fluke Networks OptiView™ Integrated Network Analyzer
6
Page 7

Network Discovery
This screen display shows your network categorized by network type.
Networks and all associated devices are discovered by traffic
monitoring and by actively querying the hosts. The left pane of the
display shows the network types (IP, IPX and NetBIOS). By expanding
and selecting the network type, a detailed summary is provided for all
local networks. For IP networks, the Subnet, Range, Mask and
Broadcast address is displayed. For IPX networks, the Network number,
Nearest Server and encapsulation types are displayed. For NetBIOS
domains, the domain name and Master Browser or Primary Domain
Controller information is displayed.
Fluke Networks OptiView™ Integrated Network Analyzer
7
Page 8
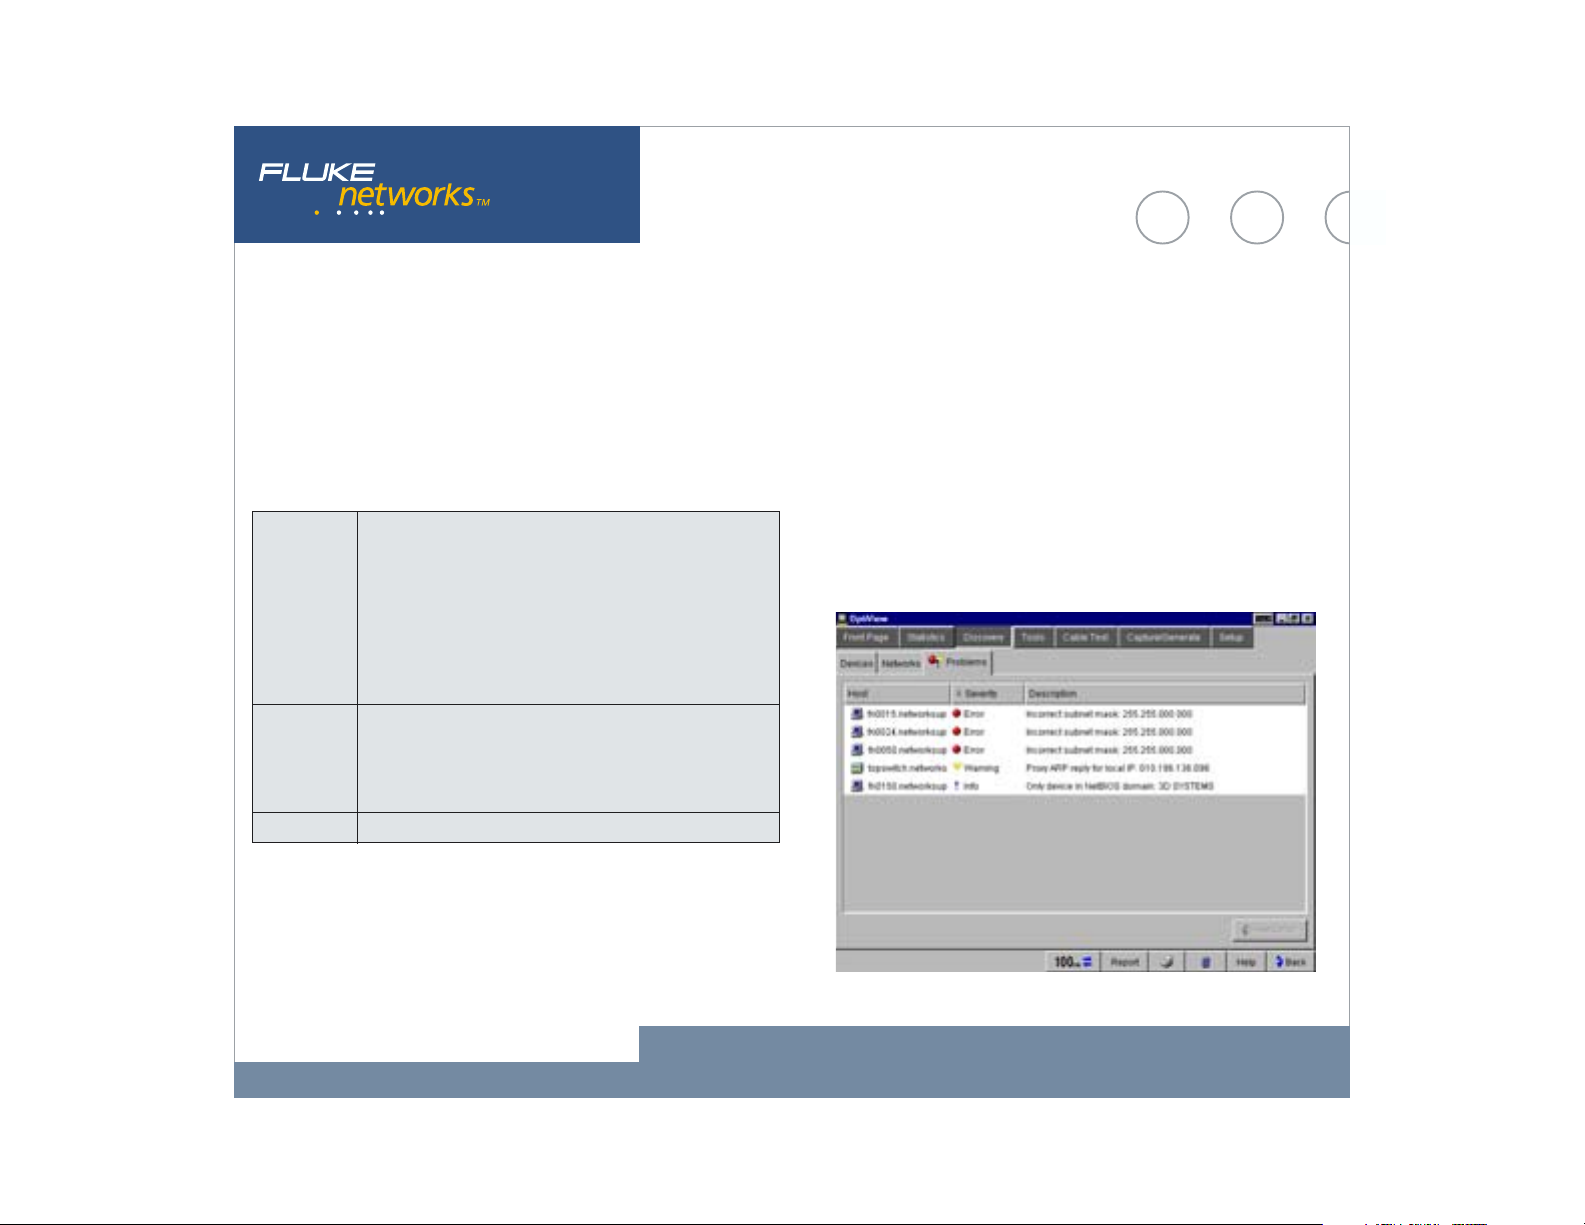
Problem Discovery
The Problem Discovery screen shows all network hosts that may be
experiencing problems. Problems are reported according to severity–
error, warning or informational. Resolved problems are also displayed.
An example of the types of problems that are detected by the OptiView
Analyzers expert system are:
Errors Duplicate IP address
Incorrect subnet mask
IP address is subnet address
IP address is subnet broadcast address
Key device not responding
DHCP Server offered IP already in use
Lost DHCP lease
Warnings Default router not responding
Only device in IP subnet
Only device in IPX subnet
Proxy ARP reply for local IP
Information Only Device in NetBIOS Domain
The Problem Discovery information may be sorted in ascending or
descending order by Host, Severity or Description.
Fluke Networks OptiView™ Integrated Network Analyzer
8
Page 9

SNMP Device Analysis
The overview screen displays valuable information about a selected
device. The device detail can include Names, Addresses, Protocols,
NetBIOS, Services, Router, Printer and Remote Monitoring capabilities
that the device supports. Names and addresses are reported as DNS,
SNMP, IPX and NetBIOS names, IP, IPX and MAC addresses. If a router
is selected, the routing protocols are reported and switch configuration
is reported by spanning-tree, transparent or source-routed. If the
device is capable of supporting remote monitoring, the level of
information provided is shown as SNMP, RMON or RMON2.
The integrated aspect of the OptiView analyzer is further illustrated
in this screen by the “Links and Launchers” drop down menu. The
capability of the selected device determines the type of links that are
displayed in the menu. Links and launchers are included for Telnet
sessions, Web Browser, Terminal Emulation, MIB Browsing and more.
Fluke Networks OptiView™ Integrated Network Analyzer
9
Page 10

Ping and Trace Route
The OptiView analyzer automatically pings (IP or IPX) the selected
device and reports the results. The parameters that may be configured
for an IP ping are rate (10, 5 and 1 per second or once every 5
seconds) and data size (18 bytes to 1472 bytes - minimum and
maximum length Ethernet frames). The results indicate the total
number of requests, the number of replies, success rate and minimum,
average and maximum response times.
When Trace Route is selected, the analyzer automatically runs a
trace route on the selected device. If the device is not in the host list,
its address or DNS name may be entered in the “Device” drop down.
Results displayed by the trace route are number of hops, name and IP
address of each device per hop and total round trip response times for
each hop. In addition, the OptiView analyzers’ trace route function can
also identify Split Routes and Route Flapping. The OptiView analyzer
may also be used to view the System Group, Routing and ARP tables of
all routers that separate the two hosts.
Fluke Networks OptiView™ Integrated Network Analyzer
10
Page 11

Trace SwitchRoute
The OptiView analyzers’ Trace SwitchRoute feature allows you to see the
exact path two devices use to communicate through your switch fabric.
The Trace SwitchRoute begins its discovery from the specified Source
Device and traces the path to the specified Target Device. For each
switch in the path, the displayed results include the name, address,
slot and port number together with link speed and VLAN information.
Highlighting any device in the Trace SwitchRoute name column and
selecting Host Detail will allow you to view information on that
device’s network configuration.
Fluke Networks OptiView™ Integrated Network Analyzer
11
Page 12

Interfaces (Multi-Port Statistics)
This screen allows you to view multi-port segments simultaneously,
thus enabling you to diagnose hard to analyze switched LAN segments.
It also allows you to see the activity on numerous locations on your
network.
The Interfaces screen provides graphical and tabular multi-port
views of switches and routers at a glance.
This test provides vision into the selected device in two distinctive
views:
Tabular View displays the devices interface table and, if the device is a
switch supporting the standards based switch forwarding table, will
display the host devices residing on the selected port. The display also
indicates the interface type, status and speed together with the slot
and port number, the Maximum Transmission Unit (MTU), MAC address,
and, using private MIB support for some vendors, will display VLAN
number. This view also incorporates a Find Host feature where the
analyzer will locate the port on the device where the host selected in
the Find Host box resides.
Fluke Networks OptiView™ Integrated Network Analyzer
12
Page 13

Graphical View displays port or interface statistics sorted by average
utilization, average errors or port/interface number. Any individual
port or interface may be selected to view more detailed statistics. If
the device supports RMON, the additional History Study button will
allow you to view historical information gathered by the device.
The WAN Vision option displays graphical information relating to T1/
E1, T3, Frame Relay, ATM and ISDN wide area links on routers that
support standards based MIBs.
Fluke Networks OptiView™ Integrated Network Analyzer
13
Page 14

Cable Test
The OptiView analyzer, when connected to a network using copper
media, will automatically perform a cable test and provide you with the
cable length to the attached device even into a live switch or hub port.
When you select the Twisted-Pair detail screen, you will see Cable Wire
Pair, Impedance, Length to End, Length to Reflection and Status or
Anomalies (shorts, opens, split-pairs) displayed in a tabular format.
Additional information such as Receive Pair, Transmit Pair, Receive
Voltage and Polarity is also displayed. The OptiView analyzer even
automatically compensates for a cross-over connection, continues to
function, and informs the user of an MID-X connection. Various cable
types may be selected and measurement units can be displayed in feet
or meters.
The OptiView analyzer can also measure the power or power loss in
optical fiber links using the optional DSP-FTK Fiber Test kit.
Fluke Networks OptiView™ Integrated Network Analyzer
14
Page 15

Packet Capture and Filter
For those more difficult to solve problems, the OptiView analyzer
integrates a full packet capture and decode function. The OptiView
analyzer is capable of full line-rate packet capture–even at gigabit
speeds.
Just select the Packet Capture tab and without any modifications,
start capturing packets on your network. However, for more selective
packet captures, use the context sensitive filter–just select the host
device from the device discovery screen, or a conversation from the
statistics screen, press the filter button and the packet capture engine
is automatically populated with source and/or source and destination
addresses of your selection. If you need even more selectivity, you can
select a host or conversation using a particular protocol just as easily.
Just as you would expect from a traditional protocol analyzer, the
OptiView analyzer’s packet capture screen allows you to set up the
capture buffer size, the slice size, the buffer configuration and various
other parameters.
Once you have the configuration you need, press Start Capture
and let the analyzer filter and capture while you make another
selection from the variety of tests to take a different view of your
network. The analyzer continues to capture packets while you look at
something else.
Fluke Networks OptiView™ Integrated Network Analyzer
15
Page 16

Decode
Once you are ready to view the captured packets, stop the capture,
press the Launch Packet Decoder button and launch the sophisticated
packet analysis tool on the packet capture buffer. Once again, all the
features you would expect, including display filters and buffer save and
export capabilities.
Fluke Networks OptiView™ Integrated Network Analyzer
16
Page 17

Traffic Generation
The OptiView Analyzer’s Traffic Generator allows you to create different
traffic loads to help stress test your network. The protocol type, frame
size, frame rate, percentage utilization and number of frames to
transmit are user configurable, along with the type of traffic:
Broadcast, Multicast or Unicast.
Protocols that may be selected include Benign Ethernet, Benign LLC
802.2, NetBEUI, Benign IP, IP ICMP Echo, IP UDP Echo, IP UDP
Discard, IP UDP NFS and IP UDP NetBIOS. Selecting an IP protocol will
also allow you to select Time to live (TTL) parameters and TOS(QOS)
parameters such as Minimum Delay, Maximum Throughput, Maximum
Reliability, Minimum Monetary Cost and Maximum Security.
The Traffic Generator also provides you with some preset traffic
conditions such as 50% of 512 Kbps, 50% of 1.5 Mbps, 50% of 10 Mbps
and 50% of 100 Mbps. The lower portion of the Traffic Generator
screen has a graphical representation of the traffic path and depending
on the traffic type selected will allow you to analyze switch statistics,
drill into routers and even perform a trace route measurement.
Fluke Networks OptiView™ Integrated Network Analyzer
17
Page 18

Reporting Features
While viewing the Statistics or Discovery screens, you may press the
Reports key to generate HTML reports on Protocols, Top Hosts, Top
Conversations, Devices, Networks and Problems. These reports are saved
in the OptiView analyzer and may be viewed locally or remotely using a
web browser.
Fluke Networks OptiView™ Integrated Network Analyzer
18
Page 19

Web Enabled Data Retrieval and Remote
User Interface
Simply point a Web Browser at the IP address of a correctly configured
OptiView analyzer to retrieve saved reports and capture files. While you
are there, select Install Remote User Interface and use your PC to
obtain remote access to an OptiView analyzer over a TCP/IP
connection. Once the Remote UI is installed, simply give the interface
the IP address of the OptiView analyzer you wish to monitor and see an
almost identical interface to the OptiView analyzer’s local interface.
Running from the Remote User Interface does not alter the OptiView
analyzer’s local interface. The Remote User Interface effectively shares
the network data acquisition card on the OptiView analyzer. Multiple
remote sessions may be run on a single OptiView analyzer.
Fluke Networks OptiView™ Integrated Network Analyzer
19
Page 20
Context Sensitive Help
The OptiView analyzer help is contextually linked to each screen. While
that help screen is displayed, you may select other information from
the table of contents, choose an index entry, or perform a full text
search on any help topic or term.
OptiView Analyzer Set-up
TCP/IP
When the analyzer is first connected to the network, it will attempt to
determine configuration settings using DHCP. If there is no DHCP
response, the analyzer will look at its current configuration to
determine if it is valid. If it is invalid, the analyzer will select a local
IP subnet based on which IP subnet has the most hosts and then pick
an unused IP address valid for the subnet. If another device on the
subnet with the same IP address as the analyzer is connected, the
analyzer will automatically discontinue use of that address and warn
the user in the status bar and also in the problem discovery.
Fluke Networks OptiView™ Integrated Network Analyzer
20
Page 21
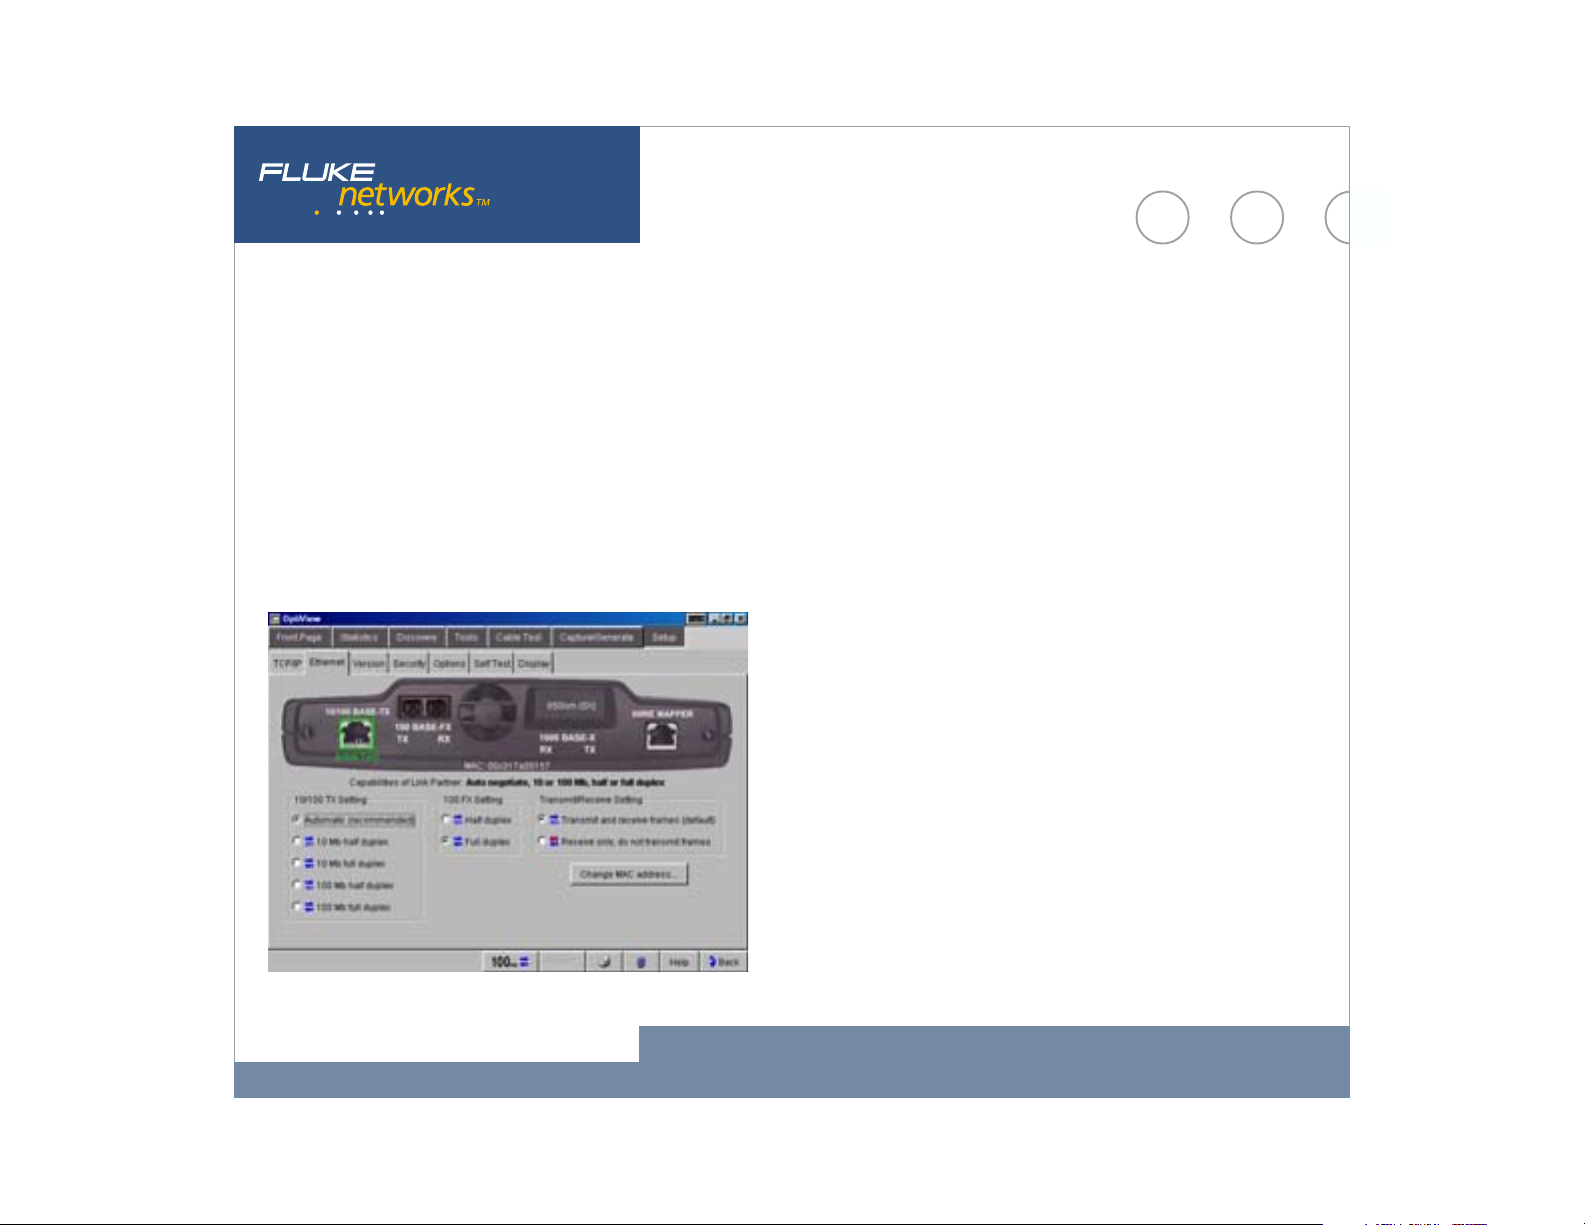
Ethernet
The Ethernet Setup screen allows you to override the default Ethernet
port settings. The default settings are all set to automatic. This screen
also shows you the link capabilities of the port to which the analyzer is
connected. The MAC address of the analyzer can be changed and placed
in a receive only mode where no frames are transmitted.
Security
This screen provides access to analyzer security settings for packet
capture, remote access and SNMP configuration. The feature allows you
to selectively disable certain functions on the analyzer by requiring the
use of a password. This feature also allows for entry of analyzer Read
and Read/Write community strings for remote access of the RMON2
agent and also allows you to enter community strings used to
interrogate your managed devices.
Self Test
Provides access to the functional verification tests available in the
OptiView analyzer.
Display
This screen allows you to control the brightness and contrast of the
analyzers screen. Additionally, it can be used to calibrate the touch
screen and to adjust the component size from a larger to a smaller
touch target size.
Fluke Networks OptiView™ Integrated Network Analyzer
21
Page 22

OptiView Reporter - Optional Reporting Software
Generate network performance reports using the OptiView analyzer and
the PC-based OptiView Reporter software package. OptiView Reporter
collects data from the OptiView analyzer running on your local segment
and then presents the information in professionally-formatted
documents. With one mouse click, you can create reports of IP or
NetBIOS devices, Top Protocols and Applications by Host, and
document Ethernet collisions, utilization, and errors. The reports can
be published in variety of formats, including HTML.
Fluke Networks OptiView™ Integrated Network Analyzer
22
Page 23
Professional Switch Vision Suite
The Professional Switch Vision Suite turns OptiView into a complete
solution for control of switched environments. A few years ago, a
protocol analyzer gave you total network visibility. But then switched
networks came along and left you in the dark. That’s why we developed
our new Professional Switch Vision Suite. This powerful package of
visionary network management products works with OptiView to
monitor, analyze and troubleshoot, giving you control of every
situation that pops up. You get enterprise-wide vision with the power
to drill down seven layers deep.
You can illuminate problems through the application layer with our
OptiView™ Protocol Expert. It can analyze capture files from OptiView
for full seven-layer decodes with expert analysis. Advanced filtering
and triggering let you find offending packets. And, our OptiView™
Inspector Console software monitors and trends all the ports in your
switched network. Or, set it up to collect data from your OptiView. With
a single click, you can generate spanning tree and switched server
connection diagrams with our unique link to Visio® software. And if a
key device, router, or switch port is overloaded, you’ll know about it in
a heartbeat.
Fluke Networks OptiView™ Integrated Network Analyzer
23
Page 24
Specifications
General Specifications
Weight • Without external battery 2.1 kilograms (4.6 lbs)
• With external battery 2.8 kilograms (6.2 lbs)
Dimensions 26.0 x 23.4 x 6.4 centimeters (10.3 x 9.2 x 2.5 inches)
Display LCD touch screen, 640 x 480 pixels, passive color panel, active area 157.42 mm x 118.06 mm, CCFT back-light
and bezel, touch pad
LED indicators 16 (21 with external battery)
Power
Internal battery Lithium Ion 10.8V DC (nominal), 2.2Ah
External battery Lithium Ion 10.8V DC (nominal), 4.7Ah
External AC adapter/battery charger AC input: 120V - 240V, 50/60Hz, 1.5A
DC output: 15V, 3.3A
Ports
Communication and accessory ports 2 USB, 1 multibus PCMCIA (PC Card type II), 1 DB-9 serial, 1 PS2 compatible key-board, 1 PS2 compatible mouse
Network analysis ports RJ-45 10/100BASE-T Ethernet, Fiber 100BASE-FX (OptiView Pro, Pro Gigabit), fiber 1000BASE-X GBIC(OptiView Pro
Gigabit)
Network Standards
LAN Interfaces IEEE 10BASE-T, IEEE 100BASE-TX, IEEE 100BASE-F, IEEE 1000BASE-X
Standard SNMP MIBs Used RFCs: 1213, 1231, 1239, 1285, 1493, 1512, 1513, 1643, 1757, 2021, 2108, 2115
Media
Cable Types • Unshielded Twisted Pair LAN cables (100 and 120 Ohm UTP category 3, 4, 5, 5E, and 6 ISO/IEC Class C and D)
• Foil-screened Twisted Pair cables (100 and 120 Ohm ScTP category 3, 4, 5, and 6 ISO/IEC Class C and D)
Cable Length
Characteristic Impedance • 50 to 150 Ohms, cables 3-5 m (10-16 ft.) +/- (5 Ohms +10%)
1
Resolution 0.1m (1ft)
• 50 to 150 Ohms, cables >5 m (16 ft.) +/- (5 Ohms +5%) Resolution: 1 Ohm
Fluke Networks OptiView™ Integrated Network Analyzer
24
Page 25

Specifications
Media Continued
Receive Level 100 to 5000mVp-p, +/- 5% Resolution: 1 Ohm
Datalink Signal 500mVp-p to 4000mVp-p Resolution: 10mV
Measuring Terminated Cables Able to analyze individual twisted-pairs of a cable that are terminated into most equipment vendors’ Ethernet
ports such as on a hub, switch or NIC. All cable tests other than wiremap and office locator ID are operational in
the presence of datalink signal.
GBIC Identification Identifies and operates with the following GBIC module types per SFF Document Number SFF-8053, Gigabit
Interface Converter, Rev. 5.4: LX (1300nm), SX (850nm)
Wiremapper/Office Locator Compatibility Detects combinations of shorts, opens, and connector miswires. Compatible with wire mapper/office locators
(also called wire map adapter) labeled for Fluke Networks OptiView analyzer
Open, short or with wire map adapter 1 to 305m (3ft to 1000ft) +/- [2% of reading + 0.3m (1ft)]
Terminated with >=15% reflection 1 to 153m (3ft to 500ft) +/- [5% of reading + 0.3m (1ft)]
Environmental and Safety
Operating Temperature
Non-Operating Temperature -20° C to +60°C (-4° F to +140° F)
Approvals AC adapter/charger has UL, CSA, and CE approvals or other approvals valid in the USA, Canada, and Europe
Electromagnetic Interference Complies to EN61326, CLASS B Requirements. Exempt for USA and Canadian emissions regulations if it does not
Shock and vibration Meets requirements of MIL-PRF-28800F for Class 3 equipment
Laser Class 1 Laser Product, complies with 21 CFR 1040.10 and 1040.11, CFR(J)
Safety (CSA) Complies to CSA C22.2 No. 950 Canadian standards), and UL 1950 (US standards) (CE) Complies with
EMC Satisfies requirements of EN61326
1 Legnth accuracy is dependent on the actual cable under test matching the cable type selected on the Cable Test/Twisted-Pair detail screen and its
NVP (nominal velocity of propagation) matching that of the ideal cable of the selected type.
2 Battery will not charge below 12° C (53.0°F)
2
10° C to 30° C (50°F to 86° F) with up to 95% Relative Humidity
10° C to 40° C (50°F to 104° F) with up to 75% Relative Humidity
interfere with licensed communications
European Union directives EN60950 3rd edition and EN61326
Fluke Networks OptiView™ Integrated Network Analyzer
25
Page 26

Ordering Information
Model Description
OPV-STD OptiView Standard
OPV-PRO OptiView Pro
OPV-GIG OptiView Pro Gigabit (1000BASE-SX)
OPV-PRO/RHD OptiView Pro Integrated Network Analyzer with Removable
Hard Drive
OPV-GIG/RHD OptiView Pro Gigabit Integrated Network Analyzer with
Removable Hard Drive
OPV-STD/PSVS Professional Switch Vision Suite with OptiView Standard
OPV-PRO/PSVS Professional Switch Vision Suite with OptiView Pro
OPV-GIG/PSVS Professional Switch Vision Suite with OptiView Pro Gigabit
OPV-PRO/PSVS/RHD Professional Switch Vision Suite with OptiView Pro
Integrated Network Analyzer Removable Hard Drive
OPV-GIG/PSVS/RHD Professional Switch Vision Suite with OptiView Pro
Gigabit Integrated Network Analyzer Removable Hard Drive
Fluke Networks OptiView™ Integrated Network Analyzer
26
Page 27

Accessories and Options
Model Description
OPV-WV OptiView WAN Vision Option
OPV-WNA OptiView Wireless Network Analyzer Option
OPV-RPT OptiView Reporter
NIS-OPV OptiView Inspector Console
(includes OptiView Reporter)
OPV-SX 1000BASE-SX GBIC
OPV-LX 1000BASE-LX GBIC
OPV-T 1000BASE-T GBIC
OPV-CIK Cable Identifier Kit #2 - 6
OPV-KB Mini Keyboard
OPV-BP External Battery Pack
OPV-RHD Removable Hard Drive for OPV-PRO/RHD or OPV-GIG/RHD
OPV-RHD/4 Pack of four Removable Hard Drives for OPV-PRO/RHD
or OPV-GIG/RHD
OPV-FT500 OptiView Fiber Inspector
NF430 Fiber Optic Cleaning Kit
DSP-FTK Fiber Test Kit
Fluke Networks OptiView™ Integrated Network Analyzer
27
Page 28

Our Gold SuperVision Support plans give you
exclusive services and 24/7 technical assistance.
Sign up for our Gold SuperVision Customer Support plan and you’ll
enjoy outstanding privileges to protect and add value to your
investment in Fluke Networks equipment. They include unlimited
technical assistance seven days a week, 24 hours a day via phone or
at our web site support center. Repairs on covered items and “next
day” dispatched loaner units for uninterrupted service. Free software
Included with OptiView: Soft carrying case, instrument strap (not shown),
external battery pack, cable identifier, ac adapter/charger, stylus, Getting
Started Guide, At a glance quick reference guide, and setup card.
upgrades. Scheduled annual performance verification service. Web
based training. Access to our extensive Knowledge Base library of
operation and application related technical articles. And Gold “Members
Only” special prices and promotions. Some benefits are not available in
all countries. See www.flukenetworks.com/goldsupport for more
information.
NETWORKSUPERVISION
Fluke Networks, Inc.
P.O. Box 777, Everett, WA USA 98206-0777
(800) 283-5853 Fax (425) 446-5043
Western Europe
00800 632 632 00, +44 1923 281 300
Fax 00800 225 536 38, +44 1923 281 301
Email: info-eu@flukenetworks.com
Canada (800) 363-5853 Fax (905) 890-6866
EEMEA +31 (0)40 267 5119
Fax +31 (0)40 267 5180
Other countries call (425) 446-4519
Fax (425) 446-5043
E-mail: fluke-assist@flukenetworks.com
Web access: http://www.flukenetworks.com
2002 Fluke Networks, Inc. All rights reserved.
©
Printed in U.S.A. 11/2002 1590227 D-ENG-N Rev E
Fluke Networks OptiView™ Integrated Network Analyzer
28
 Loading...