

Page 1
Technical Data Sheet
™
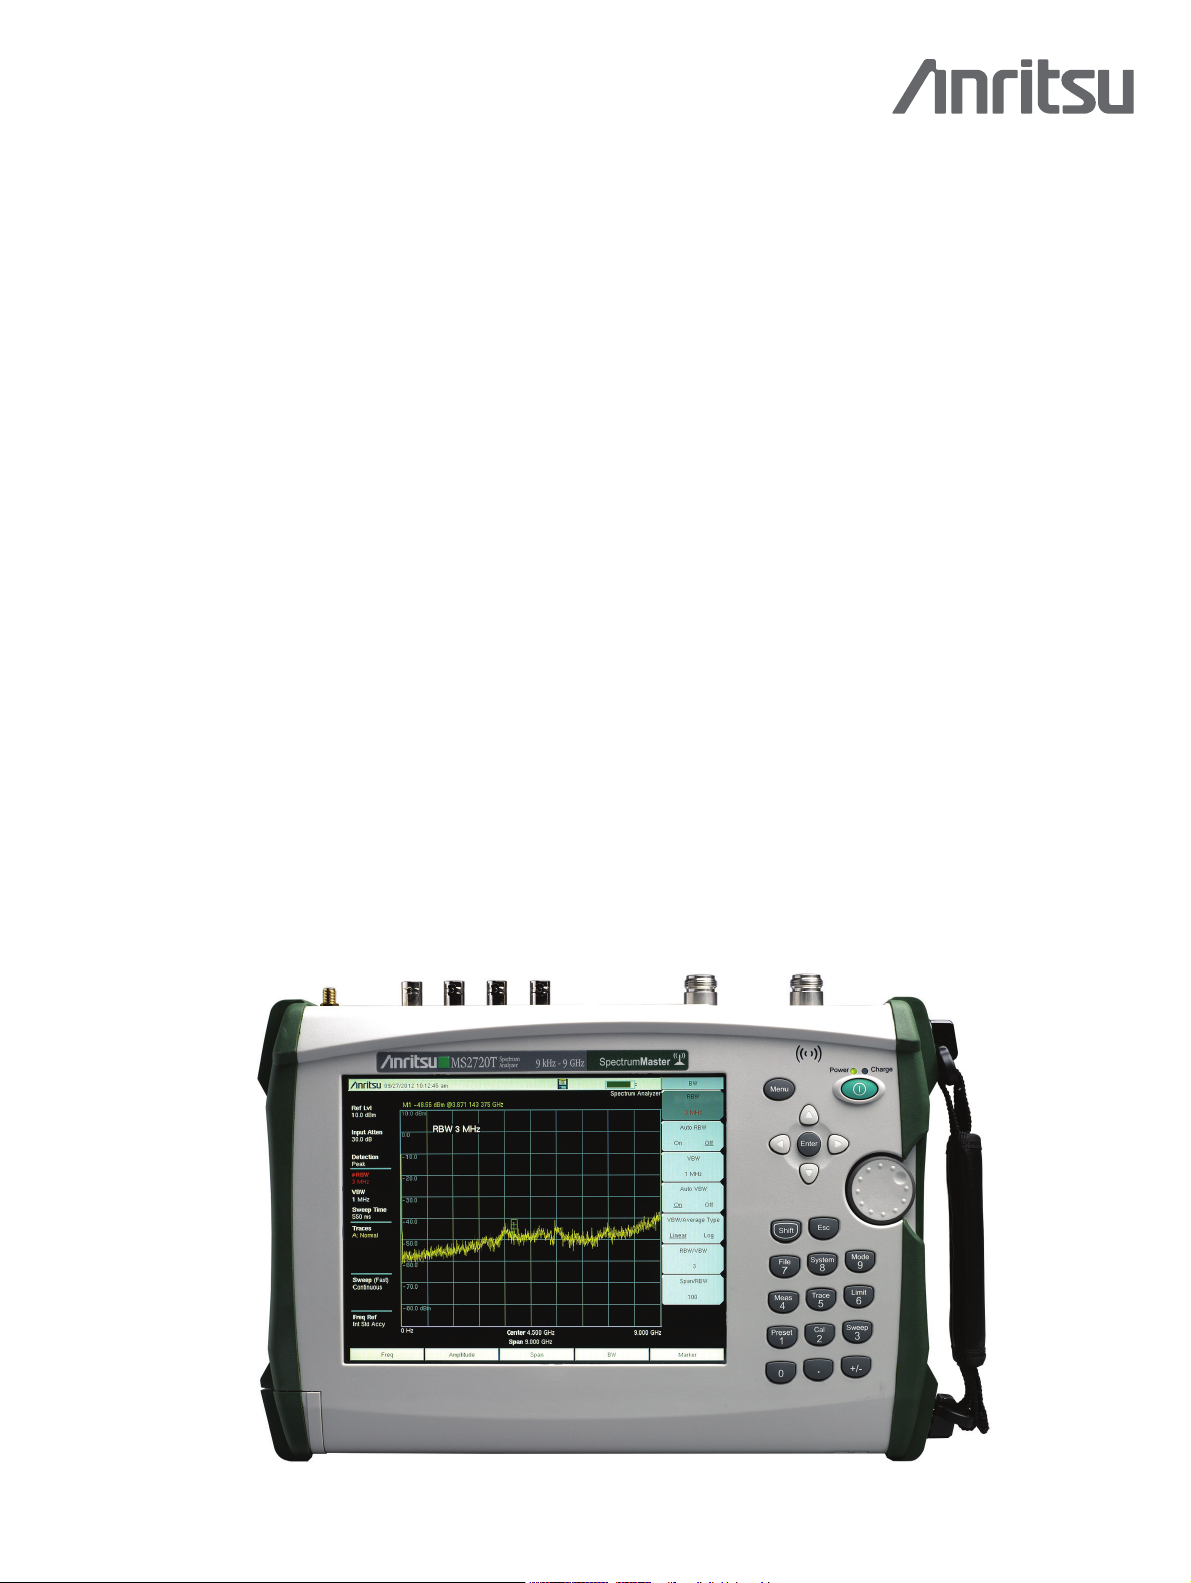
Spectrum Master
High Performance Handheld Spectrum Analyzer
MS2720T
9 kHz to 9 GHz, 13 GHz, 20 GHz, 32 GHz, 43 GHz
Introduction
From Anritsu, the inventor of the handheld spectrum analyzer first introduced in 1999, we are proud to introduce our
th
generation Spectrum Master MS2720T. The MS2720T represents the highest performance handheld spectrum
7
analyzers available in the world as Anritsu pushes the envelope closer to benchtop quality. This generation introduces a
touch screen, full-band tracking generators to 20 GHz, and best-in-class performance for dynamic range, DANL, phase
noise, and sweep speed.
Spectrum and Interference Analyzer Highlights
•
Measure: Occupied Bandwidth, Channel Power, ACPR, C/I,
Field Strength, Spectral Emissions
•
Measure Interference: Spectrogram, Signal Strength, RSSI
•
Dynamic Range: > 106 dB in 1 Hz RBW
•
DANL: –163dBm in 1Hz RBW
•
Phase Noise: –112dBc/Hz @10kHz offset at 1GHz
•
Resolution Bandwidth (RBW): 1 Hz to 10 MHz
•
Full-band Tracking Generators: 9, 13, 20 GHz
•
Full-band Preamplifiers: included at no charge
•
Channel Scanner: scan up to 20 channels at once
•
Burst Detect™ Sweep Mode: Sweep 1000x in 15 MHz span
•
Coverage Mapping: plot RSSI on on-screen map
•
Interference Mapping: on-screen mapping with triangulation
•
Operation to +55 ºC: full performance on AC or battery
Capabilities and Functional Highlights
Wireless Measurements
•
GSM/GPRS/EDGE
•
W-CDMA/HSPA+
•
TD-SCDMA/HSPA+
•
LTE FDD/TDD
•
CDMA/EV-DO
•
WiMAX Fixed/Mobile
•
Zero-span IF Output
•
I/Q Waveform Capture
•
Gated Sweep
•
AM/FM/PM Demodulator
•
High Accuracy Power Meter
up to 26 GHz USB Sensors
•
Three Hour Battery
Spectrum Master™ MS2720T Spectrum Analyzer
Handheld Size: 315mm x 211mm x 77mm (12.4in x 8.3in x 3.0in), Lightweight: 3.7kg to 4.4kg (8.1lb to 9.8lb)
Page 2

Spectrum Analyzer Specifications Spectrum Master™ MS2720T
Spectrum Analyzer
All specifications and characteristics apply to Revision 2 instruments under the following conditions, unless otherwise stated: 1) After 5 minutes of warm-up time, where the
instrument is left in the ON state; 2) Apply when using internal reference and performance sweep mode; 3) Subject to change without notice; 4) Typical performance is the
measured performance of an average unit; 5) Recommended calibration cycle is 12 months.
Measurements
Smart Measurements Field Strength (dBm/m2, dBW/m2, V/m, A/m, Watt/m2, Watt/cm2, or dBmV/m)
Occupied Bandwidth (measures 99 % to 1 % power channel of a signal)
Channel Power (measures the total power in a specified bandwidth)
ACPR (adjacent channel power ratio)
AM/FM/SSB Demodulation (AM, wide/narrow FM, upper/lower SSB), (audio out only)
C/I (carrier-to-interference ratio)
Emission Mask (recall limit lines as emission mask)
Setup Parameters
Frequency Center/Start/Stop, Span, Frequency Step, Frequency Offset, Signal Standard, Channel #
Amplitude Reference Level (RL), Scale, Attenuation Auto/Level, RL Offset, Pre-Amp On/Off, Detection
Span Span, Span Up/Down (1-2-5), Full Span, Zero Span, Last Span
Bandwidth RBW, Auto RBW, VBW, Auto VBW, RBW/VBW Ratio, Span/RBW Ratio
Sweep Functions
Sweep Single/Continuous, Manual Trigger, Reset, Detection, Minimum Sweep Time, Trigger Type
Sweep Mode Fast (100x Performance), Performance, No FFT, Burst Detect (1000x Fast in 15 MHz span)
Detection Peak, RMS/Avg, Negative, Sample, Quasi-peak
Triggers Free Run, External, Video, Manual, IF Power
Trigger Position Delay, Level, Slope, Hysteresis, Holdoff, Force Trigger Once
Trace Functions
Trace A Operations Normal, Max Hold, Min Hold, Average, # of Averages, (always the live trace)
Trace B Operations A
Trace C Operations A
Marker Functions
Marker Types Style (Fixed/Tracking), Noise Marker, Frequency Counter Marker
Marker Auto-Position Peak Search, Next Peak (Right/Left), Peak Threshold %, Set Marker to Channel,
Marker Table 1-6 markers frequency and amplitude, plus delta markers frequency offset and amplitude
Limit Line Functions
Limit Line Edit Frequency, Amplitude, Add Point, Add Vertical, Delete Point, Next Point Left/Right
Limit Line Move To Current Center Frequency, By dB or Hz, To Marker 1, Offset from Marker 1
Limit Line Envelope Create Envelope, Update Amplitude, Number of Points (41), Offset, Shape Square/Slope
Limit Line Advanced Type (Absolute/Relative), Mirror, Save/Recall
Frequency
Frequency Range (usable to 0 Hz)
MS2720T-0709 9 kHz to 9 GHz
MS2720T-0713 9 kHz to 13 GHz
MS2720T-0720 9 kHz to 20 GHz
MS2720T-0732 9 kHz to 32 GHz
MS2720T-0743 9 kHz to 43 GHz
Tuning Resolution 1 Hz
Frequency Reference Aging: ± 1.0 x 10
Auto-sensing External Frequency
Reference (MHz) 1, 1.2288, 1.544, 2.048, 2.4576, 4.8, 4.9152, 5, 9.8304, 10, 13, 19.6608
Sweep Time Accuracy ± 2 % in zero span
Traces Up to three Traces (A, B, C), View/Blank, Write/Hold, Trace A/B/C Operations
→
B, B←→C, Max Hold, Min Hold
→
C, B←→C, Max Hold, Min Hold, A – B→C, B – A→C, Relative Reference (dB), Scale
Markers Markers 1-6 each with a Delta Marker, or Marker 1 Reference with Six Delta Markers,
Limit Lines Upper/Lower, On/Off, Edit, Move, Envelope, Advanced, Limit Alarm, Default Limit
Sweep Time 10 µs to 600 s in zero span
Marker Table (On/Off/Large), All Markers Off
Marker Frequency to Center, Delta Marker to Span, Marker to Reference Level
–6
per 10 years
–6
Accuracy: ± 0.3 x 10
(see Options 1 and 31 for improved frequency reference aging and accuracy)
(25 °C ± 25 °C) plus aging
Bandwidth
Resolution Bandwidth (RBW) 1 Hz to 10 MHz in 1–3 sequence ± 10 % (–3 dB bandwidth)
Video Bandwidth (VBW) 1 Hz to 10 MHz in 1–3 sequence (–3 dB bandwidth)
RBW with Quasi-Peak Detection 200 Hz, 9 kHz, 120 kHz (–6 dB bandwidth)
VBW with Quasi-Peak Detection Auto VBW is On, RBW/VBW = 1
VBW/Average Type Linear/Log
2 of 24 PN: 11410-00646 Rev. H MS2720T TDS
Page 3

Spectrum Master™ MS2720T Spectrum Analyzer Specifications
Spectrum Analyzer
(continued)
Spectral Purity – SSB Phase Noise at 1 GHz
Offset
Maximum
10 kHz
100 kHz
1MHz
10 MHz
–108 dBc/Hz
–110 dBc/Hz
–118 dBc/Hz
–129 dBc/Hz
Amplitude Ranges
Dynamic Range >106 dB minimum at 2.4 GHz, 2/3 (TOI-DANL) in 1 Hz RBW
Measurement Range DANL to +30 dBm
Display Range 1 to 15 dB/div in 1 dB steps, ten divisions displayed
Reference Level Range –120 dBm to +30 dBm
Attenuator Resolution 0 to 65 dB, 5.0 dB steps
Amplitude Units Log Scale Modes: dBm, dBV, dBmV, dBμV
Maximum Continuous Input +30 dBm Peak typical, ± 50 VDC (≥ 10 dB Attenuation)
Linear Scale Modes: nV, μV, m V, V, k V, n W, μW, m W, W, k W
+23 dBm Peak typical, ± 50 VDC (< 10 dB Attenuation)
+13 dBm Peak typical, ± 50 VDC (Preamp = ON)
Amplitude Accuracy
(after 30 minute warm-up)
9GHz Instrument
9 kHz to 100 kHz
100 kHz to 7 GHz
>7GHz to 9GHz
20 GHz Instruments
100 kHz to 13 GHz
>13GHz to 18GHz
>18GHz to 20GHz
43 GHz Instruments
> 100 kHz to 13 GHz
>13GHz to 40GHz
>40GHz to 43GHz
a. Values below 100 kHz are with the preamplifier turned off.
a
Maximum
–
±1.3dB
±1.8dB
±1.3dB
±2.3dB
–
±1.3dB
±2.3dB
–
9 GHz Instrument 13 GHz to 43 GHz Instruments
Typical
–106 dBc/Hz
–110 dBc/Hz
–116 dBc/Hz
–129 dBc/Hz
Typical
±1.0dB
±0.5dB
±0.5dB
±05dB
±0.5dB
±1.0dB
±0.5dB
±0.5dB
±1.0dB
20 °C to 30 °C
Typical
–112 dBc/Hz
–115 dBc/Hz
–123 dBc/Hz
–133 dBc/Hz
Typ ical
±1.0dB
±0.5dB
±0.5dB
±0.5dB
±0.5dB
±1.0dB
±0.5dB
±0.5dB
±1.0dB
Maximum
–102 dBc/Hz
–106 dBc/Hz
–111 dBc/Hz
–123 dBc/Hz
–1
(after 60 minute warm-up)
Maximum
–
±2.3dB
±2.8dB
±2.3dB
±3.3dB
–
±2.3dB
±3.3dB
–
0°C to 55°C
Displayed Average Noise Level (DANL)
Preamp On, Performance Sweep Mode)
9GHz Instrument
10 MHz to 3 GHz
>3GHz to 8GHz
>8GHz to 9GHz
13 to 43 GHz Instruments
10 MHz to 4 GHz
>4GHz to 9GHz
> 9 GHz to 13 GHz
20 GHz Instrument
> 13 GHz to 20 GHz –138 dBm –141 dBm –157 dBm –160 dBm
32 to 43 GHz Instruments
> 13 GHz to 32 GHz
> 32 GHz to 40 GHz
> 40 GHz to 43 GHz
Maximum
–146 dBm
–140 dBm
–145 dBm
–142 dBm
–136 dBm
–135 dBm
–127 dBm
Spurs
Residual Spurs
<13GHz
13 to 20 GHz
> 20 to 32 GHz
> 32 to 43 GHz
Input-Related Spurious –60 dBc, –70 dBc typical (0 dB attenuation, –30 dBm input, span < 1.7 GHz)
(RMS detection, VBW/Avg type = Log, Ref Level = –20 dBm for Preamp Off and –50 dBm for
Preamp = Off Preamp = On
–
–
Preamp = Off
–90 dBm, maximum
–85 dBm, maximum
–80 dBm, maximum
–80 dBm, maximum
Typ ical
–149 dBm
–143 dBm
–142 dBm
–148 dBm
–145 dBm
–139 dBm
–138 dBm
–130 dBm
–130 dBm
(RF input terminated, 0 dB input attenuation)
Maximum
–160 dBm
–152 dBm
–
–161 dBm
–159 dBm
–156 dBm
–154 dBm
–148 dBm
–
Preamp = On
–100 dBm, maximum
–100 dBm, maximum
–100 dBm, maximum
–95 dBm, maximum
Typical
–163 dBm
–155 dBm
–155 dBm
–164 dBm
–162 dBm
–159 dBm
–157 dBm
–151 dBm
–151 dBm
MS2720T TDS PN: 11410-00646 Rev. H 3 of 24
Page 4

Spectrum Analyzer Specifications Spectrum Master™ MS2720T
Spectrum Analyzer
Third-Order Intercept (TOI)
50 MHz to 20 GHz +20 dBm typical
> 20 GHz to 32 GHz +15 dBm typical
> 32 GHz to 43 GHz +20 dBm typical
(continued)
(–20 dBm tones 100 kHz apart, 0 dB Attenuation Preamp OFF)
2.4GHz +14dBm minimum
P1dB
< 4 GHz 5 dBm typical
4 GHz to 20 GHz 12 dBm typical
> 20 GHz to 32 GHz 7 dBm typical
> 32 GHz to 43 GHz 12 dBm typical
Second Harmonic Distortion
VSWR
(> 10 dB input attenuation)
9 GHz Instruments
<4GHz 1.5:1 typical
4GHz to 8GHz 1.8:1 typical
13 GHz to 43 GHz Instruments
< 20 GHz 1.5:1 typical
20 GHz to 43 GHz 2.0:1 typical
(0 dB input attenuation, –30 dBm input)
50 MHz –54 dBc maximum
Internal Atomic Clock (Option 1)
Frequency Accuracy 1 x 10⁻⁹ + aging
Aging Rate 1 x 10
Initial Warmup 10 minutes to meet the accuracy specification
-9
per year
High Accuracy Power Meter (Option 19)
Power Sensor Model PSN50 MA24105A MA24106A MA24108A/18A/26A
Measurement Uncertainty ± 0.16 dB
(for complete specifications)
Amplitude Maximum, Minimum, Offset, Relative On/Off, Units, Auto Scale
Average # of Running Averages, Max Hold
Zero/Cal Zero On/Off, Cal Factor (Center Frequency, Signal Standard)
Limits Limit On/Off, Limit Upper/Lower
Description High Accuracy
Frequency Range 50 MHz to 6 GHz 350 MHz to 4 GHz 50 MHz to 6 GHz 10 MHz to 8/18/26 GHz
Connector Type N(m), 50 Ω Type N(f ) , 5 0 Ω Typ e N ( m ) , 5 0 Ω Type N(m), 50 Ω
Dynamic Range
VBW 100 Hz 100 Hz 100 Hz 50 kHz
Measurand True-RMS True-RMS True-RMS True-RMS, Slot Power,
Data sheet
Notes:
RF Power Sensor
–30 dBm to +20 dBm
(0.001 mW to 100 mW)
1
11410-00414 11410-00621 11410-00424 11410-00504
1. Total RSS measurement uncertainty (0 ºC to 50 ºC) for power measurements of a CW signal greater than –20 dBm with
zero mismatch errors.
2. Expanded uncertainty with K=2 for power measurements of a CW signal greater than +20 dBm with a matched load.
Measurement results referenced to the input side of the sensor.
3. Expanded uncertainty with K=2 for power measurements of a CW signal greater than –20 dBm with zero mismatch
errors.
(Requires external USB Power Sensor)
Inline High
Power Sensor
+3 dBm to +51.76 dBm
(2 mW to 150 W)
± 0.17 dB
2
–40 dBm to +23 dBm
(0.1 µW to 200 mW)
High Accuracy
RF Power Sensor
±0.16 dB
1
Microwave USB
Power Sensor
(8/18 GHz)
Type K(m), 50 Ω
(26 GHz)
–40 dBm to +20 dBm
(0.1 µW to 100 mW)
Burst Average Power
± 0.18 dB
3
4 of 24 PN: 11410-00646 Rev. H MS2720T TDS
Page 5

Spectrum Master™ MS2720T Spectrum Analyzer Specifications
Tracking Generator (Options 809, 813, and 820)
Setup Parameters
Frequency Center/Start/Stop, Span, Signal Standard, Channel #, Frequency Step/Offset, Channel Offset
Amplitude Reference Level (RL), Scale, Attenuation Auto/Level, RL Offset, Units, Pre-Amp, Detection
Span Span, Span Up/Down (1-2-5), Full Span, Zero Span, Last Span
Bandwidth RBW, Auto RBW, VBW, Auto VBW, VBW/Average Type (Linear/Log), RBW/VBW Ratio, Span/RBW Ratio
Generator On/Off, Output Power, Mode (CW/Tracking), Settings, Transmission Measurement
Tracking Generator Settings External Gain/Loss, Power Statistics (On/Off)
Transmission Measurement Settings Normalize (Off/On), Scale, Reference Position and Amplitude, Transmission Statistics and Offset
Maximum Continuous Input +23 dBm, ± 50 VDC
Frequency
MS2720T-0809 100 kHz to 9 GHz
MS2720T-0813 100 kHz to 13 GHz
MS2720T-0820 100 kHz to 20 GHz
Frequency Accuracy Aging: ± 1.0 x 10
Frequency Range
–6
Accuracy: ± 0.3 x 10
per 10 years
–6
(25 °C ± 25 °C) plus aging
Output Power
100 kHz to 20 GHz –40 dBm to 0 dBm
Step Size 0.1 dB nominal
Dynamic Range
9 GHz Instrument > 110 dB typical 100 kHz to 7 GHz
13 GHz and 20 GHz Instruments > 100 dB typical 100 kHz to 12 GHz
Level Accuracy
(At least 30 minute warm-up after 1 hour non-operating at 15 to 35 °C ambient, excludes load VSWR effects)
Frequency Range
100 kHz to 9 GHz
> 9 GHz to 13 GHz
>13GHz to 18GHz
> 100 dB typical > 7 GHz to 9 GHz
>80dB typical >12GHz to 20GHz
20 °C to 30 °C
(after 30 minute warm-up)
Maximum
±1.5dB
±1.6dB
±2.0dB
Typ ical
±0.5dB
±1.0dB
±1.0dB
0°C to 50°C
(after 60 minute warm-up)
Maximum
±2.0dB
±2.1dB
±2.5dB
±1.0dB
±1.5dB
±1.5dB
VSWR
100kHz to 5GHz 2:1 typical
> 5 GHz to 20 GHz 4:1 typical
Typ ical
Interference Analyzer (Option 25)
Measurements
Spectrum Field Strength
Spectrogram Collect data up to 72 hours
Signal Strength Gives visual and aural indication of signal strength
Received Signal Strength Indicator (RSSI) Collect data up to 72 hours
Signal ID ID up to 12 FM, GSM, W-CDMA, CDMA or Wi-Fi signals based on RF bandwidth
Interference Mapping Draw bearing of signal strength from GPS location on on-screen map
Application Options Impedance (50 Ω, 75 Ω, Other)
Occupied Bandwidth
Channel Power
Adjacent Channel Power (ACPR)
AM/FM/SSB Demodulation (Wide/Narrow FM, Upper/Lower SSB), (audio out only)
Carrier-to-Interference ratio (C/I)
Compatible with the MA2700A InterferenceHunter™ Handheld Direction Finding System
Channel Scanner (Option 27)
General
Number of Channels 1 to 20 Channels (Power Levels)
Measurements Graph/Table, Max Hold (On/5 s/Off), Frequency/Channel, Current/Maximum, Dual Color
Scanner Scan Channels, Scan Frequencies, Scan Custom List, Scan Script Master™
Amplitude Reference Level, Scale
Custom Scan Signal Standard, Channel, # of Channels, Channel Step Size, Custom Scan
Frequency Range 9 kHz to 9, 13, 20, 32, or 43 GHz
Frequency Accuracy ± 10 Hz + time base error
Measurement Range –110 dBm to +30 dBm
Application Options Impedance (50 Ω, 75 Ω, Other)
MS2720T TDS PN: 11410-00646 Rev. H 5 of 24
Page 6
Spectrum Analyzer Specifications Spectrum Master™ MS2720T
Coverage Mapping (Option 431)
Measurements
Indoor MappingRSSI, ACPR
Outdoor MappingRSSI, ACPR
Setup Parameters
Mode Spectrum Analyzer
Frequency Center/Start/Stop, Span, Freq Step, Signal Standard, Channel #, Channel Increment
Amplitude Reference Level (RL), Scale, Attenuation Auto/Level, RL Offset, Pre-Amp On/Off, Detection
Span Span, Span Up/Down (1-2-5), Full Span, Zero Span, Last Span
BW RBW, Auto RBW, VBW, Auto VBW, RBW/VBW Ratio, Span/VBW Ratio
Measurement Setup ACPR, RSSI
Point Distance / Time Setup Repeat Type Time Distance
Save Points Map Save KML, JPEG, Tab Delimited
Recall Points Map Recall Map, Recall KML Points only, Recall KML Points with Map, Recall Default Grid
GPS Receiver (Option 31)
Setup On/Off, Antenna Voltage 3.3 V/5.0 V, GPS Info
GPS Time/Location Indicator Time, Latitude, Longitude, and Altitude on display
High Frequency Accuracy
Connector SMA, female
Gated Sweep (Option 90)
Mode Spectrum Analyzer, Sweep
Trigger External TTL, IF Level
IF Trigger Level Full display range of instrument
Setup Gated Sweep (On/Off)
Note: Anritsu 2000-1528-R GPS antenna requires +5 VDC
Anritsu 2000-1652-R GPS antenna requires +3.3 VDC or +5 VDC
Time, Latitude, Longitude, and Altitude with trace storage
< ± 2.5 x 10⁻⁸ with GPS On, 3 minutes after satellite lock in selected mode
< ± 5.0 x 10⁻⁸ for 3 days after GPS lock, 0 °C to 50 °C ambient temperature
Gate Polarity (Rising, Falling)
Gate Delay (0 ms to 65 ms typical)
Gate Length (1 µs to 65 ms typical)
Zero Span Time
(GPS Antenna connected)
(GPS Antenna disconnected)
Zero Span IF Output (Option 89)
Mode Spectrum Analyzer/Span/Zero Span
Center Frequency 140 MHz
Output Level –25 dBm typical
Reference Level –57 dBm to +30 dBm (Preamp Off)
IF Bandwidths Up to 30 MHz (3 dB bandwidth)
RF Attenuation Auto
Connector BNC female
–87 dBm to –40 dBm (Preamp On)
I/Q Waveform Capture (Option 24)
Mode Spectrum Analyzer
Capture Mode Single or Continuous
Trigger Free Run, External (Rising/Falling), Delay
Maximum Capture Length 800 ms
Maximum Sample Rate 40 MHz
Maximum Signal Bandwidth 32 MHz
Secure Data (Option 7)
Set at Factory Save measurement files on external USB flash drive only
Internal memory is permanently disabled
6 of 24 PN: 11410-00646 Rev. H MS2720T TDS
Page 7

Spectrum Master™ MS2720T Spectrum Analyzer Specifications
AM/FM/PM Signal Analyzer (Option 509)
Measurements
Display
Type
Graphic
Display
Numerical
Displays
* Requires sine wave modulation
RF Spectrum
(AM/FM/PM)
Power (dBm)
vs.
Frequency
Carrier Power
Carrier Frequency
Occupied
Bandwidth
Setup Parameters
Amplitude Setup Scale, Power Offset, Adjust Range
Audio Spectrum
(AM)
Depth (%)
vs.
Modulation Frequency
AM Rate
RMS Depth
(Pk-Pk)/2 Depth
SINAD*
THD*
Distortion/Total
Vrms*
Audio Spectrum
(FM/PM)
Deviation (kHz/rad)
vs.
Modulation Frequency
FM/PM Rate
RMS Deviation
(Pk-Pk)/2
Deviation
SINAD*
THD*
Distortion/Total
Vrms*
Frequency Center Freq, Span, Freq Step, Signal Standard, Channel, Channel Increment, Set Carrier Freq
Measurements Demod Type (AM, FM, PM), IFBW, Auto IFBW RF Spectrum AM/FM/PM, Audio Spectrum (AM/FM/PM), Audio
Waveform (AM/FM/PM), Summary (AM/FM/PM), Average
Marker Delta, Peak Search, Marker Freq to Center, Marker to Ref Lvl, Marker Table
Audio
Waveform
(AM)
Depth (%)
vs.
Time
AM Rate
RMS Depth
(Pk-Pk)/2 Depth
SINAD*
THD*
Distortion/Total
Vrms*M Rate
RMS Depth
(Pk-Pk)/2 Depth
SINAD*
THD*
Distortion/Total
Vrms*
Audio Waveform
(FM/PM)
Deviation (kHz/rad)
vs.
Time
FM/PM Rate
RMS Depth
(Pk-Pk)/2 Depth
SINAD*
THD*
Distortion/Total
Vrms*
Summary
(AM)
None None
RMS Depth (AM)
Peak + Depth
Peak – Depth
(Pk-Pk)/2 Depth
Carrier Power
Carrier Frequency
Occupied
Bandwidth
AM Rate
SINAD*
THD*
Distortion/Total
Vrms*
Summary
(FM/PM)
RMS Deviation
(FM/PM)
Peak + Depth
Peak – Depth
(Pk-Pk)/2 Depth
Carrier Power
Carrier Frequency
Occupied
Bandwidth
AM Rate
SINAD*
THD*
Distortion/Total
Vrms*
RF and Modulation Measurements
AM Modulation Rate: ± 1 Hz (< 100 Hz), ± 2 % (> 100 Hz)
Depth: ± 5 % for (Modulation rates 10 Hz to 100 kHz)
FM Modulation Rate: ± 1 Hz (< 100 Hz); ± 2 % (100 Hz to 100 kHz)
Deviation Accuracy: ± 5 % (100 Hz to 100 kHz)**
PM Modulation Rate: ± 1 Hz (< 100 Hz); ± 2 % (100 Hz to 100 kHz)
Deviation Accuracy: ± 5 % (deviation 0 to 93 Rad, rate 10 Hz to 5 kHz)**
IF Bandwidth 1 kHz to 300 kHz in 1-3 sequence
Frequency Span RF Spectrum: 10 kHz to 10 MHz
RBW/VBW 30
Span/RBW 100
Sweep Time 50 µs to 50 ms (Audio Waveform)
Audio Spectrum: 2 kHz, 5 kHz, 10 kHz, 20 kHz, 70 kHz, 140 kHz
** IFBW must be greater than 95 % occupied BW
MS2720T TDS PN: 11410-00646 Rev. H 7 of 24
Page 8

Spectrum Analyzer Specifications Spectrum Master™ MS2720T
GSM/GPRS/EDGE Measurements (Option 880)
Measurements
RF Demodulation Over-the-Air (OTA) Pass/Fail
Channel Spectrum
Channel Power
Occupied Bandwidth
Burst Power
Average Burst Power
Frequency Error
Modulation Type
BSIC (NCC, BCC)
Multi-channel Spectrum
Power vs. Time (Frame/Slot)
Channel Power
Occupied Bandwidth
Burst Power
Average Burst Power
Frequency Error
Modulation Type
BSIC (NCC, BCC)
RF Summary
Setup Parameters
GSM/EDGE Select Auto, GSM, EDGE
Measurement Summary Screen Overall Measurements, RF Measurements, Modulation Measurements
Phase Error
EVM
Origin Offset
C/I
Modulation Type
Magnitude Error
BSIC (NCC, BCC)
Modulation Summary
Frequency Center, Signal Standard, Channel #, Closest Channel, Decrement/Increment Channel
Amplitude Power Offset, Auto Range, Adjust Range
Sweep Single/Continuous, Trigger Sweep
Save/Recall Setup, Measurement, Screen Shot (save only), to Internal/External Memory
There are no additional OTA
Measurements
RF and Demodulation Measurements
can be made OTA
View Pass/Fail Limits
All, RF, Demod
Available Measurements
Channel Power
Occupied Bandwidth
Burst Power
Average Burst power
Frequency Error
Phase Error
EVM
Origin Offset
C/I
Magnitude Error
Script Master™
RF Measurements
Frequency Error ± 10 Hz + time base error, 99 % confidence level
Occupied Bandwidth Bandwidth within which lies 99 % of the power transmitted on a single channel
Burst Power Error ± 1.5 dB, ± 1 dB typical, (–50 dBm to +20 dBm)
Demodulation Measurements
GMSK Modulation Quality (RMS Phase)
Measurement Accuracy ± 1
Residual Error (GSMK) 1
8 PSK Modulation Quality (EVM)
Measurement Accuracy ± 1.5 %
Residual Error (8 PSK) 2.5 %
º
º
8 of 24 PN: 11410-00646 Rev. H MS2720T TDS
Page 9

Spectrum Master™ MS2720T Spectrum Analyzer Specifications
W-CDMA/HSPA+ Measurements (Option 881)
Measurements
RF Demodulation Over-the-Air (OTA) Pass/Fail
Band Spectrum
Channel Spectrum
Channel Power
Occupied Bandwidth
Peak-to-Average Power
Spectral Emission Mask
Single carrier ACLR
Multi-carrier ACLR
RF Summary
Setup Parameters
Scrambling Code, Threshold Auto, Manual
Maximum Spreading Factor 256, 512
Measurement Summary Screens Overall Measurements, RF Measurements, Modulation Measurements
User Selectable Scrambling Code, S-CCPCH Spread, S-CCPCH Code, PICH Code, Threshold, Max Amp Power, CPICH Power,
Code Domain Power Graph
P-CPICH Power
Channel Power
Noise Floor
EVM
Carrier Feed Through
Peak Code Domain Error
Carrier Frequency
Frequency Error
Control Channel Power
Abs/Rel/Delta Power
CPICH, P-CCPCH
S-CCPCH, PICH
P-SCH, S-SCH
HSPA+
Power vs. Time
Constellation
Code Domain Power Table
Code, Status
EVM, Modulation Type
Power, Code Utilization
Power Amplifier Capacity
Codogram
Modulation Summary
Frequency Error Average
Frequency Center, Signal Standard, Channel #, Closest Channel, Decrement/Increment Channel
Amplitude Scale/Division, Power Offset, Auto Range, Adjust Range, Units (dBm/Watts)
Marker Six Markers, Table On/Off
Sweep Single/Continuous, Trigger Sweep
Save/Recall Setup, Measurement, Screen Shot (save only), to Internal/External Memory
Scrambling Code Scanner (Six)
Scrambling Codes
CPICH
E
c/Io
E
c
Pilot Dominance
OTA Total Power
Multipath Scanner (Six)
Six Multipaths
Tau
Distance
RSCP
Relative Power
Multipath Power
View Pass/Fail Limits
All, RF, Demod
Available Measurements
Max Output Power
Frequency Error
EVM
CPICH
Occupied Bandwidth
Spectral Mask
ACLR
PCDE
P-CCPCH
S-CCPCH
Code Spread 3
PICH
Code 128
Test Models
1 (16), (32), (64)
2
3 (16), (32)
4 (+CPICH), (-CIPCH)
5 (2 HS), (4 HS), (8 HS)
RF Measurements
RF Channel Power Accuracy ± 1.25 dB, ± 0.7 dB typical, (temperature range 15 °C to 35 °C)
Occupied Bandwidth Accuracy ± 100 kHz
Adjacent Channel Leakage Ratio (ACLR) –54 dB/-59 dB ± 0.8 dB @ 5 MHz/10 MHz offset, typical, 824 MHz to 894 MHz, 1710 MHz to 2170 MHz
–54 dB/-57 dB ± 1.0 dB @ 5 MHz/10 MHz offset, typical, 2300 MHz to 2700 MHz
Demodulation Measurements
W-CDMA Modulations QPSK, QPSK-DTX (Codecs: AMR 4.75, 5.9, 7.4, 12.2 kbps, DTX 7.4, 12.2 kbps)
HSPA+ Modulations QPSK, 16 QAM, 64 QAM
Frequency Error ± 10 Hz + time base error, 99 % confidence level
EVM Accuracy ± 2.5 %, 6 % ≤ EVM ≤ 25 %
Residual EVM 2.5 % typical
Code Domain Power ± 0.5 dB for code channel power > –25 dB,
CPICH (dBm) Accuracy ± 0.8 dB typical
16, 32, 64 DCPH (test model 1), 16, 32 DCPH (test model 2, 3)
Over-the-Air (OTA) Measurements
Scrambling Code Scanner Six strongest Scrambling Codes
Multipath Scanner Multipath power of six signals relative to strongest pilot
MS2720T TDS PN: 11410-00646 Rev. H 9 of 24
Page 10

Spectrum Analyzer Specifications Spectrum Master™ MS2720T
TD-SCDMA/HSPA+ Measurements (Option 882)
Measurements
RF Demodulation Over-the-Air (OTA) Pass/Fail
Channel Spectrum
Channel Power
Occupied Bandwidth
Left Channel Power
Left Channel Occ B/W
Right Channel Power
Right Channel Occ B/W
Power vs. Time
Six Slot Powers
Channel Power (RRC)
DL-UL Delta Power
UpPTS Power
DwPTS Power
On/Off Ratio
Slot Peak-to-Average Power
Spectral Emission
RF Summary
Setup Parameters
Scrambling/Midamble Code Auto, 0-127
Measurement Speed Fast, Normal, Slow
Demodulation Type Auto, QPSK, 8 PSK, 16 QAM, 64 QAM
Measurement Summary Screens Overall Measurements, RF Measurements, Signal Quality Measurements
Code Domain Power/Error
(QPSK/8 PSK/16 QAM/64 QAM)
Slot Power
DwPTS Power
Noise Floor
Frequency Error
Tau
Scrambling Code
EVM
Peak EVM
Peak Code Domain Error
CDP Marker
Modulation Summary
Slot Selection Auto, 0-6
Trigger Trigger Type (No Trigger/GPS/External), External Trigger (Rising/Falling), Tau Offset
SYNC-DL Code Auto, 0-31
Maximum Users Auto, 2, 4, 6, 8, 10, 12, 14, 16
User Selectable Uplink Switch Point, Number of Carriers (1, 3), Tau Offset
Frequency Center, Signal Standard, Channel #, Closest Channel, Decrement/Increment Channel
Amplitude Scale/Division, Power Offset, Auto Range, Adjust Range, Units (dBm/Watts)
Sweep Hold/Run, Trigger Sweep
Save/Recall Setup, Measurement, Screen Shot (save only), to Internal/External Memory
Code Scan (32)
Scrambling Code Group
Tau
E
c/Io
DwPTS Power
Pilot Dominance
Tau S c a n (S i x )
Sync-DL#
Tau
E
c/Io
DwPTS Power
Pilot Dominance
Record
Run/Hold
View Pass/Fail Limits
All, RF, Demod
Available Measurements
Occupied Bandwidth
Channel Power
Channel Power RCC
On/Off Ratio
Peak-to-Average Ratio
Frequency Error
EVM
Peak EVM
Peak Code Domain Error
Tau
Noise Floor
RF Measurements
RF Channel Power Accuracy (RRC) ± 1.5 dB, ± 1.0 dB typical, (slot power –40 dBm to +10 dBm)
Frequency Error ± 10 Hz + time base error, in the presence of a downlink slot
Demodulation Measurements
Supported Modulation QPSK, 8 PSK, 16 QAM, 64 QAM
Residual EVM (rms) 3 % typical, P-CCPH Slot Power > –50 dBm
Pilot Power Accuracy ± 1.0 dB typical
Timing Error (Tau) for Dominant SYNC-DL ± 0.2 µs (external trigger)
PN Offset Within 1 x 64 chips
Spreading Factor 1, 16
Over-the-Air (OTA) Measurements
Code Scanner 32 Sync Codes and associated Scrambling Code Groups
Tau Scanner Six strongest Sync Codes
Auto Save Yes
GPS Tagging and Logging Yes
10 of 24 PN: 11410-00646 Rev. H MS2720T TDS
Page 11

Spectrum Master™ MS2720T Spectrum Analyzer Specifications
LTE FDD/TDD Measurements (Option 883)
LTE FDD Measurements
RF Modulation Over-the-Air (OTA) Pass/Fail
Channel Spectrum
Channel Power
Occupied Bandwidth
ACPR
Spectral Emission Mask
Category A or B (Opt 1)
RF Summary
Setup Parameters
Measurement Summary Screens Overall Measurements, RF Measurements, Modulation Measurements
Bandwidth (MHz) 1.4, 3, 5, 10, 15, 20
Power vs. Resource Block (RB)
RB Power (PDSCH)
Active RBs, Utilization %
Channel Power, Cell ID
OSTP, EVM
Constellation
QPSK, 16 QAM, 64 QAM
Modulation Results
Ref Signal Power (RS)
Sync Signal Power (SS)
EVM – rms, peak, max hold
Frequency Error – Hz, ppm
Carrier Frequency
Cell ID
Control Channel Power
Bar Graph or Table View
RS, P-SS, S-SS
PBCH, PCFICH
Total Power (Table View)
Modulation Results
Tx Time Alignment
Modulation Summary
Includes EVM by modulation
Antenna Icons
Detects active antennas (1 or 2)
Modulation Summary
Frequency E-UTRA Bands 1 - 5, 7 - 14, 17 - 21, 24 (tunable 10 MHz to 4.0 GHz)
Center, Signal Standard, Channel #, Closest Channel, Decrement/Increment Channel
Span (MHz) Auto, 1.4, 3, 5, 10, 15, 20, 30
Amplitude Scale/Division, Power Offset, Auto Range, Adjust Range
Sweep Single/Continuous
EVM Mode Auto, PBCH only, Max Hold
Save/Recall Setup, Measurement, Screen Shot (save only), to Internal/External Memory
Scanner
Cell ID (Group, Sector)
S-SS, RSRP, RSRQ, SINR
Dominance
Modulation Results – On/Off
Tx Test
Scanner
RS Power of MIMO antennas
Cell ID, Average Power
Delta Power (Max-Min)
Graph of Antenna Power
Modulation Results – On/Off
Mapping
On-screen
S-SS, RSRP, RSRQ, or SINR
Scanner
Modulation Results – Off
View Pass/Fail Limits
All, RF, Modulation
Available Measurements
Channel Power
Occupied Bandwidth
ACLR
Frequency Error
Carrier Frequency
Dominance
EVM peak, rms
RS Power
SS, P-SS, S-SS Power
PBCH Power
PCFICH Power
Cell, Group, Sector ID
LTE FDD RF Measurements
RF Channel Power Accuracy ± 1.5 dB, ± 1.0 dB typical, (RF input –50 dBm to +10 dBm)
LTE FDD Modulation Measurements
RS Power Accuracy ± 1.0 dB typical, (RF input –50 dBm to +10 dBm)
Frequency Error ± 10 Hz + time base error, 99 % confidence level
Residual EVM (rms) 2.0 % typical (E-UTRA Test Model 3.1, RF Input –50 dBm to +10 dBm)
LTE FDD Over-the-Air (OTA) Measurements
Scanner Six strongest signals if present
Auto Save – Sync Signal power and Modulation Results with GPS information
Tx Test Scanner – Three strongest signals if present
Mapping Map On-screen S-SS, RSRP, RSRQ, or SINR of Cell ID with strongest signal
RS Power – Strongest signal
Scanner – three strongest signals if present
Save and Export Mapping data: *.kml, *.mtd (tab delimited)
MS2720T TDS PN: 11410-00646 Rev. H 11 of 24
Page 12

Spectrum Analyzer Specifications Spectrum Master™ MS2720T
LTE FDD/TDD Measurements (Option 883)
LTE TDD Measurements
RF Modulation Over-the-Air (OTA) Pass/Fail
Channel Spectrum
Channel Power
Occupied Bandwidth
Power vs. Time
Frame View
Sub-Frame View
Total Frame Power
DwPTS Power
Transmit Off Power
Cell ID
Timing Error
ACLR
Spectral Emission Mask
Category A or B (Opt 1)
RF Summary
Setup Parameters
Measurement Summary Screens Overall Measurements, RF Measurements, Modulation Measurements
Bandwidth (MHz) 1.4, 3, 5, 10, 15, 20
Power vs. Resource Block (RB)
RB Power (PDSCH)
Active RBs, Utilization %
Channel Power, Cell ID
Constellation
QPSK, 16 QAM, 64 QAM
Modulation Results
Ref Signal Power (RS)
Sync Signal Power (SS)
EVM – rms, peak, max hold
Frequency Error – Hz, ppm
Carrier Frequency
Cell ID
Control Channel Power
Bar Graph or Table View
RS, P-SS, S-SS
PBCH, PCFICH
Total Power (Table View)
Modulation Results
Antenna Icons
Detects active antennas (1 or 2)
Modulation Summary
Frequency E-UTRA bands 33 - 43 (tunable 10 MHz to 4.0 GHz)
Center, Signal Standard, Channel #, Closest Channel, Decrement/Increment Channel
Span (MHz) Auto, 1.4, 3, 5, 10, 15, 20, 30
Amplitude Scale/Division, Power Offset, Auto Range, Adjust Range
Sweep Single/Continuous
EVM Mode Auto, PBCH only, Max Hold
Trigger No Trigger/Ext Trigger, Rising/Falling
Save/Recall Setup, Measurement, Screen Shot (save only), to Internal/External Memory
(continued)
Scanner
Cell ID (Group, Sector)
S-SS, RSRP, RSRQ, SINR
Dominance
Modulation Results – On/Off
Tx Test
Scanner
RS Power of MIMO antennas
Cell ID, Average Power
Delta Power (Max-Min)
Graph of Antenna Power
Modulation Results – On/Off
Mapping
On-screen
S-SS, RSRP, RSRQ, or SINR
Scanner
Modulation Results – Off
View Pass/Fail Limits
All, RF, Modulation
Available Measurements
Channel Power
Occupied Bandwidth
ACLR
Frequency Error
Carrier Frequency
Dominance
EVM peak, rms
RS Power
SS, P-SS, S-SS Power
PBCH Power
PCFICH Power
Cell, Group, Sector ID
Frame Power
DWPTS Power
Transmit Off Power
Timing Error
LTE TDD RF Measurements
RF Channel Power Accuracy ± 1.5 dB, ± 1.0 dB typical, (RF input –30 dBm to +10 dBm)
LTE TDD Modulation Measurements
RS Power Accuracy ± 1.0 dB typical, (RF input –50 dBm to +10 dBm)
Frequency Error ± 10 Hz + time base error, 99 % confidence level
Residual EVM (rms) 2.0 % typical (E-UTRA Test Model 3.1, RF Input –30 dBm to +10 dBm)
Over-the-Air (OTA) Measurements
Scanner Six strongest signals if present
Tx Test Scanner – Three strongest signals if present
Mapping Map On-screen S-SS, RSRP, RSRQ, or SINR of Cell ID with strongest signal
Auto Save – Sync Signal power and Modulation Results with GPS information
RS Power – Strongest signal
Scanner – three strongest signals if present
Save and Export Mapping data: *.kml, *.mtd (tab delimited)
12 of 24 PN: 11410-00646 Rev. H MS2720T TDS
Page 13

Spectrum Master™ MS2720T Spectrum Analyzer Specifications
CDMA/EV-DO Measurements (Option 884)
CDMA Measurements
RF Demodulation Over-the-Air (OTA) Pass/Fail
Channel Spectrum
Channel Power
Occupied Bandwidth
Peak-to-Average Power
Spectral Emission Mask
Multi-carrier ACPR
RF Summary
CDMA Setup Parameters
Measurement Speed Fast, Normal, Slow
External Trigger Polarity Rising, Falling
Number of Carriers 1 to 5
Carrier Bandwidth (MHz) 1.23, 1.24, 1.25
Measurement Summary Screens Overall Measurements, RF Measurements, Signal Quality Measurements
Code Domain Power Graph
Pilot Power
Channel Power
Noise Floor
Rho
Carrier Feed Through
Tau
RMS Phase Error
Frequency Error
Abs/Rel/ Power
Pilot
Page
Sync
Q Page
Code Domain Power Table
Code
Status
Power
Multiple Codes
Code Utilization
Modulation Summary
PN Setup PN Trigger (No Trigger, GPS, External), PN Search Type (Auto, Manual), PN Offset
Walsh Code s 6 4, 128
Frequency Center, Signal Standard, Channel #, Closest Channel, Decrement/Increment Channel
Amplitude Scale/Division, Power Offset, Auto Range, Adjust Range, Units (dBm/Watts)
Sweep Single/Continuous, Trigger Sweep
Save/Recall Setup, Measurement, Screen Shot (save only), to Internal/External Memory
Pilot Scanner (Nine)
PN
E
c/Io
Tau
Pilot Power
Channel Power
Pilot Dominance
Multipath Scanner (Six)
E
c/Io
Tau
Channel Power
Multipath Power
Limit Test – 10 Tests Averaged
Rho
Adjusted Rho
Multipath
Pilot Dominance
Pilot Power
Pass/Fail Status
View Pass/Fail Limits
All, RF, Modulation
Available Measurements
Channel Power
Occupied Bandwidth
Peak-to-Average Power
Spectral Mask Test
Frequency Error
Channel Frequency
Frequency error
Pilot Power
Noise Floor
Rho
Carrier Feed Through
Tau
RMS Phase Error
Code Utilization
Measured PN
Pilot Dominance
Multipath Power
CDMA RF Measurements
RF Channel Power Accuracy ± 1.5 dB, ± 1.0 dB typical, (RF input –50 dBm to +20 dBm)
CDMA Demodulation Measurements
Frequency Error ± 10 Hz + time base error, 99 % confidence level (in slow mode)
Rho Accuracy ± 0.005, for Rho > 0.9
Residual Rho > 0.995, typical, > 0.99 maximum, (RF input –50 dBm to +20 dBm)
PN Offset 1 x 64 chips
Pilot Power Accuracy ± 1.0 dB typical, relative to channel power
Tau ± 0.5 µs typical, ± 1.0 µs maximum
CDMA Over-the-Air (OTA) Measurements
Pilot Scanner Nine strongest pilots
Multipath Scanner Multipath power of six signals relative to strongest pilot
Limit Test Average of ten tests compared to limit
MS2720T TDS PN: 11410-00646 Rev. H 13 of 24
Page 14

Spectrum Analyzer Specifications Spectrum Master™ MS2720T
CDMA/EV-DO Measurements (Option 884)
RF Demodulation Over-the-Air (OTA) Pass/Fail
Channel Spectrum
Channel Power
Occupied Bandwidth
Peak-to-Average Power
Power vs. Time
Pilot & MAC Power
Channel Power
Frequency Error
Idle Activity
On/Off Ratio
Spectral Emission Mask
Multi-carrier ACPR
RF Summary
Setup Parameters
External Trigger Polarity Rising, Falling
Carrier Bandwidth (MHz) 1.23, 1.24, 1.25
Measurement Summary Screens Overall Measurements, RF Measurements, Signal Quality Measurements
Measurement Speed Fast, Normal, Slow
Number of Carriers 1 to 5
MAC Code Domain Power Graph
Pilot & MAC Power
Channel Power
Frequency Error
Rho Pilot
Rho Overall
Data Modulation
Noise Floor
MAC Code Domain Power Table
Code
Status
Power
Code Utilization
Data Code Domain Power
Active Data Power
Data Modulation
Rho Pilot
Rho Overall
Maximum Data CDP
Minimum Data CDP
Modulation Summary
PN Setup PN Trigger (No Trigger, GPS, External), PN Search Type (Auto, Manual), PN Offset
Walsh Co de s 6 4, 128
Slot Type Auto, Active, Idle
Frequency Center, Signal Standard, Channel #, Closest Channel, Decrement/Increment Channel
Amplitude Scale/Division, Power Offset, Auto Range, Adjust Range, Units (dBm/Watts)
Sweep Single/Continuous, Trigger Sweep
Save/Recall Setup, Measurement, Screen Shot (save only), to Internal/External Memory
(continued)
EV-DO Measurements
Pilot Scanner (Nine)
PN
E
c/Io
Tau
Pilot Power
Channel Power
Pilot Dominance
Mulitpath Scanner (Six)
E
c/Io
Tau
Channel Power
Multipath Power
View Pass/Fail Limits
All, RF, Modulation
Available Measurements
Channel Power
Occupied Bandwidth
Peak-to-Average Power
Carrier Frequency
Frequency Error
Spectral Mask
Noise Floor
Pilot Power
RMS Phase Error
Tau
Code Utilization
Measured PN
Pilot Dominance
Mulitpath Power
EV-DO RF Measurements
RF Channel Power Accuracy ± 1.5 dB, ± 1.0 dB typical, (RF input –50 dBm to +20 dBm)
EV-DO Demodulation Measurements
EV-DO Compatibility Rev 0 and Rev A
Frequency Error ± 10 Hz + time base error, 99 % confidence level
Rho Accuracy ± 0.01, for Rho > 0.9
Residual Rho > 0.995 typical, > 0.99, maximum (RF input –50 dBm to +20 dBm)
Pilot Power Accuracy ± 1.0 dB typical, relative to channel power
PN Offset Within 1 x 64 chips
Tau ± 0.5 µs typical, ± 1.0 µs maximum
EV-DO Over-the-Air (OTA) Measurements
Pilot Scanner Nine strongest pilots
Multipath Scanner Multipath power of six signals relative to strongest pilot
14 of 24 PN: 11410-00646 Rev. H MS2720T TDS
Page 15

Spectrum Master™ MS2720T Spectrum Analyzer Specifications
WiMAX Fixed/Mobile Measurements (Option 885)
WiMAX Fixed Measurements
RF Demodulation Over-the-Air (OTA) Pass/Fail
Channel Spectrum
Channel Power
Occupied Bandwidth
Power vs. Time
Channel Power
Preamble Power
Data Burst Power
Crest Factor
ACPR
RF Summary
Setup Parameters
Cyclic Prefix Ratio (CP) 1/4, 1/8, 1/16, 1/32
Measurement Summary Screens Overall Measurements, RF Measurements, Modulation Measurements
Bandwidth (MHz) 1.25, 1.50, 2.50, 3.50, 5.00, 5.50, 6.00, 7.00, 10.00
Frame Length (ms) 2.5, 5.0, 10.0
Constellation
RCE (RMS/Peak)
EVM (RMS/Peak)
Frequency Error
Carrier Frequency
Base Station ID
Spectral Flatness
Adjacent Subcarrier Flatness
EVM vs. Subcarrier/Symbol
RCE
EVM
Frequency Error
Carrier Frequency
Base Station ID
Sector ID (Mobile)
Modulation Summary
Span (MHz) 5, 10, 15, 20
Frequency Center, Signal Standard, Channel #, Closest Channel, Decrement/Increment Channel
Amplitude Scale/Division, Power Offset, Auto Range, Adjust Range
Sweep Single/Continuous, Trigger Sweep
Save/Recall Setup, Measurement, Screen Shot (save only), to Internal/External Memory
There are no additional OTA
Measurements
RF and Demodulation Measurements
can be made OTA
View Pass/Fail Limits
All, RF, Modulation
Available Measurements
Channel Power
Occupied Bandwidth
Burst Power
Preamble Power
Crest Factor
Frequency Error
Carrier Frequency
EVM
RCE
Base Station ID
WiMAX Fixed RF Measurements
RF Channel Power Accuracy ± 1.5 dB, ± 1.0 dB typical, (RF input –50 dBm to +20 dBm)
WiMAX Fixed Demodulation Measurements
Frequency Error 0.07 x 10
Residual EVM (rms) 3 % typical, 3.5 % maximum (RF Input –50 dBm to +20 dBm)
(temperature range 15 °C to 35 °C)
–6
plus time base error, 99 % confidence level
(temperature range 15 °C to 35 °C)
MS2720T TDS PN: 11410-00646 Rev. H 15 of 24
Page 16

Spectrum Analyzer Specifications Spectrum Master™ MS2720T
WiMAX1 Fixed/Mobile Measurements (Option 885)
WiMAX Mobile Measurements
RF Demodulation Over-the-Air (OTA) Pass/Fail
Channel Spectrum
Channel Power
Occupied Bandwidth
Power vs. Time
Channel Power
Preamble Power
Downlink Burst Power
Uplink Burst Power
ACPR
RF Summary
Setup Parameters
DL-MAP Auto Decoding Convolutional Coding (CC), Convolutional Turbo Coding (CTC)
Cyclic Prefix Ratio (CP) 1/8
Measurement Summary Screens Overall Measurements, RF Measurements, Signal Quality Measurements
Bandwidths (MHz) 3.50, 5.00, 7.00, 8.75, 10.00
Frame Lengths (ms) 5, 10
Demodulation Auto, Manual, FCH
Constellation
RCE (RMS/Peak)
EVM (RMS/Peak)
Frequency Error
CINR
Base Station ID
Sector ID
Spectral Flatness
Adjacent Subcarrier Flatness
EVM vs. Subcarrier/Symbol
RCE (RMS/Peak)
EVM (RMS/Peak)
Frequency Error
CINR
Base Station ID
Sector ID
DL-MAP (Tree View)
Modulation Summary
Zone Type PUSC
Span (MHz) 5, 10, 20, 30
Frequency Center, Signal Standard, Channel #, Closest Channel, Decrement/Increment Channel
Amplitude Scale/Division, Power Offset, Auto Range, Adjust Range
Sweep Single/Continuous, Trigger Sweep
Save/Recall Setup, Measurement, Screen Shot (save only), to Internal/External Memory
(continued)
Channel Power Monitor
Preamble Scanner (Six)
Preamble
Relative Power
Cell ID
Sector ID
PCINR
Dominant Preamble
Base Station ID
View Pass/Fail Limits
All, RF, Modulation
Available Measurements
Channel Power
Occupied Bandwidth
Downlink Burst Power
Uplink Burst Power
Preamble Power
Crest Factor
Frequency Error
Carrier Frequency
EVM
RCE
Sector ID
WiMAX Mobile RF Measurements
RF Channel Power Accuracy ± 1.5 dB, ± 1.0 dB typical, (RF input –50 dBm to +20 dBm)
WiMAX Mobile Demodulation Measurements
Frequency Error 0.02 x 10
Residual EVM (rms) 2.5 % typical, 3.0 % maximum (RF Input –50 dBm to +20 dBm)
(temperature range 15 °C to 35 °C)
–6
(temperature range 15 °C to 35 °C)
plus time base error, 99 % confidence level
WiMAX Mobile Over-the-Air (OTA) Measurements
Channel Power Monitor Over time (one week), measurement time interval 1 s to 60 s
Preamble Scanner Six Strongest Preambles
GPS Tagging and Logging Yes
Auto Save Yes
1. Mobile WiMAX conforms to IEEE Std. 802.16e-2005, WiMAX Forum® Air Interface - Mobile System Profile - Release 1.0 Certified, System Profiles according to
WMF-T24-001-R010v07.
16 of 24 PN: 11410-00646 Rev. H MS2720T TDS
Page 17

Spectrum Master™ MS2720T General Specifications
General Specifications
Setup Parameters
System Status (Temperature, Battery Info, S/N, Firmware Version, Installed Options)
Self Test, Application Self Test, GPS (see Option 31)
System Options Display (Brightness, Blank, Default, Black & White, Night Vision, High Contrast, Invert Black & White)
Save/Recall Setups, Measurements, Screen Shots JPEG (save only)
Delete By File Type, All, Selected
Internal Trace/Setup Memory > 13,000 traces
External Trace/Setup Memory Limited by size of USB Flash Drive
Name, Date and Time, Ethernet Configuration, Volume
Language (English, French, German, Spanish, Chinese, Japanese, Korean, Italian, Russian, User Defined)
Reset (Factory Defaults, Master Reset, Update Firmware)
Share Center Frequency and Power (All Modes are Not Shared)
Power-On (via Power Switch or when DC is Applied)
File Save As, Save Meas, Save, Save On Event, Recall Meas, Recall, Copy, Delete
Connectors
RF In 9 GHz to 20 GHz Instruments: Type N, female, 50 Ω
RF Out 9 GHz to 20 GHz Instruments: Type N, female, 50 Ω
External Power 5.5 mm barrel connector, 12 to 14.5 VDC, < 5.0 A
LAN Connection RJ48C, 10/100 Mbps, Connect to PC or LAN for Remote Access
USB Interface Two Type A, Connect Flash Drive and Power Sensor; 5-pin mini-B, Connect to PC for data transfer
Headset Jack 3.5 mm 3-wire headset jack
External Reference In BNC, female, 50 Ω, Maximum Input +10 dBm
External Reference Out BNC, female, 50 Ω, 10 MHz
External Trigger BNC, female, 50 Ω, Maximum Input +5 VDC
IF Out BNC, female, 50 Ω, 140 MHz
32 GHz to 43 GHz Instruments: Ruggedized Type K, male
GPS SMA Female
Display and Keyboard
Display 8.4" Touch Screen, 800 x 600 Resolution
Keyboard Backlit (Red for Night Vision, White for all other display modes)
Battery
Type, Operation Li-Ion, 3 hour operation, typical
Battery Charging Limits 0 °C to +45 °C, Relative Humidity ≤ 80 %
Electromagnetic Compatibility
Australia and New Zealand C-tick N274
Interference, Emissions, Immunity EN 61326-1, EN 55011, EN 61000-4-2/3/4/5/11
European Union CE Mark, EMC Directive 2004/108/EC and Low Voltage Directive 2006/95/EC
Safety
Safety Class EN 61010-1 Class 1, Pollution Degree 2
Product Safety IEC 60950-1 when used with Anritsu Company supplied Power Supply
Warranty
Duration Standard three-year warranty
Environmental
Operating Temperature –10 °C to 55 °C
Maximum Humidity 85 % RH, non-condensing
Vibration, Shock, Temperature, Humidity MIL-PRF-28800F Class 2
Explosive Atmosphere MIL-PRF-28800F Section 4.5.6.3
Storage –51 °C to 71 °C
Altitude 4600 m, operating and non-operating
Size and Weight
Size 315 mm x 211 mm x 77 mm, (12.4 in x 8.3 in x 3.0 in)
Weight 3.7 kg to 4.4 kg (8.1 lb to 9.8 lb) depending on Frequency Option and Tracking Generator
MS2720T TDS PN: 11410-00646 Rev. H 17 of 24
Page 18

General Specifications Spectrum Master™ MS2720T
Master Software Tools
(for your PC)
Database Management
Full Trace Retrieval Retrieve all traces from instrument into one PC directory
Trace Catalog Index all traces into one catalog
Trace Rename Utility Rename measurement traces
Group Edit Titles, subtitles, plot scaling, markers and limit lines, simultaneously on similar files
Data Analysis
Trace Math and Smoothing Compare multiple traces
Measurement Calculator Translate into other units
Report Generation
Report Generator Includes GPS, power level, and calibration status along with measurements
Edit Graph Change scale, limit lines, and markers
Report Format Create reports in HTML for PDF format
Export Measurements Export measurements to *.s2p, *.jpg or *.csv format
Notes Annotate measurements
Mapping (GPS Required)
Spectrum Analyzer Mode MapInfo, MapPoint
Mobile WiMAX OTA Option Google Earth, Google Maps, MapInfo
Folder Spectrogram
Folder Spectrogram – 2D View Creates a composite file of multiple traces
Video Folder Spectrogram – 2D View Create AVI file to export for management review/reports
Folder Spectrogram – 3D View Views (Set Threshold, Markers)
(Spectrum Monitoring for Interference Analysis and Spectrum Clearing)
Peak Power, Total Power, Peak Frequency, Histogram, Average Power (Max/Min)
File Filter (Violations over limit lines or deviations from averages)
Playback
- 3D (Rotate X, Y, Z Axis, Level Scale, Signal ID)
- 2D View (Frequency or Time Domain, Signal ID)
-Top Down
Playback (Frequency and/or Time Domain)
List/Parameter Editors
Traces Add, delete, and modify limit lines and markers
Antennas, Cables, Signal Standards Modify instrument’s Antenna, Cable, and Signal Standard List
Pass/Fail Create, download, or edit Signal Analysis Pass/Fail Limits
Languages Add one language or modify non-English language menus
Mobile WiMAX DL-MAP Parameters
Display Modify display settings
Connectivity
Connections Connect to PC using USB, LAN, or Direct Ethernet connection
Download Download measurements and live traces to PC for storage and analysis
Upload Upload measurements from PC to instrument
Remote Access Tool Remote control and monitoring of instrument (via Ethernet port) over the Internet
18 of 24 PN: 11410-00646 Rev. H MS2720T TDS
Page 19

Spectrum Master™ MS2720T Ordering Information
Ordering Information – Instrument Options
Part Number Description
MS2720T Spectrum Master (Requires Option 709, 713, 720, 732, or 743)
Freqeuncy Options
MS2720T-0709 Frequency Range 9 kHz to 9 GHz
MS2720T-0713 Frequency Range 9 kHz to 13 GHz
MS2720T-0720 Frequency Range 9 kHz to 20 GHz
MS2720T-0732 Frequency Range 9 kHz to 32 GHz
MS2720T-0743 Frequency Range 9 kHz to 43 GHz
Tracking Generator Options
MS2720T-0809 9 GHz Tracking Generator (Requires Option 709)
MS2720T-0813 13 GHz Tracking Generator (Requires Option 713)
MS2720T-0820 20 GHz Tracking Generator(Requires Option 720)
Spectrum Analyzer Options
MS2720T-0025 Interference Analyzer (Option 31 is recommended)
MS2720T-0027 Channel Scanner
MS2720T-0431 Coverage Mapping (Requires Option 31 for full functionality)
MS2720T-0509 AM/FM/PM Measurements (Option 431 required for full functionality)
MS2720T-0024 I/Q Waveform Capture (Requires Option 9)
MS2720T-0089 Zero-Span IF Output
MS2720T-0090 Gated Sweep
Power Meter Option
MS2720T-0019 High Accuracy Power Meter (Requires USB Power Sensor, sold separately)
Wireless Measurement Options
MS2720T-0009 Demodulation Hardware
MS2720T-0880 GSM/GPRS/EDGE Measurements (Requires Option 9)
MS2720T-0881 W-CDMA/HSPA+ Measurements (Requires Option 9, Option 31 recommended)
MS2720T-0882 TD-SCDMA/HSPA+ Measurements (Requires Option 9, Option 31 required for full functionality)
MS2720T-0883 LTE FDD/TDD Measurements (Requires Option 9, Option 31 required for full functionality)
MS2720T-0884 CDMA/EV-DO Measurements (Requires Option 9, Option 31 required for full functionality)
MS2720T-0885 WiMAX Fixed/Mobile Measurements (Requires Option 9, Option 31 required for full functionality)
General Options
MS2720T-0001 Internal Atomic Clock (Cannot be combined with Options 732, 743, 809, 813, 820, or 884)
MS2720T-0007 Secure Data Operation
MS2720T-0031 GPS Receiver (Requires GPS Antenna, sold separately)
MS2720T-0098 Standard Calibration (ANSI Z540-1-1994)
MS2720T-0099 Premium Calibration (ANSI Z540-1-1994 plus test data)
- 2000-1528-R GPS Antenna, SMA(m) with 5 m (15 ft) cable, requires 5 VDC
- 2000-1652-R GPS Antenna, SMA(m) with 0.3 m (1 ft) cable, requires 3.3 VDC or 5 VDC
MS2720T TDS PN: 11410-00646 Rev. H 19 of 24
Page 20

Ordering Information Spectrum Master™ MS2720T
Spectrum Master
™
User Guide
MS2720T
High Performance Handheld Spectrum Analyzer
Power Sensors
Manuals
(soft copy included on Handheld Instruments Documentation Disc and at www.anritsu.com)
(for complete ordering information see the respective datasheets of each sensor)
Part Number Description
PSN50 High Accuracy RF Power Sensor, 50 MHz to 6 GHz, +20 dBm
MA24105A Inline Peak Power Sensor, 350 MHz to 4 GHz, +51.76 dBm
MA24106A High Accuracy RF Power Sensor, 50 MHz to 6 GHz, +23 dBm
MA24108A Microwave USB Power Sensor, 10 MHz to 8 GHz, +20 dBm
MA24118A Microwave USB Power Sensor, 10 MHz to 18 GHz, +20 dBm
MA24126A Microwave USB Power Sensor, 10 MHz to 26 GHz, +20 dBm
Part Number Description
10920-00060 Handheld Instruments Documentation Disc
10580-00340 Spectrum Master User Guide
10580-00349 Spectrum Analyzer Measurement Guide
10580-00339 Tracking Generator Measurement Guide
10580-00240 Power Meter Measurement Guide
10580-00234 3GPP Signal Analyzer Measurement Guide
10580-00235 3GPP2 Signal Analyzer Measurement Guide
10580-00236 WiMAX Signal Analyzer Measurement Guide
10580-00341 Spectrum Master Programming Manual
10580-00342 Spectrum Master Maintenance Manual
- GSM/EDGE, W-CDMA/HSPA+, TD-SCDMA/HSPA+, LTE, TD-LTE
- CDMA, EV-DO
- Fixed WiMAX, Mobile WiMAX
Troubleshooting Guides
Standard Accessories
(soft copy at www.anritsu.com)
(included with instrument)
Part Number Description
11410-00551 Spectrum Analyzers
11410-00472 Interference
11410-00466 GSM/GPRS/EDGE Base Stations
11410-00566 LTE eNodeB
11410-00615 TD-LTE eNodeB
11410-00463 W-CDMA/HSPA+ Base Stations
11410-00465 TD-SCDMA/HSPA+ Base Stations
11410-00467 cdmaOne/CDMA2000 1X Base Stations
11410-00468 CDMA2000 1xEV-DO Base Stations
11410-00469 Mobile WiMAX Base Stations
11410-00470
Part Number Description
10920-00060 Handheld Instruments Documentation Disc
2300-577 Anritsu Software Tool Box for Handheld RF Instruments Disc
2000-1685-R Soft Carrying Case
2000-1691-R Stylus with Coiled Tether
633-75 High Capacity Li-Ion Battery
40-187-R AC/DC Power Supply
806-141-R Automotive Power Adapter, 12 VDC, 60 W
2000-1371-R Ethernet Cable, 7 ft/213 cm
3-2000-1498 USB A-mini B Cable, 10 ft/305 cm
Fixed WiMAX Base Stations
Certificate of Calibration and Conformance
20 of 24 PN: 11410-00646 Rev. H MS2720T TDS
Page 21

Spectrum Master™ MS2720T Ordering Information
Optional Accessories
GPS Antennas
Directional Antennas
Part Number Description
2000-1528-R GPS Antenna, SMA(m) with 5 m (15 ft) cable, requires 5 VDC
2000-1652-R GPS Antenna, SMA(m) with 0.3 m (1 ft) cable, requires 3.3 VDC or
Part Number Description
2000-1659-R 698 MHz to 787 MHz, N(f), 8 dBd, Yagi
2000-1411-R 822 MHz to 900 MHz, N(f), 10 dBd, Yagi
2000-1412-R 885 MHz to 975 MHz, N(f), 10 dBd, Yagi
2000-1660-R 1425 MHz to 1535 MHz, N(f), 12 dBd, Yagi
2000-1413-R 1710 MHz to 1880 MHz, N(f), 10 dBd, Yagi
2000-1414-R 1850 MHz to 1990 MHz, N(f), 9.3 dBd, Yagi
2000-1416-R 1920 MHz to 2170 MHz, N(f), 10 dBd, Yagi
2000-1415-R 2400 MHz to 2500 MHz, N(f), 10 dBd, Yagi
2000-1726-R 2500 MHz to 2700 MHz, N(f), 12 dBd, Yagi
2000-1677-R 300 MHz to 3000 MHz, SMA(m), 50 ohm, 3 m cable (9.8 ft)
2000-1747-R 300 MHz to 5000 MHz, N(f), Log Periodic
2000-1617 600 MHz to 21 GHz, N(f ), 5 to 8 dBi gain to 12 GHz,
2000-1748-R 1 GHz to 18 GHz, N(f), Log Periodic
2000-1715-R 698 MHz to 2.5 GHz Bi-blade
5VDC
0 to 6 dBi gain @ 950 MHz, Log Periodic
0 to 6 dBi gain to 21 GHz, Log Periodic
Portable Antennas
Mag Mount Broadband Antenna
2000-1200-R 806 MHz to 866 MHz, SMA(m), 50 Ω
2000-1473-R 870 MHz to 960 MHz, SMA(m), 50 Ω
2000-1035-R 896 MHz to 941 MHz, SMA(m), 50 Ω (1/2 wave)
2000-1030-R 1710 MHz to 1880 MHz, SMA(m), 50 Ω (1/2 wave)
2000-1474-R 1710 MHz to 1880 MHz with knuckle elbow (1/2 wave)
2000-1031-R 1850 MHz to 1990 MHz, SMA(m), 50 Ω (1/2 wave)
2000-1475-R 1920 MHz to 1980 MHz and 2110 MHz to 2170 MHz, SMA(m), 50 Ω
2000-1032-R 2400 MHz to 2500 MHz, SMA(m), 50 Ω (1/2 wave)
2000-1361-R 2400 MHz to 2500 MHz, 5000 MHz to 6000 MHz, SMA(m), 50 Ω
2000-1751-R 698 MHz to 960 MHz, 1710 MHz to 2100 MHz, 2500 MHz to
2000-1487 VHF/UHF, Telescopic Whip antenna, straight or 90°, BNC(m), 50 Ω
2000-1636-R Antenna Kit (Consists of: 2000-1030-R, 2000-1031-R, 2000-1032-R,
2000-1647-R Cable 1: 698–1200 MHz 2 dBi peak gain,
2000-1645-R 694-894 MHz 3 dBi peak gain
2000-1646-R 750-1250 MHz 3 dBi peak gain,
2000-1648-R 1700-6000 MHz 3 dBi peak gain, N(m), 50 Ω, 10 ft
2700 MHz, SMA(m), 2 dB, typical, 50 Ω
2000-1200-R, 2000-1035-R, 2000-1361-R, and carrying pouch)
Cable 2: 3000–6000 MHz 5 dBi peak gain, N(m), 50 Ω, 10 ft
Cable 3: GPS 26 dB gain, SMA(m), 50 Ω, 10 ft
1700-2700 MHz 3 dBi peak gain, N(m), 50 Ω, 10 ft
1650-2000 MHz 5 dBi peak gain,
2100-2700 MHz 3 dBi peak gain, N(m), 50 Ω, 10 ft
1700–2700 MHz 5 dBi peak gain, N(m), 50 Ω, 10 ft
MS2720T TDS PN: 11410-00646 Rev. H 21 of 24
Page 22

Ordering Information Spectrum Master™ MS2720T
Optional Accessories
Bandpass Filters
Adapters
Precision Adapters
(continued)
1030-114-R 806 MHz to 869 MHz, N(m) to SMA(f ), 50 Ω
1030-109-R 824 MHz to 849 MHz, N(m) to SMA(f ), 50 Ω
1030-110-R 880 MHz to 915 MHz, N(m) to SMA(f ), 50 Ω
1030-105-R 890 MHz to 915 MHz Band, 0.41 dB loss, N(m) to SMA(f), 50 Ω
1030-111-R 1850 MHz to 1910 MHz, N(m) to SMA(f), 50 Ω
1030-106-R 1710 MHz to 1790 MHz Band, N(m) to SMA(f), 50 Ω
1030-107-R 1910 MHz to 1990 MHz Band, N(m) to SMA(f), 50 Ω
1030-112-R 2400 MHz to 2484 MHz, N(m) to SMA(f), 50 Ω
1030-155-R 2500 MHz to 2700 MHz, N(m) to N(f), 50 Ω
1030-178-R 1920 MHz to 1980 MHz, N(m) to N(f), 50 Ω
1030-179-R 777 MHz to 787 MHz, N(m) to N(f ), 50 Ω
1030-180-R 2500 MHz to 2570 MHz, N(m) to N(f), 50 Ω
2000-1684-R 791 MHz to 821 MHz, N(m) to N(f ), 50 Ω
Part Number Description
1091-26-R SMA(m) to N(m), DC to 18 GHz, 50 Ω
1091-27-R SMA(f) to N(m), DC to 18 GHz, 50 Ω
1091-80-R SMA(m) to N(f), DC to 18 GHz, 50 Ω
1091-81-R SMA(f) to N(f), DC to 18 GHz, 50 Ω
1091-417-R N(m) to QMA(f), DC to 6 GHz, 50 Ω
1091-418-R N(m) to QMA(m), DC to 18 GHz, 50 Ω
1091-172-R BNC(f) to N(m), DC to 1.3 GHz, 50 Ω
510-90-R 7/16 DIN(f) to N(m), DC to 7.5 GHz, 50 Ω
510-91-R 7/16 DIN(f) to N(f), DC to 7.5 GHz, 50 Ω
510-92-R 7/16 DIN(m) to N(m), DC to 7.5 GHz, 50 Ω
510-93-R 7/16 DIN(m) to N(f), DC to 7.5 GHz, 50 Ω
510-96-R 7/16 DIN(m) to 7/16 DIN (m), DC to 7.5 GHz, 50 Ω
510-97-R 7/16 DIN(f) to 7/16 DIN (f), DC to 7.5 GHz, 50 Ω
1091-379-R 7/16 DIN(f ) to 7/16 DIN(f), DC to 6 GHz, 50 Ω, w/ Reinforced Grip
71693-R Ruggedized K(f) to Type N(f)
510-102-R N(m) to N(m), DC to 11 GHz, 50 Ω, 90 degrees right angle
Part Number Description
34NN50A Precision Adapter, N(m) to N(m), DC to 18 GHz, 50 Ω
34NFNF50 Precision Adapter, N(f) to N(f), DC to 18 GHz, 50 Ω
Attenuators
Part Number Description
3-1010-122 20 dB, 5 W, DC to 12.4 GHz, N(m) to N(f)
42N50-20 20 dB, 5 W, DC to 18 GHz, N(m) to N(f)
42N50A-30 30 dB, 50 W, DC to 18 GHz, N(m) to N(f)
3-1010-123 30 dB, 50 W, DC to 8.5 GHz, N(m) to N(f)
1010-127-R 30 dB, 150 W, DC to 3 GHz, N(m) to N(f)
3-1010-124 40 dB, 100 W, DC to 8.5 GHz, N(m) to N(f), Uni-directional
1010-121 40 dB, 100 W, DC to 18 GHz, N(m) to N(f), Uni-directional
1010-128-R 40 dB, 150 W, DC to 3 GHz, N(m) to N(f)
22 of 24 PN: 11410-00646 Rev. H MS2720T TDS
Page 23

Spectrum Master™ MS2720T Ordering Information
Optional Accessories
Miscellaneous Accessories
Backpack and Transit Case
(continued)
Part Number Description
2000-1374 External Dual Charger for Li-lon Batteries
633-75 High Capacity Battery Pack, 7500 mAh
66864 Rack Mount Kit, Master Platform
2000-1689 EMI Near Field Probe Kit
2000-1653 Anti-glare Screen Cover (package of 2)
MA2700A InterferenceHunter™ Handheld Direction Finding System
Part Number Description
67135 Anritsu Backpack (For Handheld Instrument and PC)
760-243-R Large Transit Case with Wheels and Handle
MS2720T TDS PN: 11410-00646 Rev. H 23 of 24
Page 24

The Master Users Group is an organization dedicated to providing training, technical support, networking opportunities
and links to Master product development teams. As a member you will receive the Insite Quarterly Newsletter with
user stories, measurement tips, new product news and more.
Visit us to register today:
www.anritsu.com/mug
To receive a quote to purchase a product or order accessories visit our online ordering site:
www.ShopAnritsu.com
Training at Anritsu
Anritsu has designed courses to help you stay up to date with technologies important to your job. For available training
courses visit:
• United States
Anritsu Company
1155 East Collins Blvd., Suite 100,
Richardson, TX 75081, U.S.A.
Toll Free: 1-800-267-4878
Phone: +1-972-644-1777
Fax: +1-972-671-1877
• Canada
Anritsu Electronics Ltd.
700 Silver Seven Road, Suite 120,
Kanata, Ontario K2V 1C3, Canada
Phone: +1-613-591-2003
Fax: +1-613-591-1006
• Brazil
Anritsu Electrônica Ltda.
Praça Amadeu Amaral, 27 - 1 Andar
01327-010 Paraiso, São Paulo, Brazil
Phone: +55-11-3283-2511
Fax: +55-11-3288-6940
• Mexico
Anritsu Company, S.A. de C.V.
Av. Ejército Nacional No. 579 Piso 9, Col. Granada
11520 México, D.F., México
Phone: +52-55-1101-2370
Fax: +52-55-5254-3147
• United Kingdom
Anritsu EMEA Ltd.
200 Capability Green, Luton, Bedfordshire LU1 3LU,
U.K.
Phone: +44-1582-433280
Fax: +44-1582-731303
• France
Anritsu S.A.
12 Avenue du Québec,
Bâtiment Iris 1-Silic 612,
91140 VILLEBON SUR YVETTE, France
Phone: +33-1-60-92-15-50
Fax: +33-1-64-46-10-65
• Germany
Anritsu GmbH
Nemetschek Haus, Konrad-Zuse-Platz 1
81829 München, Germany
Phone: +49-89-442308-0
Fax: +49-89-442308-55
List Revision Date: 20130905
This Technical Data Sheet applies to Revision 2 of the MS2720T Spectrum Master. Refer to the sticker on the back of the instrument.
Instruments not indicating a revision level on the sticker are Revision 1 instruments.
24 of 24
www.anritsu.com/training
® Anritsu All trademarks are registered trademarks of their
respective companies. Data subject to change without notice.
For the most recent specifications visit: www.anritsu.com
Anritsu utilizes recycled paper and environmentally conscious inks
and toner.
• Italy
Anritsu S.r.l.
Via Elio Vittorini 129, 00144 Roma, Italy
Phone: +39-06-509-9711
Fax: +39-06-502-2425
• Sweden
Anritsu AB
Borgafjordsgatan 13A, 164 40 KISTA, Sweden
Phone: +46-8-534-707-00
Fax: +46-8-534-707-30
• Finland
Anritsu Finland
Teknobulevardi 3-5, 01530 Vantaa, Finland
Phone: +358-20-741-8100
Fax: +358-20-741-8111
• Denmark
Anritsu A/S (for Service Assurance)
Anritsu AB (for Test & Measurement)
Kay Fiskers Plads 9, DK-2300 Copenhagen S,
Denmark
Phone: +45-3691-5035
Fax: +45-7211-2210
• Russia
Anritsu EMEA Ltd.
Representation Office in Russia
Tverskaya str. 16/2, bld. 1, 7th floor.
Russia, 125009, Moscow
Phone: +7-495-363-1694
Fax: +7-495-935-8962
• United Arab Emirates
Anritsu EMEA Ltd.
Dubai Liaison Office
P O Box 500413 - Dubai Internet City
Al Thuraya Building, Tower 1, Suite 701, 7th Floor
Dubai, United Arab Emirates
Phone: +971-4-3670352
Fax: +971-4-3688460
• Singapore
Anritsu Pte. Ltd.
11 Chang Charn Road, #04-01, Shriro House
Singapore 159640
Phone: +65-6282-2400
Fax: +65-6282-2533
• India
Anritsu India Pvt. Ltd.
2nd & 3rd Floor, #837/1, Binnamangla 1st Stage,
Indiranagar, 100ft Road, Bangalore - 560038, India
Phone: +91-80-4058-1300
Fax: +91-80-4058-1301
• P.R. China (Shanghai)
Anritsu (China) Co., Ltd.
27th Floor, Tower A,
New Caohejing International Business Center
No. 391 Gui Ping Road Shanghai, Xu Hui Di District,
Shanghai 200233, P.R. China
Phone: +86-21-6237-0898
Fax: +86-21-6237-0899
• Hong Kong
Anritsu Company Ltd.
Unit 1006-7, 10/F., Greenfield Tower,
Concordia Plaza,
No. 1 Science Museum Road, Tsim Sha Tsui East,
Kowloon, H ong Kong
Phone: +852-2301-4980
Fax: +852-2301-3545
• Japan
Anritsu Corporation
8-5, Tamura-cho, Atsugi-shi,
Kanagawa, 243-0016 Japan
Phone: +81-46-296-1221
Fax: +81-46-296-1238
• Korea
Anritsu Corporation, Ltd.
502, 5FL H-Square N B/D, 681
Sampyeong-dong, Bundang-gu, Seongnam-si,
Gyeonggi-do, 463-400 Korea
Phone: +82-31-696-7750
Fax: +82-31-696-7751
• Australia
Anritsu Pty Ltd.
Unit 21/270 Ferntree Gully Road, Notting Hill
Victoria, 3168, Australia
Phone: +61-3-9558-8177
Fax: +61-3-9558-8255
• Taiwan
Anritsu Company Inc.
7F, No. 316, Sec. 1, Neihu Rd., Taipei 114, Taiwan
Phone: +886-2-8751-1816
Fax: +886-2-8751-1817
MS2720T Spectrum Master™ TDS
Copyright March 2014 Anritsu Company, USA
All Rights Reserved
 Loading...