

Page 1

High-Performance
WDM Measurement
MS9720A
WDM Network Tester
Page 2
2
±
20 pm Wavelength Accuracy with Built-in Light Source
■ ±20 pm Wavelength Accuracy (Reference Optical Source Built-in)
■ 58 dB Dynamic Range (1 nm from Signal Wavelength)
■ –87 dBm Optical Reception Sensitivity
■ Three Memories, Three Traces, Split Screen
■ Full Line-up of Functions and Applications
■ VGA Output Connector
The MS9720A is an optical spectrum analyzer with a
diffraction grating that is used to measure and analyze optical spectra in the 1450 to
1650 nm band for WDM communications systems.
In addition to having excellent basic performance such as high wavelength accuracy,
wide dynamic range and good optical reception sensitivity ideally suited to measurement
and analysis of the optical spectra used in WDM communications,it also has a full line-up
of functions matching a wide range of needs ranging from manufacturing of WDM
communications devices,to installation and maintenance.
A wavelength accuracy of ±20 pm is achieved over a range
of 1530 to 1570 nm by performing calibration using the builtin wavelength reference light source. Wavelength calibration
is performed automatically just by pressing the Cal key, permitting accurate measurement of the absolute wavelength
value required in evaluation of WDM systems. Calibration of
the absolute wavelength value uses the absorption spectrum of acetylene. The block diagram of the calibration light
source is shown below. In addition, the output of the built-in
SLD light source can be used for ev aluating the transmission
characteristics of passive elements
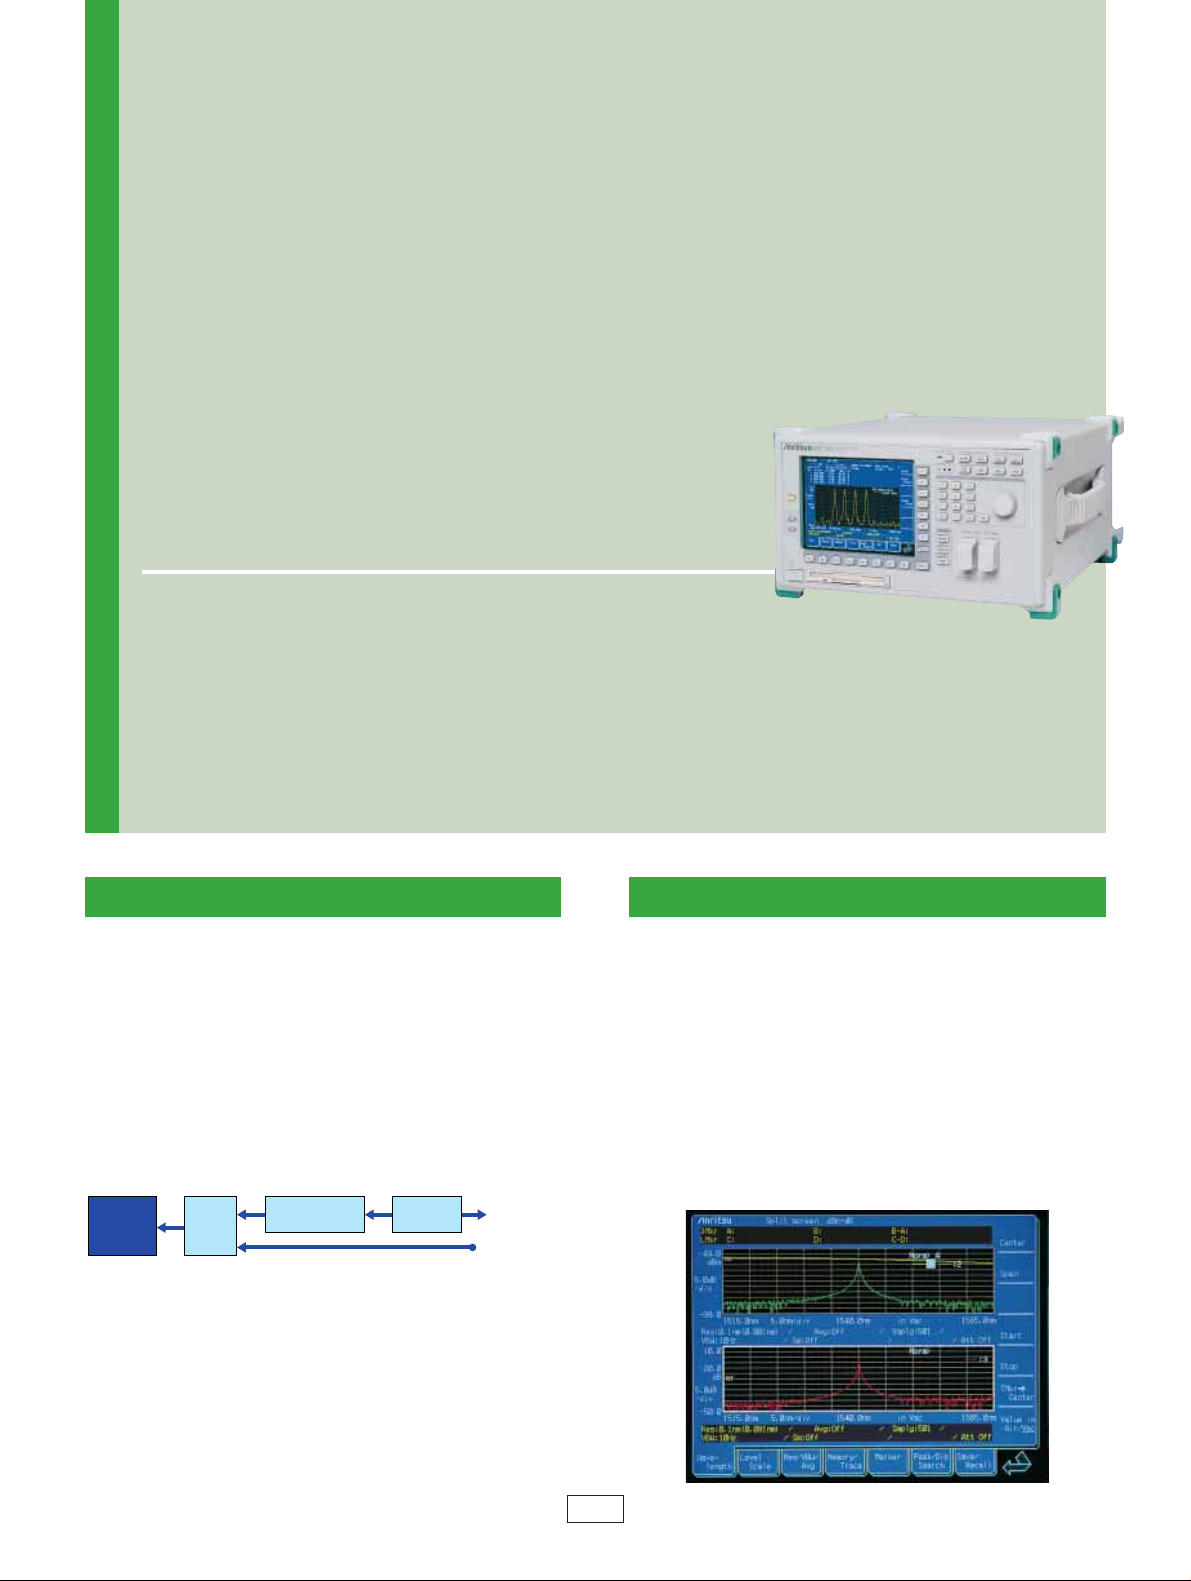
Three Memories,Three Traces, Split Screen
Up to three memories can be used for measurement; the
results found by mathematically processing the data in these
three memories can be displayed as up to three traces on
the screen. Furthermore, by using the split screen function,
it is possible to simultaneously display two sets of measurement data on the screen as well as the difference between
the two sets of data.
The following screen shows a measurement of filter characteristics; the top half of the split screen shows the reference
light and the measured optical spectrum while the bottom
half shows the spectrum of the measured light minus the
reference light.
Measurement
section
SLD optical
output
Optical input
SLD light
source
Acetylene
absorption cell
Optical
switch
Block Diagram of Calibration Light Sourc
Ideal for High-Performance WDM Measurement
From R&D and production to installation and maintenance of
WDM communications devices
Page 3
3
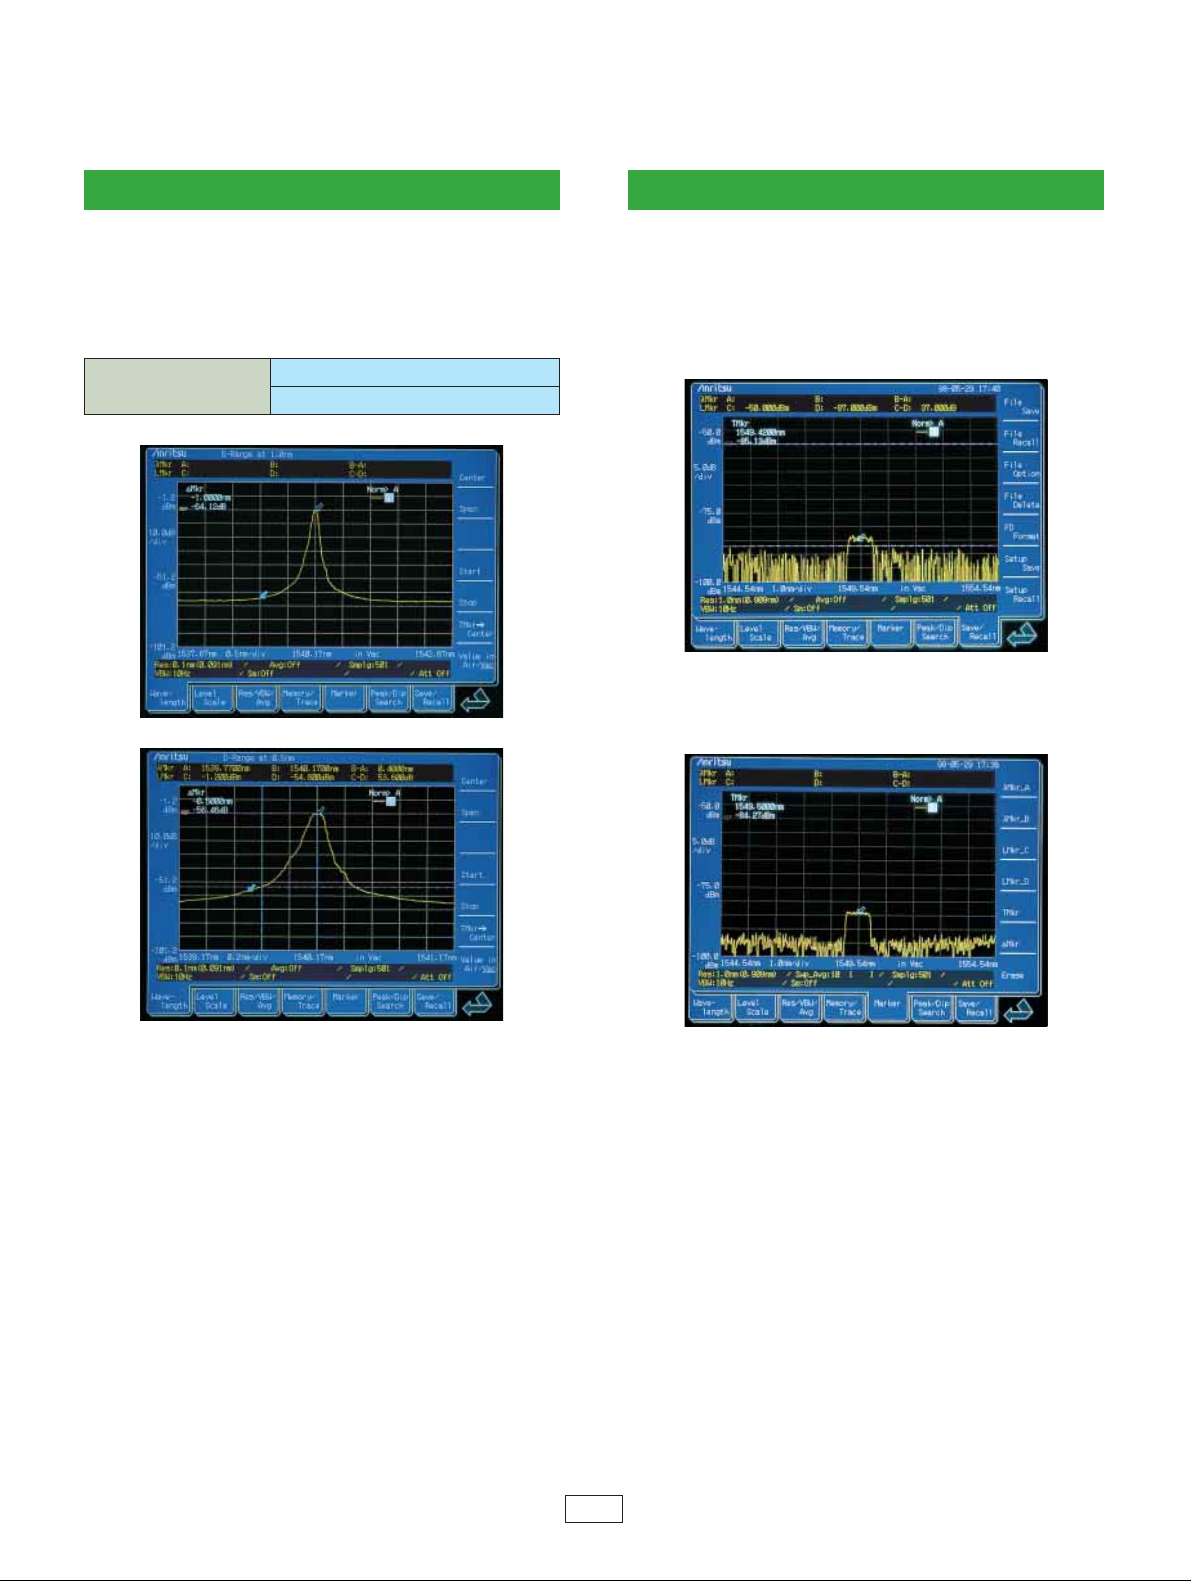
58 dB Dynamic Range
The measurement dynamic range at the wavelength 1 nm
from the peak is 58 dB demonstrating the tester’s power
when measuring the SNR of light sources in WDM systems
and when evaluating filters, etc.The following screens show
the dynamic range at 1 and 0.5 nm from the peak.
–87 dBm Optical Reception Sensitivity
The MS9720A noise level is –87 dBm, so the tester is ideal
for measuring the SNR of light sources used in WDM systems, as well as optical leakage and reflected light.The following screen shows a measurement of an optical spectrum
of a DFB LD with the output level attenuated to –85 dBm at
a VBW of 10 Hz.
The SNR is improved by using averaging processing. The
following is an example of measurement result after 10
sweep averaging are performed.
Dynamic range
58 dB (1 nm from peak)
53 dB (0.5 nm from peak)
Page 4

4
Full Line-up of Functions and Applications
In addition to its excellent basic performance, the MS9720A
has a full line-up of useful functions. The basic waveform
analysis functions offer applications for evaluating every
important item in WDM systems.
The following screens show threshold and SNR analysis of
a WDM signal waveform. The effective analysis range is set
using the Zone Marker even f or WDM signals , enab ling independent analysis of the waveform of each channel.
Insertion Loss Measurement
At insertion loss measurement, the inser tion loss of optical
devices such as optical couplers can be measured.The following screen shows a measurement of the transmission
characteristics of a band pass filter.
In addition, the measurement results for a specified WDM
channel wavelength can be displayed as a list.
The following diagrams show the setup when measuring the
insertion loss of a WDM coupler using the built-in SLD , or an
external light source.
Reference Measurement
Waveform
analysis
Applicable
measurement
Threshold analysis, SMSR analysis, spectrum power (integrated power calculation)
Insertion loss, isolation, directivity, return
loss, polarized mode dispersion (PMD), fiber
amplifier noise figure (NF), WDM wavelength
analysis, long-term measurement
Externallight
COM
Tx1
Rx2
Tx3
Rx4
Tx5
Rx6
Tx7
Rx8
MS9720A
Page 5

5
Insertion Loss Measurement
Isolation Measurement
By using the same setup, it is possible to measure the optical leakage between each channel of an optical coupler and
to measure the isolation. Moreover, when used in combination with an external light source, it is possible to measure
the directivity to evaluate the very weak optical leakage
between send and receive channels.
Return Loss Measurement
When the MS9720A is combined with the dedicated
MN9604C Optical Directional Coupler (sold separately) and
the total reflection optical fiber (sold separately), the return
loss can be measured.
The following screens show a measurement of the reflection
at the fiber input end (open) using a four-wave WDM light
source as the external light source.
DUT
Total reflection
optical fiber for
reference
MN9604C Optical
Directional Coupler
Built-in SLD or
external light
source
MS9720A
Help Function
All the measurement procedures and set ups for applications are explained by easy-to-understand diagrams that are
displayed by pressing the Help key.
Externallight
MS9720A
Tx1
Rx2
Tx3
Rx4
Tx5
Rx6
Tx7
Rx8
COM
Tx1
MS9720A
Rx2
Tx3
Rx4
Tx5
Rx6
Tx7
Rx8
COM
Page 6

6
● 3.5-inch Floppy Disk Drive
In addition to saving and recalling data to and from FD, waveform
images saved on FD can be viewed on a personal computer screen.
The MS9720A can save waveform images to FD as either Windows
bitmapped files or text files.Moreover, the data can be exported easily into word processing and spreadsheet software applications.
*The photograph is nearly actual size.
Page 7

7
● Optical Input Connectors
Any of FC-PC, DIN, ST, SC, HMS-10/A or
E2000 connectors can be used. Cleaning
is easy because the connector can be
removed and refitted (except E2000).
● SLD Output
The MS9720A has an SLD light
source which is very useful for
evaluating the transmission
characteristics of WDM devices.
Page 8

8
Long-Term Measurement
The MS9720A has a long-term measurement function for
displaying the wavelength, level and SNR, etc., as a table,
and saving the average, maximum and minimum value of
each measurement to floppy disk as a text file at a set measurement interval. During long-term measurement, wavelength calibration is performed every 6 hours, and level calibration every 1 hour.
PMD Measurement
It is also possible to measure the PMD (Polarization Mode
Dispersion), an important factor determining the upper limit
of the transmission bit rate in optical fiber amplifier systems.
The MS9720A has a function for calculating PMD using a
fixed analyzed method which is one measurement method.
The PMD can be measured easily by using the following
type of measurement system.
The diagram below shows PMD measurement of a 1 m
PANDA fiber.
NF Measurement
The MS9720A can measure NF using interpolation technic
(level fitting method). In the MS9720A NF measurement
function, the ASE (Amplified Spontaneous Emission) is calculated by the averaging the sum of the level at two points
separated by a fixed wavelength from the signal wavelength
of the EDFA output. The following screens show a measurement of the NF of an EDFA amplifying a WDM signal.
PRM:Polarization rotation module (sold separately)
SLD output
MS9720A
Optical input
PRM
PRM
Page 9

9
WDM Wavef orm Analysis
A major problem of WDM transmission systems is the signal-to-noise ratio (SNR) of each signal channel.Quantitative
measurement and evaluation of SNR is extremely impor tant
in WDM transmission systems.The MS9720A can analyze
up to 128 WDM waveforms and display the peak wavelength, level and SNR of each channel.
Wide-Bandwidth, High-Output SLD Light Source
The following screen shows the output spectrum of the SLD
from 1450 to 1650 nm. At 1550 nm and a resolution of 1 nm,
the output level is –40 dBm min. A dynamic range of approx.
50 dB can be measured with setting the VBW 10 Hz.
The screen below shows analysis of a 16-channel WDM
waveform; the level difference of each channel is displayed
using the channel on the left side as a reference. Any channel can be set as the reference.
VGA Output Connector
A VGA output connector is provided on the rear panel
of the MS9720A for displaying the measurement
screen on a PC monitor.
Page 10

10
Specifications
Applicable fiber 10/125 µm SM fiber (ITU-T G.652)
Optical connector User replaceable (FC, SC, ST, DIN, HMS-10/A), Factory option (E2000, FC-APC, SC-APC, HRL-10)
Range: 1450 to 1650 nm
Accuracy: ±20 pm (1550 ±20 nm, room temperature), ±50 pm (1520 to 1600 nm),
±0.3 nm (all range) *After wavelength calibration
Wavelength
Stability: ±5 pm (smoothing: 11 pt, 1 minute, at half-width of center wavelength)
Linearity: ±20 pm (1550 ±20 nm)
Read resolution: 5 pm (display resolution: 1 pm)
Setting resolution: 0.1, 0.2, 0.5, 1.0 nm (filter: 3 dB bandwidth)
Resolution accuracy: ≤±10% (1550 ±20 nm, 0˚ to 30˚C), ≤30% (1550 ±100 nm, 0˚ to 30˚C)
Measurement level ranges:
–87 to +10 dBm (1450 to 1600 nm, 0˚ to 30˚C), –72 to +10 dBm (1600 to 1650 nm, 0˚ to 30˚C),
–82 to +10 dBm (1450 to 1600 nm, 30˚ to 50˚C), –67 to +10 dBm (1600 to 1650 nm, 30˚ to 50˚C),
Level
–68 to +23 dBm (1450 to 1600 nm, 0˚ to 30˚C, internal optical attenuator: on)
Accuracy: ±0.4 dB (1550 nm, –23 dBm)
Stability: ±0.02 dB (1550 nm, –23 dBm, 1 minute, constant temperature, no polarization fluctuation)
Linearity: ±0.05 dB (1550 nm, –50 to 0 dBm)
Flatness: ±0.1 dB (1550 ±20 nm), ±0.3 dB (1520 to 1600 nm)
Polarization dependency ±0.15 dB
Dynamic range 58 dB (at point 1 nm from peak), 53 dB (at point 0.5 nm from peak)
Optical return loss 35 dB (1550 nm)
SLD output >–40 dBm/nm (at 1550 nm)
Display 6.4-inch color TFT-LCD
Memory trace Three measurement memories and three trace displays
Printer Internal (thermal type)
Interface GPIB, RS-232C, monitor output (VGA compatible)
Data save/output 3.5-inch floppy disk drive
Operating temperature: 0˚ to +50˚C (however, 5˚ to 50˚C for FDD)
Ambient conditions Storage temperature: –20˚ to +60˚C
Relative humidity: ≤90% (no condensation, 20% to 80% for FDD)
Power 85 to 132 Vac/172 to 250 Vac, 47.5 to 63 Hz, 150 VA (max.)
Dimensions and mass 320 (W)
× 177 (H) × 350 (D) mm (excluding projections), ≤16.5 kg
Note: Warm-up to the MS9720A for about 5 minutes to ensure stable operation. The above specifications are obtained at 2-hours after power-on.
Page 11

11
Ordering Information
Model/Order No. Name Remarks
Main frame
MS9720A WDM Network Tester
Standard accessories
Optical connector adaptor*
1
:1 pc
F0012 Fuse, 3.15 A: 2 pcs For 100 Vac
F0010 Fuse, 1.6 A: 2 pcs For 200 Vac
W1343AE MS9720A operation manual: 1 copy
W1344AE MS9720A remote control operation manual: 1 copy
Power cord, 2.6 m: 1 pc
B0329G Front cover: 1 pc 3/4MW4U
Z0312 Printer paper: 2 rolls
MX972001S LabVIEW
®
Driver (RS-232C): 1 pc
MX972001G LabVIEW®Driver (GPIB) 1 pc
Options
MS9720A-27 E2000 (DIAMOND) connector Factory option
MS9720A-31 EC (RADIAL) connector Factory option
MS9702A-37 FC connector
MS9720A-38 ST connector
MS9720A-39 DIN connector
MS9720A-40 SC connector
MS9720A-43 HMS-10/A (DIAMOND) connector
MS9720A-47 HRL-10 connector Factory option
Application parts
MN9604C Optical Directional Coupler
J0654A Serial interface cable IBM-PC/AT, J-310 (remote control)
J0655A Serial interface cable 9P-25P
J0007 GPIB cable, 1 m 408JE-101
J0617B Replaceable connector(FC)
J0618D Replaceable connector (ST)
J0618E Replaceable connector (DIN)
J0618F Replaceable connector (HMS-10/A)
J0619B Replaceable connector (SC)
J0635B Optical fiber cord (FC•PC-FC•PC-2M-SM), 2 m
J0441 Total internal reflection fiber cord
Z0282 Replacement reel for ferrule cleaner Kuretop A type
Z0283 Ferrule cleaner spare tape For Z0282, 6 pcs/set
Z0284 Adapter cleaner Stick type, 200 pcs/set
B0330C Tilt bail
B0336C Hard carrying case
G0084A Polarization rotation module
Please specify the model/code, name and quantity when ordering.
*1: Specify the connector to be supplied as the standard connector when ordering the above options.
If the connector is not specified, the FC connector (MS9720A-37) is supplied as standard.
Page 12

No.MS9720A-E-A-1-(3.00) Printed in Japan 2000-2 50KL/O
Specifications are subject to change without notice.
ANRITSU CORPORATION
5-10-27, Minamiazabu, Minato-ku, Tokyo 106-8570, Japan
Phone: +81- 3 - 3446 - 1111
Telex: J34372
Fax: +81-3 - 3442 - 0235
Overseas Subsidiaries
•
U.S.A.
ANRITSU COMPANY
North American Region Headquarters
1155 East Collins Blvd., Richardson, Tx 75081, U.S.A.
Toll Free: 1 - 800 - ANRITSU (267- 4878)
Phone: +1-972 - 644 - 1777
Fax: +1-972 - 671 - 1877
•
Canada
ANRITSU ELECTRONICS LTD.
Unit 102, 215 Stafford Road West
Nepean, Ontario K2H 9C1, Canada
Phone: +1- 613 - 828 - 4090
Fax: +1-613 - 828 - 5400
•
Brasil
ANRITSU ELETRÔNICA LTDA.
Praia de Botafogo 440, Sala 2401 CEP 22250-040,
Rio de Janeiro, RJ, Brasil
Phone: +55- 21 - 5276922
Fax: +55-21 - 537 - 1456
•
U.K.
ANRITSU LTD.
200 Capability Green, Luton, Bedfordshire LU1 3LU, U.K.
Phone: +44- 1582 - 433200
Fax: +44-1582 - 731303
•
Germany
ANRITSU GmbH
Grafenberger Allee 54-56, 40237 Düsseldorf, Germany
Phone: +49- 211 - 96855 - 0
Fax: +49-211 - 96855 - 55
•
France
ANRITSU S.A.
9, Avenue du Québec Z.A.de Courtabœuf 91951 Les
Ulis Cedex, France
Phone: +33- 1 - 60 - 92 - 15 - 50
Fax: +33-1-64-46-10-65
•
Italy
ANRITSU S.p.A.
Via Elio Vittorini, 129, 00144 Roma EUR, Italy
Phone: +39- 06 - 509 - 9711
Fax: +39-06 - 502 - 24 - 25
•
Sweden
ANRITSU AB
Botvid Center, Fittja Backe 1-3 145 84 Stockholm,
Sweden
Phone: +46- 853470700
Fax: +46-853470730
•
Singapore
ANRITSU PTE LTD.
6, New Industrial Rd., #06-01/02, Hoe Huat Industrial
Building, Singapore 536199
Phone: +65- 282 - 2400
Fax: +65-282 - 2533
•
Hong Kong
ANRITSU COMPANY LTD.
Suite 719, 7/F., Chinachem Golden Plaza, 77 Mody
Road, Tsimshatsui East, Kowloon, Hong Kong, China
Phone: +852- 2301 - 4980
Fax: +852-2301 - 3545
•
Korea
ANRITSU CORPORATION
14F Hyun Juk Bldg. 832-41, Yeoksam-dong,
Kangnam-ku, Seoul, Korea
Phone: +82- 2 - 553 - 6603
Fax: +82-2 - 553 - 6604
˜
5
•
Australia
ANRITSU PTY LTD.
Unit 3/170 Forster Road Mt.Waverley, Victoria, 3149,
Australia
Phone: +61- 3 - 9558 - 8177
Fax: +61-3 - 9558 - 8255
•
Taiwan
ANRITSU COMPANY INC.
6F, 96, Sec. 3, Chien Kou North Rd. Taipei, Taiwan,
R.O.C.
Phone: +886- 2 - 2515 - 6050
Fax: +886-2 - 2509 - 5519
 Loading...