

Page 1
Capabilities
• Select generator, analyzer,
graph, and sweep modes with
one-button access
• Measure at DC and from 10 Hz
to 100 kHz
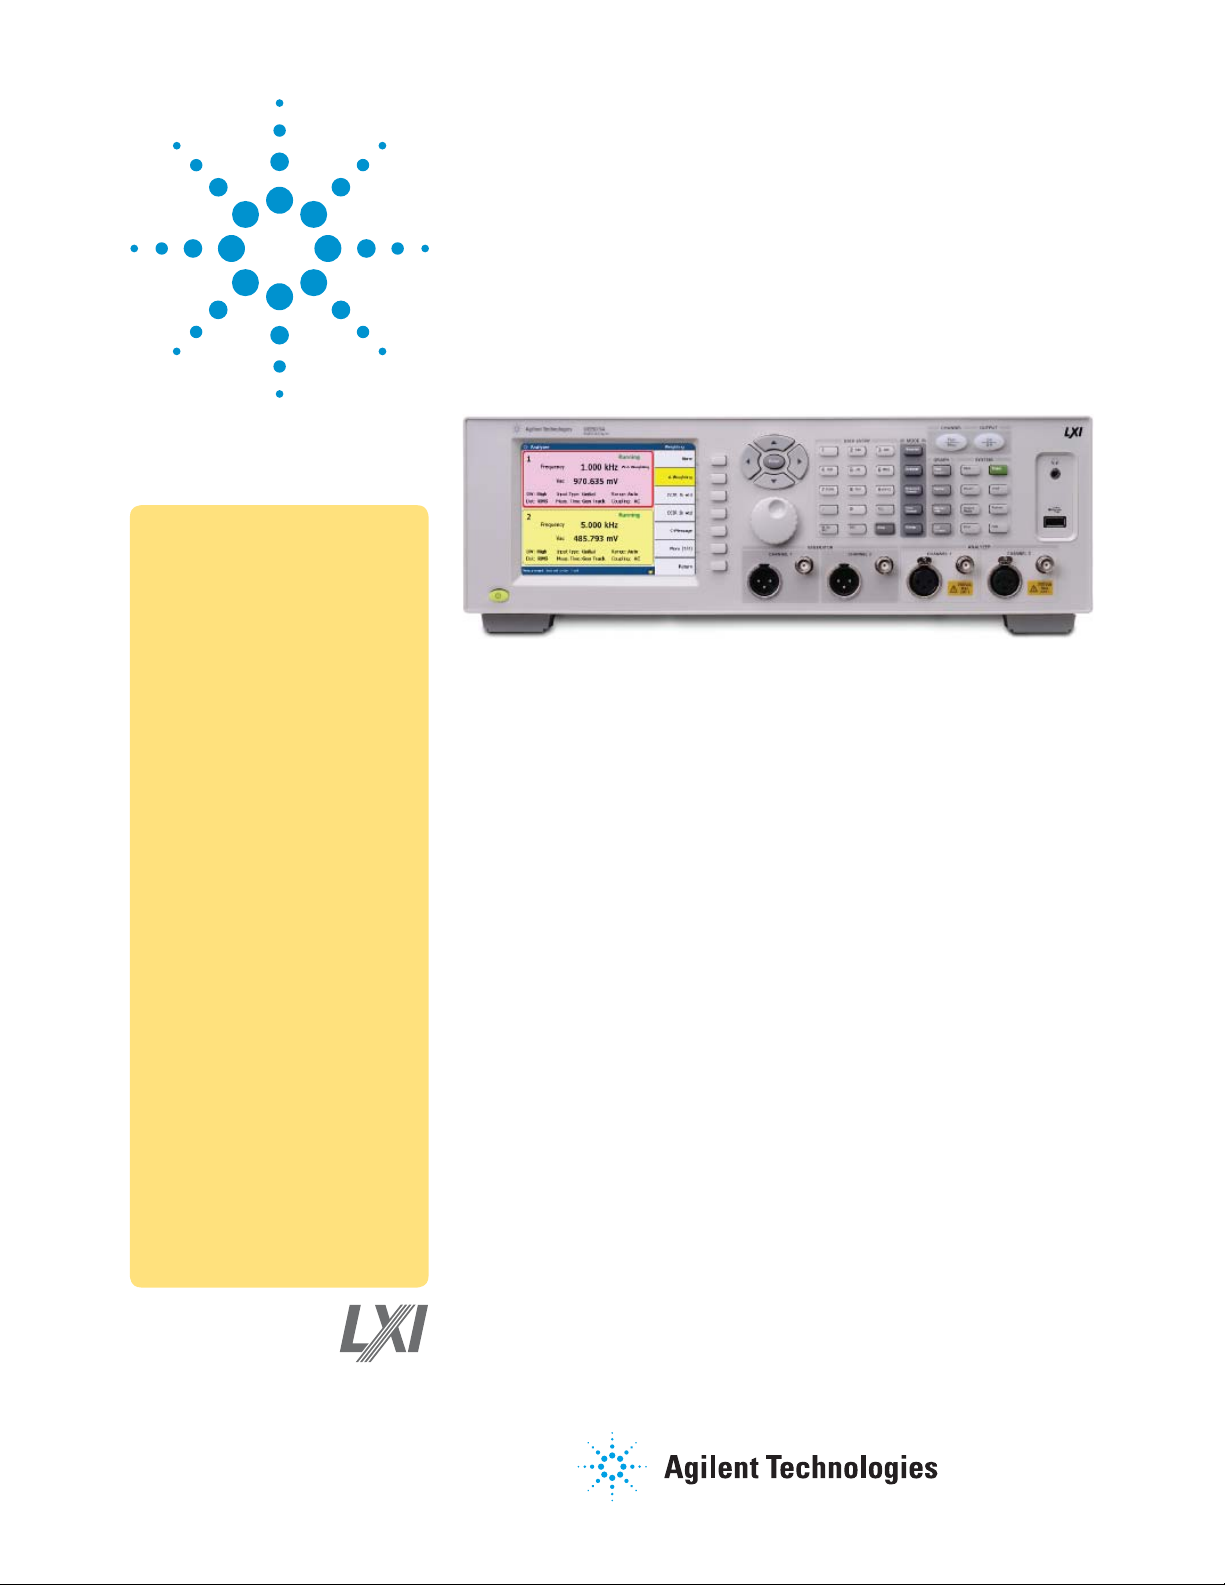
Agilent U8903A Audio Analyzer
Make an Audible Difference
Data Sheet
• Characterize signal-to-noise
ratio, SINAD, IMD, DFD,
THD+N ratio, THD+N level,
crosstalk, and more
• Apply weighting functions,
standard filters, and custom
filters
• Stimulate the device with
high-quality signals and
arbitrary waveforms
• View numerical and graphical
displays of measurement
results
• Connect to a PC through
GPIB, LAN/LXI C, and USB
interfaces
• Code compatible with
HP8903B
• 2 in 1 screen (generator and
analyzer in the same display
screen)
Whether listening to mono, stereo, or surround, the human ear knows what
sounds good. Measuring “how good,” however, can be a challenge. The Agilent
U8903A audio analyzer helps you measure and quantify audio performance in
applications such as wireless audio, analog components and ICs, and consumer
audio.
Across the audio spectrum and beyond, this scalable, single-unit solution
provides versatile measurement functions, diverse test signals, and powerful
analysis capabilities.
The U8903A audio analyzer combines the functionality of a distortion meter,
SINAD meter, frequency counter, AC voltmeter, DC voltmeter, and FFT analyzer
with a low-distortion audio source. On the bench or in a test system, its accuracy and versatility helps you make an audible difference in your end product.
LXI class C certified
Page 2
Replace your 8903B and add
next-generation capabilities
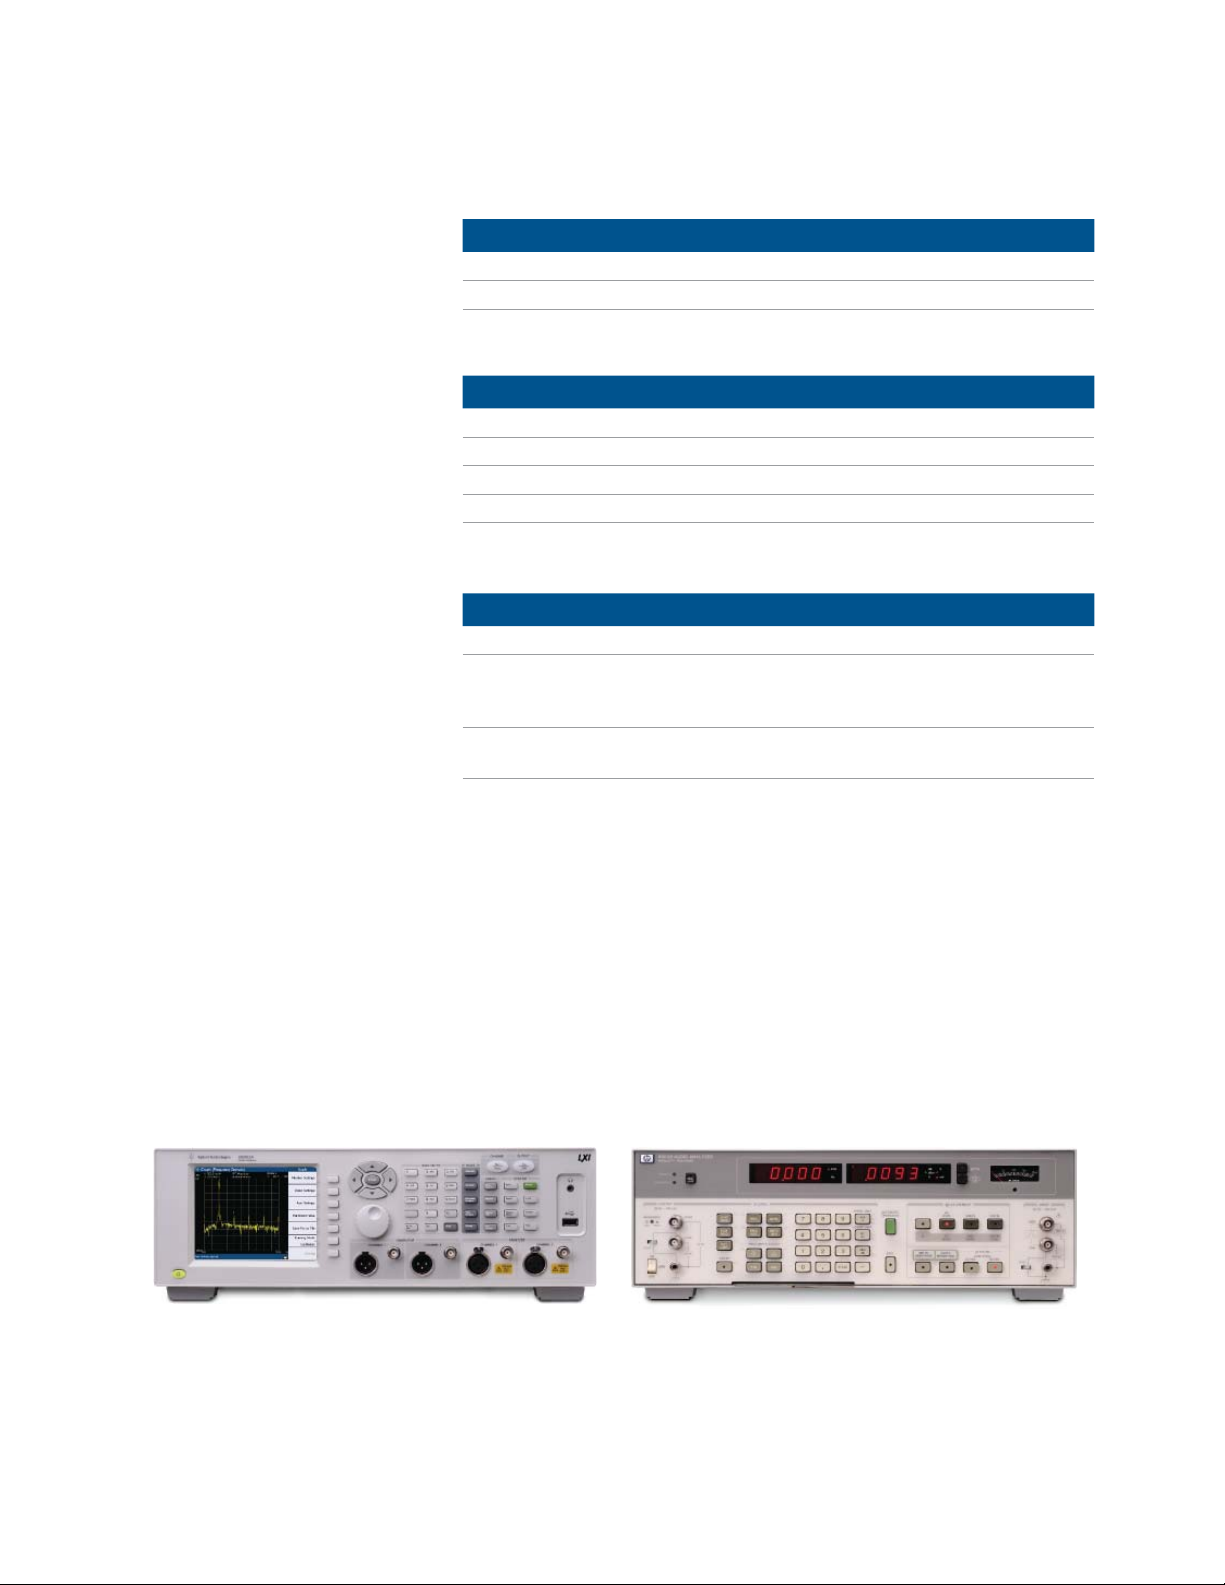
For nearly two decades, the HP 8903B
provided unparalleled versatility and
performance in audio applications.
The U8903A builds on the legacy of
the 8903B by offering faster singlepoint measurements (0.4 sec versus
3.0 sec) as well as a wider frequency
range, expanded performance, and
greater functionality (Tables 1, 2, and
3). With the U8903A, you can configure measurements faster through
its graphical user interface (GUI)
and one-button selection of major
operating modes. The color screen
lets you view dual-parameter displays
from one or two channels as well
as graphical displays of sweeps, frequency spectra, and more (Figure1).
To makes the transition easy, the
next-generation replacement for the
HP 8903B audio analyzer features
a built-in code emulator which
automatically converts 8903B R2D2
code directly into SCPI commands
used by the U8903A. The Agilent
application note Migrating Code from
the 8903B to U8903A (5990-4135EN)
and the U8903A Programming Guide
(U8903-90027) provide additional
resources to assure you get the most
from this new class of audio analyzer.
Table 1. Comparison of frequency range and accuracy
U8903A HP 8903B
Frequency range DC and 10 Hz to 100 kHz 20 Hz to 100 kHz
Frequency accuracy 5 ppm (0.0005%) 0.004%
Table 2. Comparison of accuracy and ranges in AC and DC level measurements
U8903A HP 8903B
AC voltage input range 0 V to 140 V
AC accuracy ± 1% ± 4%
DC voltage input range 0 to ± 200 V 4 to 300 V
DC accuracy ± 1% ± 1%
Table 3. Comparison of range and residual THD+N measurements
rms
0.3 mV
to 300 V
rms
U8903A HP 8903B
Frequency range 10 Hz to 100 kHz 20 Hz to 100 kHz
),
Residual THD+N
(signal distortion)
at 80 kHz BW
Accuracy ± 0.5 dB (< 20 kHz)
≤ –101 dB (at 1 kHz, 1 V
20 Hz to 20 kHz
± 0.7 dB (< 100 kHz)
rms
–80 dB (or 15 µV),
20 Hz to 20 kHz
± 1 dB (20 Hz to 20 kHz)
± 2 dB (20 to 100 kHz)
rms
Figure 1. The new U8903A audio analyzer (left) offers numerous improvements over the widely used HP 8903B (right).
2
Page 3
Address Challenging Audio Applications
Measure and analyze essential
audio parameters
With the U8903A, you can measure
below, across, and above the audio
spectrum with its 10 Hz to 100 kHz
frequency range and built-in DC measurements. Its dual input channels let
you perform stereo audio, frequency
response, wireless and component
tests—all at a single-channel price.
Easily characterize parameters such
as signal-to-noise ratio, SINAD,
intermodulation distortion (IMD),
different-frequency distortion (DFD),
total harmonic distortion (THD+N
ratio, THD+N level), crosstalk, and
more. Additional measurement
capabilities include AC level, DC level,
frequency count, frequency spectrum,
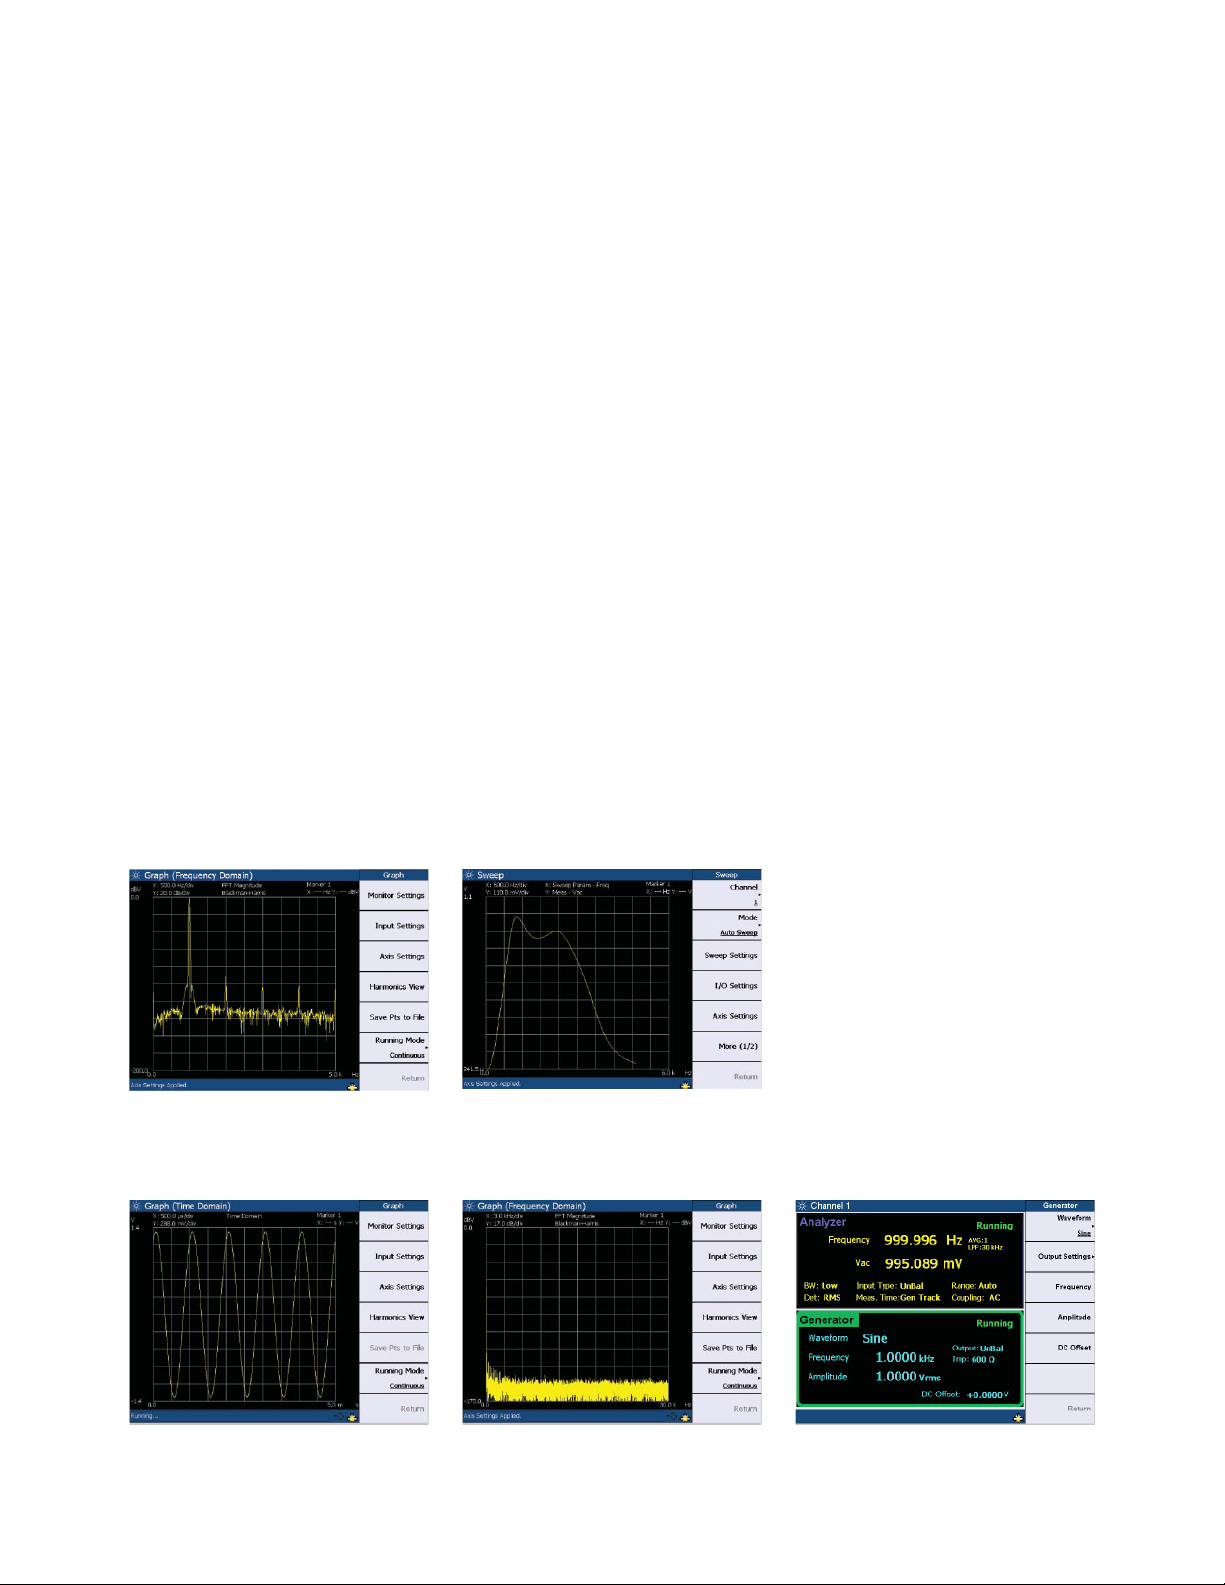
and FFT analysis (Figure 2).
For all measurements, you can
apply weighting functions as well as
low-pass, high-pass, and standard
filters (Figure 3). You can also create
custom filters using MATLAB® and
other applications, and upload them
through the analyzer’s USB port.
Filters and weighting functions can be
applied one, two, or three at a time.
U8903A also provides a 2 in 1 screen,
which simultaneously displays the
generator and analyzer information
(Figure5). This allows the user to
change the generator (source) setting
while monitoring the analyzer results
in real time.
Generate high-quality test
signals
The built-in, dual-channel signal generator lets you stimulate your device
with a variety of high-quality signals:
sine (–105 dB noise floor), square,
rectangular, noise (Gaussian and
rectangular), two-tone, and multi-tone
(up to 60) (Figure4). To simulate com-
plex and real-world signals, you can
also create arbitrary waveforms with
up to 16,384 points and at 312.5kHz
sampling rate.
The output voltage range is 0 V to
8 V
with 1% accuracy. For unbal-
rms
anced connections, you can select
50 or 600 Ω output impedance.
Easily perform manual and
automated tests
One-button access makes it easy
to select the four main operating
modes: analyzer, generator, graph,
and sweep. The 5.7-inch color display
provides numeric readouts as well as
graphical views of analog sweeps,
FFT spectra, and more.
For PC-based control on the bench
or in a test system, the U8903A
includes GPIB, LAN/LXI C, and USB
interfaces.
Figure 2. Perform FFT analysis with up to
32 Kpoints and a wide selection of
informative graphing functions
Figure 4. Utilize high-quality test signals that provide low distortion and low noise level
Figure 3. Apply an extensive selection of
filters, including a variety of weighting
functions
3
Figure 5. 2 in 1 screen generator and
analyzer in the same display screen
Page 4

Take a Closer Look
Front panel
One-button access to
analyzer, generator,
and sweep modes
Quick buttons for
graphical analysis
Front-panel output
on/off button for
DUT protection
Plug-and-play
USB 2.0
connectivity
5.7-inch color
display
Figure 6. U8903A audio analyzer, front view
Rear panel
Softkeys for easy
function selection
Dual-channel generator
outputs and analyzer inputs
with XLR connectors
Figure 7. U8903A audio analyzer, rear view
GPIB, LAN/LXI C,
and USB interfaces
4
Page 5
Advance Measurement Testing
General audio testing
The U8903A provides essential
measurement capabilities that enable
efficient analysis of audio amplifiers
and other devices in the audio chain.
For example, the analyzer includes
balanced and unbalanced outputs
and inputs. It also provides a wide
selection of filters and enhances your
flexibility by making it easy to upload
customized filters. With an array of
sweep functions and flexible data
display formats for each measurement, you’ll be ready to address
a wide range of challenging audio
applications.
Balanced inputs
In the quest for higher output power,
many audio amplifiers use bridged
output stages. Such amplifiers can be
difficult to characterize because their
outputs cannot be grounded. To test
these devices, the usual approach
has been to use a balanced, calibrated isolation transformer connected to
an analyzer with an unbalanced input.
The widely used HP 8903B eliminated
the need for a transformer, but it was
still necessary to float the analyzer
input before connecting the bridged
device and making measurements.
With the U8903A, you simply make
a balanced connection with an
XLR connector and make measurements—no floating required.
analyzer’s USB port. The U8903A also
includes selectable 15, 20, and 30kHz
low-pass filters to reject unwanted,
out-of-band signals and noise.
Display scaling and formatting
U8903A gives you flexible control
over data displays. For example, you
can choose volts, millivolts, dBm into
600 Ω (or other resistance values),
or watts for AC level measurements,
and select percent or dB for distortion
measurements.
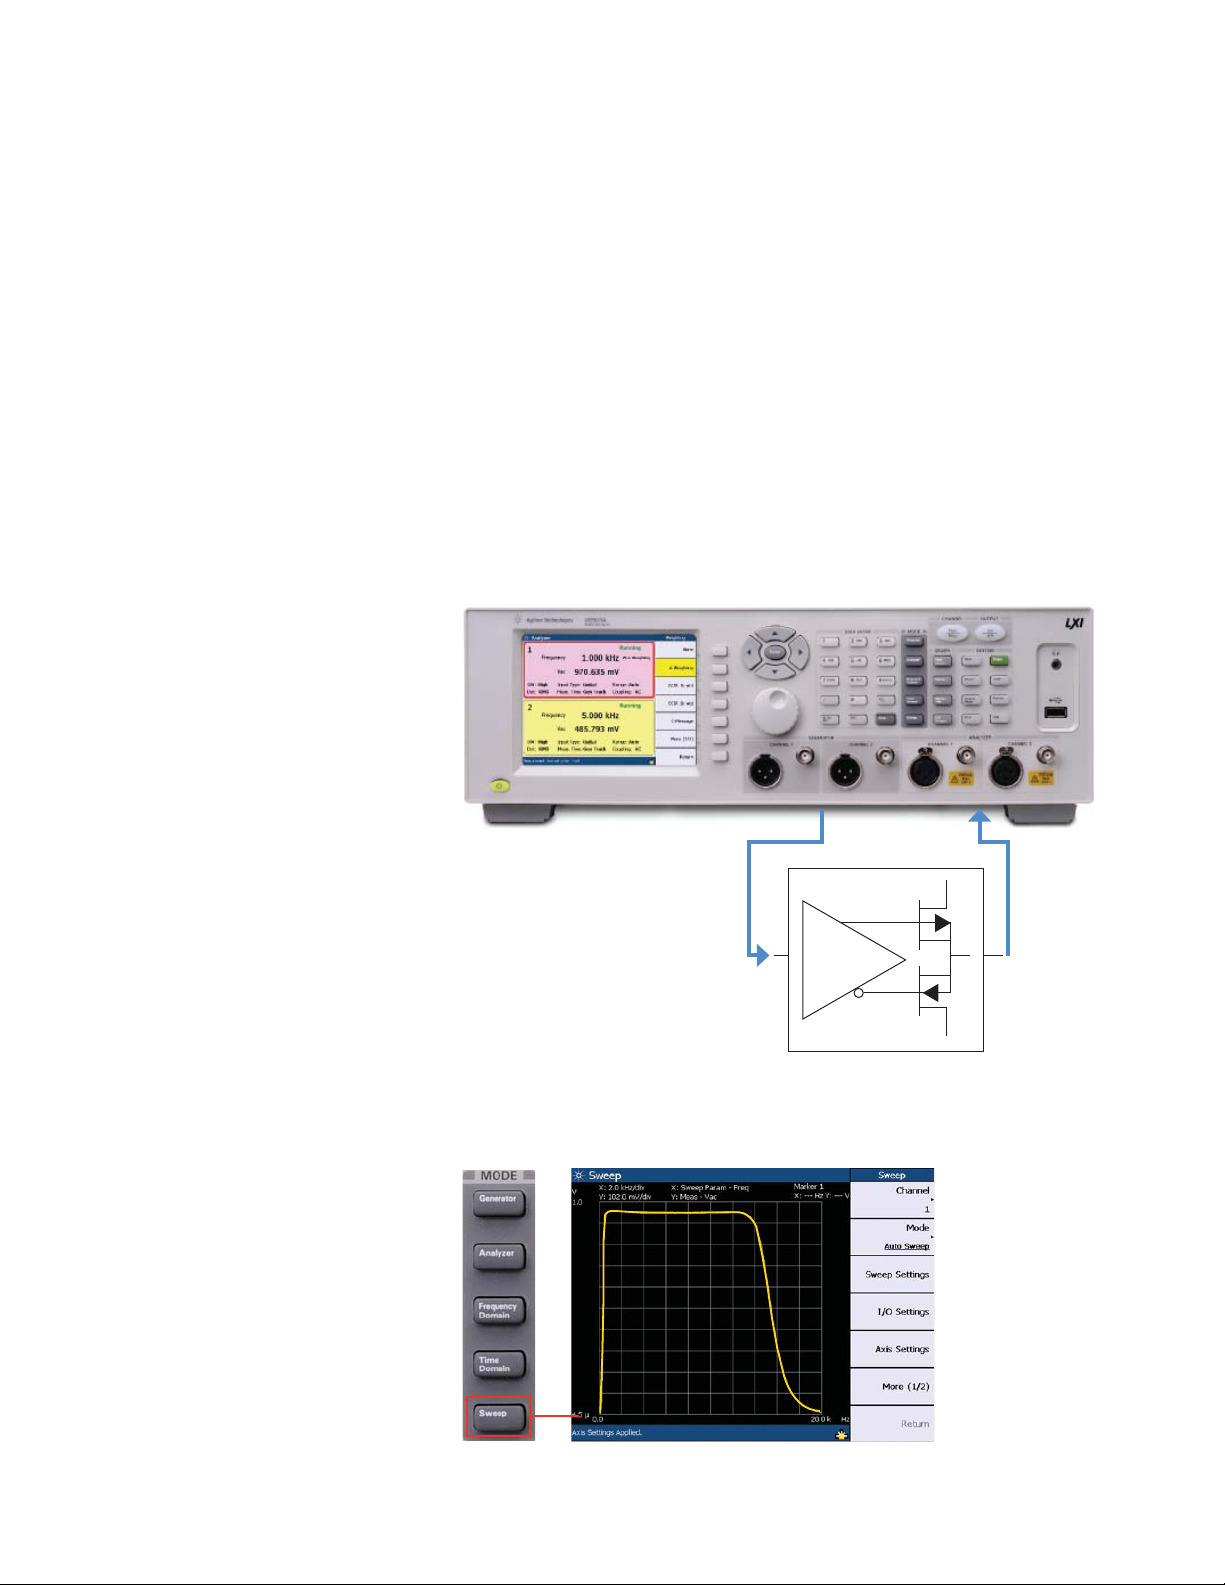
Amplifier testing
Generator output
Figure 8. Audio testing using the U8903A
Swept measurements
With its internal audio source and
precise digital control, the U8903A
can perform automatic swept measurements of frequency response,
distortion, and signal-to-noise. For
example, to check the frequency
response of an active filter, only a few
steps are required. After connecting
the device and setting the required
source level, simply enter the start
and stop frequencies, and then press
the “Sweep” key (Figure 9).
Analyzer
input
Audio amplifier
Standard and custom filters
A selection of built-in filters simplifies
audio measurements by providing
weighting networks required by international standards. These include
CCIR, CCIR/ARM, and CCIT weighting
filters; a C message filter; and an
ANSI “A” weighting filter. In addition
to the standard filters, you can create
custom filters using applications
such as MATLAB or Agilent VEE
and upload the filters through the
Figure 9. Use a single button to access the swept measurement mode
5
Page 6

Advance Measurement Testing (continued)
SINAD and THD+N
measurement
U8903A gives you the flexibility to
lock down the generator frequency
under the Frequency Lock features.
With this feature, users can set
the generator frequency in order to
tell the location of the fundamental
signal. In this case, users have the
flexibility to lock the external source’s
fundamental frequency to make
SINAD and THD+N measurements
more accurately because the measurements are based on the actual
source fundamental signal rather
than the detected fundamental signal.
Sometimes the other order signal
and noise is stronger than the actual
source fundamental signal which will
impact the measurement reading.
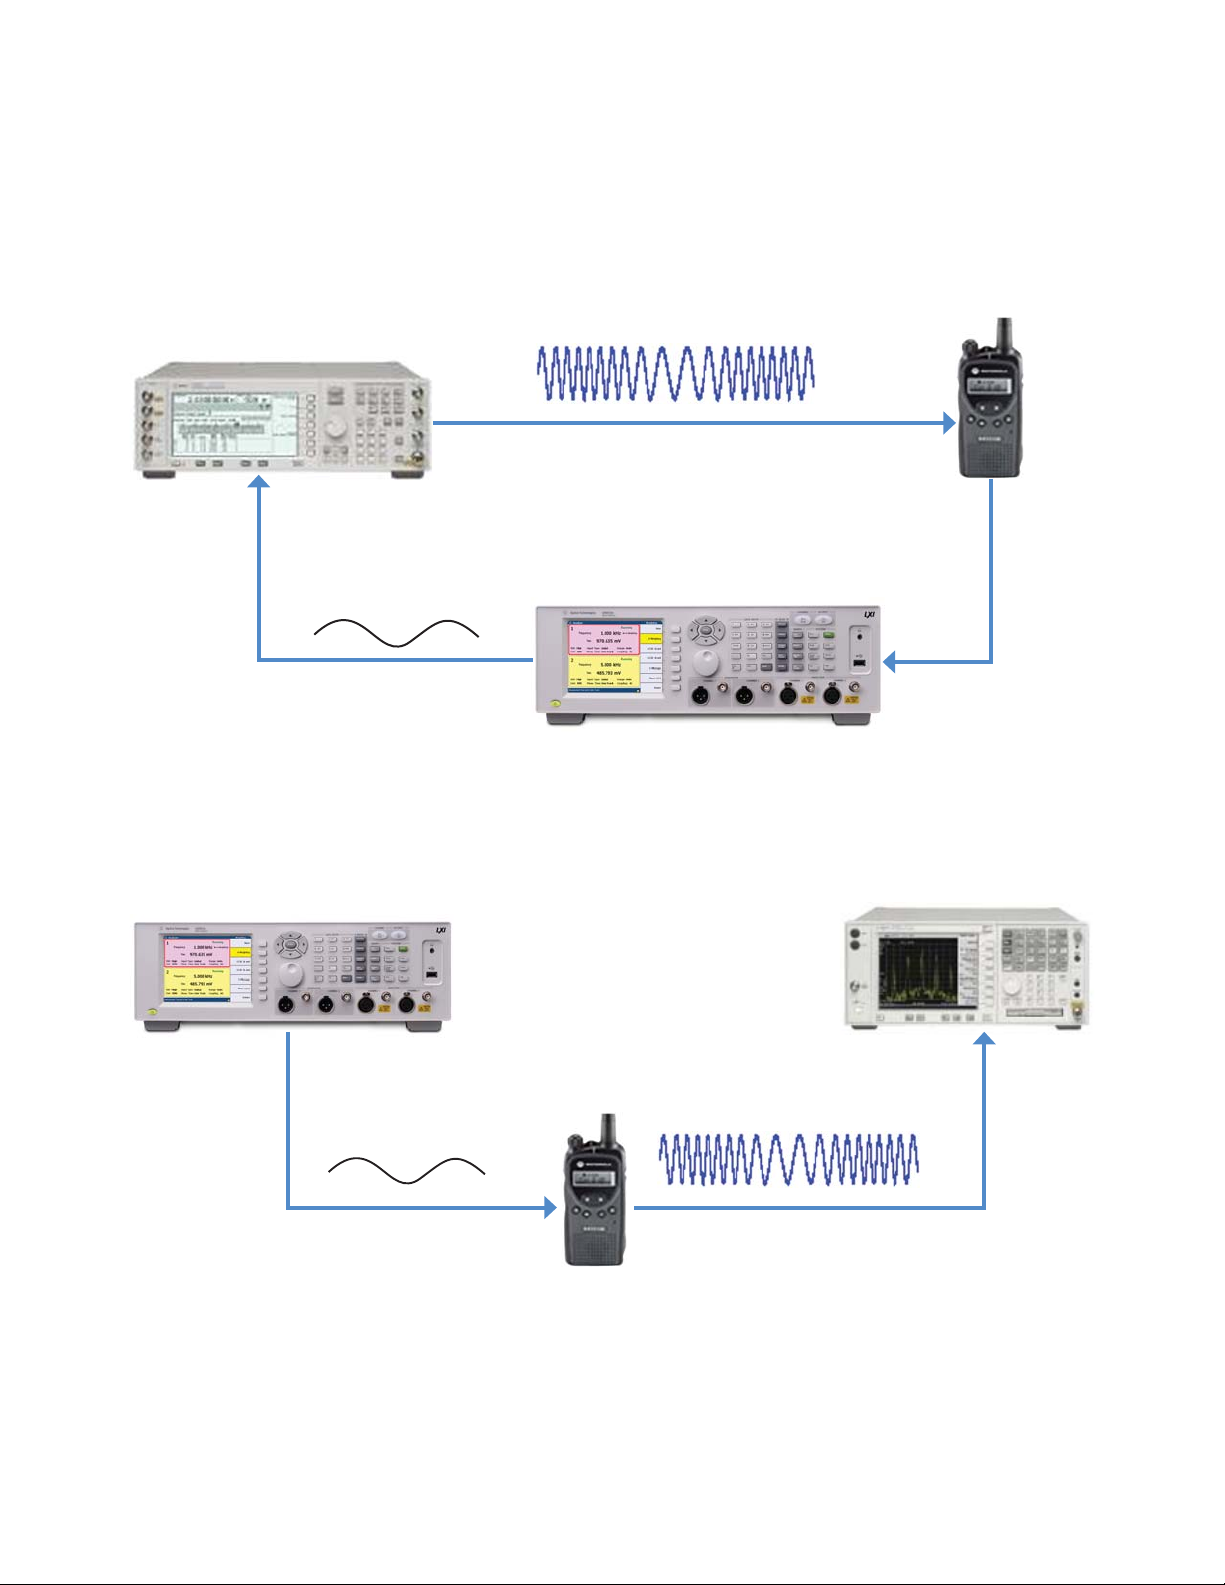
Transmitter and receiver testing
The U8903A includes several
measurement features that simplify
the testing of the transceivers used
in devices such as car radios,
telephones, mobile radios, broadcast
radios, FM tuners, and television.
The U8903A can handle all of these
applications when combined with
a modulating signal generator for
receiver testing and a signal analyzer
for transmitter testing (see diagrams
on next page).
True-RMS detection
To accurately characterize signals
with high noise content, true-RMS
detection is required. The U8903A
employs true-RMS detection for all
signals with crest factor less than
three. In addition, quasi-peak detection (CCIR 468-4) and peak-to-peak
detection are also available through
softkey selections.
Built-in filters
The U8903A includes a variety of
essential filters for transmitter and
receiver testing. Its CCITT, CCIR, and
C-message weighting filters meet
international standards for receiver
testing. For transmitter testing, the
seven-pole 400 Hz high-pass filter
provides better than 40 dB rejection
of signals up to 250 Hz, letting you
measure transmitter audio
distortion to 1% without disabling
squelch signals.
For even greater flexibility, you can
apply custom filters created using
applications such as MATLAB and
Agilent VEE. Once you’ve uploaded
a filter via the U8903A’s USB port, it
can be applied to your measurements
through a softkey selection. In all, you
can apply up to three filters at a time.
Reference/relative measurements
This features allows users to perform
measurement on level, frequency,
and ratio based on the selected
impedance value, frequency, or ratio
reference value. This simplifies
manual data measurement and data
collection because the calculations
are automatically generated inside
the equipment in real time. This feature provides users with the flexibility
to decided which signal sources to
perform Signal-to-Noise (SNR) measurement without solely depending
on the U8903A generator source.
SINAD measurements
Commonly used to test FM receivers,
SINAD measurements must be made
repeatedly when checking receiver
sensitivity or adjacent-channel
selectivity. To smooth out the typically noisy signals that are present
during receiver testing, the analyzer’s
SINAD mode employs extra filtering
circuits. These are optimized for high
speed and excellent repeatability:
the U8903A provides distortion and
SINAD measurements with an acquisition time of less than 1.5 seconds
and a measurement rate of greater
than two reading per second after
locking.
Signal-to-noise ratio
To characterize signal quality in
AM receivers, the U8903A can
automatically make the necessary
signal-to-noise ratio measurements. It
does this by monitoring the incoming
AC signal level while turning its lowdistortion source on and off.
The U8903A provides the average
point features which allows users
to set the number of readings used
for averaging. The display value will
be the averaged value based on
the number of points selected. This
allows users to analyze noisy signals
using an increased number of average
points for greater accuracy.
6
Page 7
Advance Measurement Testing (continued)
Transmitter and receiver testing
Receiver testing
Signal generator
Generator output
Figure 10. Receiver testing using the U8903A
Transmitter testing
Modulated signal
Two-way
radio
Analyzer input
Spectrum analyzer
Two-way radio
Generator output
Figure 11. Transmitter testing using the U8903A and a spectrum analyzer
7
Modulated signal
Page 8

Characteristics
Power consumption 250 VA
Power requirements • 100 to 240 V
• 47 to 63 Hz
Operating environment • Operating temperature from 0 to 55 °C
• Relative humidity at 20 to 80% RH (noncondensing)
• Altitude up to 3000 m
• Pollution degree 2
• Installation category II
Storage compliance –55 to 75 °C (23 to 167 °F)
Safety compliance Certified with:
• IEC 61010-1:2001/EN61010-1:2001 (2nd Edition)
• Canada: CAN/CSA-C22.2 No. 61010-1-04
• USA: ANSI/UL 61010-1:2004
EMC compliance • IEC 61326-1:2005/EN 61326-1:2006
• Canada: ICES-001:2004
• Australia/New Zealand: AS/NZS CISPR11:2004
Dimensions (W x D x H) 425.6 mm x 405.0 mm x 133.6 mm (16.76 inches x 15.94 inches x 5.25 inches)
Weight < 8.5 kg (< 18.74 lb) (without cards)
Warranty • One year for U8903A
• Three months for standard-shipped accessories (see page 13)
ac
Specifications
The following specifications are based on performance with 30 minutes of warm-up time and a temperature from 0 to 55 °C, unless
stated otherwise.
Audio generator
Generated waveform Sine, dual sine, variable phase, square, noise (Gaussian and rectangular), arbitrary,
DC, multitone, SMPTE IMD (1:1, 4:1, and 10:1), DFD (IEC 60118/IEC 60268)
Sine, dual sine, and variable phase
Frequency
Range
Accuracy
Resolution
Output
Range (balanced)
Range (unbalanced/common)
Amplitude accuracy
Amplitude resolution
Flatness
20 Hz to 20 kHz
5 Hz to 80 kHz
THD + N at 1 kHz, 1 V
20 Hz to 20 kHz bandwidth
Dual sine ratio range 0 to 100 dB
Phase –180 ° to 179.99 °
Sweep Frequency, amplitude, phase
,
rms
5 Hz to 80 kHz
5 ppm
0.1 Hz
0 V to 16 V
0 V to 8 V
± 1%
1 μV
± 0.01 dB
± 0.1 dB
≤ –95 dB (at 23 °C ± 5°C)
≤ –92 dB (from 0 to 55 °C)
rms
rms
(limited to five digits of resolution)
rms
8
Page 9

Specifications (continued)
Audio generator (continued)
Square
Frequency
Range 5 Hz to 30 kHz
Output
Range (balanced)
Range (unbalanced/common)
Amplitude accuracy (at 1 kHz)
Rise time < 2 μs
SMPTE IMD (1:¼ :1/10:1)
Frequency
Low frequency (LF) tone
High frequency (HF) tone
Output
Range (balanced)
Range (unbalanced/common)
Mixed ratio (LF:HF) 10:1, 4:1, or 1:1
Residual IMD (20 Hz to 20 kHz) ≤ –92 dB
Sweep Upper frequency, lower frequency, amplitude
DFD (IEC 60118/IEC 60268)
Frequency
Difference frequency
Upper frequency
Center frequency
Output
Range (balanced)
Range (unbalanced/common)
Inherent distortion (20 Hz to 20 kHz) ≤ –101 dB
Sweep Upper frequency, center frequency, amplitude
Arbitrary/multitone
Sample rate 312.5 kHz
Length 32 to 32,768 points/channel
Maximum number of tones (Length/2) – 1
Noise
Type Gaussian, rectangular
Output
Range (balanced)
Range (unbalanced/common)
DC
Output
Range (balanced)
Range (unbalanced/common)
Amplitude accuracy
DC offset
Applicable for all waveform types except variable phase, DC, and square
Output level
Range
Amplitude accuracy
0 V to 45.2 V
0 V to 22.6 V
2%
40 to 500 Hz
2 to 60 kHz
0 V to 16 V
0 V to 8 V
rms
rms
80 Hz to 2 kHz
3 to 80 kHz
3 to 79 kHz
0 V to 16 V
0 V to 8 V
0 V to 7.2 V
0 V to 3.6 V
rms
rms
rms
rms
–22.6 to 22.6 V
–11.3 to 11.3 V
± 1.5%
–11.3 to 11.3 V
± 1.5%
pp
pp
(Gaussian), 0 V to 13.16 V
(Gaussian), 0 V to 6.58 V
rms
rms
(rectangular)
(rectangular)
9
Page 10

Specifications (continued)
Audio generator (continued)
Output characteristic
Connection type
Balanced
Unbalanced
Common mode
Impedance
Balanced
Unbalanced
Output current limit (typical) 50 mA
Maximum output power into 600 Ω
Balanced (600 Ω)
Unbalanced (600 Ω)
Crosstalk
20 Hz to 20 kHz
20 to 80 kHz
Audio analyzer
Input characteristics
Connection type
Balanced
Unbalanced
Coupling DC, AC
Measurement bandwidth
Low
High
Input ranges 400 mV to 140 V
Measurement range < 1 μV1 to 140 V
Maximum rated input 200 Vp for altitude up to 3,000 m (1.86 miles)
Impedance
Balanced
Unbalanced
Flatness
20 Hz to 20 kHz
20 to 100 kHz
CMRR
≤ 20 kHz (input range ≤ 6.4 V)
≤ 20 kHz (input range > 6.4 V)
Crosstalk
20 Hz to 20 kHz ≤ –101 dB
Input protection Overload protection for all ranges, onscreen warning message on the front panel
1. Defined by 24-bit measurement.
2. ± 0.01 dB – 0.001 dB/Hz below 50 Hz.
3. ± 0.012 dB – 0.001 dB/Hz below 50 Hz.
4. When AC coupled, CMRR will deteriorate at low frequencies.
XLR
BNC
XLR
100, 600 Ω
50, 600 Ω
20 dBm
14 dBm
≤ –101 dB (at 23 °C ± 5 °C)
≤ –99 dB (from 0 °C to 55 °C)
≤ –85 dB
XLR
BNC
30 kHz
100 kHz
rms
rms
200 kΩ
100 kΩ
± 0.01 dB
± 0.012 dB
2
(at 23 °C ± 5 °C)
3
(from 0 °C to 55 °C)
± 0.1 dB (at 23 °C ± 5 °C)
± 0.15 dB (from 0 °C to 55 °C)
4
≥ 70 dB
4
≥ 40 dB
10
Page 11

Specifications (continued)
Audio analyzer (continued)
THD + N and SINAD
Fundamental frequency range 10 Hz to 100 kHz
Display range –999.999 to 0 dB
Accuracy
< 20 kHz
< 100 kHz
Input voltage range < 1 μV to 140 V
Residual distortion
(at 1 kHz, 1 V
3 dB measurement bandwidth > 130 kHz
Detection RMS
Display resolution % up to 3 decimal places (dB up to 2 decimal places)
, 20 Hz to 20 kHz bandwidth) ≤ –101 dB
rms
Signal to noise
Fundamental frequency range 10 Hz to 100 kHz
Display range –999.999 to 0 dB
Accuracy
< 20 kHz
< 100 kHz
Input voltage range < 1 μV to 140 V
Residual distortion
(at 1 kHz, 1 V
, 20 Hz to 20 kHz bandwidth) ≤ –101 dB
rms
Triggering
Type Free run, external
Level 5 V
Minimum trigger high voltage 1.25 V
Maximum trigger low voltage 0.5 V
Input impedance > 50 kΩ
Amplitude
DC measurement range 0 to ± 200 V
DC accuracy ± 1%
AC accuracy (20 Hz to 100 kHz) ± 1% (at 23 °C ± 5 °C)
AC level detection RMS, peak-to-peak, quasi peak
Over range 80% from the peak of the range value will trigger change to next lower range
Frequency
Range 10 Hz to 100 kHz
Minimum input 1 mV (S/N > 40 dB)
Accuracy 5 ppm
Resolution 6 digits
± 0.5 dB
± 0.7 dB
rms
± 0.5 dB
± 0.7 dB
rms
± 2% (from 0 °C to 55 °C)
11
Page 12

Specifications (continued)
Audio analyzer (continued)
Phase
Accuracy
< 20 kHz
< 100 kHz
Minimum input 1 mV (S/N > 40 dB)
Resolution 0.01 °
SMPTE IMD
Residual IMD ≤ 0.0025% (–92 dB)
Graph mode
Size/acquisition length 256, 512, 1024, 2048, 4096, 8192, 16384, 32768
Window Rectangular, Hann, Hamming, Blackman-Harris, Rife-Vincent 1 and 3, Flattop
Amplitude accuracy (flattop window) ± 0.1 dB (± 1.2%)
Display mode
Time domain
Frequency domain
± 2 °
± 4 °
Normal, interpolate, peak, absolute value
Displays highest FFT bin between graph points
Audio filters
Low pass filter • 15 kHz low pass
• 20 kHz low pass
• 30 kHz low pass
• User-defined
High pass filter • 20 Hz high pass
• 100 Hz high pass
• 400 Hz high pass
• User-defined
Weighting filter • A-weighting (ANSI-IEC “A” weighted, per IEC Rec 179)
• CCIR 1K weighted (CCIR Rec. 468)
• CCIR 2K weighted (Dolby 2K)
• C-Message (C-Message per IEEE 743)
• CCITT (ITU-T Rec. O.41, ITU-T Rec. P.53)
• User-defined
1. User-defined filters can be uploaded through standard I/O connections.
1
1
1
12
Page 13

Specifications (continued)
“A” weighting filter frequency response
CCIR-2K weighting filter (Dolby 2K)
Deviation from ideal response: same as listed
previously under CCIR-1K weighting filter
Response (dB)
Frequency (Hz)
“A” weighting filter
“A” Weighting Filter (ANSI-IEC “A” weighted, per IEC Rec. 179)
Deviation from ideal response:
±0.1 dB at 1 kHz
±0.5 dB, 20 Hz to 10 kHz
±1.0 dB, at 10 to 20 kHz
Figure 12. “A”weighting filter frequency response Figure 13. CCIR-2K weighting filter
CCIR-1K filter and CCIR-2K filter frequency response CCITT filter frequency response
Response (dB)
Frequency (Hz)
C-Message weighting filter (C-Message per IEEE 743)
Deviation from ideal response:
±0.1 dB, at 1 kHz
±1.0 dB, 60 Hz to 5 kHz
C-Message
Response (dB)
Frequency (Hz) Frequency (Hz)
CCIR-1K filter
CCIR-2K filter
CCIR-1K weighting filter (CCIR Rec. 468)
Deviation from ideal response:
±0.1 dB, at 6.3 kHz
±0.2 dB, at 6.3 to 7.1 kHz
±0.4 dB, at 7.1 to 10 kHz
±0.5 dB, at 200 Hz to 6.3 kHz
±1.0 dB, at 31.5 to 200 kHz, 10 to 20 kHz
±2.0 dB, at 20 to 31.5 kHz
Figure 14. CCIR-1K filter and CCIR-2K filter frequency response Figure 15. CCITT filter frequency response
Response (dB)
CCITT message weighting filter (ITU-T Rec. 0.41, ITU-T Rec. P.53)
Deviation from ideal response:
±0.2 dB, at 800 Hz
±1.0 dB, at 300 Hz to 3 kHz
±2.0 dB, at 50 Hz to 3.5 kHz
±3.0 dB, at 3.5 to 5 kHz
13
CCITT
Page 14

Specifications (continued)
Sweep capability
Frequency sweep (sine and dual sine waveforms)
Start point 5 Hz to 80 kHz
Stop point 5 Hz to 80 kHz
Amplitude spot value (balanced) 0 V to 16 V
Amplitude spot value (unbalanced/common) 0 V to 8 V
Frequency sweep (square waveform)
Start point 5 Hz to 30 kHz
Stop point 5 Hz to 30 kHz
Amplitude spot value (balanced) 0 V to 22.6 V
Amplitude spot value (unbalanced/common) 0 V to 11.3 V
Frequency sweep (SMPTE IMD 1:¼ :1/10:1 Waveform)
Start point (upper frequency) 2 to 60 kHz
Start point (lower frequency) 40 to 500 Hz
Stop point (upper frequency) 2 to 60 kHz
Stop point (lower frequency) 40 to 500 Hz
Amplitude spot value (balanced) 0 V to 16 V
Amplitude spot value (unbalanced/common) 0 V to 8 V
Frequency sweep (DFD IEC 60118/IEC 60268 Waveform)
Start point (upper frequency) 3 to 80 kHz
Start point (center frequency) 3 to 79 kHz
Stop point (upper frequency) 3 to 80 kHz
Stop point (center frequency) 3 to 79 kHz
Amplitude spot value (balanced) 0 V to 16 V
Amplitude spot value (unbalanced/common) 0 V to 8 V
Difference frequency spot value 80 Hz to 2 kHz
Voltage sweep
Start point (balanced) 0 V to 16 V
Start point (unbalanced/common) 0 V to 8 V
Stop point (balanced) 0 V to 16 V
Stop point (unbalanced/common) 0 V to 8 V
Frequency spot value (sine and dual sine waveforms) 5 Hz to 80 kHz
Frequency spot value (square waveform) 5 Hz to 30 kHz
Frequency spot value (SMPTE IMD 1:¼ :1/10:1 waveform) 40 to 500 Hz (lower frequency), 2 to 60 kHz (upper frequency)
Frequency spot value (DFD IEC 60118/IEC 60268 waveform) 3 to 80 kHz (upper frequency), 3 to 79 kHz (center frequency),
80 Hz to 2 kHz (difference frequency)
DC sweep
Start point (balanced) –22.6 to 22.6 V
Start point (unbalanced/common) –11.3 to 11.3 V
Stop point (balanced) –22.6 to 22.6 V
Stop point (unbalanced/common) –11.3 to 11.3 V
Phase sweep
Start point –180 ° to 179.99 °
Stop point –180 ° to 179.99 °
1. This range is applicable for sine wave only.
14
rms
rms
rms
rms
rms
rms
rms
rms
1
rms
1
rms
1
rms
1
rms
Page 15

Ordering Information
Model number Description
U8903A-200 2-channel audio analyzer
Standard-shipped accessories
• LAN and USB cables
• Power cord
• Product reference CD-ROM (contains U8903A Quick Start Guide and User Guide)
• 1 GB USB flash memory device
• Certificate of calibration
Optional accessories
U8903A-101 Male BNC to male BNC cable; 1.2 m
U8903A-102 Male BNC to male RCA cable; 2 m
U8903A-103 Male XLR to female XLR cable; 2 m
U8903A-908 Rack mount kit – standard 3U
U8903A-ABJ
Warranty and Service
U8903-1A7 ISO17025 Compliant Calibration Test Data
U8903A-A6J ANSI Z540 Compliant Calibration Test Data
R-50C-011-3 Agilent Calibration - 3 years
R-50C-011-5 Agilent Calibration - 5 years
R-51B-001-3C Return to Agilent Warranty - 3 years
R-51B-001-5C Return to Agilent Warranty - 5 years
Japanese User Guide (hardcopy)
15
Page 16
www.agilent.com
www.agilent.com/find/audioanalyzer
Agilent Email Updates
www.agilent.com/find/emailupdates
Get the latest information on the
products and applications you select.
www.lxistandard.org
LAN eXtensions for Instruments puts
the power of Ethernet and the Web
inside your test systems. Agilent
is a founding member of the LXI
consortium.
Agilent Channel Partners
www. agilent.com/find/channelpartners
Get the best of both worlds: Agilent’s
measurement expertise and product
breadth, combined with channel
partner convenience.
MATLAB is a U.S. registered trademark of
The Math Works, Inc.
Agilent Advantage Services is committed to your success throughout
your equipment’s lifetime. We share
measurement and service expertise
to help you create the products that
change our world. To keep you competitive, we continually invest in tools
and processes that speed up calibration and repair, reduce your cost of
ownership, and move us ahead of
your development curve.
www.agilent.com/find/advantageservices
www.agilent.com/quality
For more information on Agilent
Technologies’ products, applications or
services, please contact your local Agilent
office. The complete list is available at:
www.agilent.com/find/contactus
Americas
Canada (877) 894 4414
Brazil (11) 4197 3500
Mexico 01800 5064 800
United States (800) 829 4444
Asia Pacific
Australia 1 800 629 485
China 800 810 0189
Hong Kong 800 938 693
India 1 800 112 929
Japan 0120 (421) 345
Korea 080 769 0800
Malaysia 1 800 888 848
Singapore 1 800 375 8100
Taiwan 0800 047 866
Other AP Countries (65) 375 8100
Europe & Middle East
Belgium 32 (0) 2 404 93 40
Denmark 45 70 13 15 15
Finland 358 (0) 10 855 2100
France 0825 010 700*
*0.125 €/minute
Germany 49 (0) 7031 464 6333
Ireland 1890 924 204
Israel 972-3-9288-504/544
Italy 39 02 92 60 8484
Netherlands 31 (0) 20 547 2111
Spain 34 (91) 631 3300
Sweden 0200-88 22 55
United Kingdom 44 (0) 118 9276201
For other unlisted Countries:
www.agilent.com/find/contactus
Revised: October 14, 2010
Product specifications and descriptions
in this document subject to change
without notice.
© Agilent Technologies, Inc. 2010, 2011
Printed in USA, February 16, 2011
5990-3831EN
 Loading...