

Page 1
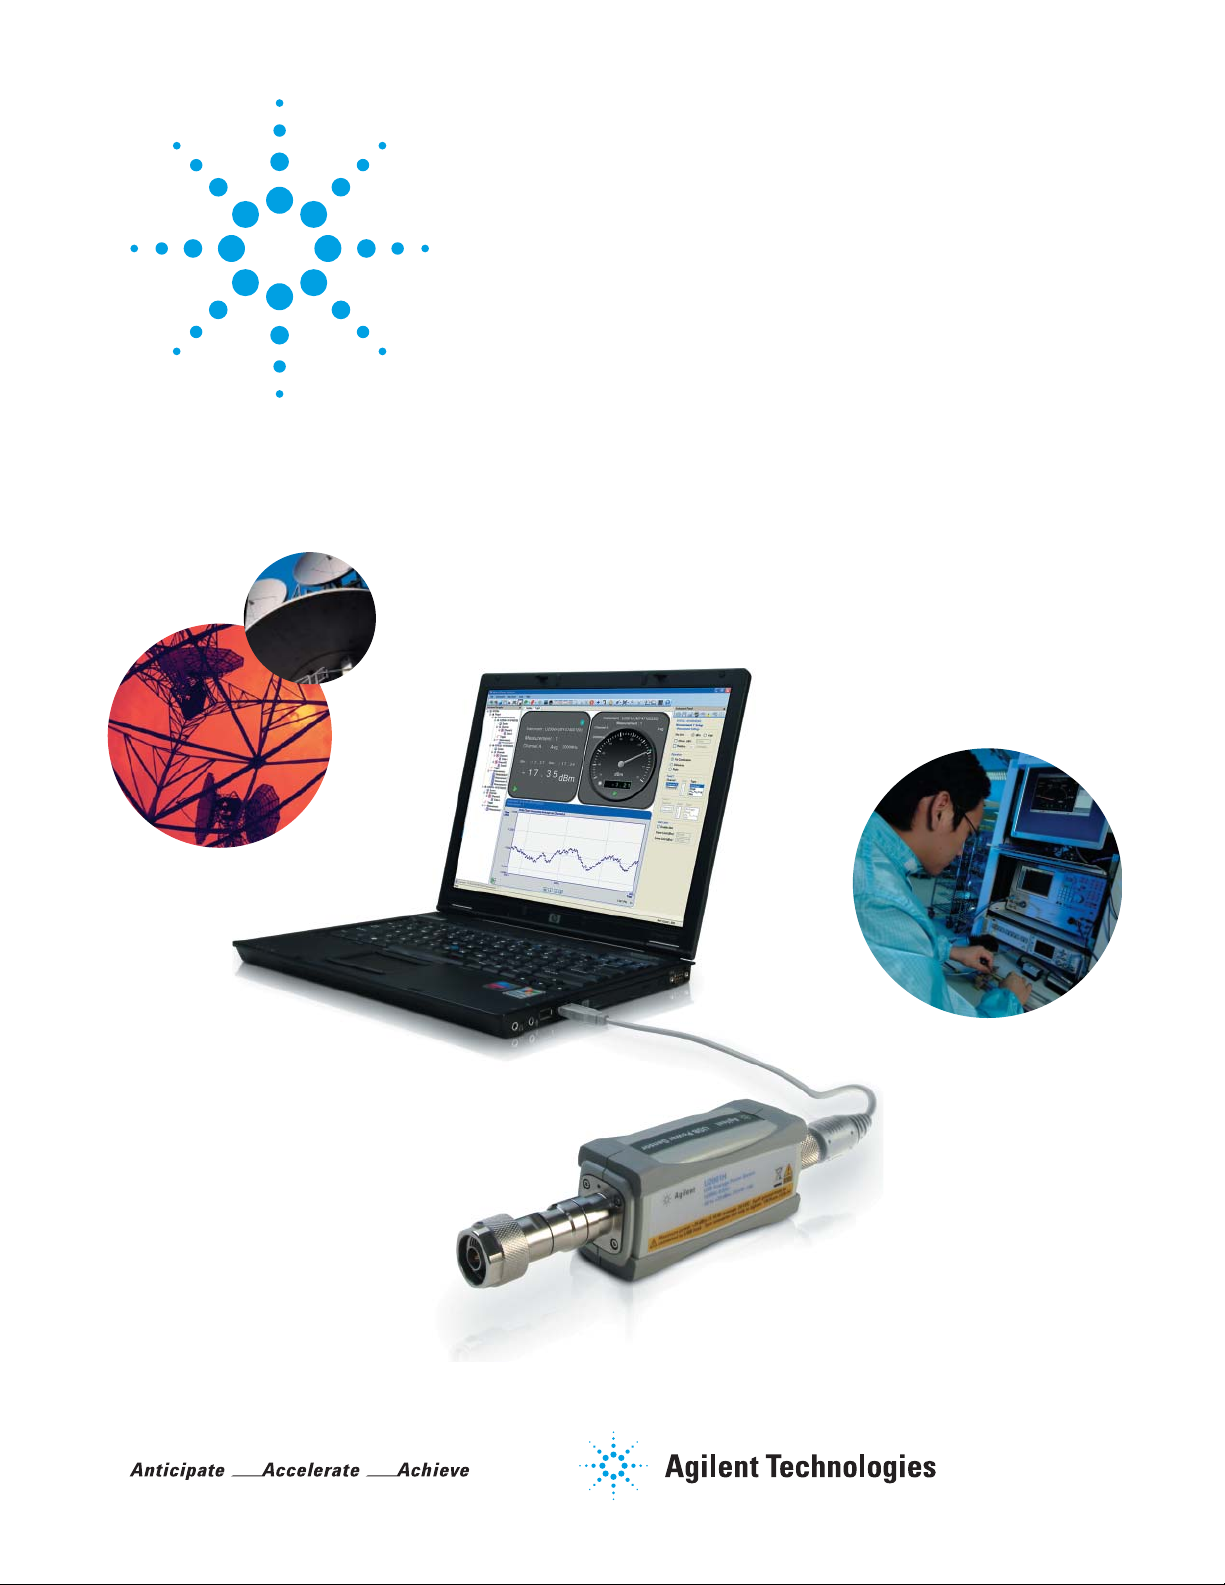
Agilent U2000 Series USB
Power Sensors
Data Sheet
The compact, low-cost
alternative to conventional
power measurement solutions
Page 2

Why Agilent’s Power Meters and Sensors?
Reliable, high-performing solutions
Every power meter and sensor from Agilent consistently delivers great results.
A sure investment for many years to come
Code-compatibility between power meters reduces the need for re-coding. Not
only that, all Agilent power meters are backward-compatible with most legacy
power sensors.
One specific application: One right solution
Agilent offers a wide selection of power meters and sensors for practically
all application needs—wireless communications, radar pulse measurements,
component test, and more.
Global network support
No matter where you are, Agilent is committed to giving you the 24-hour
support you need regarding our products, applications, or services.
Agilent’s power meters have long been
recognized as the industry standard for
RF and microwave power measurements.
2
Page 3
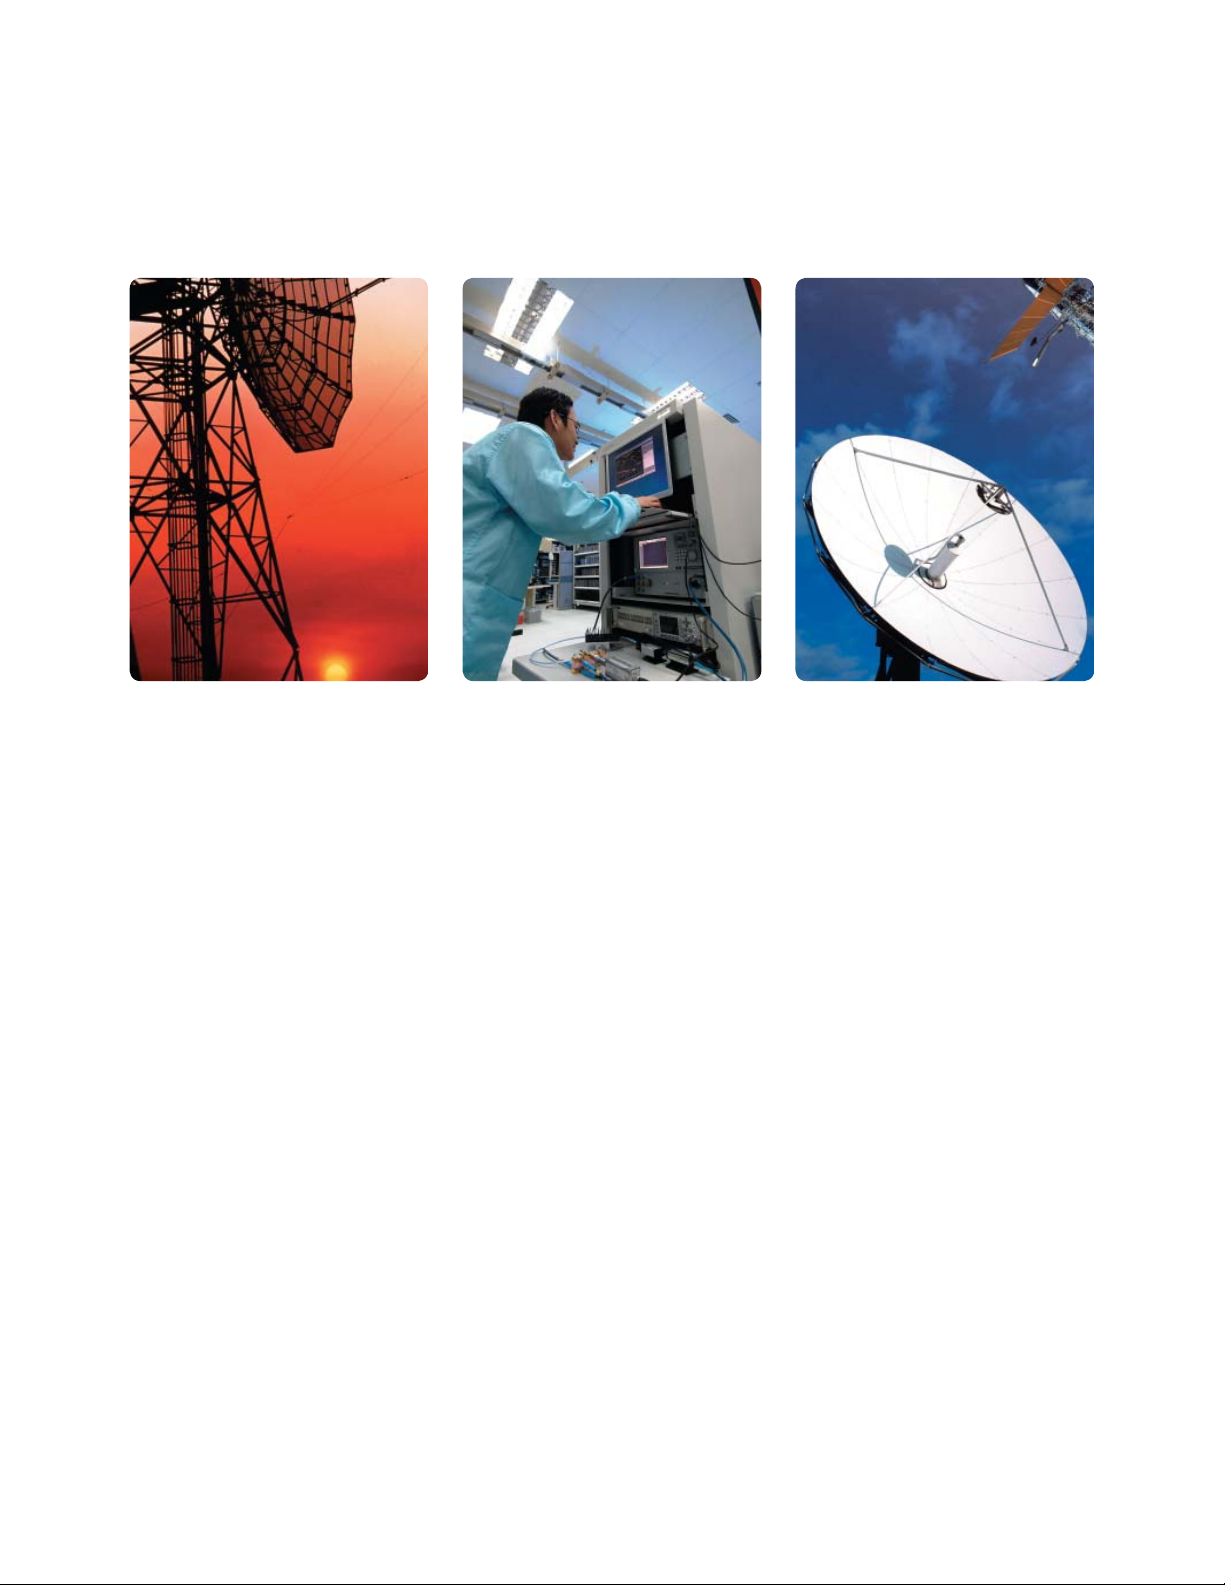
Compact Solutions for Testing Today’s RF and Microwave
Communication Systems
For installation and
maintenance of base stations
• Lightweight and rugged
• Simple set-up and usage
• Portable with low power
consumption
For production testing of
wireless components
• Compact build saves rack space
• Simple set-up and usage
• Wide dynamic and frequency
ranges
For R&D of wireless
components
• Compact build saves bench space
• Simple set-up and usage
• Wide dynamic and frequency
ranges
• Wide dynamic and frequency
ranges
• Quick and easy testing with large
display of readings
• Internal trigger eliminates the
problem for applications that do
not have external trigger signal
• Trace display capability enables
easy gate setup
• Fast reading speed
• Internal zeroing reduces test time
and sensor wear-and-tear
• Quick and easy multiple channels
testing with simultaneous display
of readings, limits and alerts
• Seamless integration to system
with industry-standard SCPI
• Internal trigger eliminates the
problem for tests that do not have
external trigger signal
• Trace display capability enables
easy trigger level and gate setup
• High accuracy
• Advanced troubleshooting of
designs with simultaneous display
of multiple readings, measurement
math and data recording
• Internal trigger eliminates the
problem for applications that do
not have external trigger signal
3
Page 4
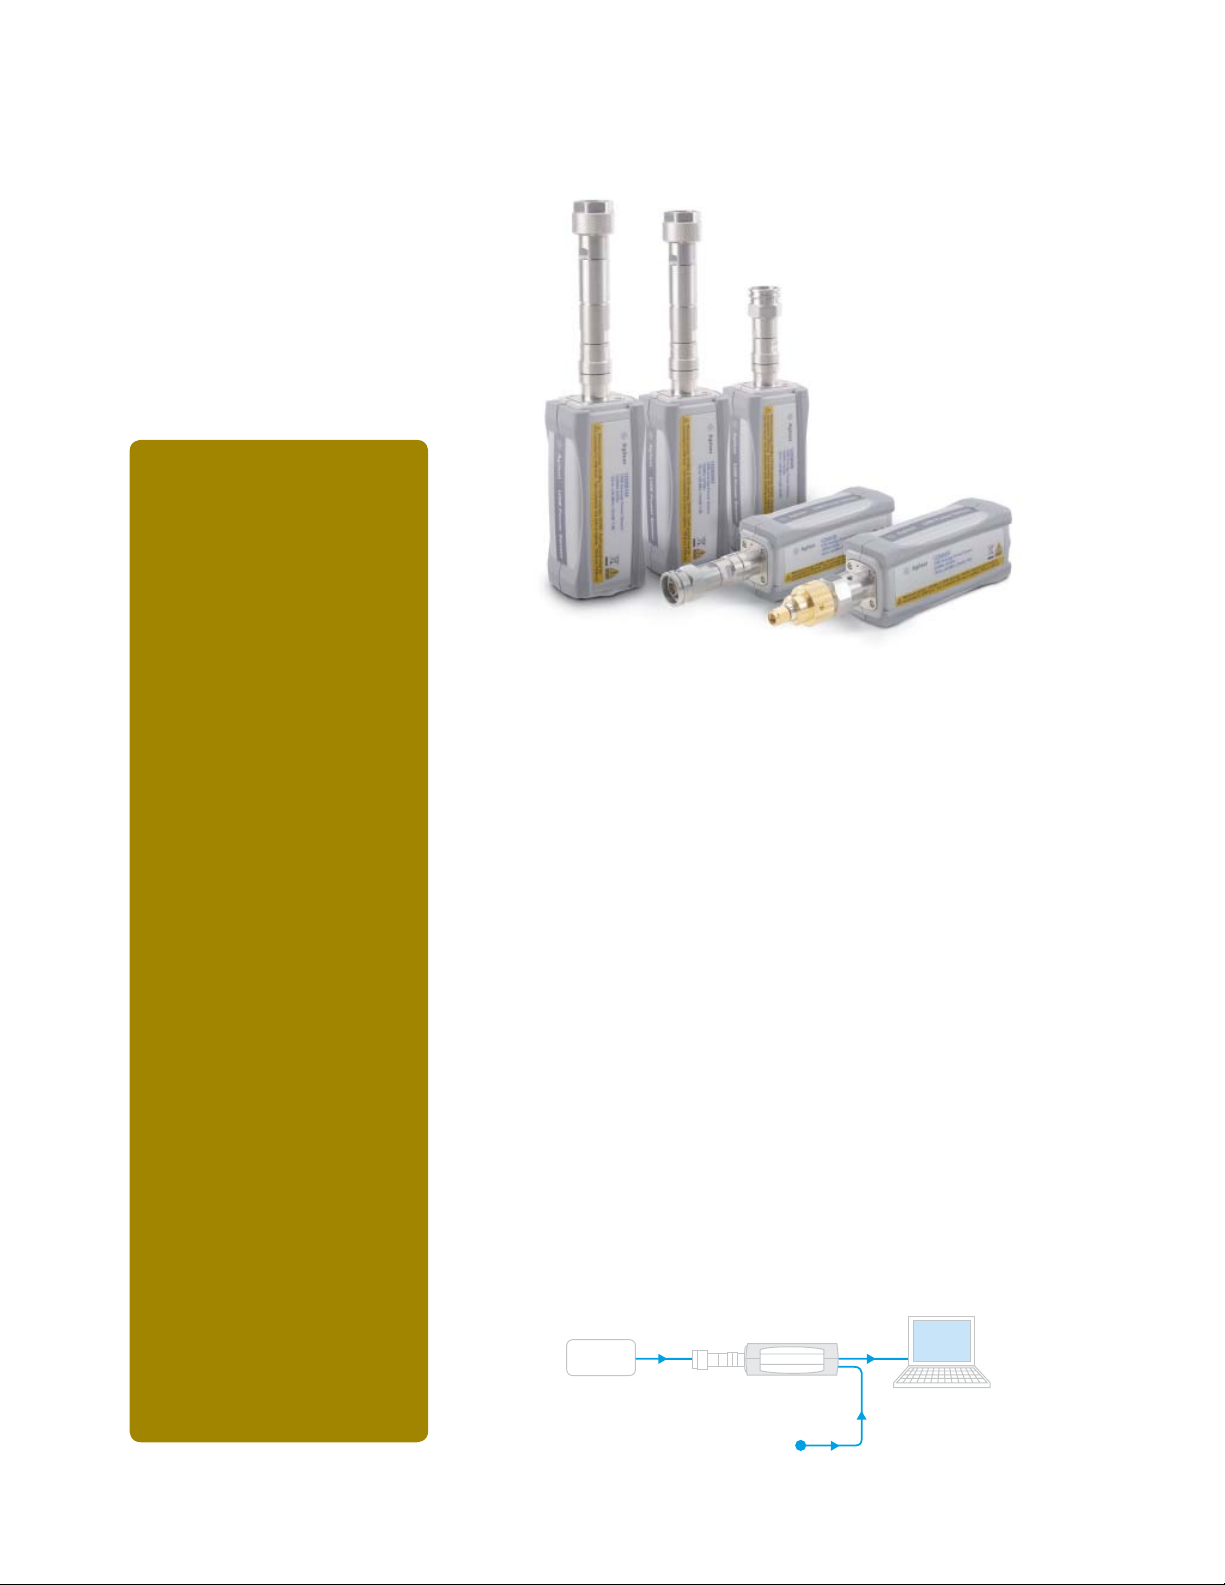
Introducing the U2000 Series USB Power Sensors
The U2000 Series enable simpler,
lower-cost power measurements
versus conventional power meter and
sensor combinations. Now with nine
high-performance models, the U2000
Series USB power sensors offer compact, high-performance solutions for
today’s CW and modulated signals.
Key features
• Compact, lightweight solutions
• Quick, simple set-up
• High accuracy, high power
• Internal zeroing capability
• Fast reading speed
• Wide frequency range: 9 kHz
to 26.5 GHz (sensor option
dependant)
• Wide dynamic range: –60 to
+44 dBm
• Support internal and external
trigger measurements*
• Trace display capability
enables easy trigger level and
gate setup for burst signals
• Allows remote measurements
beyond cable length
• Enables monitoring of
more than 20 channels
simultaneously
• Converts select Agilent
instruments to power meters
• Feature-packed software
provides various capabilities
for easy testing and analysis
• Average power measurements
of CW and modulated signals,
including GSM, EDGE, WLAN
and WiMAX
* Except U2004A model
TM
Compact “power meters”,
simple set-up
The U2000 Series are standalone
sensors. That means they essentially
operate like power meters, just in
smaller forms. No reference calibrator is required. The fact that each
sensor draws minimal power from a
USB port—and that it doesn’t need
additional triggering modules or
power adaptors to operate—makes
it more portable, especially for base
station testing. Setting up is easy:
just plug it to the USB port of your
PC or laptop—or even select network
or handheld spectrum analyzer—and
start your power measurements.
The figure below illustrates the very
simple, straightforward setup of the
U2000 Series.
USB sensor
DUT
High accuracy
Each U2000 Series sensor provides
excellent linearity, SWR and uncertainty specifications, so you can be
confident in every measurement you
make.
Wide range, high power
The U2000 Series’ dynamic range
spans across a wide 80 dB, taking on
high power up to +44 dBm.
Remote monitoring and tests
With the U2000 Series sensor
plugged to a networked USB hub,
you can conveniently monitor power
measurements of an antenna tower
from the control room, beyond the
limits of USB cable lengths.
Trigger signal
4
Page 5

Introducing the U2000 Series USB Power Sensors (continued)
Faster production testing of
multiple channels
The U2000 Series’ fast measurement
speed helps reduce test time. This,
coupled with the capability to enable
monitoring of more than 20 channels
simultaneously, is an advantage in
the production line where efficiency
is of utmost priority.
The U2000 Series has both internal
and external zeroing capabilities.
With internal zeroing, high isolation
switches in the sensor are opened to
isolate the sensor from the deviceunder-test (DUT) it is connected to.
As such, you don’t need to power-off
the DUT or disconnect the sensors.
This speeds up testing and reduces
sensor wear-and-tear.
No manual input of calibration data
is required. All calibration factors,
as well as temperature and linearity
corrections, are stored in the sensors’
EEPROM, auto-downloaded at
calibration.
Often times, you’d need to automate
your tests. The U2000 Series sensors
are well-equipped for seamless integration to your system with industrystandard SCPI compatibility. They
also come with built-in triggering
capability to allow receipt of external
triggers from other instruments.
Transform your signal generators and spectrum analyzers into
accurate power meters
You could literally have a power meter next to you—or instead, turn your Agilent
MXG signal generator or N9340A/B handheld spectrum analyzer into a power
meter for accurate power measurements. Even with the U2000 connected, you
can switch between power measurements and the device’s original function at
any time. You can also use the U2000 with your Agilent PNA network analyzer
for source power calibration.
Intuitive power analysis software
The N1918A Power Analysis Manager software not only displays measurements
with the U2000 Series, it also provides various features and functions to help
you monitor and troubleshoot signals efficiently and effectively.
Multiple display types
1
1. Software capability differs between the two
versions of the software: Power Panel and
Power Analyzer. Please refer to page18 for
detailed comparison.
Multiple channel list and measurement math
Data recording with limit and alert settings
Min/Max readings
5
1
Page 6
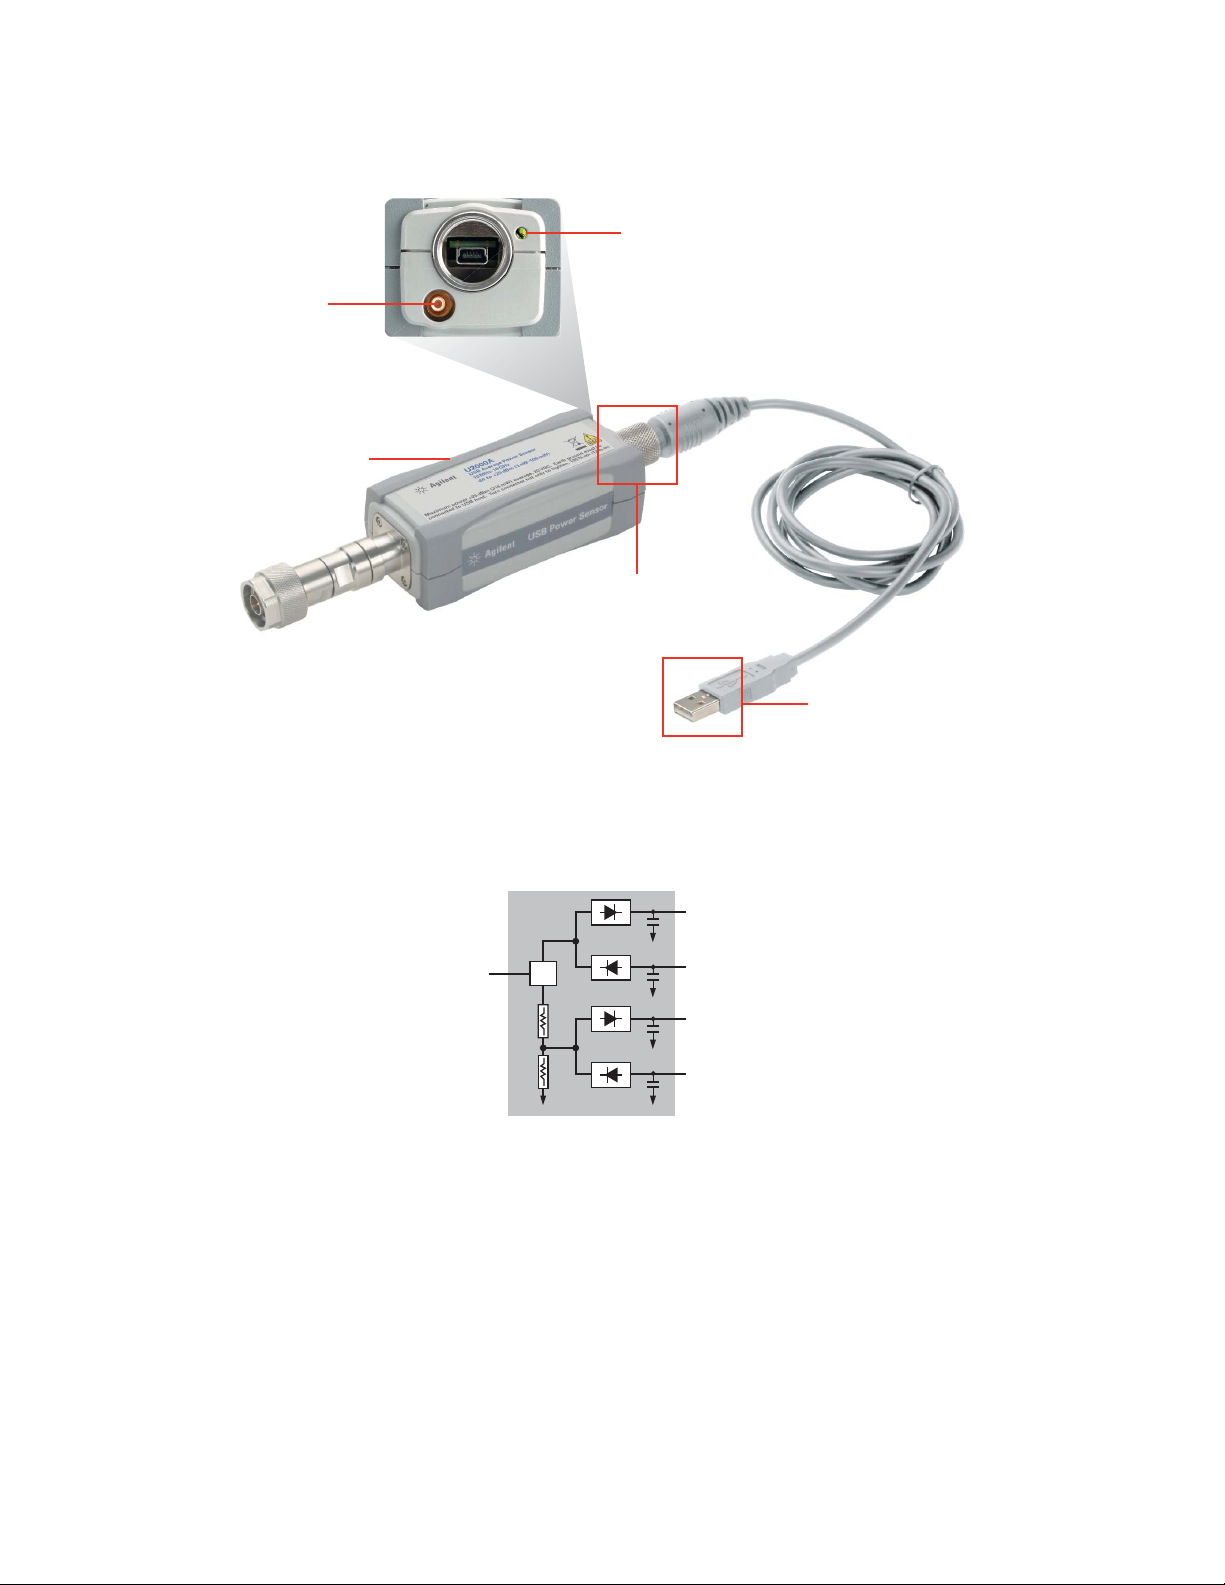
Take a Closer Look
Built-in triggering port for
synchronization with external
instruments or events
Small and lightweight build
LED indicator for PC communication
Secure locking mechanism
USB 2.0-compliant cable
for connection to PC or
other instruments
Diode-based sensors frequently
rely on the application of correction
factors to extend their dynamic range
beyond their square-law region, typically in the range of –70 to –20dBm.
While this technique achieves
measurement of CW signals over
a wide dynamic range, it fails to do
so for modulated signals when the
signal level is above the square-law
region. Modulated signals must be
padded down, with their average and
peak power levels within the diode
square-law region, for accurate average power measurement.
The U2000 Series USB power sensors
are true-average, wide-dynamic-range
RF/microwave power sensors,
based on a dual-sensor diode pair/
attenuator/diode pair topology as
proposed by Szente et. al. in 19901.
The simplified block diagram shown
here illustrates this technique.
Low Sense
RF in
Low Sense
High Sense
High Sense
This technique ensures diodes in the
selected signal path are kept in their
square law region—with output current and voltage proportional to input
power. The diode pair/attenuator/
diode pair assembly can then yield
the average of complex modulation
formats across a wide dynamic range,
irrespective of signal bandwidth.
+
The dual-range Modified Barrier
Integrated Diode (MBID)2 package
–
incorporates diode stacks in place of
single diodes. This further improves
+
measurement accuracy of high-level
signals with high crest factors with-
–
out incurring damage
3
to the sensor.
Implementation of both techniques in
the U2000 Series USB sensors enable
effective average power measurements of a wide range of signals,
including multitone and spread spectrum signals used in CDMA, W-CDMA
and digital television sytems.
1. US Patent #4943764, assigned to Hewlett-Packard Company
2. November 1986 Hewlett-Packard Journal pages 14-2, “Diode Integrated Circuits for Millimeter-Wave Applications”
3. Refer to “Maximum Power” on page 9 for maximum power handling specifications
6
Page 7
Specifications
Specifications contained in this chap-
Frequency and power ranges
ter are valid ONLY after proper calibration of the power sensor and apply to
continuous wave (CW) signals unless
otherwise stated. The recommended
calibration interval for this product is
one year. Specifications apply over a
temperature range 0 to +55 °C unless
otherwise stated. Specifications
quoted over a temperature range
of 25 °C ± 10 °C apply to a relative
humidity of 15% to 75% and conform
to the standard environmental test
conditions. Specifications are valid
after a 30-minute warm-up period.
Model Frequency range Power range Maximum power
U2000A 10 MHz to 18 GHz
U2001A 10 MHz to 6 GHz
U2002A 50 MHz to 24 GHz
U2004A 9 kHz to 6 GHz –60 to +20 dBm
U2000B 10 MHz to 18 GHz
U2001B 10 MHz to 6 GHz
U2000H 10 MHz to 18 GHz
U2001H 10 MHz to 6 GHz
U2002H 50 MHz to 24 GHz –50 to +30 dBm
–60 to +20 dBm
–30 to +44 dBm
–50 to +30 dBm
+25 dBm avg, 20 VDC
+33 dBm pk, < 10 µs
+25 dBm avg, 5 VDC
+33 dBm pk, < 10 µs
+45 dBm avg, 20 VDC
+47 dBm pk, 1 µs
+33 dBm avg, 20 VDC
+50 dBm pk, 1 µs
+33 dBm avg, 10 VDC
+50 dBm pk, 1 µs
Supplemental characteristics, shown
in italics, are intended to provide useful information with regard to applying the power sensors in that they
contain typical, but non-warranted
performance parameters. These
characteristics are shown in italics
or denoted as “typical”, “nominal” or
“approximate”.
Measurement speed
Normal: 20 readings/s
x2: 40 readings/s
Fast: 110 readings/s
Buffered (50 readings):
1000 readings/s
The U2000 Series USB sensors have
two measurement modes:
Average only mode (default mode):
optimized for wide dynamic range. In
this measurement mode, a trigger can
be controlled externally via TTL input.
Normal2 mode: used for making average power measurement in a defined
time interval (time-gated measurement) with reduced dynamic range.
A trigger can be derived from an RF
signal (internal trigger) or controlled
externally via TTL input (external
trigger).
1. The 1000 reading/s is the derived measurement speed from the first 50 readings in buffered mode. The maximum number of measurements that can be obtained in one
second is 250 readings in buffered mode.
2. Not applicable for U2004A.
1
Maximum SWR
Maximum SWR
Model Frequency range
10 to 30 MHz
30 MHz to 2 GHz
U2000A
U2001A
U2002A
U2004A
U2000B
U2001B
U2000H
U2001H 10 MHz to 6 GHz 1.15 1.17
U2002H
2 to 14 GHz
14 to 16 GHz
16 to 18 GHz
10 to 30 MHz
30 MHz to 2 GHz
2 to 6 GHz
50 MHz to 2 GHz
2 to 14 GHz
14 to 16 GHz
16 to 18 GHz
18 to 24 GHz
9 kHz to 2 GHz
2 to 6 GHz
10 MHz to 2 GHz
2 to 12.4 GHz
12.4 to 18 GHz
10 MHz to 2 GHz
2 to 6 GHz
10 MHz to 8 GHz
8 to 12.4 GHz
12.4 to 18 GHz
50 MHz to 8 GHz
8 to 12.4 GHz
12.4 to 18 GHz
18 to 24 GHz
(25 °C ± 10 °C)
1.15
1.13
1.19
1.22
1.26
1.15
1.13
1.19
1.13
1.19
1.22
1.26
1.30
1.13
1.19
1.12
1.17
1.24
1.12
1.17
1.15
1.25
1.28
1.15
1.25
1.28
1.30
Maximum SWR
(0 °C to 55 °C)
1.21
1.15
1.20
1.23
1.27
1.21
1.15
1.20
1.15
1.20
1.23
1.27
1.30
1.15
1.20
1.14
1.18
1.25
1.14
1.18
1.17
1.26
1.29
1.17
1.26
1.29
1.31
7
Page 8
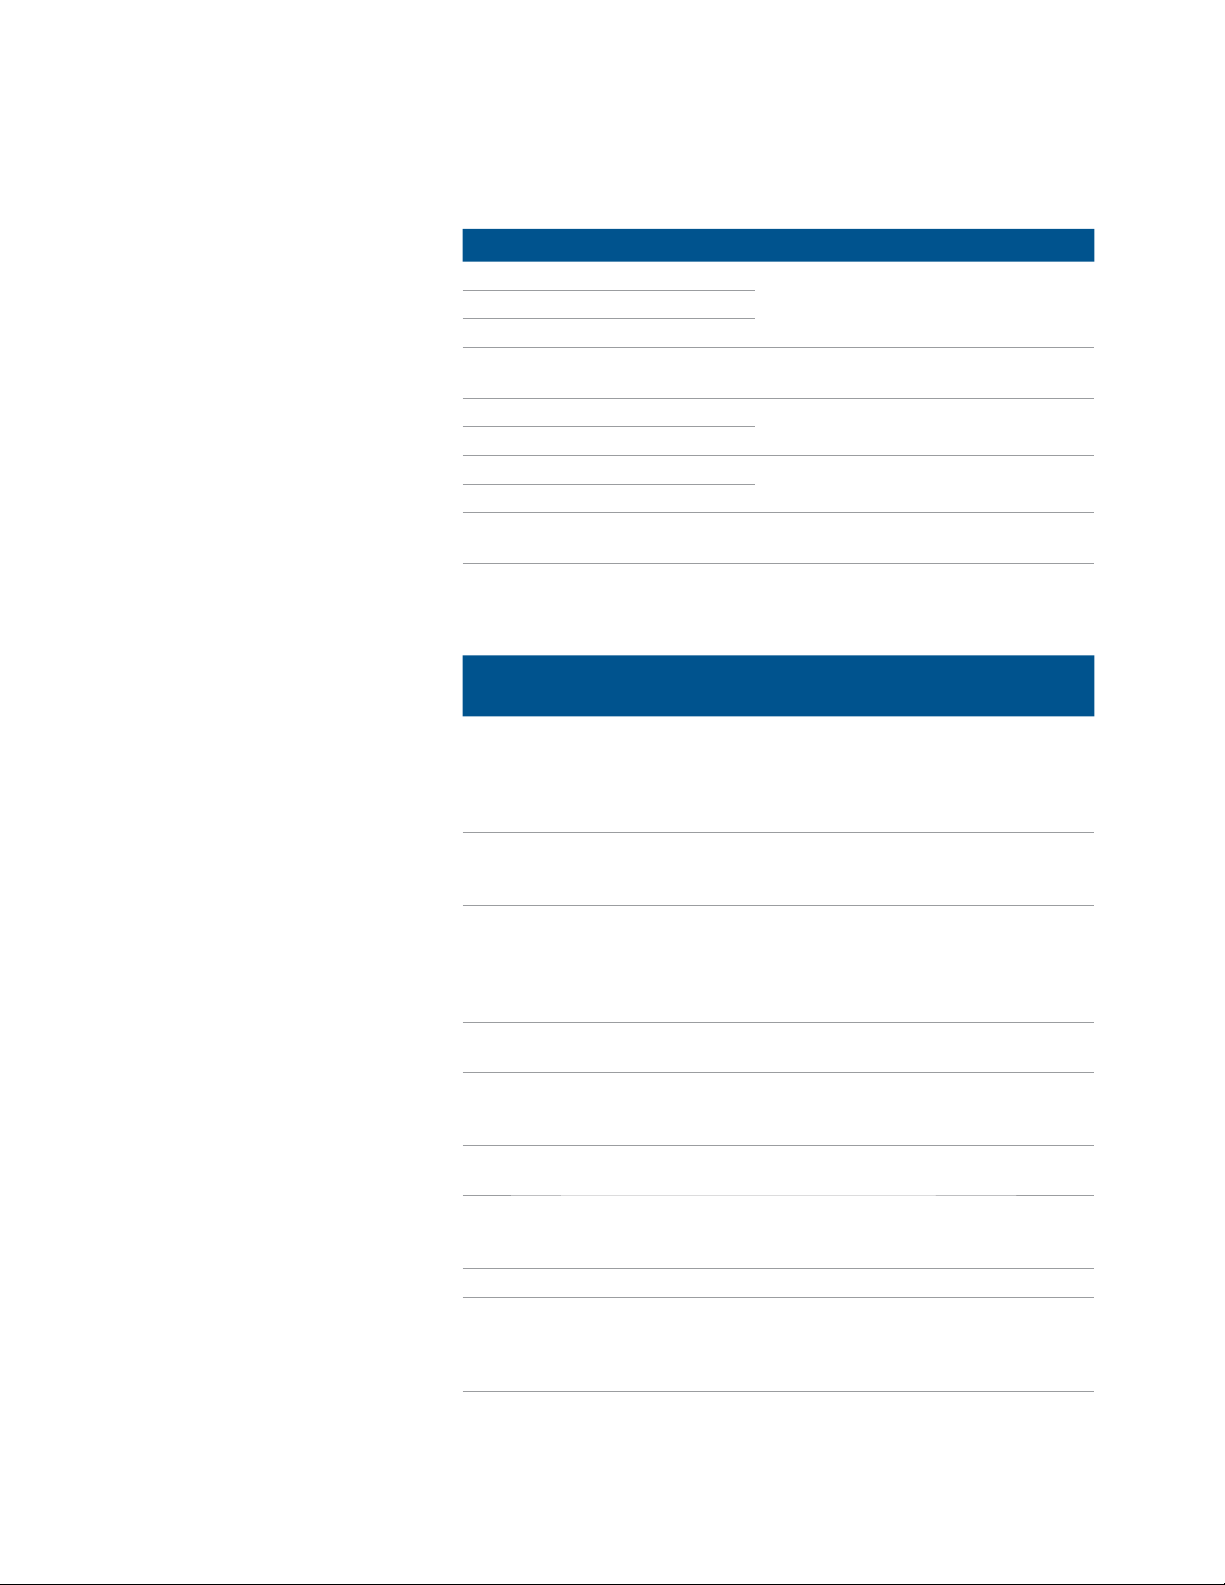
Specifications (continued)
Typical SWR for U2000A sensor
(25 °C ± 10 °C)
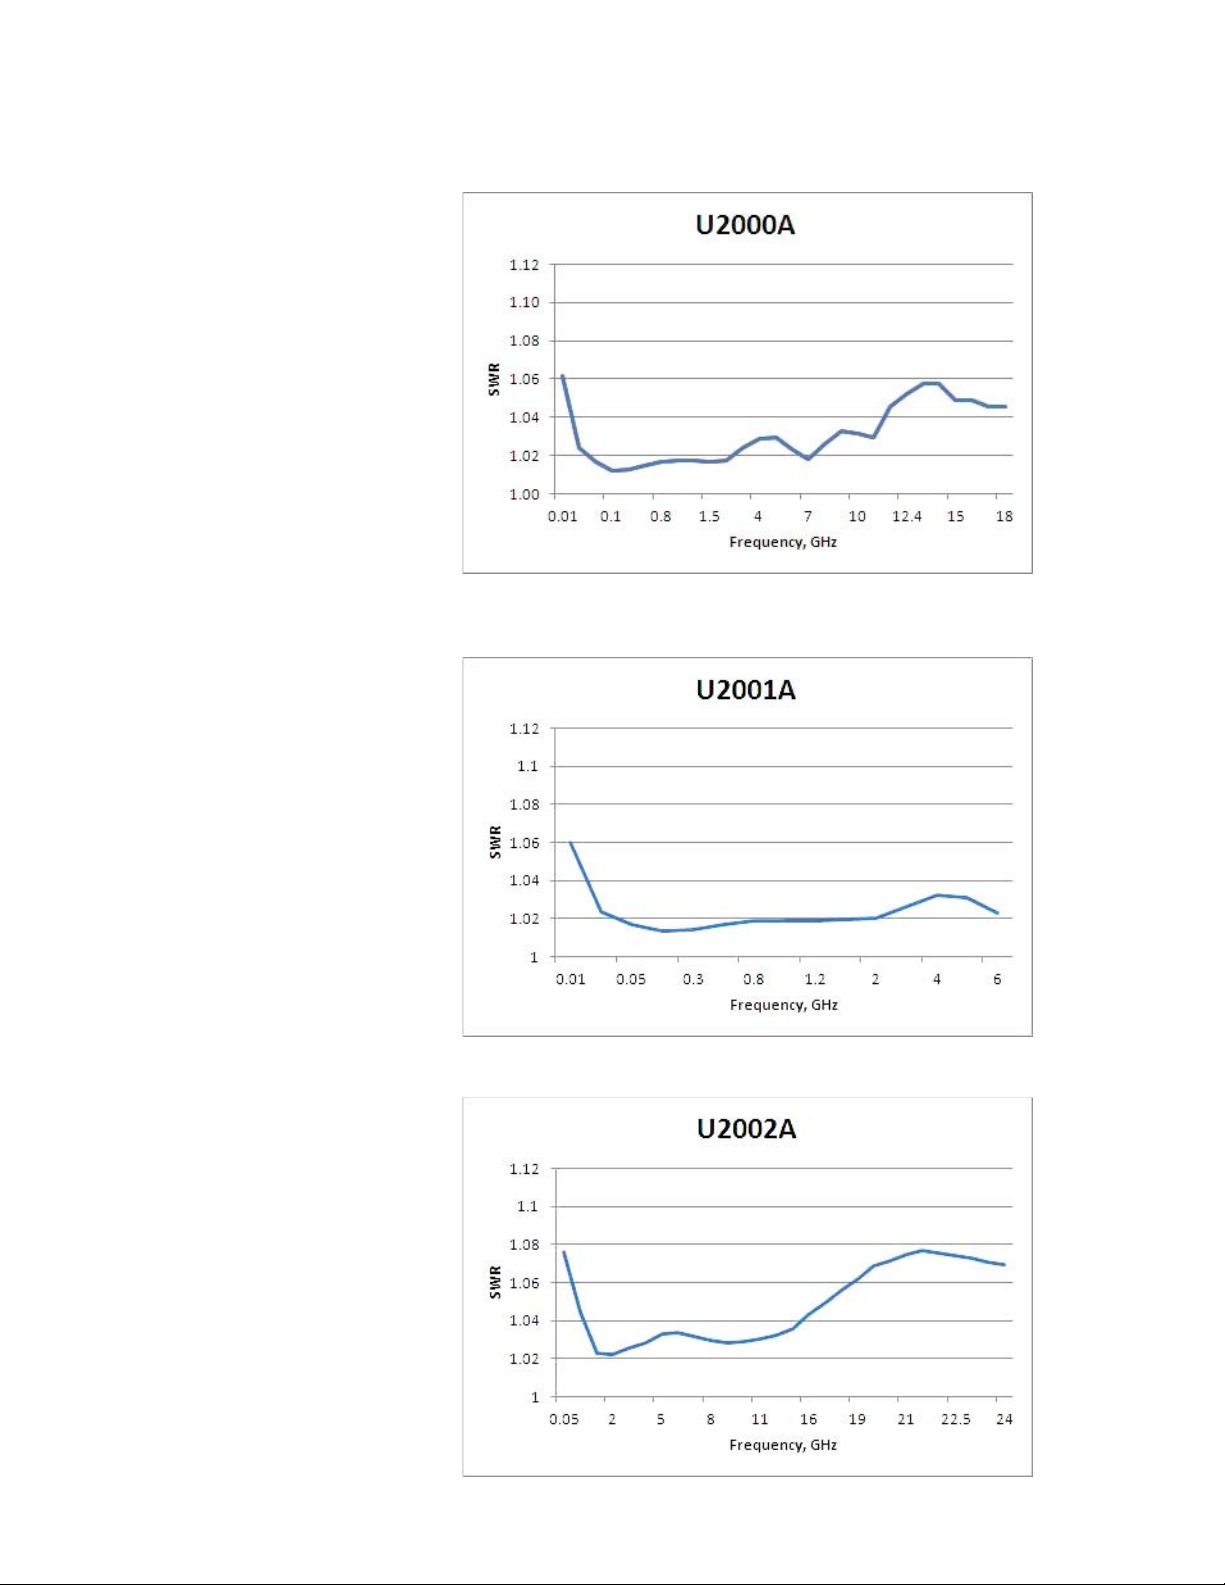
Typical SWR for U2001A sensor
(25 °C ± 10 °C)
Typical SWR for U2002A sensor
(25 °C ± 10 °C)
8
Page 9

Specifications (continued)
Typical SWR for U2004A sensor (25 °C ± 10 °C)
Typical SWR for U2000H sensor (25 °C ± 10 °C)
Typical SWR for U2002H sensor (25 °C ± 10 °C)
Typical SWR for U2000B sensor (25 °C ± 10 °C)
Typical SWR for U2001H sensor (25 °C ± 10 °C)
Typical SWR for U2001B sensor (25 °C ± 10 °C)
9
Page 10

Specifications (continued)
Switching point
The U2000 Series power sensors have two measurement paths: a low power path and a high power path, as shown in the table below.
Models AUTO (default) range Low power path High power path Switching point
U2000/1/2/4A –60 to +20 dBm –60 to –7 dBm –7 to +20 dBm –7 dBm
U2000/1/2H –50 to +30 dBm –50 to +3 dBm +3 to +30 dBm +3 dBm
U2000/1B –30 to +44 dBm –30 to +23 dBm +23 to +44 dBm +23 dBm
Each power sensor automatically
selects the proper power level path.
To avoid unnecessary switching when
the power level is close to the switching point, switching point hysteresis
has been added.
Example with U2000 “A” suffix
sensors: Switching point for the
U2000/1/2/4A sensors is at –7dBm.
Hysteresis causes the low power
path to remain selected until approximately –6.5 dBm as the power level
is increased. Above this power, the
Offset at switching point:
≤ ± 0.5% (≤ ± 0.02 dB) typical
high power path is selected. The high
power path remains selected until
approximately –7.5 dBm is reached
Switching point hysteresis:
± 0.5 dBm typical
as the signal level decreases. Below
this power, the low power path is
selected.
Power accuracy
Average only Mode Power Accuracy1 (with exclusions)
Model Power range Accuracy1 (25 °C ± 10 °C) Accuracy1 (0 °C to 55 °C)
U2000/1/2/4A –60 to +20 dBm ±3.0% ±3.5%
U2000/1/2H –50 to +30 dBm ±4.0% ±5.0%
U2000/1B –30 to +44 dBm ±3.5% ±4.0%
Specifications valid with the following conditions:
• After zeroing
• Number of averages = 1024
• After 30 minutes of power-on warm-up
3
1, 2
Normal Mode Power Accuracy
(with exclusions)
Model Power level Accuracy (25 °C ± 10 °C)
U2000/1/2/A
U2000/1/2H
U2000/1B
1. This accuracy is essentially a combination of linearity, instrumentation accuracy, and traceability to absolute accuracy at 50 MHz, 0 dBm.
Note: Mismatch uncertainty, calibration factor uncertainty, and power level dependent terms (zero set, drift, and noise) are excluded in this specification and specified
elsewhere in the data sheet.
2. The accuracy for –7 to +1 dBm (U2000/1/2A), +3 to +11 dBm (U2000/1/2H), and +23 to +31 dBm (U2000/1B) power level will be dominated by zero set and
measurement noise. For overall accuracy, refer to the measurement uncertainty calculator which is available on the Agilent Technologies Web site.
3. It is advisable to perform external zeroing on the U2000 Series power sensor for power measurement level below –30 dBm. During the external zeroing process, the RF
input signal must be switched off or the device-under-test disconnected from the U2000 Series power sensor.
–30 to +20 dBm ±4.0%
–20 to +30 dBm ±5.0%
0 to +44 dBm ±4.5%
10
Page 11

Specifications (continued)
Typical power accuracy at 25 °C for
U2000/1/2/4A sensors
1, 2
Typical power accuracy at 25 °C for
U2000/1B sensors
1, 2
Typical power accuracy at 25 °C for
U2000/1/2H sensors
1. Measurement uncertainty ≤ 1.9%. At room temperature and excluding power level dependent terms (zero set, drift, and noise).
Refer to Agilent Fundamentals of RF and Microwave Power Measurements (Part 3) Power Measurement Uncertainty per International Guide
(Application Note 1449-3), 5988-9215EN for more information on measurement uncertainty.
2. After zeroing, 30 minutes of power-on warm-up, and 1024 averages.
1, 2
11
Page 12

Specifications (continued)
Zero set, zero drift, and measurement noise
Average only Mode
Power range
U2000/1/2/4A
–60 to –35 dBm
–38 to –15 dBm
–20 to –6.5 dBm
–7.5 to –2 dBm
–4 to 15 dBm
10 to 20 dBm
U2004A
–60 to –35 dBm
–38 to –15 dBm
–20 to –6.5 dBm
–7.5 to –2 dBm
–4 to 15 dBm
10 to 20 dBm
U2000/1/2H
–50 to –25 dBm
–28 to –5 dBm
–10 to 3.5 dBm
2.5 to 8 dBm
6 to 25 dBm
20 to 30 dBm
U2000/1B sensors
–30 to –5 dBm
–8 to 15 dBm
10 to 23.5 dBm
22.5 to 28 dBm
26 to 44 dBm
1
Zero set (internal) Zero set (external) Zero drift
± 1.5 nW
± 2 nW
± 12 nW
± 2 µW
± 4 µW
± 6 µW
± 2.8 nW
± 3 nW
± 12 nW
± 2 µW
± 4 µW
± 6 µW
± 15 nW
± 20 nW
± 120 nW
± 20 µW
± 40 µW
± 60 µW
± 1.8 µW
± 2 µW
± 12 µW
± 2 mW
± 4 mW
± 600 pW
± 1.5 nW
± 10 nW
± 500 nW
± 1 µW
± 5 µW
± 600 nW
± 1.5 nW
± 10 nW
± 500 µW
± 1 µW
± 5 µW
± 8 nW
± 20 nW
± 100 nW
± 20 µW
± 30 µW
± 60 µW
± 800 nW
± 2 µW
± 10 µW
± 1 mW
± 2 mW
200 pW
400 pW
1.5 nW
50 nW
500 nW
2 µW
200 nW
400 nW
1.5 nW
50 nW
500 µW
2 µW
2 nW
4 nW
15 nW
500 nW
5 µW
20 µW
200 nW
400 nW
1.5 µW
50 nW
500 µW
2
Measurement noise
1 nW
1.5 nW
15 nW
650 nW
1 µW
10 µW
1 nW
1.5 nW
15 nW
650 µW
1 µW
10 µW
10 nW
15 nW
150 nW
6.5 µW
10 µW
100 µW
1 µW
1.5 µW
15 µW
650 µW
1 mW
3
1. Condition: (i) 0 to 55 °C and (ii) 95% relative humidity at 40 °C non-condensing.
2. Within one hour after zero set, at a constant temperature, after a 24-hour warm-up of the power sensor.
3. The number of averages at 1 for Normal speed, gate length of 2.27 ms, measured over one minute interval and two standard deviations.
12
Page 13

Normal Mode
1
Range
U2000/1/2A
–38 to –15 dBm
–20 to –6.5 dBm
–7.5 to –2 dBm
–4 to 15 dBm
10 to 20 dBm
U2000/1/2H
–28 to –5 dBm
–10 to 3.5 dBm
–2.5 to 8 dBm
8 to 25 dBm
20 to 30 dBm
U2000/1B
–8 to 15 dBm
10 to 23.5 dBm
22.5 to 28 dBm
26 to 44 dBm
Zero set
(internal)
47 nW
530 nW
30 µW
32 µW
270 µW
730 nW
5.3 µW
330 µW
440 µW
3.9 µW
47 nW
530 nW
30 µW
32 µW
Zero set
(external) Zero drift
43 nW
480 nW
27 µW
30 µW
200 µW
500 nW
4.8 µW
270 µW
300 µW
2.8 mW
43 µW
480 µW
27 mW
34 mW
25 nW
230 nW
19 µW
24 µW
110 µW
300 nW
3 µW
190 µW
300 µW
1.1 mW
25 µW
230 µW
19 mW
24 mW
Measurement
2
noise
28 nW
300 nW
20 µW
21 µW
180 µW
310 nW
5 µW
230 µW
260 µW
2.8 mW
28 µW
300 µW
20 mW
21 mW
3
Noise per
sample
90 nW
1 µW
55 µW
85 µW
550 µW
900 nW
10 µW
550 µW
850 µW
5.5 mW
90 µW
1 mW
55 mW
85 mW
4
1. Condition: (i) 0 to 55 °C and (ii) 95% relative humidity at 40 °C non-condensing.
2. Within one hour after zero set, at a constant temperature, after a 24-hour warm-up of the power sensor.
3. The number of averages at 1 for Normal speed, gate length of 2.27 ms, measured over one minute interval and two standard deviations.
4. The Noise Per Sample specification is only applicable for gated power working range stated in the “Normal Mode Key Specifications and Characteristics” table.
13
Page 14

Specifications (continued)
Effect of time-gating and averaging
on normal mode measurement noise:
The normal mode measurement
noise wil depend on the gate length
(time-gated period in second) and the
number of averages. The noise can
be approximately calculated with the
following equations.
If the gate length is < 2.73 µs, use Equation 1:
Otherwise, use Equation 2:
Note: If the noise value obtained
from Equation 1 or 2 is lower than the
measurement noise specification, use
the value as specified in the measurement noise table.
Effects of averaging on noise:
Averaging over 1 to 1024 readings is
available for reducing noise. The table
below provides the measurement
noise for a particular sensor with the
number of averages set at 16 (for
normal mode) and 32 (for x2 mode).
Use the noise multiplier, for the
appropriate of averages, to determine
the total measurement noise value.
Noise = Noise per sample ×
Noise = Noise per sample ×
1
Number of averages
1
Number of averages
Example:
U2000A power sensor, –60 to
–35dBm, normal mode, number of
averages = 4
Measurement noise calculation:
1 nW x 1.7 = 1.7 nW
4
×
(
Gate length/(0.68 µs)
1/4
)
Average only Mode
Number of averages 12481632641282565121024
Noise multiplier
Normal mode
x2 mode
2.0
2.7
1.8
2.4
1.7
2.0
1.5
1.6
1.0
1.0
14
0.95
0.91
0.74
0.78
0.55
0.53
0.39
0.34
0.29
0.29
0.21
0.20
Page 15

Specifications (continued)
Settling time
Manual filter, 10-dB decreasing power step (not across switching points)
Number of averages 12481632641282565121024
Settling time (s)
Normal speed
x2 speed
Auto filter, default resolution, 10-dB decreasing power step
0.045
0.042
0.09
0.05
0.17
0.09
0.34
0.17
0.66
0.34
1.3
0.66
2.6
1.3
5.2
2.6
10.4
5.2
20.9
10.4
41.9
20.9
Typical
settling
times
x2
speed
45 ms 45 ms
82 ms 90 ms
1.3 s 2.6 s
1.5 s 2.7 s
450 ms 460 ms
1.6 s 2.8 s
20 s 39 s
24 s 42 s
24 s 42 s
Normal
speed
U2000/1/2/4A U2000/1/2H U2000/1B
+10 dBm
+2 dBm
–4 dBm
–10 dBm
–20 dBm
–30 dBm
–40 dBm
–50 dBm
+20 dBm
+12 dBm
+6 dBm
0 dBm
–10 dBm
–20 dBm
–30 dBm
–40 dBm
+40 dBm
+32 dBm
+26 dBm
+20 dBm
+10 dBm
0 dBm
–10 dBm
–20 dBm
Maximum dBm
High power path
Sensor
dynamic
range
Low power path
Minimum dBm
Settling time with auto filter, default resolution, and a 10 dB decreasing power step (not across the switching point)
Settling time = 25 ms*
* When a power step crosses through the sensor’s auto-range switching point, add 25 ms
15
Page 16

Specifications (continued)
Calibration factor and reflection
coefficient
Calibration factor (CF) and reflection
coefficient (Rho) data is unique to
each sensor. The CF corrects for the
frequency response of the sensor.
The reflection coefficient (Rho or ρ)
relates to the SWR based on the following formula:
1 – ρ
Maximum uncertainties of the CF
data are listed in the following table.
There is only one set of CF data used
for both high and low power paths of
each sensor.
The uncertainty analysis for the calibration data was done in accordance
with the ISO Guide. The uncertainty
data reported on the calibration certificate is the expanded uncertainty
with a 95% confidence level and a
coverage factor of 2.
SWR =
1 + ρ
Frequency Uncertainty (%) (25 °C ± 10 °C)
U2000A sensor
10 to 30 MHz
30 MHz to 2 GHz
2 to 14 GHz
14 to 16 GHz
16 to 18 GHz
1.8
1.6
2.0
2.2
2.2
U2001A sensor
10 to 30 MHz
30 MHz to 2 GHz
2 to 6 GHz
1.8
1.6
2.0
U2002A sensor
50 MHz to 2 GHz
2 to 14 GHz
14 to 16 GHz
16 to 18 GHz
18 to 24 GHz
2.0
2.5
2.7
2.7
3.0
U2004A sensor
9 kHz to 2 GHz
2 to 6 GHz
1.8
1.8
U2000B sensor
10 MHz to 2 GHz
2 to 12.4 GHz
12.4 to 18 GHz
1.8
2.0
2.2
U2001B sensor
10 MHz to 2 GHz
2 to 6 GHz
1.8
2.0
U2000H sensor
10 MHz to 8 GHz
8 to 12.4 GHz
12.4 to 18 GHz
2.0
2.0
2.2
U2001H sensor
10 MHz to 6 GHz 2.0
U2002H sensor
50 MHz to 8 GHz
8 to 12.4 GHz
12.4 to 18 GHz
18 to 24 GHz
2.5
2.5
2.7
3.0
16
Page 17

Specifications (continued)
Trigger
Internal trigger
Resolution
Level accuracy
Jitter
External TTL trigger input
Impedance 50 Ω or 1 kΩ
Trigger low
Trigger high
Minimum trigger pulse width
Minimum trigger repetition period
Trigger latency
Trigger delay
Range
Resolution
Trigger hold-off
Range
Resolution
Trigger hysteresis
Range
Resolution
0.1 dB
± 1 dB
± 1 µs
< 1.1 V
> 1.9 V
35 ns
80 ns
11 µs ± 2 µs
–0.15 to + 0.15 s
1 µs
1 µs to 400 ms
1 µs
0 to +3 dB
0.1 dB
1
Normal Mode key specifications and characteristics
Parameters
Maximum video bandwidth
Minimum rise time
Minimum fall time
Range settling time
Minimum pulse width
Sampling rate 1.47 Msps
Maximum capture length 150 ms
Maximum pulse repetition rate 150 kHz
Dynamic range
1. This is only available for option U2001A-H16
2. Not applicable for U2004A
2
Performance
40 kHz
40 µs
40 µs
150 µs
200 µs
U2000/1/2A: –30 to +20 dBm
U2000/1/2H: –10 to +30 dBm
U2000/1B: 0 to +44 dBm
17
Page 18

Specifications (continued)
General specifications
Physical characteristics
Dimensions (LxWxH) U2000/1/4A: 163.75 mm x 46.00 mm x 35.90 mm
U2002A: 134.37 mm x 46.00 mm x 35.90 mm
U2000/1B: 308.00 mm x 115.00 mm x 84.00 mm
U2000/1H: 207.00 mm x 46.00 mm x 36.00 mm
U2002H: 164.00 mm x 46.00 mm x 36.00 mm
Weight U2000/1/4A: 0.262 kg
U2002A: 0.226 kg
U2000/1B: 0.762 kg
U2000/1H: 0.324 kg
U2002H: 0.274 kg
Operating environment
Temperature 0 °C to 55 °C
Humidity Up to 95% relative humidity at 40 °C (non-condensing)
Altitude Up to 4600 m (15,000 ft)
Pollution Degree 2
Storage and shipment
Environment Sensor should be stored in a clean, dry environment
Temperature –30 °C to +70 °C
Humidity Up to 90% relative humidity at 65 °C (non-condensing)
Altitude Up to 4600 m (15,000 ft)
Pollution Degree 2
Other
Current requirement 200 mA max (approximately)
Connector U2000/1/4A, U2000/1H, U2000/1B: N-type (m), 50 Ω
U2002A, U2002H: 3.5 mm (m), 50 Ω
Cable USB 2.0 Type A to 5-pin Mini-B
®
Programmability SCPI , Agilent VEE, LabVIEW, Microsoft
Safety and EMC compliance IEC 61010-1:2001/EN 61010-1:2001 (2nd edition)
IEC 61326:2002 / EN61326:1997+A1:1998+A2:2001+A3:2003
Canada: ICES-001:2004
Australia/New Zealand: AS/NZS CISPR11:2004
Calibration
Warranty
Compatible instruments Agilent N9340A/B handheld spectrum analyzers
1
1
1 year
1 year
Agilent MXG signal generators
Agilent PNA, PNA-L and PNA-X Series performance network analyzers
Visual Basic
1. See “Ordering information” for available options
18
Page 19

Using the U2000 Series with the N1918A Power Analysis Manager
The N1918A software is available
in two versions: the basic Power
Panel and advanced Power Analyzer.
Power Analyzer provides full access
to the software’s complete features
and capabilities and its licenses,
N1918A-100 (PC license) and
N1918A-200 (USB dongle license),
are available for purchase separately.
A free, fully functional trial version
of the Power Analyzer automatically
runs for 30 days upon installation
from the bundled N1918A Power
Analysis Manager CD. The table here
shows functions accessible with each
version when used with the U2000
Series.
Power panel (basic) Power analyzer (advanced)
Measurement displays
Compact mode display √ √
Soft panel (digital) display √ √ (enhanced with limits and alerts notification)
Gauge (analog) display √ √ (enhanced with limits and alerts notification)
Strip chart display √ √
Trace graph display √ √
Multiple tabs X √
Multiple display per tab √ √
Multilist √ √
Graph functions
Single marker √ (up to 2 markers per graph) √ (up to 10 markers per graph)
Dual marker √ (one set of markers per graph1) √ (up to 5 sets of markers per graph)
Graph autoscaling √ √
Graph zooming √ √
Measurement math √ (delta, ratio) √ (delta, ratio)
(continued)
1. Applies to usage with P-Series power meters
19
Page 20

Using the U2000 Series with the N1918A Power Analysis Manager
(continued)
(continued)
Power panel (basic) Power analyzer (advanced)
Save/Load file functions
Save measurement data (with
timestamp)
Load measurement data √ (applicable in Strip Chart and Trace Graph) √ (applicable in Strip Chart and Trace Graph)
Data recording
2
(with timestamp) X √ (applicable in Trace Graph2, Soft Panel, Strip
Instrument settings options
Save and restore instrument setting √ √
Time-gated measurements √ √
Instrument preset settings √ √
FDO table parameters √ √
Measurement limit and alert functions
Limit and alert notification X √
Alert summary X √
Support function
Print application screen √ √
√ (applies to strip chart display; up to 10,000
data points)
√ (applicable in Strip Chart and Trace Graph)
Chart, and Gauge)
2. Recording time for trace graphs may vary based on trace graph settings
Display units:
Absolute: Watts or dBm
Relative: Percent or dB
Relative:
Displays all successive measurements relative to the last referenced
value
Display resolution:
Resolution of 1.0, 0.1, 0.01 and 0.001
dB in log mode; one to four digits in
linear mode
Offset:
Allows power measurements to be
offset by –100 dB to +100 dB, configurable in 0.001 dB increments, to
Default resolution:
compensate for external loss or gain
0.01 dB in log mode; three digits in
linear mode
Duty cycle:
Duty cycle values between 0.001% to
Zero:
For performing internal and external
zeroing
99.999% can be entered in increments
of 0.01% to display a pulse power
representation of measured power.
The following equation is used to
Range:
Sensor-dependent, configurable in
1-kHz steps
calculate the displayed pulse power
value: Pulse Power = Measured
Power/Duty Cycle
Limits:
High and low limits can be set in
the range between –150.00 dBm
to +230.000 dBm, in 0.001 dBm
increments
Preset default values:
Channel Offset (dB) = 0, Duty Cycle
Off, Frequency 50 MHz, AUTO
Average, AUTO Range, Free Run
Mode, dBm mode
20
Page 21

Using the U2000 Series with the N1918A Power Analysis Manager
(continued)
System requirements
Hardware
Processor Desktop PC: 1.3 GHz Pentium® IV or higher recommended
Laptop PC: 900 MHz Pentium M or higher recommended
RAM 512 MB (1.0 GB or higher recommended)
Hard disk space 1.0 GB or more free disk space at runtime
Resolution 800 x 600 or higher (1280 x 1024 recommended)
Operating system and browser
Operating system Windows® 7 32-bit
Windows Vista 32-bit
Windows XP Professional 32-bit Service Pack 2 or higher
Browser Microsoft Internet Explorer 5.1 (6.0 or higher recommended)
Software
Agilent IO Libraries Suite Version 15.53 or higher
Microsoft .NET Framework Runtime version 2.0
Microsoft Visual C++ 2005 Runtime Libraries
4
Version 1.0 or higher
1
2
1. Supports USB License Key only
2. Supports both PC Licensing and USB License Key
3. Available on the Agilent Automation-Ready CD-ROM. Agilent IO Libraries Suite 15.5 is required if your PC is running on Windows Vista 32-bit operating system.
4. Bundled with N1918A Power Analysis Manager CD
21
Page 22

Ordering Information
Power sensors
Models Description Power range Connector type
U2000A 10 MHz to 18 GHz USB sensor –60 to +20 dBm N-type male, 50 Ω
U2000B 10 MHz to 18 GHz USB sensor –30 to +44 dBm N-type male, 50 Ω
U2000H 10 MHz to 18 GHz USB sensor –50 to +30 dBm N-type male, 50 Ω
U2001A 10 MHz to 6 GHz USB sensor –60 to +20 dBm N-type male, 50 Ω
U2001B 10 MHz to 6 GHz USB sensor –30 to +44 dBm N-type male, 50 Ω
U2001H 10 MHz to 6 GHz USB sensor –50 to +30 dBm N-type male, 50 Ω
U2002A 50 MHz to 24 GHz USB sensor –60 to +20 dBm 3.5 mm male, 50 Ω
U2002H 50 MHz to 24 GHz USB sensor –50 to +30 dBm 3.5 mm male, 50 Ω
U2004A 9 kHz to 6 GHz USB sensor –60 to +20 dBm N-type male, 50 Ω
Options and accessories
U2001A-H03 U2001A sensor with extended frequency range, 3 MHz to 6 GHz
U2001A-H16 With 1K ohms input trigger impedance. Higher impedance is typically required when several instruments’ input
trigger ports are connected in parallel for triggering purpose. Standard option has 50 ohms input trigger
impedance.
U2001A-H25 U2001A sensor with extended power range, –60 dBm to +25 dBm
U2002A-H26 U2002A sensor with extended frequency range, 10 MHz to 26.5 GHz
Standard-shipped accessories
Trigger cable BNC Male to SMB female 50 Ω, 1.5 m
Power sensor cable: 1.5 m, 3.0 m, or 5.0 m
U2000 Series USB Power Sensor Documentation CD
N1918A Power Analysis Manager Assembly
Agilent Automation-Ready CD (contains Agilent IO Libraries Suite)
Warranty
1-year, return-to-Agilent warranty and service plan for the U2000 Series USB power sensors
3 months for standard-shipped accessories
22
Page 23

Ordering Information (continued)
Accessories, calibration and documentation options
Cables Description
U2031A USB 2.0 Type A to 5-pin Mini-B cable with secure locking mechanism, 1.5 m (5 ft)
U2031B USB 2.0 Type A to 5-pin Mini-B cable with secure locking mechanism, 3.0 m (10 ft)
U2031C USB 2.0 Type A to 5-pin Mini-B cable with secure locking mechanism, 5.0 m (16.4 ft)
U2032A BNC (m) to SMB (f) trigger cable, 1.5 m, 50 W
Travel kits Description
U2000A-201 Transit case
U2000A-202 Soft carrying case
U2000B-201 Transit case
U2000A-204 Soft carrying pouch
Hanging kit Description
U2000A-203 Holster
Calibration Description
Option 1A7 ISO 17025 calibration with test data
Option A6J ANSI Z540 calibration with test data
Warranty Description
Option R-51B-001-3C Extension of warranty and service plan from 1 year to 3 years
Option R-51B-001-5C Extension of warranty and service plan from 1 year to 5 years
Documentation Description
Option OB1 English language Operating and Service Guide
Option ABD German language Operating and Service Guide
Option ABE Spanish language Operating and Service Guide
Option ABF French language Operating and Service Guide
Option ABJ Japanese language Operating and Service Guide
Option ABZ Italian language Operating and Service Guide
Option AB2 Simplified Chinese language Operating and Service Guide
Software Description
N1918A-100 Power Analyzer version of N1918A Power Analysis Manager software (PC license)
N1918A-200 Power Analyzer version of N1918A Power Analysis Manager software (USB dongle license)
Complementary I/O
connectivity hardware Description
3
E5813A
Networked 5-port USB hub
1
2
U2000A/B-201 Transit case
1. U2000A-201 transit case for A model only.
2. U2000B-201 transit case for B and H model
3. Refer to www.agilent.com/find/e5813a for more information on the device
U2000A-202 Soft carrying case U2000A-203 Holster
U2000A-204 Soft carrying pouch
23
Page 24

www.agilent.com
s
www.agilent.com/find/usbsensor
myAgilent
myAgilent
www.agilent.com/find/myagilent
A personalized view into the information most
relevant to you.
www.axiestandard.org
AdvancedTCA
Instrumentation and Test (AXIe) is an
open standard that extends the
AdvancedTCA for general purpose and
semiconductor test. Agilent is a founding
member of the AXIe consortium.
www.lxistandard.org
LAN eXtensions for Instruments puts the
power of Ethernet and the Web inside
your test systems. Agilent is a founding
member of the LXI consortium.
www.pxisa.org
PCI eXtensions for Instrumentation
(PXI) modular instrumentation delivers
a rugged, PC-based high-performance
measurement and automation system.
®
Extensions for
Agilent Channel Partners
www.agilent.com/find/channelpartners
Get the best of both worlds: Agilent’s
measurement expertise and product
breadth, combined with channel partner
convenience.
Three-Year Warranty
www.agilent.com/find/ThreeYearWarranty
Agilent’s combination of product reliability
and three-year warranty coverage is another
way we help you achieve your business goals:
increased confidence in uptime, reduced cost
of ownership and greater convenience.
Agilent Advantage Services
www.agilent.com/find/AdvantageServices
Accurate measurements throughout the
life of your instruments.
Agilent Electronic Measurement Group
DEKRA Certified
ISO 9001:2008
Quality Management SystemQuality Management Sy
www.agilent.com/quality
For more information on Agilent
Technologies’ products, applications or
services, please contact your local Agilent
office. The complete list is available at:
www.agilent.com/find/contactus
Americas
Canada (877) 894 4414
Brazil (11) 4197 3600
Mexico 01800 5064 800
United States (800) 829 4444
Asia Pacifi c
Australia 1 800 629 485
China 800 810 0189
Hong Kong 800 938 693
India 1 800 112 929
Japan 0120 (421) 345
Korea 080 769 0800
Malaysia 1 800 888 848
Singapore 1 800 375 8100
Taiwan 0800 047 866
Other AP Countries (65) 375 8100
Europe & Middle East
Belgium 32 (0) 2 404 93 40
Denmark 45 45 80 12 15
Finland 358 (0) 10 855 2100
France 0825 010 700*
*0.125 €/minute
Germany 49 (0) 7031 464 6333
Ireland 1890 924 204
Israel 972-3-9288-504/544
Italy 39 02 92 60 8484
Netherlands 31 (0) 20 547 2111
Spain 34 (91) 631 3300
Sweden 0200-88 22 55
United Kingdom 44 (0) 118 927 6201
For other unlisted countries:
www.agilent.com/find/contactus
(BP-3-1-13)
Product specifications and descriptions
in this document subject to change
without notice.
© Agilent Technologies, Inc. 2013
Published in USA, April 4, 2013
5989-6278EN
 Loading...