

Page 1
Agilent
N9923A FieldFox
RF Vector Network Analyzer
2 MHz to 4/6 GHz
Data Sheet
Page 2

Table of Contents
Definitions ...................................................................................................................... 2
FieldFox RF Vector Network Analyzer ....................................................................... 3
Cable and Antenna Analyzer (Option 305) ............................................................. 10
External USB Power Sensor Support (Option 302) ............................................... 10
Vector Voltmeter (Option 308) .................................................................................. 11
Block Diagram ............................................................................................................. 11
General Information .................................................................................................... 12
Remote control capability (Option 030) .................................................................. 12
N9923A FieldFox RF VNA Options ........................................................................... 14
N9923A Upgrade Options .......................................................................................... 15
Calibration Kits ............................................................................................................ 15
FieldFox Data Link Software ..................................................................................... 16
Definitions
Specification (spec.)
Warranted performance. Specifications include guardbands to account for the
expected statistical performance distribution, measurement uncertainties, and
changes in performance due to environmental conditions. The following conditions must be met:
FieldFox has been turned on for 10 minutes.
FieldFox is within its calibration cycle.
FieldFox remains at a stable surrounding environment temperature (between
-10 to 55 °C) for 90 minutes prior to turn-on and during operation.
Typical (typ.)
Expected performance of an average unit at a stable temperature between 20 °C
to 30 °C for 90 minutes prior to turn-on and during operation; does not include
guardbands. It is not covered by the product warranty. The FieldFox must be
within its calibration cycle.
Nominal (nom.)
A general, descriptive term or design parameter. It is not tested, and not covered
by the product warranty.
Calibration
The process of measuring known standards to characterize an instrument’s
systematic (repeatable) errors.
Corrected (residual)
Indicates performance after error correction (calibration). It is determined by the
quality of calibration standards and how well “known” they are, plus system
repeatability, stability, and noise.
2
Page 3

FieldFox RF Vector Network Analyzer
Description
Frequency range
Frequency reference
Accuracy ±2 ppm
Aging rate ±1 ppm/yr
Temperature stability ±1 ppm over -10 to 55 ºC
Frequency resolution 1 Hz < 3.2 GHz
Data points 101, 201, 401, 601, 801, 1001, 1601, 4001, 10,001 (custom number of
Measurements S11, S21 magnitude and phase
Formats Log magnitude, linear magnitude, VSWR,
Directivity
Corrected, with full two-port
calibration, N9910X-800 calibration
kit (option 122)
Corrected with QuickCal (option 112) 38 dB (typical)
System impedance 50Ω (nominal) 75Ω with appropriate adapter and
System dynamic range
2 MHz to 6 GHz 90 dB 100 dB (typical)
Receiver dynamic range
2 MHz to 6 GHz 104 dB (typical)
Receiver compression level at 0.1 dB compression +10 dBm (typical)
Test port output power
High +5 dBm (nominal)
Low -40 dBm (nominal)
Manual Power settable in 1 dB steps
Test port 1 or 2 damage level
2 MHz to 6 GHz +23 dBm
Trace noise (high output power, IF bandwidth = 300 Hz)
Magnitude < 3 GHz, 0.008 dB rms (typical)
Temperature stability
Stability magnitude 0.01 dB/ºC at 23 ºC ±5 ºC (typical)
IF bandwidths 300 Hz, 1 kHz, 3 kHz, 10 kHz, 30 kHz
1
(IF bandwidth = 300 Hz, 32 averages)
2
(IF bandwidth = 300 Hz)
Specification Supplemental Information
2 MHz to 4 GHz Option 104
2 MHz to 6 GHz Option 106
1.2 Hz > 3.2 GHz
points can be set using SCPI)
S22, S12 magnitude and phase (option 122)
phase, Smith chart, polar, group delay,
unwrapped phase, real, imaginary
42 dB
calibration kit
> 3 GHz, 0.01 dB rms (typical)
1. System dynamic range = source maximum output power - receiver noise floor
2. Receiver dynamic range = receiver maximum input level - receiver noise floor
3
Page 4

FieldFox RF Vector Network Analyzer (continued)
Description
Display range
Log magnitude S11 or S22 -1000 to 1000 dB
Log magnitude S21 or S12 -1000 to 1000 dB
Log magnitude resolution 0.01 dB
Phase -180 to +180 degrees
Phase resolution 0.01 degrees
VSWR 1.01 to 1000
VSWR resolution 0.01
Averaging 2 to 999
Number of traces Four traces available. Tr1, Tr2, Tr3, Tr4
Data markers Each trace has six independent markers that can be displayed simultaneously.
Marker formats Default marker format is the trace format. In Smith chart or polar format,
Marker functions Peak, Next Peak, Peak Left, Peak Right, Mkr→ Center, Min Search, Peak
Sweep type Linear
Sweep time Set sweep time in seconds
Sweep trigger Continuous, single
Display formats Single-trace
Display data Display data, memory, data and memory, or data math
Trace math Vector division or subtraction of current linear measurement values and
Scale Autoscale, scale, reference level, reference position
Title Add custom titles to the display.
Limit lines Define test limit lines that appear on the display for go/no go testing. Lines
Calibration Types
CalReady Each FieldFox is calibrated at the test port.
Frequency response Simultaneous magnitude and phase correction of frequency response errors
Enhanced response Corrects for frequency response and source match for transmission
1-port calibration Corrects for directivity, frequency response, and source match errors.
Information
Two methods: sweep and point averaging
Delta markers are available for each marker.
[Real +Imag] or [Mag and Phase] formats are also available.
Excursion, Peak Threshold, Target, Bandwidth, Tracking
Dual-trace overlay (both traces on one graticule)
Dual-trace split (each trace on separate graticules)
Three-trace overlay (all three traces on one graticule)
Three-trace split (each trace on separate graticules)
Quad-trace split (each trace on separate graticules)
memory data.
Autoscale: Automatically selects scale resolution and reference value to
center the trace. Autoscale all scales all visible traces.
may be any combination of horizontal, sloping lines, or discrete data points.
Each trace can have its own limit line. Limit lines can be fixed or relative,
and can be built from existing traces.
for either reflection or transmission measurements.
measurements, and corrects for reflection frequency response, directivity and
source match errors for reflection measurements.
4
Page 5

FieldFox RF Vector Network Analyzer (continued)
Description
2-port calibration
(with option 122)
1-port QuickCal
(with option 112)
2-port QuickCal
(with option 112 and 122)
Guided calibration wizard FieldFox’s calibration wizard recommends a calibration type and calibration
Interpolated error correction With any type of accuracy enhancement applied, interpolated mode
Information
Full 12-term error correction. Corrects for directivity, source match,
reflection frequency response, load match, and transmission frequency
response for an N9923A with option 122, full two-port S-parameters.
Unknown thru and QSOLT are both available.
Corrects for directivity, frequency response, and source match errors, using
internal and external standards. QuickCal is most accurate for DUTs with
7/16 and Type-N connectors and measurement uncertainties are provided
for frequencies ≤ 6 GHz. Reduced accuracy for DUTs with 3.5 mm (m), SMA
(m), or other male coaxial connectors; performance is unspecified. QuickCal
is not recommended for DUTs with 3.5 mm (f), SMA (f), or other similar
female connectors. QuickCal is not applicable to waveguide.
Full 12-term error correction. Corrects for directivity, source match,
reflection frequency response, load match, and transmission frequency
response. QuickCal is most accurate for DUTs with 7/16 and Type-N
connectors and measurement uncertainties are provided for frequencies
≤ 6 GHz. Reduced accuracy for DUTs with 3.5 mm (m), SMA (m), or other
male coaxial connectors; performance is unspecified. QuickCal is not
recommended for DUTs with 3.5 mm (f), SMA (f), or other similar female
connectors. QuickCal is not applicable to waveguide.
kit based on selected parameters and connector types. Alternatively, users
can select their own calibration type and calibration kit.
recalculates the error coefficients when the test frequencies are changed.
The number of points can be increased or decreased and the start/stop
frequencies can be changed, but the resulting frequency span must be a
subset of the original calibration frequency span.
5
Page 6
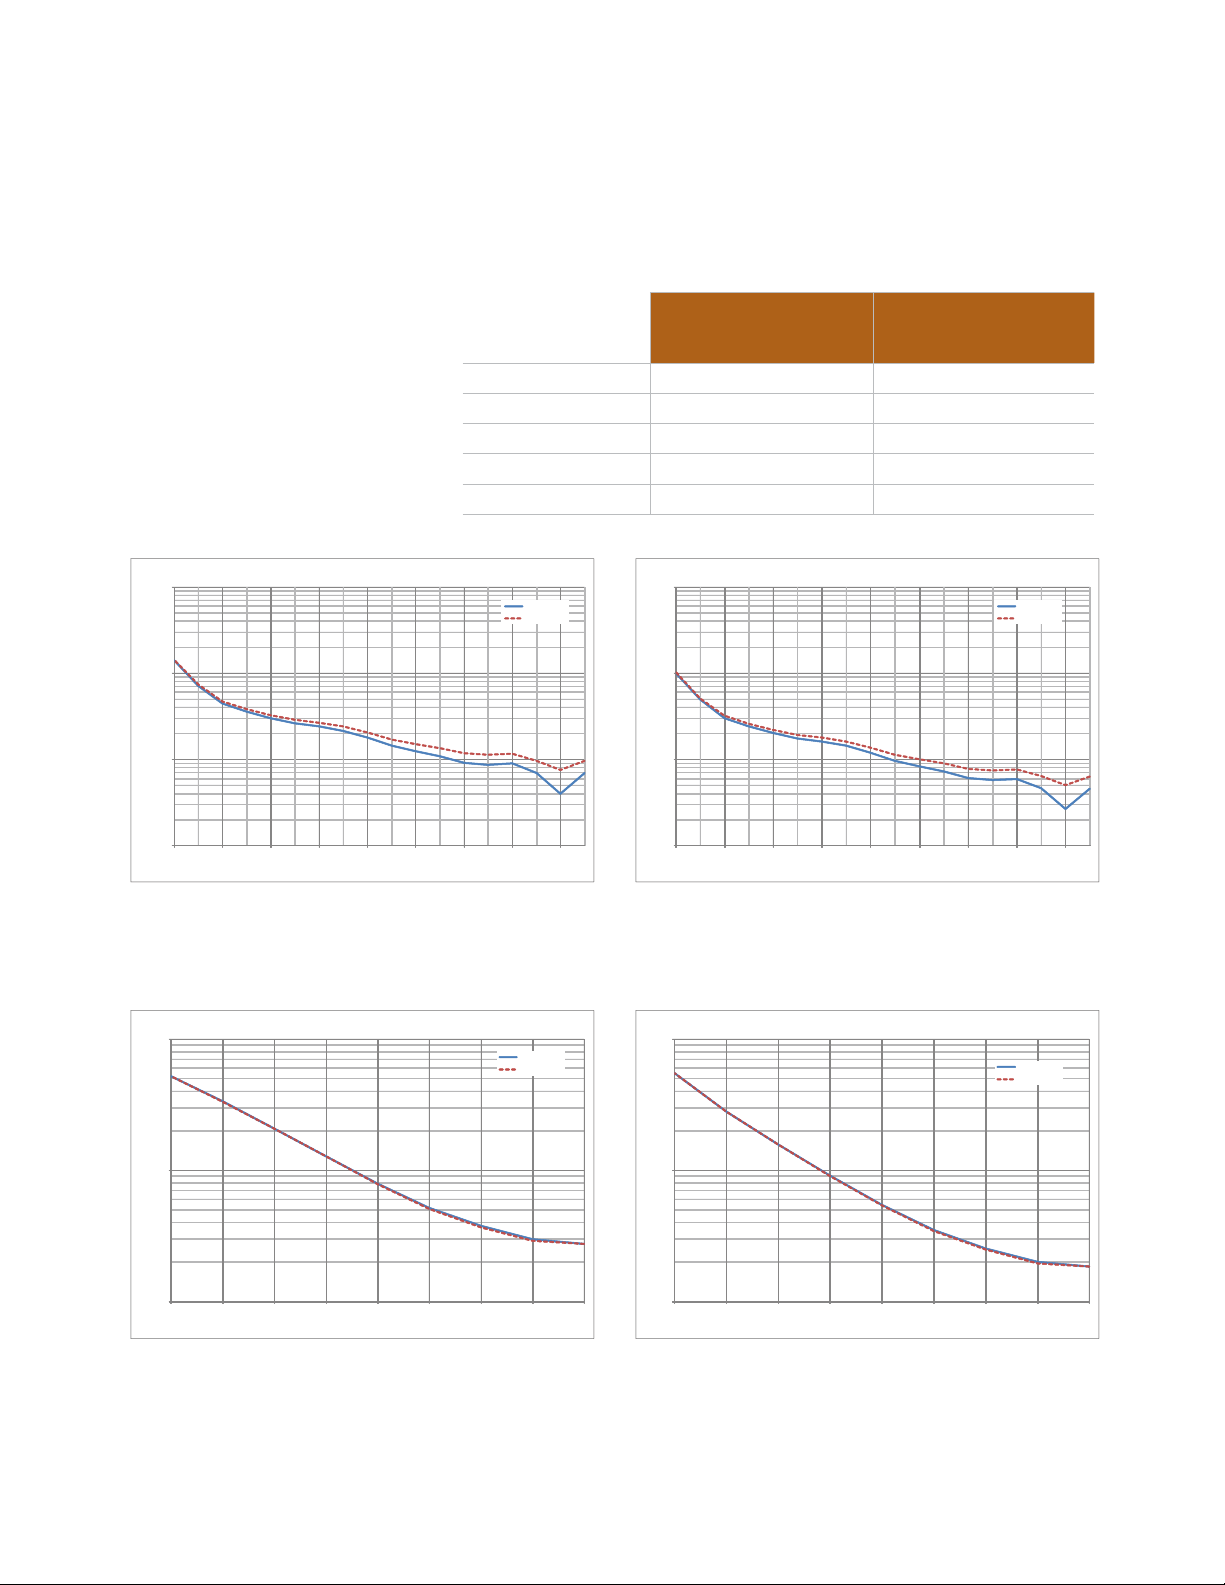
Corrected measurement uncertainty, 2-port or enhanced
response cal, high port power (default power)
Applies to N9923A, N9910X-800 Type-N (m) calibration kit, full 2-port or
enhanced response calibration, IF bandwidth = 300 Hz, no averaging, data based
on high port power of +5 dBm, 2-port cal available only with option 122.
Directivity 42 dB 42 dB
Source match 36 dB 36 dB
Load match 40 dB 38 dB
Transmission tracking ±0.02 dB ±0.06 dB
Reflection tracking ±0.06 dB ±0.06 dB
10
1
Magnitude Uncertainty (dB)
0.1
0.01
-80 -70 -60 -50 -40 -30 -20 -10 0
Transmission Ma gnitude Uncertain ty (S11=S22=0)
Device Transmission Magnitude, |S21|, (dB)
2MHz to 4 GHz
4 GHz to 6 GHz
Corrected performance
2 MHz to 4 GHz
100
10
Phase Uncertainty (deg)
1
0.1
-80 -70 -60 -50 -40 -30 -20 -10 0
Transmission P hase Uncertainty (S11=S22=0)
Corrected performance
>4 GHz to 6 GHz
Device Transmission Magnitude, |S21|, (dB)
2MHz to 4 GHz
4 GHz to 6 GHz
Figure 1: Transmission uncertainty (specification)
10
1
Magnitude Uncertainty (dB)
0.1
-40 -35 -30 -25 -20 -15 -10 -5 0
Reflection Magnitude Uncer tainty (S21=S12=0)
Device Reflection Magnitude, |S11|, (dB)
2MHz to 4 GHz
4 GHz to 6 GHz
Figure 2: Reflection uncertainty (specification)
6
100
10
Phase Uncertainty (deg)
1
-40 -35 -30 -25 -20 -15 -10 -5 0
Reflection Phas e Uncertai nty (S21=S12=0)
Device Reflection Magnitude, |S11|, (dB)
2MHz to 4 GHz
4 GHz to 6 GHz
Page 7

Corrected measurement uncertainty, 2-port or enhanced
response cal, low port power
Applies to N9923A, N9910X-800 Type-N (m) calibration kit, full 2-port or
enhanced response calibration, IF bandwidth = 300 Hz, no averaging, data based
on low port power of -40 dBm, 2-port cal available only with option 122.
Directivity 42 dB 42 dB
Source match 36 dB 36 dB
Load match 40 dB 38 dB
Transmission tracking ±0.02 dB ±0.06 dB
Reflection tracking ±0.06 dB ±0.06 dB
10
1
Magnitude Uncertainty (dB)
0.1
0.01
-40 -30 -20 -10 0 10 20 30 40
Transmission Ma gnitude Uncertain ty (S11=S22=0)
Device Transmission Magnitude, |S21|, (dB)
2MHz to 4 GHz
4 GHz to 6 GHz
Corrected performance
2 MHz to 4 GHz
100
10
Phase U ncert ainty (de g)
1
0.1
-40 -30 -20 -10 0 10 20 30 40
Transmission Ph ase Uncertainty (S11=S22=0)
Corrected performance
>4 GHz to 6 GHz
Device Transmission Magnitu de, |S2 1|, (dB)
2MHz to 4 GHz
4 GHz to 6 GHz
Figure 3: Transmission uncertainty (specification)
10
1
Magnitude Uncertainty (dB)
0.1
-40 -35 -30 -25 -20 -15 -10 -5 0
Reflection Magnitude Uncer tainty (S21=S12=0)
Device Reflection Magnitude, |S11|, (dB)
Figure 4: Reflection uncertainty (specification)
2MHz to 4 GHz
4 GHz to 6 GHz
7
1000
100
Phase Uncertainty (deg)
10
1
-40 -35 -30 -25 -20 -15 -10 -5 0
Reflection Phas e Uncertai nty (S21=S12=0)
Device Reflection Magnitude, |S11|, (dB)
2MHz to 4 GHz
4 GHz to 6 GHz
Page 8

Corrected measurement uncertainty, 1- or 2-port QuickCal,
high port power (default power)
Applies to N9923A with option 112, QuickCal with load, IF bandwidth = 300 Hz, no
averaging, 1-port female DUT, or 2-port female-female DUT, data based on high
port power of +5 dBm , 2-port QuickCal requires option 122, typical performance.
Directivity 38 dB 38 dB
Source match 33 dB 23 dB
Load match 37 dB 35 dB
Transmission tracking ±0.04 dB ±0.09 dB
Reflection tracking ±0.06 dB ±0.06 dB
Transmission Magnitude Uncertainty (S11=S22=0)
10
2MHz to 4 GHz
4 GHz to 6 GHz
1
Uncertainty (dB)
0.1
0.01
-80 -70 -60 -50 -40 -30 -20 -10 0
Device Transmission Magnitude, |S21|, (dB)
2MHz to 4 GHz
4 GHz to 6 GHz
Corrected performance
2 MHz to 4 GHz
Corrected performance
>4 GHz to 6 GHz
Transmission Phase Uncertainty (S11=S22=0)
100
10
Uncertainty (deg)
1
0.1
-80 -70 -60 -50 -4 0 -3 0 -2 0 -1 0 0
Device Transmission Magnitude, |S21|, (dB)
2MHz to 4 GHz
4 GHz to 6 GHz
Figure 5: Transmission uncertainty
Reflection Magnitude Uncertainty (S21=S12=0)
10
1
Uncertainty (dB)
0.1
-40 -35 -30 -25 - 20 -15 -10 -5 0
Device Reflection Magnitude, |S11|, (dB)
Figure 6: Reflection uncertainty
2MHz to 4 GHz
4 GHz to 6 GHz
Reflection Phase Uncertainty (S21=S12=0)
1000
100
Uncertainty (deg)
10
1
-40 -35 -30 -25 -20 -15 -10 -5 0
Device Reflection Magnitude, |S11|, (dB)
2MHz to 4 GHz
4 GHz to 6 GHz
8
Page 9

Corrected measurement uncertainty, 1- or 2-port QuickCal,
low port power
Applies to N9923A with option 112, QuickCal with load, IF bandwidth = 300 Hz,
no averaging, 1-port female DUT, or 2-port female-female DUT, data based on low
port power of -40 dBm , 2-port QuickCal requires option 122, typical performance.
Directivity 38 dB 38 dB
Source match 33 dB 23 dB
Load match 37 dB 35 dB
Transmission tracking ±0.04 dB ±0.09 dB
Reflection tracking ±0.06 dB ±0.06 dB
Transmission Magnitude Uncertainty (S11=S22=0)
10
1
Uncertainty dB)
0.1
0.01
-40 -30 -20 -10 0 10 20 30 40
Device Transmission Magnitude, |S21|, (dB)
2MHz to 4 GHz
4 GHz to 6 GHz
Corrected performance
2 MHz to 4 GHz
Transmission Phase Uncertainty (S11=S22=0)
100
10
Uncertainty (deg)
1
0.1
-40 -30 -20 -10 0 10 20 30 40
Device Transmission Magnitude, |S21|, (dB)
Corrected performance
>4 GHz to 6 GHz
2MHz to 4 GHz
4 GHz to 6 GHz
Figure 7: Transmission uncertainty
Reflection Magnitude Uncertainty (S21=S12=0)
10
1
Uncertainty (dB)
0.1
-40 -35 -30 -25 -20 -15 -10 -5 0
Device Reflection Magnitude, |S11|, (dB)
Figure 8: Reflection uncertainty
2MHz to 4 GHz
4 GHz to 6 GHz
Reflection Phase Uncertainty (S21=S12=0)
1000
100
Uncertainty (deg)
10
1
-40 -35 -30 -25 -20 -15 -10 -5 0
Device Reflection Magnitude, |S11|, (dB)
2MHz to 4 GHz
4 GHz to 6 GHz
9
Page 10

Dynamic Accuracy
Accuracy of the test port input power, relative to the specified port power.
10
1
0.1
Accuracy (dB)
0.01
0.001
-80 -70 -60 - 50 -40 -30 -20 -10 0
Magnitude Dynamic Accuracy
Relative Port Power with repect to +5dBm (dB)
- High Port Power
2MHz to 4 GHz
4 to 6 GHz
Figure 9: Dynamic accuracy (specification)
Cable and Antenna Analyzer (option 305)
The following CAT mode performance parameters are in addition to the VNA
mode performance parameters specified above.
Table1: Cable and antenna analyzer specifications
10
1
Accuracy (deg)
0.1
0.01
-80 -70 -60 -50 -40 -30 -20 -10 0
Phase Dynamic Accuracy -High Port Power
Relative Port Power with repect to +5dBm (dB)
2MHz to 4 GHz
4 to 6 GHz
Description Specification Supplemental Information
Cable loss
Display range
Resolution
0 to 100 dB
0.01 dB
Distance–to–Fault
Range = [(number of points
Horizontal range
– 1) / frequency span * 2]
* velocity factor * speed of
light
Horizontal
Resolution
Resolution = Range/
(number of points – 1)
Bandpass mode
Window types
External USB Power Sensor Support (option 302)
The external USB power sensor option supports the Agilent Technologies USB
Power Sensors. List of supported sensors available from:
http://www.agilent.com/find/usbsensorsforfieldfox.
Number of points auto coupled
according to start and stop
distance entered
Number of points settable
by user
Maximum, medium, and
minimum windows
10
Page 11

Vector Voltmeter (option 308)
With vector voltmeter mode, you can characterize the difference between two
measurements easily. The zeroing function allows you to create a reference
signal, and characterize the difference between two device measurements.
1-port cable trimming - reflection or S11 measurement, magnitude and phase
2-port transmission - transmission or S21 measurement, magnitude and phase
A/B and B/A - ratio of two receivers or channels, magnitude and phase –
Need an external signal generator for the A/B or B/A measurement (must
order option 122).
The results are shown on a large display in digital format. Refer to the network
analyzer section for magnitude and phase accuracy information.
Time domain (Option 010)
Using time domain, data from transmission or reflection measurements in the
frequency domain are converted to the time domain. The time-domain response
shows the measured parameter value versus time.
Time stimulus modes
Low-pass step
This stimulus, similar to a traditional time domain reflectometer (TDR)
stimulus waveform, is used to measure low-pass devices. The frequency-
domain data should extend from DC (extrapolated value) to a higher value.
Low-pass impulse
This stimulus is also used to measure low-pass devices.
Bandpass impulse
The bandpass impulse stimulates a pulsed RF signal and is used to
measure the time-domain response of band-limited devices.
Windows
The windowing function can be used to filter the frequency-domain data and
thereby reduce overshoot and ringing in the time-domain response.
Gating
The gating function can be used to selectively remove reflection or transmission
time-domain responses. In converting back to the frequency domain the effects
of the responses outside the gate are removed.
11
Page 12

Remote control capability, Option 030
Option 030 adds remote control capability to the FieldFox analyzers that allows
FieldFox to be controlled via an iOS device. The FieldFox app, running on the iOS
device, combined with Option 030 on the FieldFox analyzer provides full control
of the instrument from a remote location. The app emulates the front panel of
the unit, so users can press any FieldFox key right from their iOS device, including hardkeys or softkeys.
iOS device requirements
L3DGL3KRQHRUL3RG7RXFK
L26RIRUKLJKHU
$:L)LRU**FRQQHFWLRQ
The FieldFox app communicates with FieldFox via a network connection, both
the iOS device and FieldFox need to be on a network where both devices can
reach the other. For example, a company intranet or a site installation using a
wireless router. FieldFox can be directly connected to a LAN cable, or if wired
LAN is not available, a user supplied wireless router can be configured to work
with FieldFox. A wireless router is not included with FieldFox.
FieldFox app without Option 030
The FieldFox app can be installed on an iOS device independent of the presence
of Option 030 on the analyzer. Without Option 030, users can view the live
display screen of their FieldFox remotely, but cannot control the instrument.
FieldFox with Option 030 installed allows users to both view and control their
FieldFox. Control refers to the ability to press hardkeys, softkeys, make or
change measurements, etc.
Option 030 does not include an iOS device, users must supply their own. Option
030 is a license on the FieldFox analyzer.
Block Diagram
Option 030 and the FieldFox app are not applicable to Android, BlackBerry, or
Windows phone/tablet devices.
RF source
LO
To receivers
Port 1
Figure 10: N9923A with option 122
Port 2
Measurement throughput
Cycle time data, 1001 points, CalRdy, typical information.
Measurement speed
S11:1.75-3.85 GHz 1.4 ms/point
S21:1.78-2.06 GHz 1.4 ms/point
12
Page 13

General Information
Description
Calibration cycle
Environmental
Agilent Technologies outdoor
Altitude – operating 9,144 m (30,000 ft) Under battery operation
Altitude – non–operating 15,240 m (50,000 ft)
Intrusion protection IP 30 IEC/EN 60529
Temperature range
Operating
AC power –10 to 55 °C
Battery –10 to 50 °C -10 to 55 °C (typical)
Storage –51 to 71 °C With the battery pack removed.
EMC
Complies with European
EMC
Directive 2004/108/EC
ESD
IEC/EN 61000–4–2
Safety
Complies with European
Low Voltage Directive
2006/95/EC
Power
Power supply
External DC input 15 to 19 VDC 40 W maximum when battery charging
External AC power adapter Efficiency Level IV, 115 VAC
Input 100 to 250 VAC, 50 to 60 Hz
Output 15 VDC, 4 A
Power consumption On: 14 W (typical)
Specification Supplemental Information
1 year
1
equipment class
MIL–PRF–28800F class 2
EC/EN 61326–1
CISPR Pub 11 Group 1, class A
AS/NZS CISPR 11
ICES/NMB–001
EC/EN 61010–1 2
Canada: CSA C22.2
No. 61010–1–04
USA: UL 61010–1 2
1.25 – 0.56 A
nd
Edition
nd
[AC to DC adapter rated at 3,000 m (9,840 ft)]
The battery packs should be stored in an
environment with low humidity. Extended
exposure to temperature above 45 ºC could
degrade battery performance and life.
Edition
1. Samples of this product have been type tested in accordance with the Agilent Environmental Test Manual (ETM) for outdoor
equipment (OE) and verified to be robust against the environmental stresses of storage, transportation and end use; those
stresses include but are not limited to temperature, humidity, shock, vibration, altitude and power line conditions
13
Page 14

General Information (continued)
Description
Battery
Operating time 3.5 hours (typical)
Charge time A fully discharged battery takes
Discharge temperature limits
Charge temperature limits
Storage temperature limits –20 to 50 ºC1, ≤ 85% RH The battery packs should be stored in an
Data storage
Internal Minimum 16 MB Up to 1000 instrument states and trace
External Supports USB 2.0 compatible memory
Display 6.5” transflective color VGA
Weight 2.7 kg (6.0 lbs) including battery
Dimensions (H x W x D) 292 x 188 x 72 mm
Test ports
RF Port 1 or Port 2
Connector Type–N, female
Impedance 50 Ω (nominal)
Damage level > +23 dBm, > ±50 VDC
Specification Supplemental Information
10.8 V, 4.6 A–h Lithium ion
about 1.5 hours to recharge to
80%, 4 hours to 100%
1
–10 to 60 ºC, ≤ 85% RH
1
0 to 45 ºC, ≤ 85% RH
environment with low humidity. Extended
exposure to temperature above 45 ºC could
degrade battery performance and life
devices; Supports microSD and microSDHC
memory cards
LED–backlit
640 x 480 with anti–glare coating
(11.5” x 7.4” x 2.8”)
1. Charge and discharge temperatures are internal temperatures of the battery as measured by a sensor embedded in the
battery. The Battery screen displays temperature information. To access the screen, select System ,
and
Battery
14
Service Diagnostics ,
Page 15

General Information (continued)
Description
Headphone Jack Connector 3.5 mm (⅛ inch) miniature audio jack
USB
USB–A (2 ports) Hi–speed USB 2.0
Mini USB (1 port) Hi–speed USB 2.0 Provided for future use.
LAN 100Base-T ONLY 10Base-T is NOT supported
External RJ–45 connector
Programming The built-in LAN interface and firmware,
External Reference
Connector BNC female
Input frequency 10 MHz
Input amplitude range –5 dBm to +10 dBm (nominal)
Impedance 50 Ω (nominal)
Lock Range ±10 ppm of external reference
Specification Supplemental Information
support data transfer and control via
direct connection to a LAN network.
N9923A FieldFox RF VNA Options
Must select 104 or 106 as a minimum. 104 and 106 are mutually exclusive.
frequency (nominal)
N9923A-104 4 GHz RF vector network analyzer, transmission/reflection:
Includes S11 and S21, mag and phase, one-port and enhanced
response calibration, 2 MHz to 4 GHz.
N9923A-106 6 GHz RF vector network analyzer, transmission/reflection:
Includes S11 and S21, mag and phase, one-port and enhanced
response calibration, 2 MHz to 6 GHz.
N9923A-112 QuickCal: Adds one-port QuickCal and two-port QuickCal
(two-port QuickCal only if option 122 is ordered).
N9923A-122 Full two-port S-parameters: Adds S12, S22, and full two-port
calibration.
N9923A-302 External USB power sensor support: Enables USB port to be
used for power measurements. Power sensor not included.
N9923A-305 Cable and antenna analyzer: Adds Cable and Antenna Test
(CAT) mode, which allows for DTF measurements.
Measurements include DTF (dB), RL & DTF, RL (dB), VSWR, DTF
(VSWR), Cable loss (1-port), Insertion loss (2-port), and DTF (linear).
N9923A-308 Vector voltmeter: Provides 1-port cable trimming and 2-port
transmission measurements.
N9923A-010 Time domain analysis and gating
N9923A-030 Remote control capability for iOS device, such as iPad, iPhone, or
iPod Touch.
15
Page 16

N9923A Upgrade Options
Agilent FieldFox Customer Support http://www.agilent.com/find/fieldfoxsupport
N9923AU-122 Add full two-port S-parameter capability to an N9923A.
N9923AU-112 Add QuickCal capability to an N9923A.
N9923AU-305 Add cable and antenna analysis to an N9923A.
N9923AU-302 Add external USB power sensor support to an N9923A.
Power sensor not included.
Calibration Kits
N9923AU-308 Add vector voltmeter capability to an N9923A.
N9923AU-010 Add time domain analysis and gating
N9923AU-030 Add remote control capability
The following is a list of the calibration kits that are loaded in a standard FieldFox.
Users can add additional calibration kits to their unit using FieldFox Data Link
Software. Note regarding QuickCal: The basic QuickCal, either 1 or 2-port does
not require any standards. For higher accuracy, users can perform QuickCal with
a load.
N9910X-800 T-calibration kit, DC-6 GHz, Type-N(m)
N9910X-801 T-calibration kit, DC-6 GHz, Type-N(f)
N9910X-802 T-calibration kit, DC-6 GHz, 7/16 DIN(m)
N9910X-803 T-calibration kit, DC-6 GHz, 7/16 DIN(f)
85031B Economy calibration kit, DC to 6 GHz, 7 mm
85032E Economy calibration kit, DC to 6 GHz, Type-N, 50-ohm
85032F Standard calibration kit, DC to 9 GHz, Type-N, 50-ohm
85033E Standard calibration kit, DC to 9 GHz, 3.5 mm
85036B Standard calibration kit, DC to 3 GHz, Type-N 75-ohm
85036E Economy calibration kit, DC to 3 GHz, Type-N 75-ohm
85038A Standard calibration kit, DC to 7.5 GHz, 7-16
85039B Economy calibration kit, DC to 3 GHz, Type-F, 75-ohm
85052D Economy calibration kit, DC to 26.5 GHz, 3.5 mm
85054B Standard calibration kit, DC to 18 GHz, Type-N, 50-ohm
85054D Economy calibration kit, DC to 18 GHz, Type-N, 50-ohm
16
Page 17

s
FieldFox Data Link Software
FieldFox Data Link software, installed on a PC, provides the following capabilities:
www.agilent.com
www.agilent.com/find/fieldfox
Capture of current trace and setting
Opening of data files (s1p, s2p, csv, sta, and png) residing on the instrument
Editing cal kit and cable files on the instrument, or creating new cal kits and
cables
Transferring files to/from the instrument
Annotating plots for documentation purposes
Marker, limit line, and format changes on the PC
Report generation
Printing function
FieldFox Data Link Software is available from Agilent FieldFox Customer Support
http://www.agilent.com/find/fieldfoxsupport
Figure 11: FieldFox Data Link Software
myAgilent
myAgilent
www.agilent.com/find/myagilent
A personalized view into the information most
relevant to you.
Agilent Channel Partners
www.agilent.com/find/channelpartners
Get the best of both worlds: Agilent’s
measurement expertise and product
breadth, combined with channel
partner convenience.
www.agilent.com/find/ThreeYearWarranty
Agilent’s combination of product reliability
and three-year warranty coverage is another
way we help you achieve your business goals:
increased confidence in uptime, reduced cost
of ownership and greater convenience.
Three-Year Warranty
Agilent Electronic Measurement Group
DEKRA Certified
ISO 9001:2008
Quality Management SystemQuality Management Sy
www.agilent.com/quality
For more information on Agilent Technologies’
products, applications or services, please
contact your local Agilent office. The complete
list is available at:
www.agilent.com/find/contactus
Americas
Canada (877) 894 4414
Brazil (11) 4197 3600
Mexico 01800 5064 800
United States (800) 829 4444
Asia Pacific
Australia 1 800 629 485
China 800 810 0189
Hong Kong 800 938 693
India 1 800 112 929
Japan 0120 (421) 345
Korea 080 769 0800
Malaysia 1 800 888 848
Singapore 1 800 375 8100
Taiwan 0800 047 866
Other AP Countries (65) 375 8100
Europe & Middle East
Belgium 32 (0) 2 404 93 40
Denmark 45 45 80 12 15
Finland 358 (0) 10 855 2100
France 0825 010 700*
*0.125 €/minute
Germany 49 (0) 7031 464 6333
Ireland 1890 924 204
Israel 972-3-9288-504/544
Italy 39 02 92 60 8484
Netherlands 31 (0) 20 547 2111
Spain 34 (91) 631 3300
Sweden 0200-88 22 55
United Kingdom 44 (0) 118 927 6201
For other unlisted countries:
www.agilent.com/find/contactus
(BP-3-1-13)
Product specifications and descriptions
in this document subject to change
without notice.
© Agilent Technologies, Inc. 2009-2013
Published in USA, May 30, 2013
5990-5363EN
 Loading...