

Page 1
Agilent N9340B
Handheld
Spectrum Analyzer (HSA)
Technical Overview
Put the speed
and performance of
Agilent spectrum analysis
in the hands of your engineers
in the field
Page 2
N9340B Handheld Spectrum Analyzer (HSA)
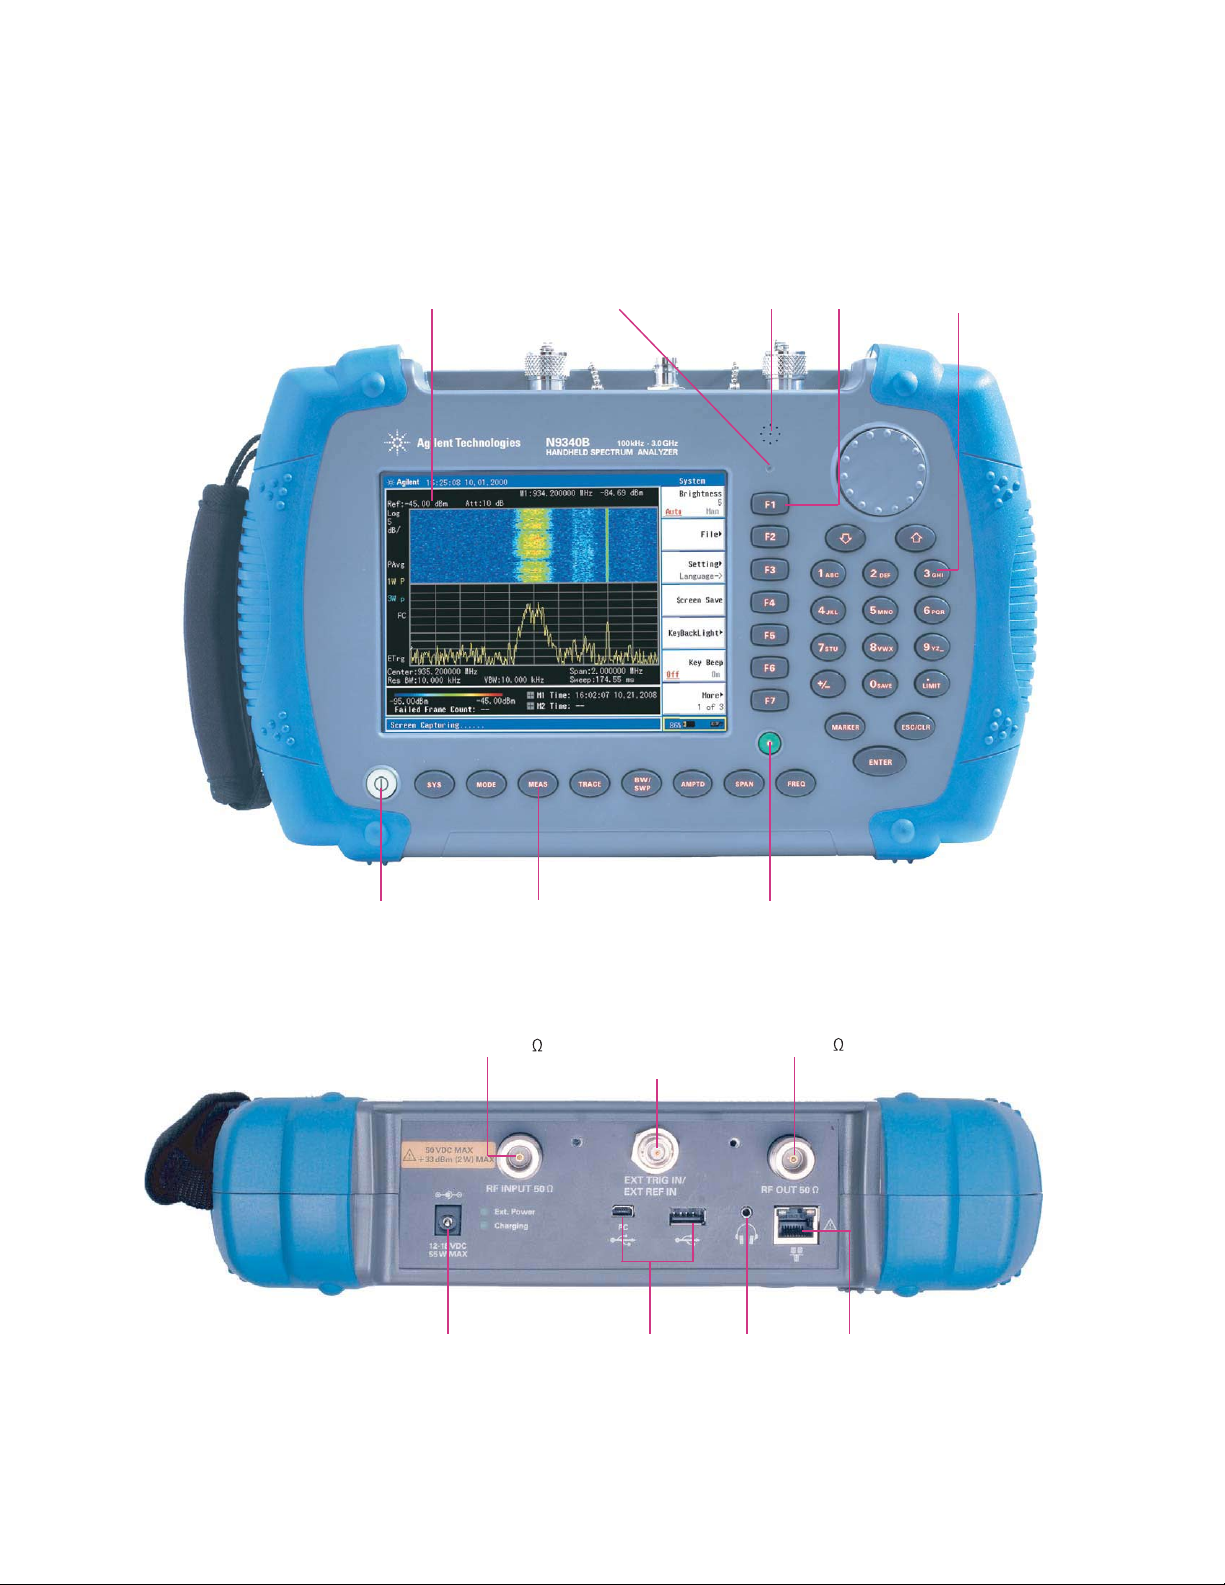
Front and Top Panel
6.5 TFT display Light sensor
Speaker
Soft keys
Back-lit keys
Power on/off
RF INPUT (50 )
Power Input
(55 W Max)
Function keys
EXT TRIG IN/
EX
F IN
T RE
USB
connectors
Pr es et
RF OUT(50 )
Headphone
connector
LA N
connector
02
Page 3
03
Handheld Spectrum Analyzer (HSA)
N9340B
Know your spectrum
Regardless of whether you are handling
military communications, a Wireless
Service Provider (WSP), or involved
with spectrum management you need
to avoid impaired communication.
The N9340B provides you with a reliable,
accurate and detailed picture of your
communication spectrum.
When you test, you need fast data
capture to help locate and identify
elusive, transient interference signals.
That’s why every N9340B spectrum
analyzer has a truly fast sweep time.
It requires less time to measure across
the spectrum, to obtain more reliable
test results and to help you achieve
more for the same investment of time
and money.
Gain confidence in your test
results
Frequency range : 100 kHz to 3 GHz (tunable to 9 kHz)
1
–124 dBm
–144 dBm with preamp on
Amplitude accuracy : ±1.5 dB
RBW : 30 Hz to1 MHz in 1-3-10 sequence
VBW : 3 Hz to 1 MHz
Optimize your test time versus
accuracy
SSB Phase noise : <– 87 dBc/Hz at 30 kHz offset
DANL : (RBW=30Hz, 10 MHz < fc 1.5 GHz)
Sweep time
10 msto 1000 s, span
1 kHz
< 120 ms at full span
Spurious signals and noise are of great
concern to all network users. A superior
combination of low displayed average
noise level (DANL) and single sideband
(SSB) phase noise coupled with a
narrow resolution bandwidth (RBW)
means your signal measurements are
more reliable and you will have more
confidence in your test results. The
N9340B’s low DANL and SSB phase
noise helps you detect very low-level
signals (spurs or noise) which are close
to the carrier. You will avoid missing
these difficult-to-identify signals, which
would otherwise lead to an insufficient
or even incorrect understanding of the
spectrum.
The N9340B’s RBW is the narrowest in its
class. The narrow 30 Hz bandwidth of the
analyzer ensures that it is even easier
to identify, resolve, and measure two
signals that are close together.
Additionally, with a resolution filter
shape-factor of less than 5, the N9340B
has the ability to resolve closely spaced
signals with unequal amplitudes.
Moreover, the narrow RBW means that
the spectrum analyzer introduces minimal
noise itself, helping to further reduce
DANL and improve sensitivity.
Superior sensitivity
With more wireless devices on the market
requiring greater bandwidth usage, the
ability to discriminate between different
signals becomes more challenging. It’s
under such demanding conditions that the
superior performance of an N9340B
analyzer proves its worth. The N9340B
has one of the best sensitivity and
selectivity specifications. The DANL is
–124 dBm, or –144 dBm with the
optional preamplifier (30 Hz RBW, 10
MHz < fc < 1.5 GHz).
The optional
preamplifier adds 20 dB gain for
improved analyzer sensitivity.
Speed at your fingertips
The RF spectrum is a finite resource,
therefore its usage requires management.
Most regulatory authorities responsible
for administering frequency allocation
require service suppliers and network
operators to perform routine
monitoring of signal power and
transmission frequency stability.
–
N9340B Superior Performance Ensures the Field Test Confidence
Fastest sweep time
Superior sensitivity: lowest DANL in-the-class
Narrowest resolution available
1
Low frequency performance enhancement options available, check option N9340B-IBC and N9340B-XDM
Page 4
04
Handheld Spectrum Analyzer (HSA)
N9340B
Spectrogram
Nowyou can take advantageof the
spectrogram display to view the behavior of
varyingsignal parameters over time. The
N9340B includes spectrogram as a standard
feature. The scrolling three-dimensional display
is notedforits ability to track the frequency and
power behavior over the time, particularly
intermittent signals. Theusercan use
spectrogram to analyze the stability of a signal
over the time, or to identify intermittent
interference signalsin communications systems.
There are two markers for the user toidentify
power versus frequency and time. Alsothe time
interval betweentwo consecutive colored rows
canbe adjusted.When a marker isput on the
spectrogram, theN9340B can displaythe trace
forthe timeof the selected marker.
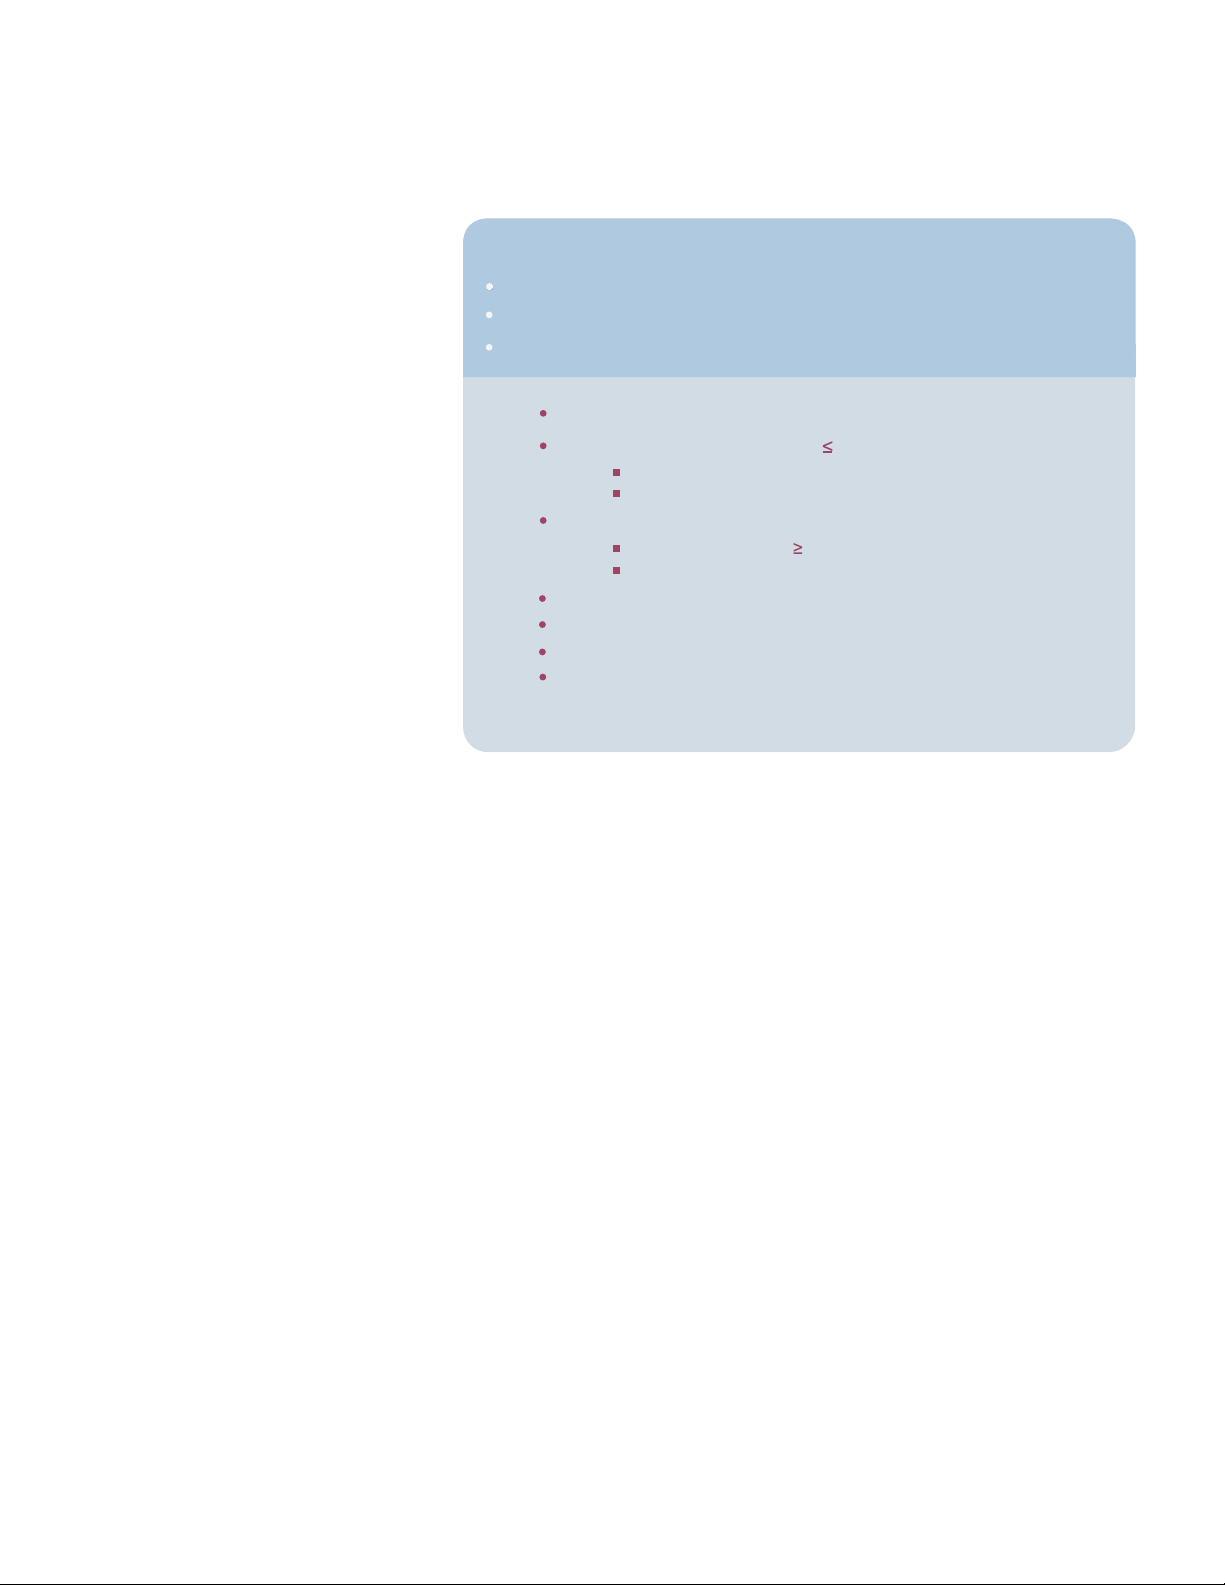
Thespectrogram data and screenshots can be
saved and recalled for lateranalysisor reporting.
Extended spectrogram monitoring
(Option INM)
Option INM extends the N9340B spectrogram
capability further with theability to continuously
monitor and save spectrogram data over time
not only to theanalyzer’s internal memory or a
USB flash drive, butalso directly to a PC. With
option INM users can save more than 1,500
continuous frames of data depending on the
size of the USB flash drive or PC memory.
Option INM also supportsan Automatic Save
function.The N9340Bcan save the spectrogram
at a user specific time or at a set interva ofl
frame..All the small files with the
same
prefix can be combined into one file using
N9340 PC Software, making analysis easier.
The user can choose among the 3 display
modes: spectrogram only, spectrum trace only
or the combination of a spectrogramand a
spectrum trace in one screen. Limit lines with
pass/fail functionality is also available in this
measurement. The N9340B will identify the
failed frame of spectrogram data with a red
mark. The Pass/Fail testcan also provide alerts.
Users may use marker to find the previous/next
frame failed data to quickly find the offending
event or interference. The spectrogram data may
be played back for review on either the analyzer’s
display or on a PC utilizing N9340B PC Software.
With the option INM, the Agilent N9340B
spectrum analyzer can provide unattended
monitoring of communication systemscapturing
performance orintermittent events like
interference over extended periods oftime –
days rather than hours. The option INM can
provide additional value for the wireless network
DSL measurements
(Option XDM)
The spectrogram gives the three-dimensional
display of power, frequency and time.
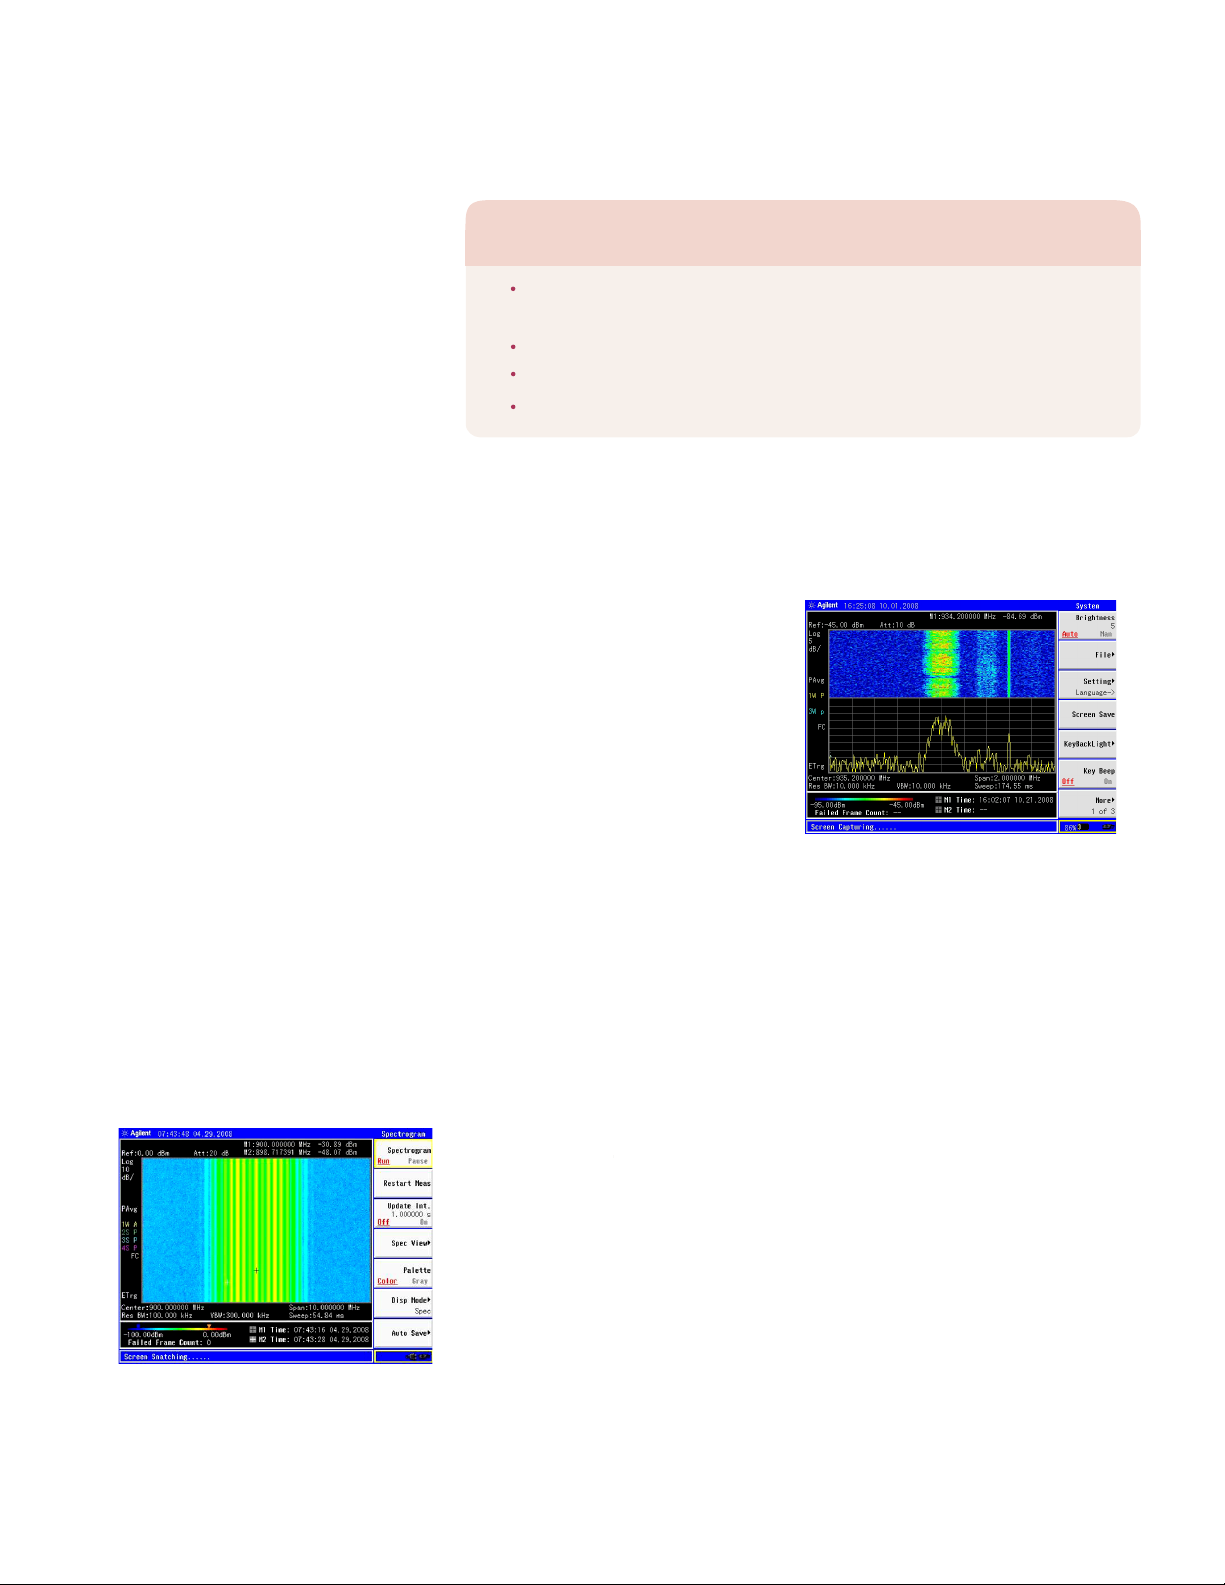
The N9340B INM shows spectrogram and spectrum trace
on the same screen.
important application of spectrum
N9340B is now equipped with powerful
features to address field applications
using a handheld spectrum analyzer. An
analysis is identifying interfering sig
nals.
These often arise from illegal transmissions,
and may cause impairment of services for
authorized users, often resulting in financial
loss. These interfering signals could
possibly restrict critical communications
of civil aviation and emergency services,
which could jeopardize public safety.
Aerospace & Defence: radio and radar test, interference analysis,
on-site repair
Wireless Service Providers: interference analysis, on-site repair
TV & Broadcasting: interference analysis, channel power check
Spectrum Management Authority: spectrum monitoring
N9340B Applications for Field Test
communication system managers, hospital
administrators, etc. as well as police and
homeland security by recording spectrogram
measurement resultsover time.
xDSL (ADSL and VDSL) is widely used for
broadband internet connections at homes and
businesses. Service providers occasionally face
problems with interference on their xDSL lines.
The interference is mainly intermittent intrusion
from nearby external sources such as electric
motors, elevators, and appliances. In order to
monitor, capture and remove intermittent
interference, the engineer may need to work in
the field for extended periods of time.
With hardware option XDM the N9340B now
supports measurements on ADSL, ADSL2+ and
VDSL networks. It provides very good sensitivity
with low displayed average noise levels (DANL)
to meet the mask requirements
overADSL frequency
ranges, from 9 kHz to 12 MHz,
for ADSL.
Page 5
Handheld Spectrum Analyzer (HSA)
N9340B
IBOC measurements
(Option IBC)
Option IBC has built-in FCC and NRSC
(National Radio Systems Committee) spectral
emission masks for quick compliance
measurements with visual and audible
pass/fail indicators.
N9340B IBC also supports a one-button
auto-tune function that greatly simplifies the
otherwise complex user setup required to
capture and measure IBOC signals of interest.
The auto-tune function will automatically set
the frequency span, RBW, Average and
Detector types, etc. It only takes seconds for
the auto-tune function to display the correct
measurement results.
The included Channel list feature enables users
to easily create and recall setup and
measurement parameters for single or multiple
broadcast frequencies and channels. The user
no longer needs to spend time remembering
numerous channel setups but can simply load
the desired channel from the list to start a
measurement. The Channel list can be
loaded, copied and deleted.
05
Users may choose to make the xDSL
measurement in either spectrum analysis
or spectrogram mode. Using xDSL
measurement in spectrogram mode is ideal
for capturing intermittent interference on
xDSL lines. When used with option INM,
the DSL measurement application can
measure and record DSL performance data
to a USB flash drive or PC over hours or even
days.
An xDSL probe from Vierling is required to
connect the N9340B analyzer to xDSL
networks for measurements in the field.
N9340B is the industry’sfirst handheld spectrum
analyzer with a dedicated IBOC measurement
mode. The option IBC is not available as an
upgrade and must be ordered at the time of
instrument purchase.
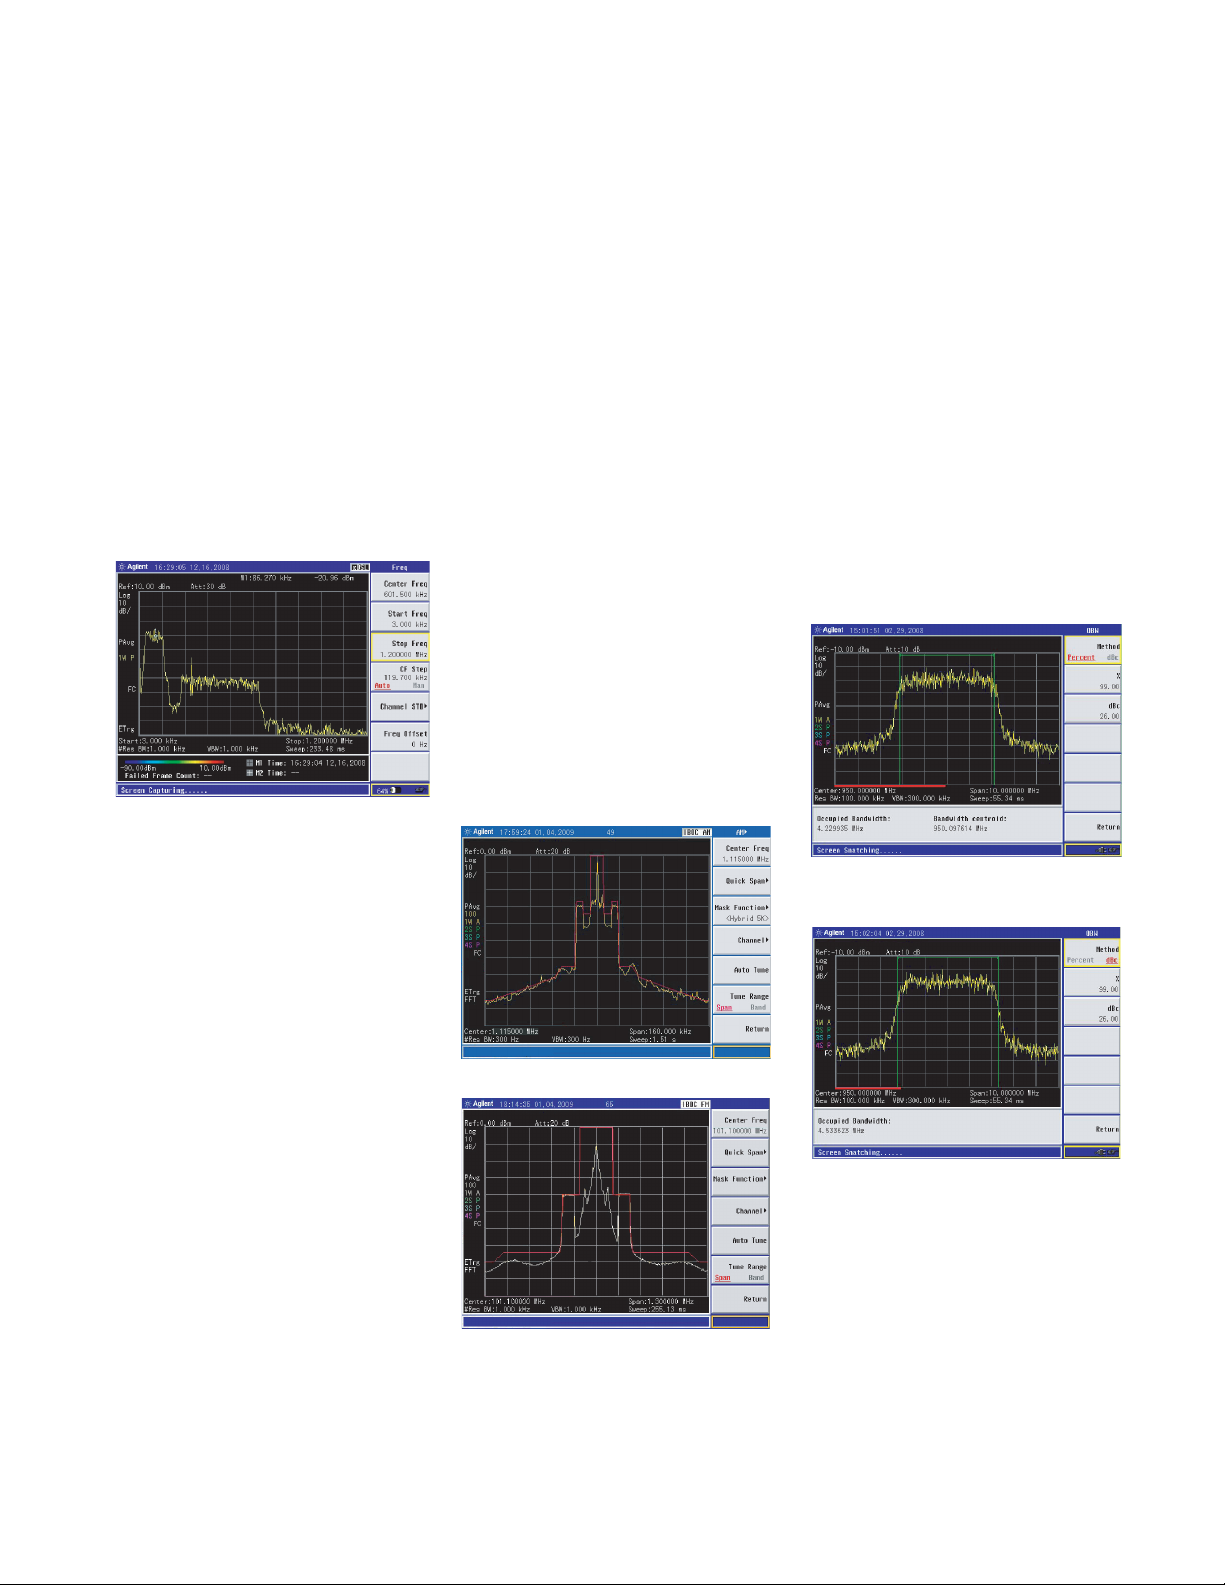
IBOC-AM measurement with N9340B IBC
IBOC-FM measurement with N9340B IBC.
ADSL measurement with N9340B XDM
The option XDM is not available as an
upgrade and must be ordered at the time of
instrument purchase. The XDM option can
also be used for other applications which
require improved DANL and phase noise at
frequencies from 9 kHz to 12 MHz.
Option IBC equips the N9340B with in-band
on-channel (IBOC) measurement capability
through a dedicated measurement personality
and selected hardware improvements. IBOC
technology is a method of transmitting digital
and analog radio broadcast signals (AM and
FM) simultaneously on the same frequency.
This HD Radio™ version of hybrid digital/
analog technology is the only one approved by
the FCC for U.S. radio broadcast stations.
TheIBC option adds enhanced SSB phasenoise
for IBOC AM measurements and a noise
cancellation process for improved IBOC FM
measurement margins. IBOC-AM covers 530
kHz to 1.7 MHz and IBOC-FM covers the 87.5
MHz to 108 MHz frequencies.
N
e
w
The occupied bandwidth measured in dBc.
The occupied bandwidth measured in
percentage.
One-button measurement
The Agilent N9340B supports one-button
measurements of occupied bandwidth, channel
power and adjacent channel power ratio.
This virtually eliminates set-up time in the field.
An occupied bandwidth measurement
integrates the power of the displayed
spectrum and puts one pair of vertical lines
at the frequencies between which the
interested signal is contained.
An N9340B spectrum analyzer supports two
ways to measure the occupied bandwidth, in
percentage or in dBc.
Occupied bandwidth (OBW)
Channel power
Use channel power to measure both
power and power spectral density in
a user-specified channel bandwidth.
One pair of vertical lines on the display
indicates the edges of the channel
bandwidth.
Page 6

06
Handheld Spectrum Analyzer (HSA)
N9340B
Adjacent channel power ratio
(ACPR)
Wireless service providers need to minimize
Spectrum emission mask (SEM)
The new N9340B adds Spectrum Emission
Mask (SEM) as a standard feature. SEM is
a mask for out-of-channel emissions
measurement. The SEM is defined relative
to in-channel power.
The user can set theparameters of the main
channel, out-of-channel frequency bands,
and the limit lines.Included is Pass/Fail testing
for the overall spectrum emission mask and each
individual out-of-channel frequency range. The
N9340B will trigger thefailure indicator once
any measurement result violates the mask.
Also displayed are the main channel power
and the power level metrics relative to
in-channel power for each out-of-channel
frequency range. The user can save the
spectrum scan, the mask, the data or
screenshot forlater analysis and reporting.
the interference caused by power leaking
into adjacent transmit channels. Adjacent
channel power ratio measurements help
to check for signal leakage and the
identification and control of sources of
interference.
It is quick and easy to set center frequenc
The spectrum emission mask shows the main
channel power and the power level vectors
relative to in-channel power for each out-of-channel
frequency range.
y,
integration bandwidth, and channel bandwidth.
Center frequency, main channel bandwidth, adjacent
channel bandwidth, and channel space can eadily be set.
AM/FM modulation analysis
(Option AMA)
Optional AM/FM modulation analysis shows
the metrics you need, including carrier power,
modulation rate, AM depth/FM deviation,
SINAD and carrier frequency offset. User
definable limits provide Pass/Fail indicators
in 4 cases: higher than carrier power, larger
than AM modulation index or FM deviation,
lower than AM modulation index or FM
deviation, or larger than carrier frequency
offset. The user can save the waveforms with
metrics for reporting as well as the set-up
parameters for future measurements or
analysis.
ASK/FSK modulation analysis
(Option DMA)
Optional ASK/FSK modulation analysis is now
available. Amplitude Shift Keying (ASK) is
used in RFID and optical systems. Frequency
Shift Keying (FSK) is used in many applications
including cordless phone, paging system
and RFID.
N9340B w/option DMA supports 4 display
modes: Symbol, Waveform, ASK/FSK Error,
and Eye Diagram. Included isPass/Fail testing
of higher than carrier power, higherthanASK
modulation depth/FSK frequency deviation,
lower than ASK modulation depth/FSK
frequency deviation and higher than FSK
frequency deviation. Themetrics you need are
shown, including carrier power, ASK/FSK
error, ASK depth/FSK frequency deviation,
and ASK index etc. For reports and future
measurements the waveform with metrics
and setup parameters can be saved.
The detailed metrics offer you the complete
understanding of the AM.
The detailed metrics offer you the complete
understanding of the FM.
The Eye Diagram of ASK also shows the metrics
with detailed parameters.
Page 7

Handheld Spectrum Analyzer (HSA)
N9340B
07
N9340B supports Meter and Chart mode to display the
results of power measurements.
N9340B supports U2000 series USB power sensors
for high accuracy power measurement.
The field strength measurement automatically takes into the
account of the antenna factor. The antenna table is definable
by the standard N9340B PC software.
High accuracy power
measurement
The N9340B now supports high-accuracy,
USB plug-and-play power measurements
as standard when connected to an Agilent
U2000 series USB power sensor. Make
true average power measurements for all
signal types with wide dynamic range up
to 18 GHz with just the push of a button.
The Agilent U2000 USB sensors require
no external power supplies and with internal
zeroing eliminate the need for external
calibration. Without the need for additional
boxes, the user can easily set up, calibrate
and control the power meter/sensor via
the analyzer’s USB port. The N9340B
can collect, display and save the power
meter results.
The analyzer also provides Pass/Fail testing
with user set upper and lower limits and a
Pass/Fail indicator. Test results are shown
in dBm and W when making absolute
measurements and in dB and percentage
when measurements are relative. Two display
modes are available: Meter or the Chart mode
to log power measurements over time.
Field strength measurement
Field strength measurement
Electric field strength measurements are
frequently required for field testing of
transmitter and antenna coverage. Field strength
measurements are now a standard function in
the N9340B. Calibrated field strength
measurements are easy to make once the
antenna factors are loaded into the analyzer via
the provided PC software based antenna
template. Either field strength (in dBµV/ m,
dBmV/ m, or V/m) or power flux density
(in dBm/m or W/m ) can be displayed. With
the amplitude offset function, the user can
correct gain or loss. And finally together
with the user-definable multi-limitline function,
the N9340Boffers the user quick and convenient
field strength measurements and analysis.
The Waveform of FSK also shows the metrics
with detailed parameters.
Channel table
For the users who prefer to tune the spectrum
analyzer according to channel numbers rather
than center frequency, you will find the new
Channel Table feature easy-to-use. The
Channel Table includes the major wireless
communication standards, such as AMPS,
GSM/EDGE/GPRS, CDMA, CDMA2000 etc.
The Channel Table can also be edited by the
user with the included N9340 PC Software.
The revised Channel Table can be
downloaded to the analyzer via a PC USB
cable or a USB memory stick.
The channel table offers the abilityto tune N9340B
according to channel numbers.
The channel tableis editable by N9340BPC software.
2
2
Page 8

08
N9340B Optimized Usability
to Enhance Field Test Productivity
A standard soft carrying case provides
further protection for your analyzer.
6.5’’ TFT screen with bright display for use
indoors and outdoors
Four-hour battery life
Modern USB and LAN connectivity for data
transfer and remote control
Multi-language User Interface
Rugged design, MIL-PRF 28800F Class 2 compliance
Back-lit keys for night use
* Windows is a U.S. registered trademark of the Microsoft Corporation.
N9340B supports remote control via
SCPI over USB and LAN.
Detailed analysis of results in the field is not
Remote control N9340B via SCPI over
USB/LAN is now available!
always convenient or possible. You will
need to store the results for later investigation. N9340B supports USB memory stick
for data storage and retrival. It makes it
easy to transfer and safeguard your
measurement data. Connecting to a PC is
simple and data transfer is fast via the
USB cable. In test lab and bench-top
use, the USB/LAN interface and PC
software also support PC remote control
of Agilent’s N9340B spectrum analyzer
This allows appropriate use of a large
format PC screen. Windows *-compatible
software provides automatic storage
of selected data and graphics.
As with al
l the newest Agilent portable field
equipment, operating under challenging
bright sunlight or other difficult natural
lighting conditions is no problem. The
unusual 6.5’’ TFT display with resolution
of 640 x 480 pixels provides a superior,
bright and clear trace for indoor and
outdoor use. There is no need to operate
in the shade.
Long battery life
Tough enough for the military
Testing in the field often means operating
away from main power supplies. Batteries
need to have the longest possible operating
time before recharging. You’ll find an
Agilent N9340B analyzer has superior
power management, providing an
impressive 4-hour battery operating time.
It’s easy to operate for an entire day in the
field. There is an advanced, in-built battery
management system. This helps extend
the useful battery operating time typically
up to four hours. With just one battery
and a spare, or a quick recharging from
any vehicle using the supplied auto-lighter
charger, you are able to operate for an
entire day away from a mains power
source.
You will find that this Agilent analyzer is
tough enough for military applications.
Apart from its generally compact and
rugged construction, the large rubberized
grips wrap around both ends, providing
additional robust protection from rough
handling. The sealed keypad and s
creen are
moisture resistant and dust proof. Of course,
there is a protective carrying case that
provides further protection for your analyzer.
See traces clearly indoors and
outdoors
Back-lit keys for night use
Modern USB and LAN connectivity
The N9340B is installed with a light sensor
in the front panel. The light-sensor can be
activated to adjust the display brightness
to adapt to changing lighting conditions.
Built-in light sensor
for night use. The user can see the keys
clearly even in darkness. The user can adjust
the brightness of keys and the duration of
the key light. It offers the user the ability to
easily operate N9340B at night.
Multi-language user interface
Users around the world will find operating
Agilent N9340B is easy. In addition to
English, there are ten more user-selectable,
on-screen languages, including Chinese,
Japanese, Korean and a number of
European languages (see Specifications –
General).
®
The N9340B is installed with back-lit keys
Page 9

09
Specifications
Handheld Spectrum Analyzer (HSA)
N9340B
Specifications apply under the following conditions:
After a warm-up time of 30 minutes, and at least two hours of operation or storage at operating temperature
Within a valid calibration period
Data with no given tolerances are typical values only. Data designated as 'typical' is not covered by the product warranty.
Supplemental information
Frequency
Frequency
Frequency range :
100 kHz to 3 GHz (tunable to 9 kHz)
Internal 10 MHz frequency reference accuracy
Aging rate :
Temperature stability :
± 1 ppm / year
± 2 ppm
AC coupled
Frequency readout accuracy with marker (Start, stop, center, marker)
Marker resolution :
Uncertainty :
( frequency span ) / ( number of sweep points – 1)
± ( frequency indication × frequency reference uncertainty
+1% × span + 20% × resolution bandwidth + marker
resolution+1 Hz)
Marker frequency counter
Frequency reference uncertainty = (aging rate x period of time since adjustment + temperature stability )
Frequency reference error = (aging rate
x period of time since adjustment + temperature stability )
Resolution:
Accuracy:
1 Hz
1 Hz
± (marker frequency × frequency reference
± span / ( sweep points – 1)
uncertainty + Counter resolution)
RBW/ span
0.02; marker level to displayed
noise level
>
>
25 dB; frequency offset 0 Hz
Frequency span
Range :
Resolution :
Accuracy :
0 Hz (zero span), 1 kHz to 3 GHz
SSB phase noise
Carrier offset :
30 kHz
100 kHz
1 MHz
< – 87 dBc (1 Hz)
< – 100 dBc (1 Hz)
< – 120 dBc (1 Hz)
fc = 1 GHz; RBW 100 Hz; VBW 10 Hz; RMS detector
Resolution bandwidth (RBW)
– 3 dB bandwidth :
– 3 dB bandwidth :
Accuracy :
Accuracy :
Resolution filter shape factor :
30 Hz to 1 MHz
± 5%
± 5%
< 5 : 1
1- 3 - 10 sequence
1- 3 - 10 sequence
Nominal
Nominal
60 dB / 3 dB bandwidth ratio;Nominal;
Digital, approximately Gaussian shape
Video bandwidth (VBW)
3 Hz to 1 MHz
0 °C to 30 °C
20 °C to 30 °C; Typical
in addition +2 ppm / 10 °C 30 °C to 50 °C
Page 10

Amplitude
Measurement range
Input attenuator range :
Maximum safe input level
Average continuous power :
Norminal
Input attenuator setting
DC voltage :
50 VDC maximum
Displayed average noise level
Preamp off :
100 kHz
1 MHz
10 MHz
1.5 GHz
1 MHz
f
c
<
10 MHz
f
<
c
f
c
<
1.5 GHz
f
<
c
3 GHz
=
c
50 MHz
f
1.9 GHz
c
f
=
<
<
<
<
<
<
( Typical )
( Typical )
Preamp on :
1 MHz
f
1 MHz
c
<
f
c
<
10 MHz
f
c
<
1.5 GHz
<
f
c
3 GHz
f
c
50 MHz
=
f
c
=
1.9 GHz
<
<
< < 141 dBm when option IBC or XDM is installed
<
<
<
( Typical )
( Typical )
100 kHz
10 MHz
1.5 GHz
RBW = 30 Hz, VBW = 3 Hz, input terminated 50 Ohm, 0 dB attenuation, RMS detector, Trace average
Level display range
Log scale and units :
Linear scale and units :
Sweep (Trace) points :
Marker level readout resolution :
Log scale
Linear scale
Detectors :
– 50 dBm
< 121 dBm when option IBC or XDM is installed
< 113 dBm when option IBC or XDM is installed
– 70 dBm
< 132 dBm when option IBC or XDM is installed
40
Reference level
10
Number of traces :
Trace functions :
Level measurement error :
Setting range :
Setting resolution :
Log scale
Linear scale
Accuracy :
Typical
–
0
Page 11

RF Input VSWR ( at tuned frequency )
Spurious response
Second harmonic distortion :
Third - order intermodulation :
Inherent residual response :
Sweep
Sweep time
Attenuator setting 0 dB < 1.8 : 1
Attenuator setting 10 dB < 1.8 : 1
< 1.5 : 1
< 1.8 : 1
Attenuator setting 20 dB < 1.6 : 1
< 1.4 : 1
< – 70 dBc
( third order intercept )
Input related spurious :
Range :
Sweep mode :
Trigger source :
Trigger slope :
Trigger delay :
Range
Resolution
+ 10 dBm, Typical
< – 70 dBc
< – 88 dBm
10 ms to 1000 s
6
µs to 200 s
Continuous, single
Free run, video, external
Selectable positive or negative edge
6 µs to 200 s
6 µs
10 MHz to 3.0 GHz, Nominal
100 kHz to 10 MHz, Nominal
10 MHz to 2.5 GHz, Typical
2.5 GHz to 3.0 GHz, Typical
100 kHz to 10 MHz, Nominal
10 MHz to 3.0 GHz, Typical
Mixer level = – 40 dBm, frequency
Third-order intermodulation products, 2 x – 20 dBm,
reference level –10 dBm, center frequency 300 MHz,
frequency separation 200 kHz
RF attenuation = 0 dB
RF preamplifier = OFF
– 40 dBm signal at input mixer,
carry offest > 1 MHz.
Input terminated and 0 dB RF attenuation,
preamplifier off, reference level – 30 dBm,
f > 30 MHz, RBW < 10 kHz
1 kHz
Span
Span = 0 Hz ( zero span )
50 MHz
Front panel input / output
RF input
Connector and impedance :
10 MHz reference / External trigger input
Reference input frequency :
Reference input amplitude :
Trigger voltage :
Connector and output impedance :
Connectivity
USB host :
USB device :
LAN :
Type - N female, 50
10 MHz
0 to + 10 dBm
5 V TTL level
BNC female, 50
USB Type-A female,compatible with
USB 2.0 full speed
USB Type-mini AB female
Compatible with USB 2.0 full speed
RJ-45, 10 Base-T
Nominal
Nominal
Nominal
11
Page 12

General
Display
Resolution :
Size and type :
Internal memory
User memory :
Languages
On-Screen GUI :
Power requirements and calibration
Adaptor Voltage :
Power consumption :
Battery :
Operating time ( fully charged battery )
Charging time
Life time
Warm-up time :
Calibration cycle :
640 x 480 pixels
6.5 inch ( 170 mm ) TFT color display
Able to store about 3,600 traces
English, Simplified Chinese, Traditional Chinese, French, German, Italian, Japanese, Korean, Russian,
Spanish, Portuguese.
90 to 120 or 195 to 263 VAC, 50 to 60 Hz
12 to 18 VDC, < 55 W
13 W
4 hours
3 hours
3 hours
300 to 500 charge cycles
30 minutes
One year
Auto-ranging
Typical
Tracking generator off
Tracking generator on
Environmental and size
Temperature range :
Relative humidity :
Weight :
Dimensions :
– 10 to + 50°C
– 40 to + 70°C
< 95%
3.2 kg ( 7 Ibs )
318 × 207 × 69 mm
Options
Spectrogram Monitoring (Option INM)
3 display modes : Spectrogram
Spectrum trace
Combination of spectrogram and spectrum trace in one screen
Low frequency performance enhancement and xDSL measurement capability (Option XDM)
XDM Channel :
DANL :
9 kHz to 12 MHz
30 Hz RBW, 3 Hz VBW, 50 Ohm termination on input, 0 dB attenuation, RMS detector, Trace Average
P
r
e
a
m
p
o
f
f
9 kHz < f
c – 117 dBm, nominal
100 kHz < fc < 12 MHz < – 132 dBm
Preamp on
100 kHz < f
1 MHz < f
c < – 138 dBm, nominal
c < – 140 dBm
Operating ( Battery: 0 to 50
Storage ( Battery: –20 to 50 °C )
Net (shipping) approximately,
3.5 kg (7.7 Ibs) with battery
Approximately ( W x H x D)
R
R
°C )
– 50 dBm
– 70 dBm
40
12
Page 13

Low frequency performance enhancement and AM/FM In-Band On-Channel IBOC Measurement (Option IBC)
Frequency Range :
AM Channel :
FM Channel :
DANL :
RF preamplifier ( Option PA3 )
Frequency range :
Gain :
Tracking generator (Option TG3 )
Frequency range :
Output level :
Output flatness :
VSWR :
Connector and impedance :
tnemeriuqer)MA(COBIotgnidroccAzHk0081otzHk034
87.25 MHz to 108.55 MHz
According to IBOC (FM) requirement
30 Hz RBW, 3 Hz VBW, 50 Ohm termination on input, 0 dB attenuation, RMS detector, Trace Average > 40
Preamp off
– 50 dBm
9 kHz < f
c – 117 dBm, nominal
100 kHz < f
c < 12 MHz < – 132 dBm
Preamp on
– 70 dBm
100 kHz < fc – 138 dBm, nominal
1 MHz < f
c –
1 MHz to 3 GHz
20 dB
Nominal
5 MHz to 3 GHz
0 to
–25 dBm
1 dB steps
± 3 dB
Referenced to 50 MHz, 0 dBm
< 2.0 : 1
Nominal
Type-N female, 50
Demodulation
Frequency range :
Carrier power accuracy :
Carrier power displayed resolution :
AM measurement
Modulation rate :
Accuracy :
Depth :
Accuracy :
FM measurement
Modulation rate :
Accuracy :
Deviation :
Accuracy :
10 MHz to 3 GHz
±2 dBm
±1 dBm
Typical
0.01 dBm
20 Hz to 100 kHz
1 Hz, nominal (Modulation rate < 1 kHz)
< 0.1% modulation rate, nominal (Modulation rate > 1 kHz)
5 to 95%
Nominal
20 Hz to 200 kHz
1 Hz, nominal (Modulation rate < 1 kHz)
< 0.1% modulation rate, nominal (Modulation rate > 1 kHz)
Nominal
13
Page 14

N9340B
Handheld Spectrum Analyzer (HSA)
ASK measurement
Symbol rate range :
Modulation depth/index
Range :
Accuracy :
Displayed resolution :
FSK measurement
200 Hz to 100 kHz
10% to 95%
±4% of reading nominal
0.1%
Symbol rate range :
FSK deviation
Range :
Accuracy :
Displayed resolution :
* ß is the ratio of frequency deviation to symbol rate (deviation/rate)
1 kHz to 100 kHz
1 kHz to 400 kHz
±4% of reading nominal ß > 1 and ß < 4
0.01 Hz
*
14
Page 15

15
Ordering Information
Model number Description
Handheld Spectrum Analyzer (HSA)
N9340B
N9340B handheld spectrum analyzer 100 kHz to 3.0 GHz
Accessories supplied as standard with each
Multi-language Quick Start Tutorial
CD-ROM of the manual
Soft carrying case
Options
N9340B-PA3 3 GHz preamplifier
N9340B-TG3 3 GHz tracking generator
N9340B-1TC Hard transit case
N9340B-1DC Automotive 12 V DC adaptor
N9340B-AMA AM/FM modulation analysis
N9340B-DMA ASK/FSK modulation analysis
N9340B-BAT Spare battery pack
N9340B-ADP Spare AC/DC adaptor
N9340B-BCG External battery charger
N9340B-TAD Adaptor Type-N(m) 50 Ohm to Type-N (f) 75 Ohm DC to 1 GHz
N9340B-ABA Manual – English
N9340B-AB2 Manual – Chinese
N9340B-ABJ Manual – Japanese
Warranty and service
Standard warranty is one year.
R-51B-001-3C 1 year Return-to-Agilent warranty extended to 3 years
Calibration
R-50C-001-3 Agilent Calibration Upfront Support Plan
3 year coverage
N9340B-INM Extended spectrogram monitoring
N9340B-XDM N9340B with Low frequency performance enhancement and xDSL measurement capability
N9340B-IBC N9340B with low frequency performance enhancement and AM/FM In-Band On-Channel IBOC Measurement
Page 16

www.agilent.com
www.agilent.com/find/hsa
www.agilent.com/find/n9340b
Agilent Email Updates
www.agilent.com/find/emailupdates
Get the latest information on the
products and applications you select.
Agilent Channel Partners
www.agilent.com/find/channelpartners
Get the best of both worlds: Agilent’s
measurement expertise and product
breadth, combined with channel
partner convenience.
Agilent Advantage Services is committed
to your success throughout your equipment’s lifetime. To keep you competitive,
we continually invest in tools and
processes that speed up calibration and
repair and reduce your cost of ownership.
You can also use Infoline Web Services
to manage equipment and services more
effectively. By sharing our measurement
and service expertise, we help you create
the products that change our world.
www.agilent.com/find/advantageservices
www.agilent.com/quality
For more information on Agilent
Technologies’ products, applications or
services, please contact your local Agilent
office. The complete list is available at:
www.agilent.com/find/contactus
Americas
Canada (877) 894 4414
Brazil (11) 4197 3500
Mexico 01800 5064 800
United States (800) 829 4444
Asia Pacific
Australia 1 800 629 485
China 800 810 0189
Hong Kong 800 938 693
India 1 800 112 929
Japan 0120 (421) 345
Korea 080 769 0800
Malaysia 1 800 888 848
Singapore 1 800 375 8100
Taiwan 0800 047 866
Other AP Countries (65) 375 8100
Europe & Middle East
Belgium 32 (0) 2 404 93 40
Denmark 45 70 13 15 15
Finland 358 (0) 10 855 2100
France 0825 010 700*
*0.125 €/minute
Germany 49 (0) 7031 464 6333
Ireland 1890 924 204
Israel 972-3-9288-504/544
Italy 39 02 92 60 8484
Netherlands 31 (0) 20 547 2111
Spain 34 (91) 631 3300
Sweden 0200-88 22 55
United Kingdom 44 (0) 131 452 0200
For other unlisted countries:
www.agilent.com/find/contactus
Revised: June 8, 2011
Product specifications and descriptions
in this document subject to change
without notice.
© Agilent Technologies, Inc. 2011
Published in USA, December 10, 2011
5989-7847EN
 Loading...