

Page 1
TEMS™ VISUALIZATION ENTERPRISE
BRIDGING THE OPTIMIZATION GAP
Page 2

2 TEMS™ VISUALIZATION 7.3 ENTERPRISE
SEE YOUR NETWORK IN A WHOLE NEW WAY
TEMS Visualization is revolutionizing
the optimization of wireless networks.
It post-processes event-based data
generated by the network infra-
structure, analyzing and organizing
the information for radio network
troubleshooting, optimization, and
functionality verification.
For mobile operators that are serious about delivering ubiquitous quality
and availability, traditional network performance management tools simply
aren’t enough. To home in on problems that were impossible to pinpoint
before (those in difficult-to-drive-test spots or related to individual sub-
scriber or phone model issues), operators must complement their network
performance management and drive-testing tools with advanced network
visualization and optimization capabilities.
Breakthrough network optimization tools like TEMS Visualization use
event-based data from the infrastructure side to bridge the critical gap
between performance management systems and drive testing. While per-
formance management tools provide high-level key performance indicators
(KPIs) from counter data, and drive-testing tools capture thin slices of net-
work traffic, TEMS Visualization derives detailed information from large
volumes of live network traffic.
The General Performance Event Handling (GPEH) application for
WCDMA and CellTrace application for LTE (both available in Ericsson net-
works) enable the TEMS Visualization Enterprise edition to collect, retrieve,
store, and analyze event data from large areas of the network, in greater
volume and detail, and more cost-effectively than is possible using external
probes. Event data logfiles are generated in the radio network elements and
collected in the Ericsson OSS-RC file storage for post-processing by TEMS
Visualization Enterprise.
Page 3
TEMS™ Visualization
3TEMS™ VISUALIZATION 7.3 ENTERPRISE
This enterprise-grade solution gives RF engineers the most effective
way to troubleshoot and optimize WCDMA and LTE networks. Benefits in-
clude:
Faster troubleshooting and mean time to repair (MTTR) – TEMS
Visualization’s diagnostics features help users more quickly find root
causes for RF and network capacity problems, enabling them to
enhance quality of service.
Improved decision making – The large volumes of decoded event data
and smaller volumes of calculated statistical data are stored separately.
Thus, statistical data can be stored and analyzed over longer time periods
– giving operators actionable information that fosters better decisions.
Reduced CAPEX, thanks to support of existing and next-generation
wireless standards – Ensure that your OSS tools can evolve to meet the
needs of your complex infrastructure by exploiting TEMS product support
for WCDMA and HSPA/HSPA+, and LTE technologies.
Enterprise is a true client/
server solution, providing
processing, storage, and
remote access for large
volumes of data.
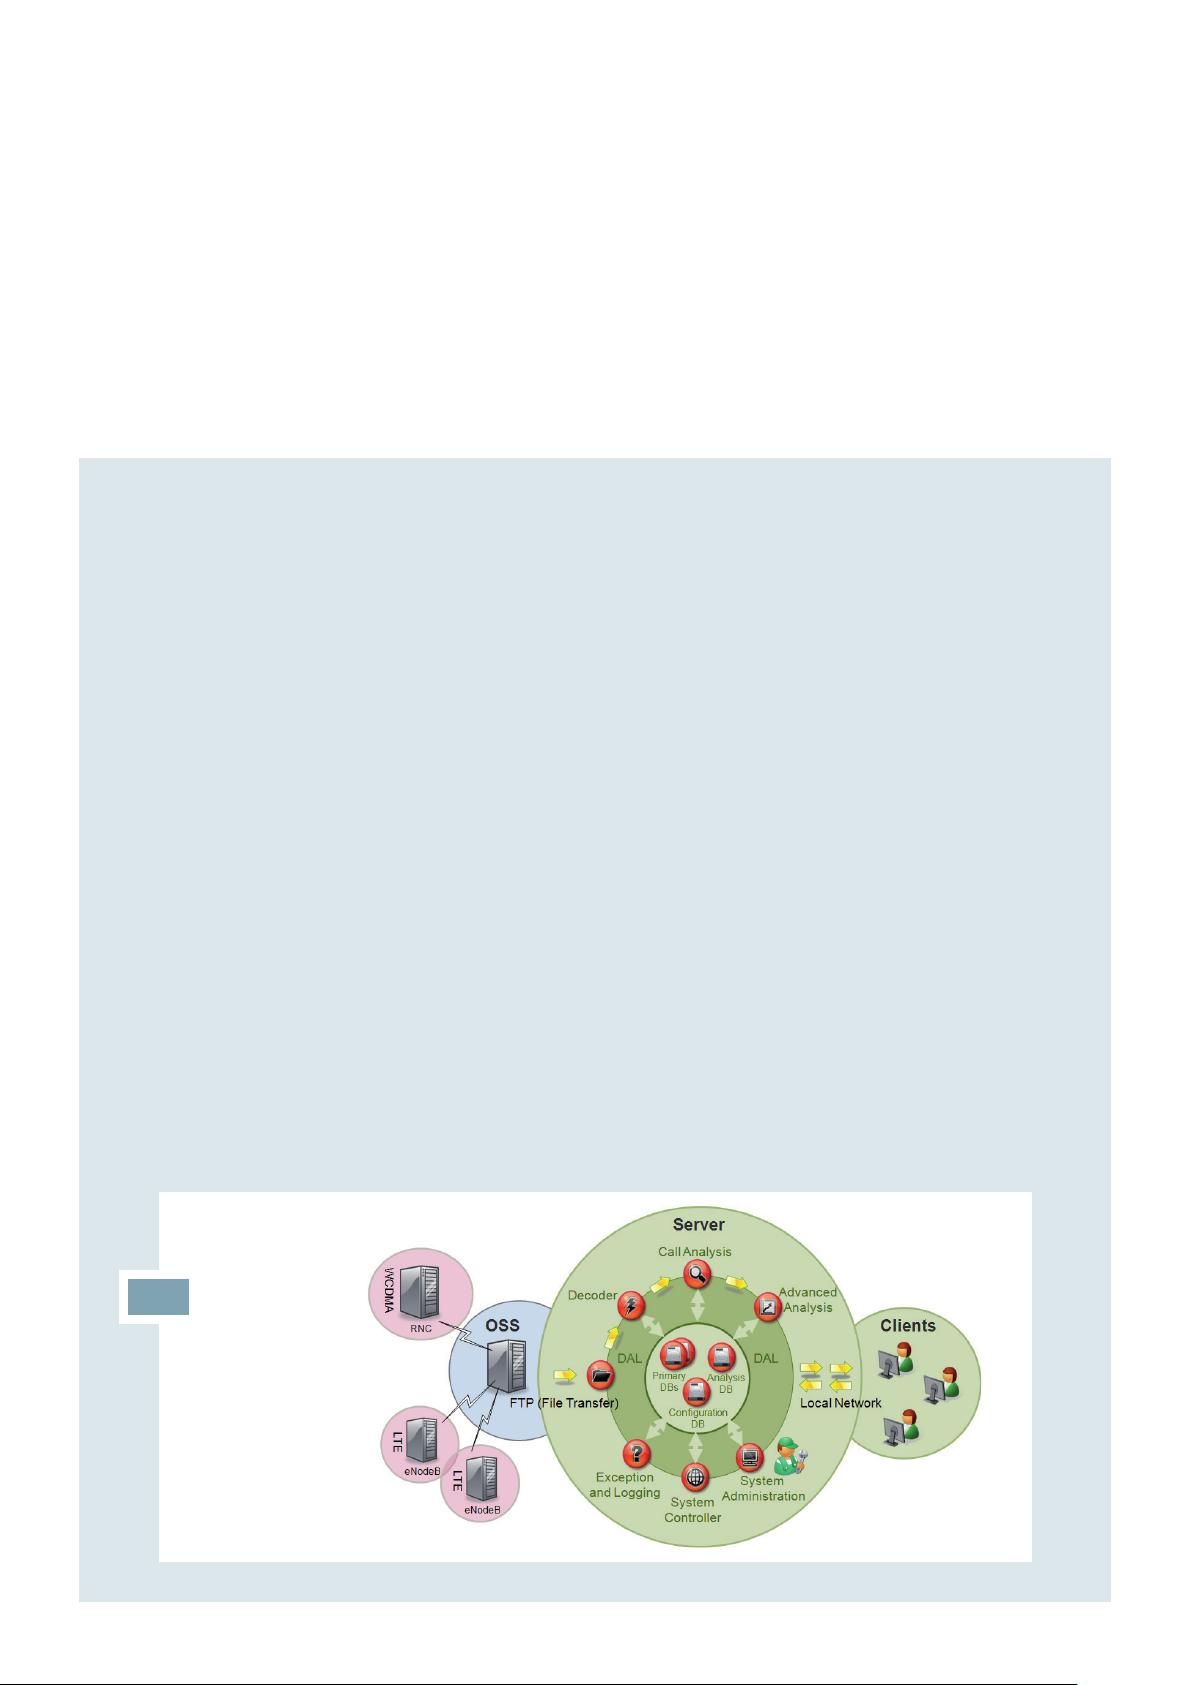
System Overview
The TEMS Visualization Enterprise edition consists of servers and clients.
The servers collect, process, and store all data. A powerful data pro-
cessing engine, designed from the bottom up with 64-bit and multi-core/
CPU support in mind, keeps pace with increasing data volumes.
The clients send queries to the server, collect the results, and depict
them visually. Users install the client software on their own machines with-
out the need for added remote access software.
Page 4

4 TEMS™ VISUALIZATION 7.3 ENTERPRISE
POWERFUL, UNIQUE FEATURES
Intra-frequency Neighbor Optimization
RF TROUBLESHOOTING – QUICKLY PINPOINT THE ROOT OF NETWORK
PERFORMANCE DEGRADATIONS
To troubleshoot performance degradations in today’s complex networks,
RF engineers often need more information than is available from basic KPI
counter data, alarms and trouble-tickets. To help them get to the root-
causes of problems efficiently, TEMS Visualization processes, organizes
and visualizes large volumes of calls generated by real subscribers and
allows:
Performance problems such as dropped and blocked calls to be
attributed to specific cells, subscribers or phone types – with KPIs
aggregated from the event data
Approximate locations of performance problems to be identified with
geo-location features for WCMDA
Basic RF and capacity issues, which are causing performance degrada-
tions, to be easily identified using the automated diagnostics features
for WCDMA
Direct drill-down from all features, enabling engineers to analyze in
detail the data from individual calls and messages so they can trap,
track, and eradicate problems based on message sequences and
specific phone models
Coverage Area Optimization
KPI views
Aggregated from WCDMA GPEH and LTE CellTrace data with direct
drill-down to detailed call analysis
Accessibility, retainability, mobility and WCDMA data integrity (high-
speed throughput and channel switching)
Per cell and per cell group and, for WCDMA, per subscriber and per
subscriber group – these views enables engineers to investigate
performance problems for TEMS™ Automatic units, important corporate
customer groups, or VIPs
Per main service type (e.g., CS speech, PS Interactive R99/HS, PS
Interactive EUL/HS) for WCDMA, and per QCI for LTE
Charts for quick identification of worst performers
Page 5

Exception analysis summarizes all of the GPEH messages recorded for
the selected scope and all of the TEMS Visualization events generated. For
selected GPEH messages, users can drill down even further and count the
occurrences of different RAB types and cause values. There is no more ef-
fective way to find the root causes of network problems. Calls containing
the selected events can then be sent to call analysis.
5TEMS™ VISUALIZATION 7.3 ENTERPRISE
Call analysis allows drill-down to the individual call level. Calls high-
lighted in any feature can be sent to call analysis for in-depth examination.
Sequences of signaling messages are shown, and the reasons behind prob-
lems such as blocked and dropped calls can be investigated in great detail.
Users can follow radio measurements per call, view detailed content for
individual messages, retrieve distance and quality information, and analyze
large groups of calls for patterns. This extremely powerful feature can, for
example, quickly determine if all dropped calls in a cell are generated by the
same user or on the same RAB type.
WCDMA capacity diagnostics identify cells with resource issues by
using peak usage statistics for key resource types. Problem cells can then
be examined in detail with charts showing the usage of resources such as
channel elements, power, and active high-speed users in high-resolution.
WCDMA RF diagnostics automatically highlight cells with RF issues.
Analysis of measurement reports identifies cells with problems such as out
of coverage, high DL interference, high UL interference, or UL/DL imbalance.
Further analysis identifies the potential causes of these issues, such as miss-
ing IRAT/IFHO handovers, UL path losses, overshooting cells, or pilot pollu-
tion. The MRR-W feature in the Ericsson OSS-RC is required.
WCDMA geo-location of selected events enables dropped calls to be
geo-located, with the number of dropped calls in each 100m x 100m bin
displayed on the map. Clicking on a bin presents details for the drops in that
bin and allows further drill-down.
WCDMA high-speed packet data analysis
Average throughput statistics included in all KPI views
Detailed throughput measurements added to measurement view in call
analysis feature
Page 6

6 TEMS™ VISUALIZATION 7.3 ENTERPRISE
RF OPTIMIZATION – PROACTIVE KPI MAINTENANCE AND IMPROVEMENT
TEMS Visualization Enterprise also includes features that increase effi-
ciency in the most important day-to-day RF optimization tasks. Utilizing
the live subscriber traffic, engineers can make the most well informed
optimization decisions and positively impact subscriber perceived net-
work quality.
WCDMA neighbor optimization makes it possible to easily optimize
the neighbor plans, which are crucial for network performance. Missing
neighbors and non-utilized existing neighbors are identified for both intra-
frequency and, uniquely, inter-frequency relations. Per-IMSI statistics allow
the exclusion of individual subscriber specific issues – and the engineer to
focus on true network issues. All of this information is linked to the map
view for easy analysis. Changes can be made and saved to a Bulk CM format
file for import into the OSS-RC.
WCDMA coverage area optimization allows overshooting cells to be
quickly identified and down-tilts adjusted. An algorithm calculates an over-
shooting distance for each cell. During processing, statistics are calculated
for the number of overshooting calls and the number of calls established in
poor quality. Detailed investigation of the calls established in each distance
band and the quality of those calls can also be shown in charts and on the
map.
WCDMA geo-location of pilot pollution allows areas where several
cells are involved in overlapping coverage to be geo-located on the map,
enabling engineers to determine if:
Cells are providing coverage in unwanted areas and causing pilot
pollution
Wanted cell coverage will still be good if, for example, the polluting cells
are down-tilted
The reason behind pilot pollution is simply poor coverage
Page 7

GENERAL FEATURES
TEMS Visualization Enterprise can take in the Bulk CM format directly
from the Ericsson OSS-RC and store the required information in the
project database. This includes neighbor cell relations and selection
priorities and other cell parameters that the features require
Any missing information, such as latitude, longitude and antenna
direction, and beam-width, can be taken from a reference file
TEMS Visualization includes the most widely used map engine in the
world, MapInfo’s MapXtreme®. This makes it possible to reuse all of the
maps currently used in TEMS™ Investigation and MapInfo
The functionality in the map view includes thematic mapping display
from all of the advanced TEMS Visualization Enterprise features
TEMS Visualization Enterprise makes it easy to differentiate on the map
cells between different WCDMA carriers (UARFCN) at the same site
location. Separate display filters are automatically created
TEMS Visualization uses the Microsoft® SQL Server 2008 R2 Enterprise
database solution
7TEMS™ VISUALIZATION 7.3 ENTERPRISE
Page 8

www.ascom.com/tems
NETWORK REQUIREMENTS
Ericsson WCDMA GPEH data source
Ericsson WCDMA P6-W10B with GPEH
MRR-W in OSS-RC also required for the RF diagnostics feature
Ericsson LTE CellTrace data source
Ericsson LTE L11A with CellTrace
A REVOLUTIONARY SOLUTION
TEMS Visualization Enterprise is:
Powerful – This is a true client/server solution. Large volumes of data
can be processed, stored centrally, and accessed remotely through the client
application.
Efficient – Data processing can be completely automatic so that infor-
mation is always ready to be analyzed when needed.
Smart – Statistical data can be stored and analyzed over longer time
periods, giving operators more confidence in their decisions.
TEMS Visualization Enterprise is ideal for both troubleshooting of net-
work problems and for regional optimization. The tool gives operators the
information they need to get the optimal performance from their network in
the most efficient manner possible
Ascom Network Testing Inc.
1943 Isaac Newton Square
Reston | VA | 20190-5006 | USA
www.ascom.com/tems
NEW IN RELEASE 7.3
TEMS Visualization 7.3 Enterprise adds support for LTE networks, making it
easier and more cost effective for mobile operators to troubleshoot and
optimize their 4G networks and ensure high-quality next-generation ser-
vices.
Ericsson LTE CellTrace Module
Support for Ericsson LTE CellTrace L11A
Cell KPIs and cell group KPIs – for finding worst performing cells and clusters
Exception analysis – for finding exception events
Drill down to detailed call-by-call analysis
Ericsson WCDMA GPEH Modul
Cell group KPIs – for finding worst performing clusters
12.2010 © Ascom 2010. All rights reserved. TEMS is a trademark of Ascom. All other trademarks are the property of their respective holders. | DSH - 8909-0004 Uen Rev B | Photo: Fotograf Paulina
 Loading...