

Page 1
TEMS™ VISUALIZATION ENTERPRISE
BRIDGING THE OPTIMIZATION GAP
Page 2

2 TEMS™ VISUALIZATION 7.2 ENTERPRISE
SEE YOUR NETWORK IN A WHOLE NEW WAY
TEMS Visualization has revolutionized
the optimization of WCDMA and GSM
networks. It post-processes event-based
data generated by the Ericsson
infrastructure, analyzing and organizing
it for troubleshooting, monitoring, and
verifying network functionality.
Looking at individual call data from the infrastructure side bridges the
gap between performance management systems and drive testing. While
performance management tools provide masses of data, and drive-test
tools capture thin slices of network traffic, TEMS Visualization derives de-
tailed information from large volumes of data.
This recently developed, Enterprise-grade solution gives RF engineers
the most effective way to troubleshoot and optimize WCDMA networks.
The General Performance Event Handling (GPEH) application available
in Ericsson networks enables the collection, retrieval, and storage of event
data for WCDMA, in greater volume and detail and more cost-effectively
than is possible using passive probes. Files are generated in the network
elements (RNC) and collected in the OSS-RC file storage for post-processing
by TEMS Visualization Enterprise.
Powerful – This is a true Client/Server solution, designed for 64-bit
Servers. Large volumes of data can be processed, stored centrally, and ac-
cessed remotely through the Client application.
Automated – Data processing can be completely automatic. Also, the
new Diagnostics features help users find root causes for RF and capacity
problems quickly.
Better decisions –The large volumes of decoded event data and smaller
volumes of calculated statistical data are stored separately. This means
statistical data can be stored and analyzed over longer time periods – giving
operators more confidence in their decisions.
Page 3
HOW TEMS VISUALIZATION ENTERPRISE WORKS
3TEMS™ VISUALIZATION 7.2 ENTERPRISE
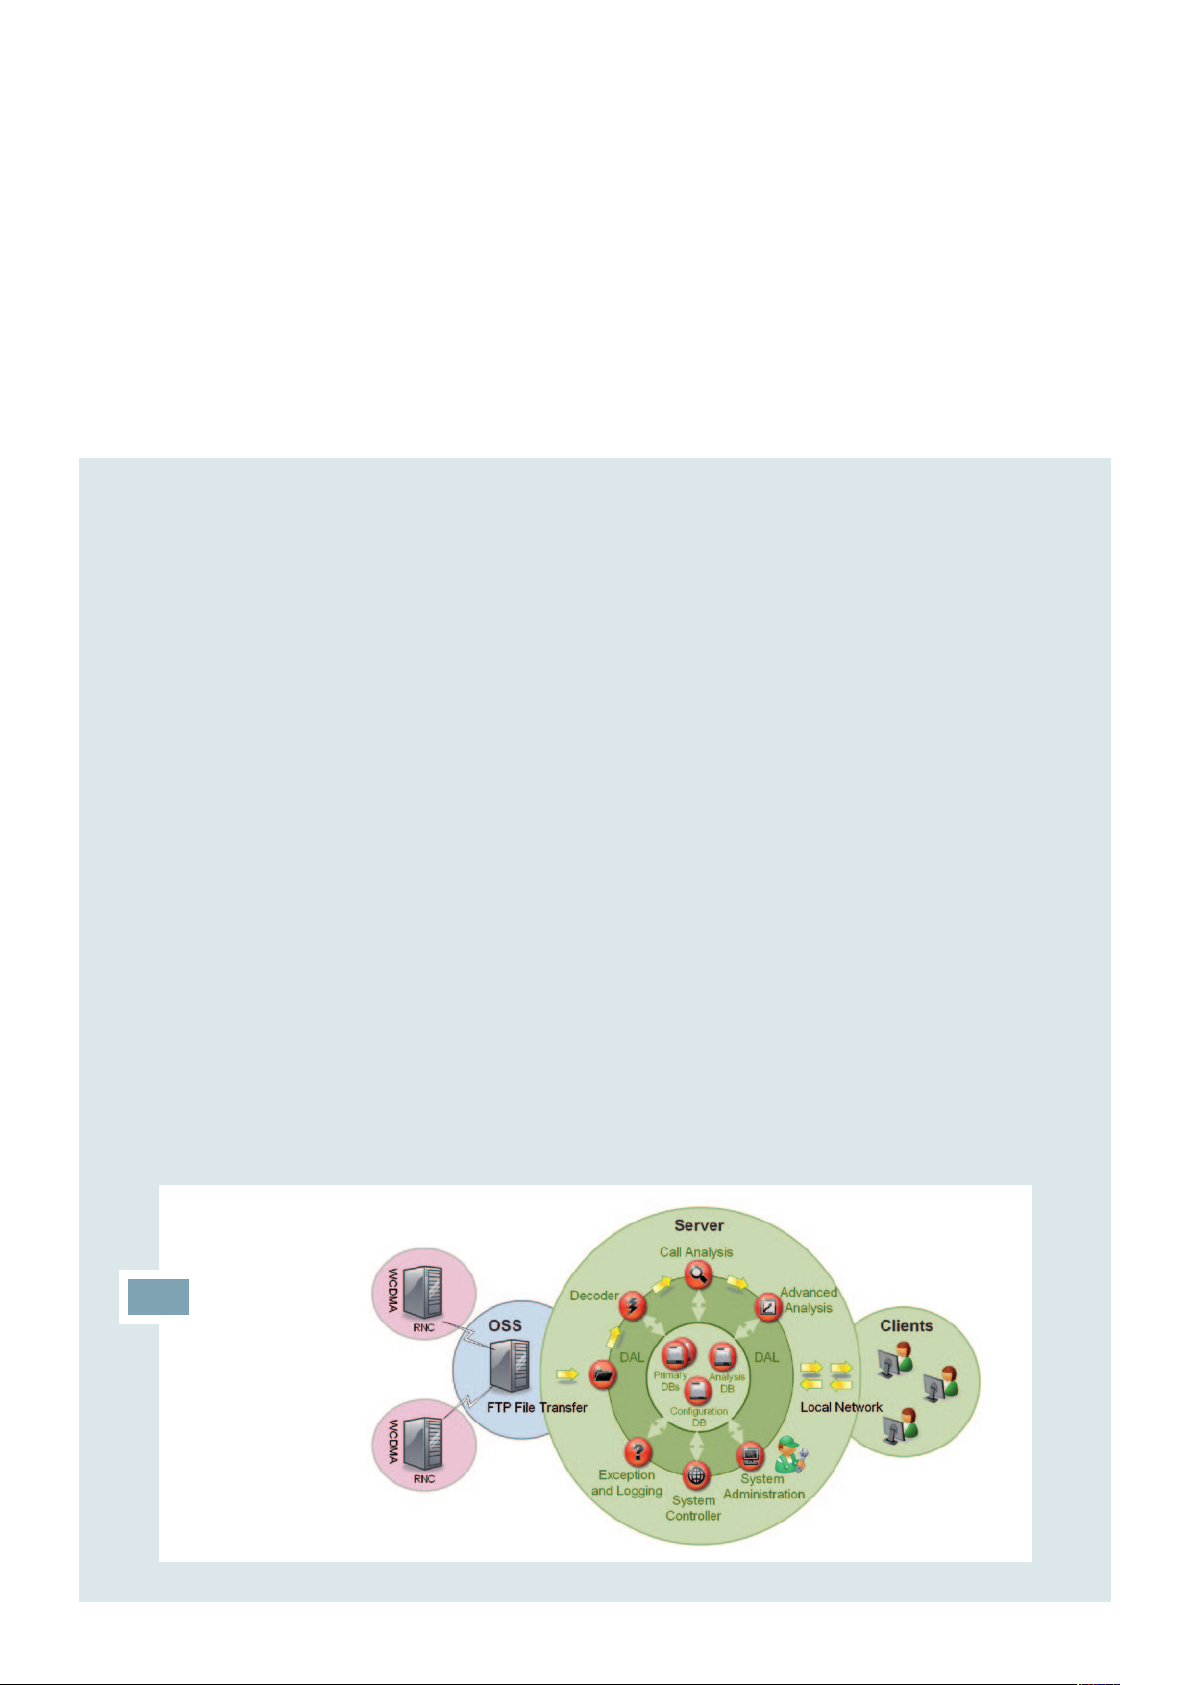
The product consists of a Server and Clients.
The Server collects, processes, and stores all data, and a powerful data
processing engine keeps pace with increasing data volumes. Enterprise has
been designed from the bottom up with 64-bit support and multi-core/CPU.
The Clients send queries to the Server, collect the results, and depict
them visually. Users install the Client software on their own machines with-
out added remote access software.
The separation of data into Primary and Analysis Databases allows
troubleshooting and optimization based on data collected over long time
periods.
After recordings have been set up in the OSS-RC, the data flow through
the TEMS Visualization Enterprise system can be immediate and completely
automatic, with no need for manual processing or scheduling at any stage.
“TEMS™ Visualization Enterprise is a true Client/Server
solution, providing processing, storage, and remote access
for large volumes of data.”
System Overview
Page 4

4 TEMS™ VISUALIZATION 7.2 ENTERPRISE
POWERFUL, UNIQUE FEATURES
Intra-frequency Neighbor Optimization
Automated Network Diagnostics
Many causes of performance degradation are basic problems.
Congestion can push traffic to non-optimal cells, installation problems can
result in swapped feeders or overshooting cells, real-life coverage can differ
from predictions, and equipment can fail. Capacity Diagnostics and RF
Diagnostics highlight cells with these issues and search for the root causes.
Capacity Diagnostics identify cells with resource issues, and peak us-
age statistics for key resource types are calculated. Problem cells can then
be examined in detail with high-resolution charts showing the usage of
resources such as channel elements, power, and active HS users.
RF Diagnostics automatically highlight cells with RF issues. Analysis
of Measurement Reports identifies cells with issues such as out of coverage,
high DL interference, high UL interference, or UL/DL imbalance. Further
analysis identifies the potential causes of these issues, such as missing IRAT/
IFHO handovers, UL path losses, overshooting cells, or Pilot Pollution. The
MRR-W feature in the Ericsson OSS-RC is required.
Coverage Area Optimization
Optimization Decision Support
Neighbor Optimization makes it possible to easily verify the neighbor
plan (crucial for network performance) and find both missing neighbors and
non-utilized existing neighbors in a WCDMA network. Missing Neighbor
statistics, as reported by actual users, existing neighbor usage, and Pilot
Pollution statistics are presented. Per-IMSI statistics allow classification of
missing neighbors as UE or network issues. This information is linked to the
map view for easy analysis. Changes can be made and saved to a BulkCM
format file for import into the OSS-RC.
Coverage Area Optimization allows overshooting cells to be quickly
identified and down-tilts adjusted. An algorithm calculates an overshooting
distance for each cell. During processing, statistics are calculated for the
number of overshooting calls and the number of calls established in poor
quality. Detailed investigation of the calls established in each distance band
and the quality of those calls can also be shown in charts and on the map.
Page 5

Detailed Investigations
Exception Analysis summarizes all GPEH messages recorded for the
selected scope and all the TEMS Visualization events generated. For se-
lected GPEH messages, users can drill down even further and count the
occurrences of different RAB types and cause values. There is no more ef-
fective way to find the root causes of network problems. Calls containing
the selected events can then be sent to Call Analysis.
Call Analysis allows drill-down to the individual call level. Calls high-
lighted in any feature can be sent to Call Analysis for in-depth examination.
Sequences of signaling messages are shown, and the reasons behind prob-
lems such as blocked and dropped calls can be investigated in great detail.
Users can follow radio measurements per call, view detailed content for
individual messages, retrieve distance and quality information, and analyze
large groups of calls can be analyzed for patterns. This extremely powerful
feature can, for example, quickly determine if all dropped calls in a cell are
generated by the same user or on the same RAB type.
Geo-location of selected events is based on measurements made by
the mobile and reported to the RNC. Areas where several cells are involved
in overlapping coverage are geo-located on the map, allowing engineers to
determine if:
Cells are providing coverage in unwanted areas and causing Pilot
Pollution.
Wanted cell coverage will still be good if, for example, the polluting cells
are down-tilted.
The reason behind Pilot Pollution is simply poor coverage.
5TEMS™ VISUALIZATION 7.2 ENTERPRISE
In addition, dropped calls can be geo-located, with the number of
dropped calls in each 100m x 100m bin displayed on the map. Clicking on
a bin presents details for the drops in that bin and allows further drill-down.
Page 6

6 TEMS™ VISUALIZATION 7.2 ENTERPRISE
GENERAL FEATURES
GENERAL FEATURES
TEMS Visualization Enterprise can take in the BulkCM format directly
from the Ericsson OSS-RC and store the required information in the
Project database. This includes neighbor cell relations and selection
priorities and other cell parameters that the features require.
Any missing information, such as latitude, longitude and antenna
direction, and beam-width, can be taken from a reference file.
The time duration of data to be analyzed can be selected independently
for each feature.
TEMS Visualization includes the most widely used map engine in the
world, MapInfo’s MapExtreme®. This makes it possible to reuse all the
maps currently used in TEMS™ Investigation and MapInfo.
The functionality in the map view includes thematic mapping display
from all of the advanced TEMS Visualization Enterprise features.
TEMS Visualization Enterprise makes it easy to differentiate on the map
cells between different carriers (UARFCN) at the same site location.
Separate display filters are automatically created.
Uses the Microsoft® SQL Server 2008 Enterprise database solution.
Geo-locates selected events based on measurements made by the
mobile and reported to the RNC, with results presented in map graphics.
Enables engineers to pinpoint the causes of Pilot Pollution and dropped
calls.
In WCDMA networks, accurate neighbor planning is crucial to perfor-
mance, especially with second and third carriers becoming common-
place. Neighbor Optimization features make it possible to quickly and
easily optimize neighbor plans based on real customer traffic.
An array of KPI views is presented, by cell, subscriber, and subscriber
group. HS data performance analysis includes average throughput
statistics in all views.
User-defined queries employ raw data with complex conditions.
Page 7

NETWORK REQUIREMENTS
Ericsson GPEH Module
TEMS Ericsson WCDMA P6-W10B with GPEH
MRR-W in OSS-RC also required for RF Diagnostics feature
7TEMS™ VISUALIZATION 7.2 ENTERPRISE
A REVOLUTIONARY SOLUTION
TEMS Visualization Enterprise is ideal for both troubleshooting of
network problems on a cell-by-cell basis and for regional optimization. The
tool gives operators the information they need to get the optimal
performance from their network in the most efficient manner possible.
Page 8

www.ascom.com/tems
TEMS Visualization 7.2 Enterprise
incorporates enhancements in three
main categories:
Features to maintain performance
when adding second and third carriers
Additional HS data performance
analysis capabilities
Geo-location of Pilot Pollution
problems and dropped calls
NEW IN RELEASE 7.2
W10B Support
Added support for Ericsson W10B GPEH and BulkCM
Support for WCDMA System Releases P6 to W10B
General enhancements
Schedule Server for night-time data processing and daytime client access
Enhanced workspace management
Scrambling Code reuse report on map
Simplified licensing scheme
Geo-location for optimization
Geo-locate dropped calls
Geo-locate areas of Pilot Pollution
KPI views
Aggregated from GPEH data, direct drill-down to detailed analysis
Accessibility, retainability, mobility, data integrity
Per cell, subscriber, and Subscriber Group
Per Main Service type (CS speech, PS Interactive R99/HS, PS Interactive
EUL/HS, etc.)
Charts for quick identification of 10 worst cells and subscribers
Subscriber Group KPI
Filter data based on user-defined groups of subscribers
Monitor performance for TEMS Automatic units, important corporate
customer groups, VIPs
HS Packet Data Analysis
Average throughput statistics included in all KPI views
Detailed throughput measurements added to Measurement view in Call
Analysis
Neighbor Optimization enhancements
New inter-frequency feature
Enhanced Change Request view
User-defined queries
User-defined queries on raw data with complex conditions
Store on server and share with other users
Pilot Pollution threshold-based
New way to calculate Pilot Pollution
Ascom Network Testing Inc.
1943 Isaac Newton Square
Reston | VA | 20190-5006 | USA
www.ascom.com/tems
08.2010 © Ascom 2010. All rights reserved. TEMS is a trademark of Ascom. All other trademarks are the property of their respective holders. | DSH - 8909-0002 Uen Rev A | Photo: Fotograf Paulina
 Loading...