

Page 1
TEMS™ VISUALIZATION
BRIDGING THE OPTIMIZATION GAP
Page 2

2 TEMS™ VISUALIZATION 7.2 PROFESSIONAL
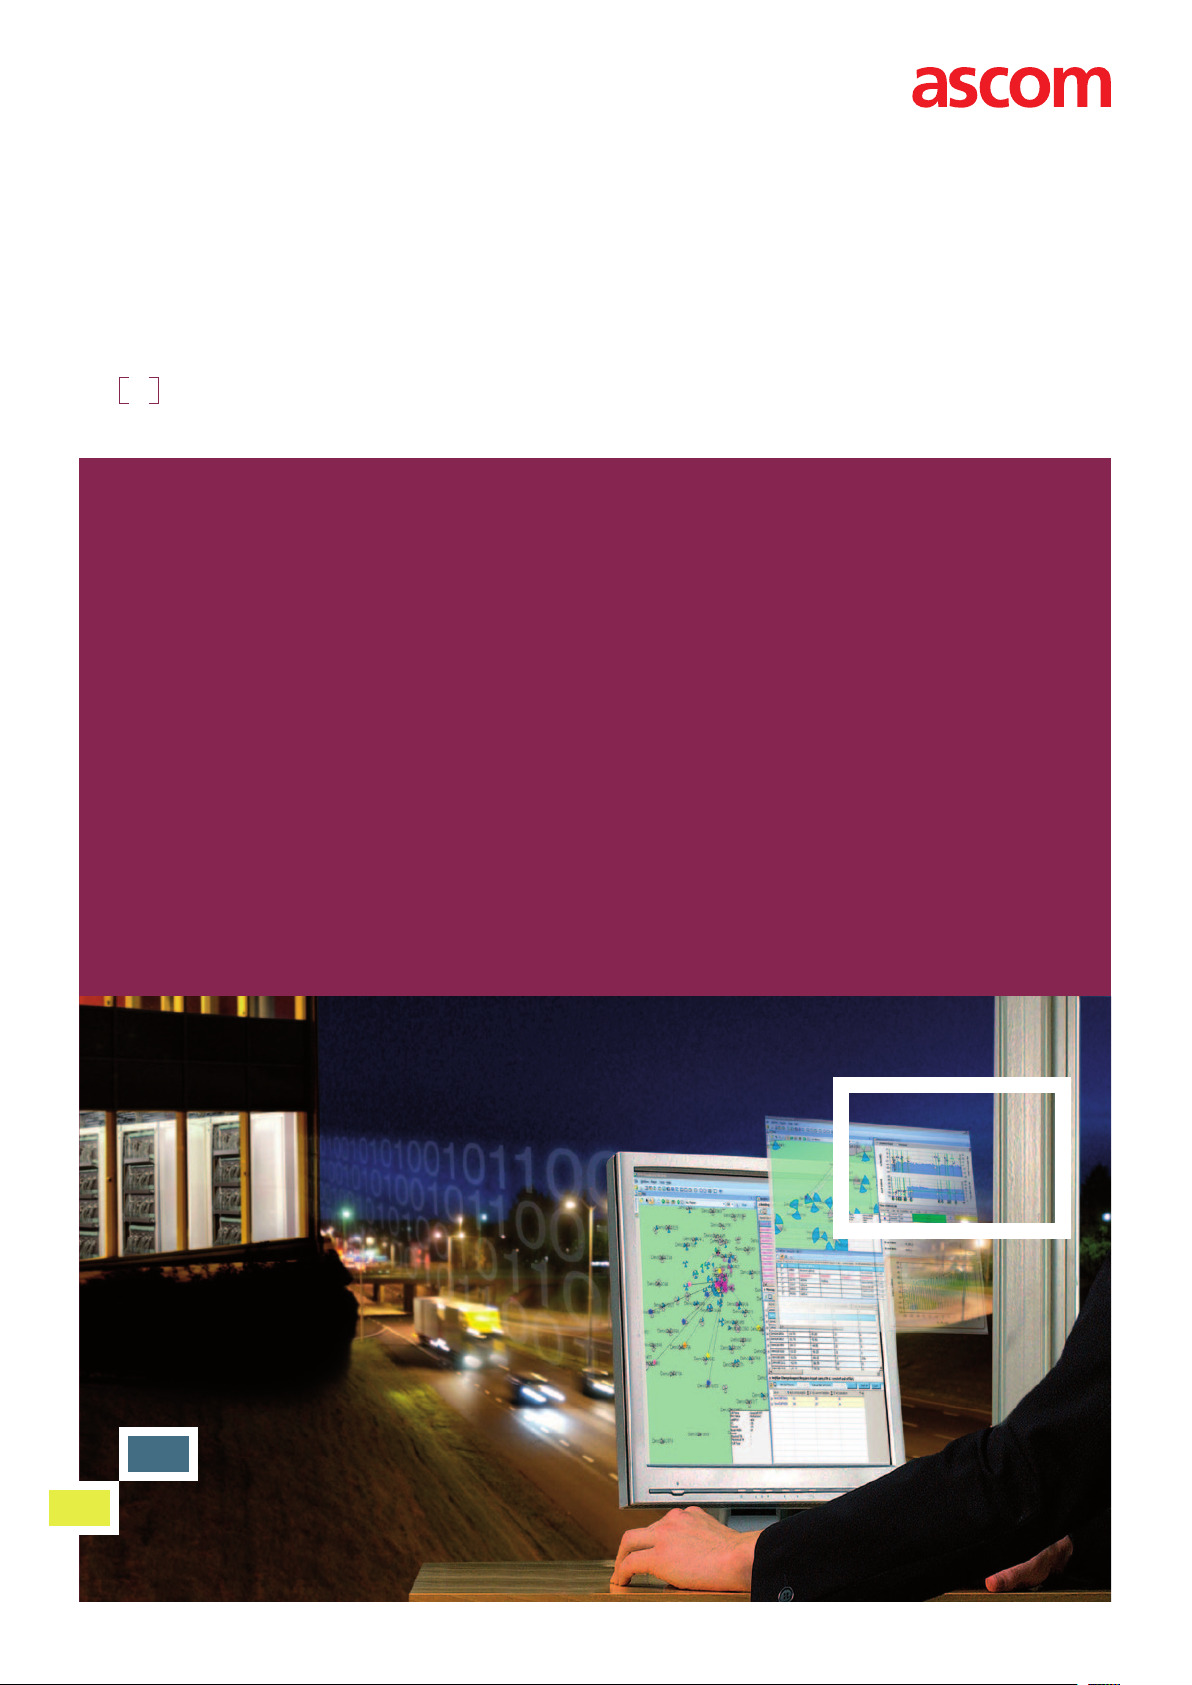
SEE YOUR NETWORK IN A WHOLE NEW WAY
TEMS Visualization Professional is
revolutionizing the way network
operators troubleshoot their
networks, enabling them to find
problems that were impossible to
pinpoint before.
TEMS Visualization Professional
provides this ability by analyzing
event-based data generated by the
infrastructure.
The optimization gap
TEMS Visualization Professional processes event-based data, analyzing
and organizing it so that it can be used for network optimization. Operators
have easy access to comprehensive information based on measurement
results and call events, all the way down to the individual call level. This
information can be used for troubleshooting, monitoring, and verifying net-
work functionality.
This ability to look at real individual call data from the infrastructure
side bridges the gap between ordinary Performance Management systems
and traditional drive testing. While Performance Management tools provide
powerful statistical and trending functionality, and drive test tools capture
a specific slice of the network in great detail, TEMS Visualization Professional
gives a closer look at every call from every mobile in the network.
TEMS Visualization Professional is designed to be installed and run on
a single machine. The TEMS Visualization Enterprise solution is also available.
This utilizes dedicated servers for the data processing with many clients
able to connect to the centralized data storage.
Benefits
▪ Trap, track, and eradicate problems based on sequences and specific phone
models.
▪ Understand network problems by viewing the full details of calls made in
the network – all calls, all phones.
▪ Drill down into subscriber issues easily using powerful filtering capabilities
and fast browsing functions.
Key features
▪ Processing of event-based data from both WCDMA and GSM networks
▪ Display of full details for all calls on networks with Ericsson infrastructure
▪ Easy optimization of today’s very complex networks with built-in
optimization functionality
▪ Direct import of network configuration data from OSS-RC through CNAI
and BulkCM
▪ IRAT Call Tracing using UETR and MTR
▪ Automated task management
Page 3

TEMS™ VISUALIZATION 7.2 PROFESSIONAL
3
Call Event Analyzer
The Call Event Analyzer makes every call within the recorded cell set
available for detailed analysis. It allows the operator to see the major events
associated with a particular call in a history view. Using powerful filtering
and sorting functions, it displays the flow of handovers as either an event
list or plotted on a map. Calls with abnormal events (dropped, blocked,
handover failure, etc.) are easily identified.
TEMS Visualization Professional works with data gat hered by the
Ericsson OSS-RC. Supported formats are GPEH and UETR for WCDMA net-
works , and R-PMO, MTR, and CTR for GSM. TEMS Visualization Professional
is compatible with the newest enh ancements a dded on the event side
for both technologies. TEMS Visualizatio n Professional follows calls over
BSC borders, allowing the user to anal yze Intra-BSC handovers and follow
all calls mad e in the recording area. It is now also possib le to trace calls
between WCDMA and GSM.
By using TEMS Visualization, operators can do the following, and much
more:
▪ Optimize daily worst cells.
▪ Validate channel allocation (e.g. AMR, overlaid/underlaid optimization).
▪ Filter out calls originating from a selected cell and follow the movement
of each call.
▪ Find the location of dropped calls by following the progression of
serving cells.
▪ Optimize WCDMA neighbor plans.
▪ Identify problems where only one link suffered from poor quality
(uplink and downlink measurement data are available in the tool).
▪ Determine poorly performing mobiles or mobile types.
▪ Analyze problems dependent on response time using the time
difference histogram feature.
In addition, it is easy for the operator to follow the events, radio
environment, and graphical presentation of the serving cell for every call.
This helps operators identify the real reasons for dropped calls, understand
traffic patterns, find missing neighbors, identify ping-pong handover areas,
and perform a host of other optimization activities.
For WCDMA, it is also possible to keep track of the signaling between
the mobile and the core network. Selected information elements are de-
coded such as the cause value for any location or routing area update reject.
Page 4

4 TEMS™ VISUALIZATION 7.2 PROFESSIONAL
Exception Analysis
The Exception Analysis view gives a summary of all messages and
TEMS Visualization Professional-generated events that occurred during all
the calls in the database. Any exceptional events can quickly be sent to the
Call List for investigation in more detail.
Measurement Result Viewer
The Measurement Result Viewer allows the user to see the common
radio measurements for a call in a set of XY line graphs. All call events
(originations, handovers, drops, terminations) will be shown with vertical
lines upon the XY graphs, with associated event symbols.
Time Difference Histogram
The Time Difference Histogram feature makes it possible to analyze
any problem related to network response time. The user can analyze the
time difference between any two messages or any two events in the data-
base. The results are displayed as cdf and pdf graphs.
Phone List
For WCDMA, statistics are provided per IMSI. This allows individual
customers that are having service problems to be identified. For both GSM
and WCDMA, statistics are provided per IMEI TAC. This allows poorly
performing mobile types to be identified.
The Call Event Analyzer shows detailed call
information.
Page 5

WCDMA SUPPORT
5TEMS™ VISUALIZATION 7.2 PROFESSIONAL
Radio performance charts
Measurements of signal strength, quality, and power in uplink and
downlink can be displayed in distribution and scatter charts for detailed
investigation of radio performance.
Neighbor Optimization
The Neighbor Optimization feature allows the operator to simultane-
ously look at missing neighbors as reported by actual users as well as sta-
tistics on usage of existing neighbors in order to optimize neighbor rela-
tions. This is linked to the map view for easy analysis. Changes can be made
and saved to a BulkCM format file for import into the OSS-RC.
Pilot Pollution Detector
The Pilot Pollution Detector identifies cells suffering from Pilot Pollution.
The operator can then drill down for a detailed analysis of possible polluting
cells. The Pilot Pollution information is displayed as a detailed list, as well as
graphically on the map. Knowing the location and cause of pollution allows
operators to move quickly from identifying the problem to solving it.
Resource monitors
The Resource monitors allow the usage of resources to be analyzed.
Quantities such as power, channel elements, ASEs, and more can be plotted
in time or distribution graphs.
Neighbor Optimization view.
Page 6

6 TEMS™ VISUALIZATION 7.2 PROFESSIONAL
GSM SUPPORT
IRAT Analysis
The IRAT Analysis feature brings together information
from the different GPEH events related to IRAT for further
analysis. Each occurrence of IRAT activity can be followed
all the way from the initial measurements on GSM until its
conclusion.
Cell Timeslot Monitor
The Cell Timeslot Monitor allows the operator to view
all the timeslots of all the channels allocated to a cell/sector
in a pictorial view.
▪ Users can browse through each state (change in the slot
usage for any channel) for the selected cell and monitor
the content of each event; for example, signal strength
of UE.
▪ Each TRU has a frame that will show each timeslot color
coded and by use (AMR, HR, FR, EFR, etc.).
Among many other benefits, this allows the operator to
▪ Dynamically show what actually happened when FR
channels started to load the cell and dynamic HR
adaptation stepped in.
▪ Provide input for multi-band cell optimization
(LOL-TAOL-DTCB-SCLD).
The Cell Timeslot Monitor also includes a load factor,
which makes it easy to identify when the cell had a heavy
load. This is very useful when analyzing the channel alloca-
tion algorithms. The Cell Timeslot Monitor also captures
statistics for dropped calls and handover failures on both
the TRU and the timeslot level. This can be used to easily
find hardware that is not working properly.
Estimated positioning
It is possible to display estimated positions of mea-
surement results and TEMS Visualization Professional
events. This information can be used to identify where cells
are covering too far and also gaps in WCDMA coverage
(from positioning of incoming intersystem handover events).
Binned maps
When estimated positions have been calculated, one
or more databases can be loaded into the tool and binned
maps created. These present not predictions but rather the
actual conditions as experienced by the live traffic in the
network. Binned maps can be created for signal strength,
interference, speech quality, traffic density, and TCH dropped
calls. A typical use case would be using the traffic density
maps to determine the advisability of investing in a new
site in areas of poor signal strength.
Faulty equipment analysis
Statistics are given per cell for non-air interface-related
dropped calls (i.e. dropped calls due to transmission problems
can be immediately identified and dispatched to the correct
department). Performance statistics are also given down to
TX and RX level and then graphs of radio performance per TX
or RX can be presented for more detailed analysis.
Tracing module
Tracing for both GSM and WCDMA using MTR and UETR
makes it possible to analyze calls in both WCDMA and GSM
in the same database, a feature unique to TEMS Visualization
Professional. Also, for GSM the CTR format from the OSS-RC
is now supported. Calls passing through a specific cell (up
to 16 at a time) can be recorded and the resulting CTR file
analyzed, making it possible to investigate the performance
for a single cell in great detail.
Task Manager
Handling of OSS data is automated to improve effi-
ciency when working with TEMS Visualization Professional.
Tasks include connection to different OSS or other FTP serv-
ers, downloading of OSS data such as recordings and con-
figuration files, parsing of data into databases and cell files,
archiving of old records for ease of use and storage, sched-
uling of all these tasks to automate the otherwise manual
work, cleanup of old file download history and error mes-
sages, and deletion or saving of old data.
Page 7

Reports
Cell performance reports for both GSM and WCDMA provide a wide
array of useful information, and reports are available for antenna and
speech quality measurements in GSM. Summary reports for both GSM and
WCDMA present key performance indicators for entire databases.
7TEMS™ VISUALIZATION 7.2 PROFESSIONAL
Configuration data handling
Special import features make it possible to create a cell file directly from
an OSS export file. Both CNAI and BulkCM formats are supported. The Import
Wizard also enables filtering and can import multiple files at the same time.
User interface
The user interface in TEMS Visualization Professional is based on the
latest UI features such as auto-hiding of windows. The functionality in the
windows also has the look and feel of the industry-leading air-interface test
tool, TEMS™ Investigation.
Map views
The map view features call trace functionality. This allows the operator
to view the actual flow of each call, giving a visual representation of how a
particular end-user has been moving in the network.
State engine
TEMS Visualization Professional contains a highly sophisticated state
engine. The unique intelligence the state engine contributes to the tool
provides easier analysis of the most complex problems.
Page 8

www.ascom.com/tems
NETWORK REQUIREMENTS
GSM module
▪ Ericsson GRAN R12-G10B with RTED (Real-Time Event Data) feature
▪ Ericsson OSS-RC with R-PMO feature
WCDMA module
▪ Ericsson WRAN P5-W10B with GPEH feature
▪ Ericsson OSS-RC with GPEH feature
Tracing module
▪ Ericsson WRAN, UETR P5-W10B
▪ Ericsson GRAN, MTR R12-G10B
▪ Ericsson GRAN, CTR 06A-G10B
A revolutionary solution
TEMS Visualization Professional is ideal both for finding network
problems on a cell-by-cell basis and for regional optimization. It also allows
individual areas with poor performance to be identified, even in the midst
of cells where performance is generally very good. TEMS Visualization
Professional gives operators the network information they need.
Ascom Network Testing Inc.
1943 Isaac Newton Square
Reston | VA | 20190-5006 | USA
www.ascom.com/tems
For more information, visit TEMS on the web at www.ascom.com/tems.
10.2010 © Ascom 2010. All rights reserved. TEMS is a trademark of Ascom. All other trademarks are the property of their respective holders. | DSH-8909-0003 Rev A Uen | Photo: Fotograf Paulina and Fotograf Mijac AB
 Loading...