

Page 1

PRODUCT SHEET
Product: QVOICE PRESENTATION
A client-server based post-processing
system with an open database which
stores and presents measurement data.
QVOICE PRESENTATION
TURNING DATA INTO INFORMATION
QVoice Presentation (QVP) is a multi-func-
tional post-processing system that stream
lines analysis and reporting generating tasks.
Management reports bring visual meaning to
KPIs while technical reports, graphs and charts
provide the foundation to network performance
understanding for the benchmarking and opti
mization departments.
All QVoice data collection systems share a
common data file format:
n
QVoice Symphony
n
QVoice Companion
n
QVoice Smart
Accordingly it is convenient to compile
measurement data collected from many differ
ent locations, at different times and even for
different purposes for integrated and compre
hensive reports.
Inter-departmental Benefits
-
All departments can benefit from the large quantities of collected mea
surement data and analyzed information. The data available in QVoice files can
become a precious asset for conducting engineering analysis. By using the same
QVoice equipment sharing the expense to generate data between departments
becomes a highly cost effective reality.
-
-
-
A few users who benefit from QVP data analysis include:
n
Network Senior Management and Directors
n
Service Management
n
Project Teams
n
Optimization Teams
n
Maintenance Teams
n
Corporate Teams
n
Marketing Teams
... and more !
QVP In-depth
QVP is programmed with practical and highly functional features including
a library of frequently used reports and SQL query generators that allow users
to extract stored data in the form they define. Measurement files are compiled
and selected parameters outputted in accurate and comprehensive, yet easy to
interpret statistical charts and graphically legend maps – each with time refer
ence, invaluable in troubleshooting and network tuning.
-
-
Page 2

PRODUCT SHEET: QVOICE PRESENTATION
2
QVP screen presentations are user controlled and catalogued into two
groups: QoS data views that depict the network as experienced by sub-
scribers and the engineering views used by technical support personnel. In
addition to the office client-server version, where in-depth examination is
carried out, QVP is available on QVoice Companion, laptop PC running QVoice
software, for on-the-spot real-time field observations.
An ‘Expert option’ can automatically analyze circuit and packet-
switched services, pin-pointing problems and offering possible causes,
shortening the time needed for engineers to improve your network.
Sample windows QVP Network Analyzer
Structured in five logical elements which users can easily switch be
tween:
QVP Network Analyzer
is invaluable for effectively examining measurement in order to quickly
identify the cause of network problems. Consisting of a family of over sixteen
tools, each is specialized for in-depth network analysis.
n
A Message Explorer provides a look at decoded Layer 1, 2, 3 and
application trace data
n
A Live Overview window shows actual trace values such as
Network Type and Channel
n
A Line Chart display allows users to compare the chronological
sequence of any number of measurement parameters
n
Different specialized displays exist for WCDMA, CDMA Layer 1
values for an immediate and high quality overview of actual radio
condition
n
There are displays for scanner measurements for all technolo-
gies including CDMA, GSM, and WCDMA. They are automatically
synchronised with the trace from the mobile equipment.
Synchronisation to other QVP application e.g. QVP Map enables you
to know not only why a problem occurred but also where.
-
Page 3
PRODUCT SHEET: QVOICE PRESENTATION
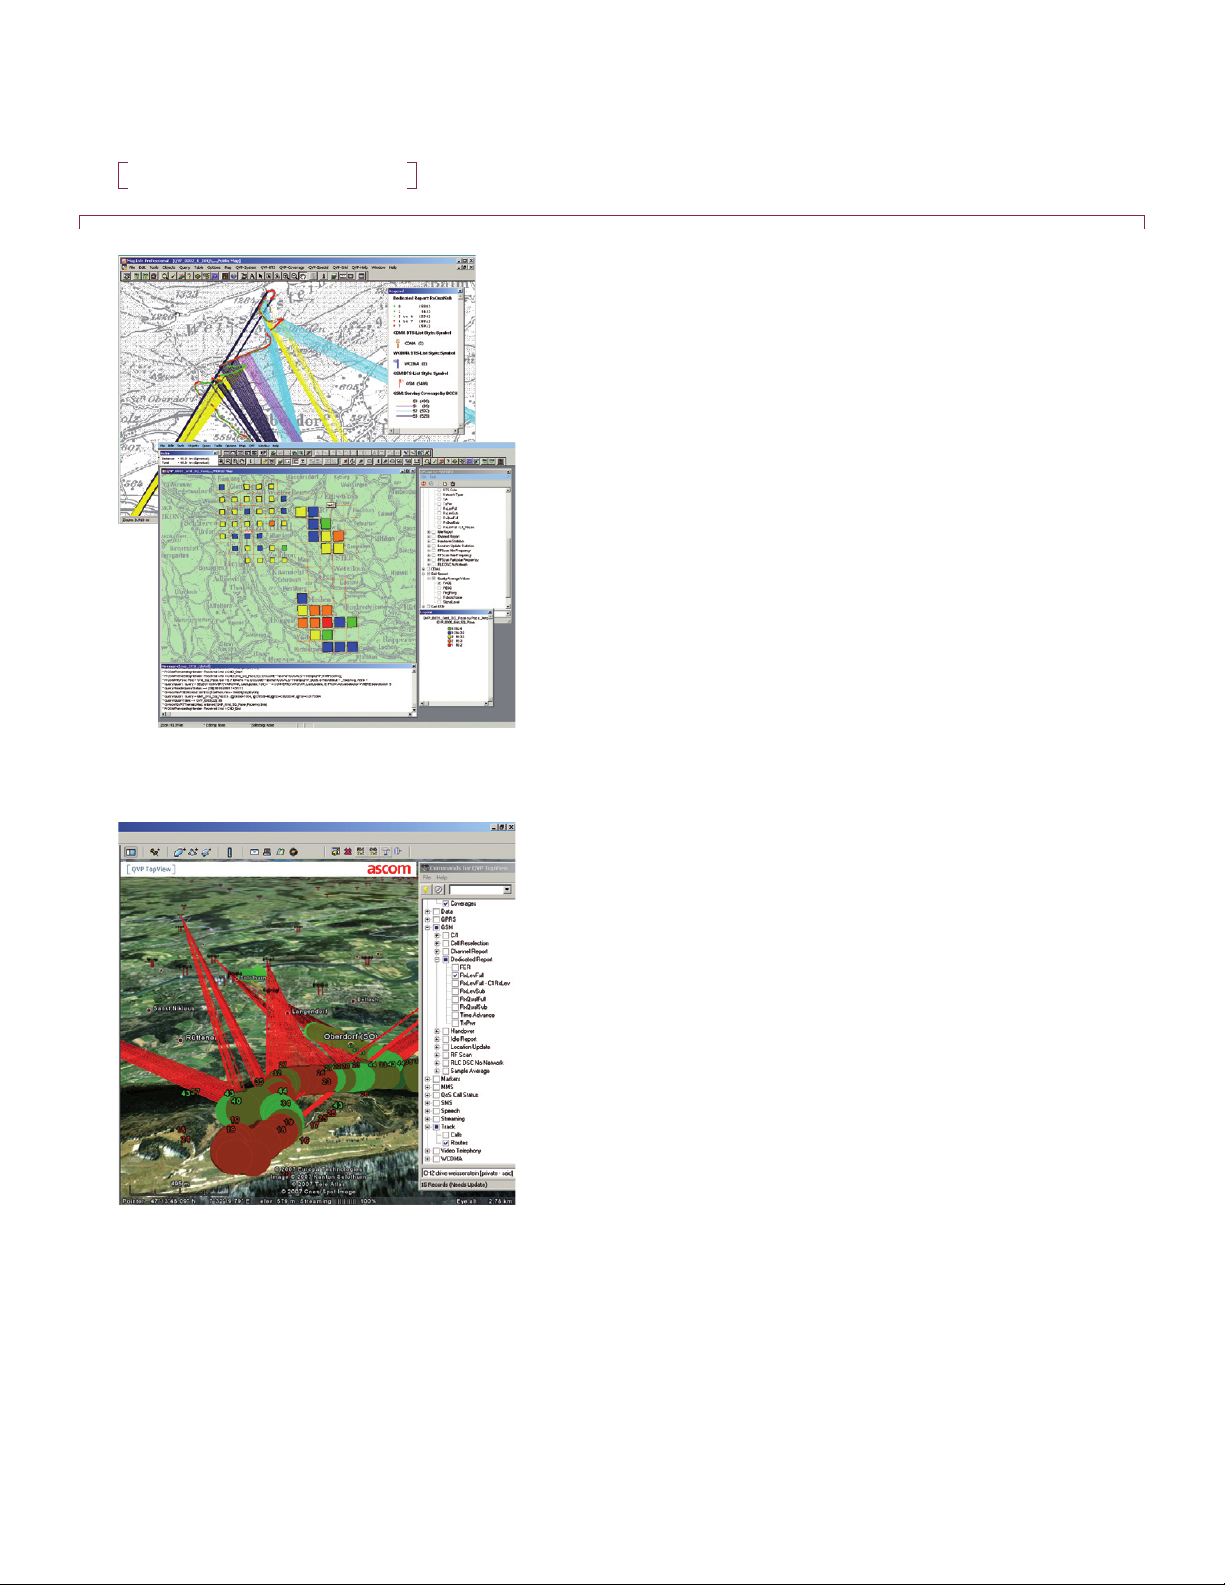
Sample windows QVP Map
QVP Map
is a mapping application that makes possible the visualization of
measurement points in relation to geographic positions and landmarks.
Improving services on a spatial basis, QVP Map not only shows why a prob
lem occurred but also where.
Measurement points illustrate values as symbols along the measure-
ment route or as statistics in the region.
Cells/Coverage/Neighbourhood displays base station locations,
properties and helpful connecting lines between the serving cell and point
of measurement. BTS are automatically marked that have the same radio
channel as the radio channel used during the measurement connection.
Visualisation makes Interference detection easier.
Grid represents measured values in geographic ‘bins’ as mean values
or statistical spread or in relation to other mobile networks, ideal for ‘Best
in Class’ appraisal.
QVP Map uses MapInfo Professional and enhances its functionality
with unique QVP features and functions making it a practical application
with massive spatial analysis power making relationships between mea
surements and locations more perceptible.
3
-
-
Sample windows QVP Topview
QVP TopView
based on Google Earth – the leading 3D visualization application. It
is fully integrated in the QVP environment and enables users to observe
measurements on 3D maps. Automatic reply allows you to ‘drive’ through
the region, seeing exactly what was happening in real time. Handling and
usage has the same touch and feel as with all QVP applications. Top fea
tures include:
n
3D maps from all over the world can be directly updated over the
Internet
n
Same functions and results as in QVP Map
n
Fully integrated in QVP: FDS, CMD for data selection
n
Display your Cell list
n
Draw Coverage – connect measurement points with its serving
Cell
n
Replay functionality
-
Page 4
PRODUCT SHEET: QVOICE PRESENTATION
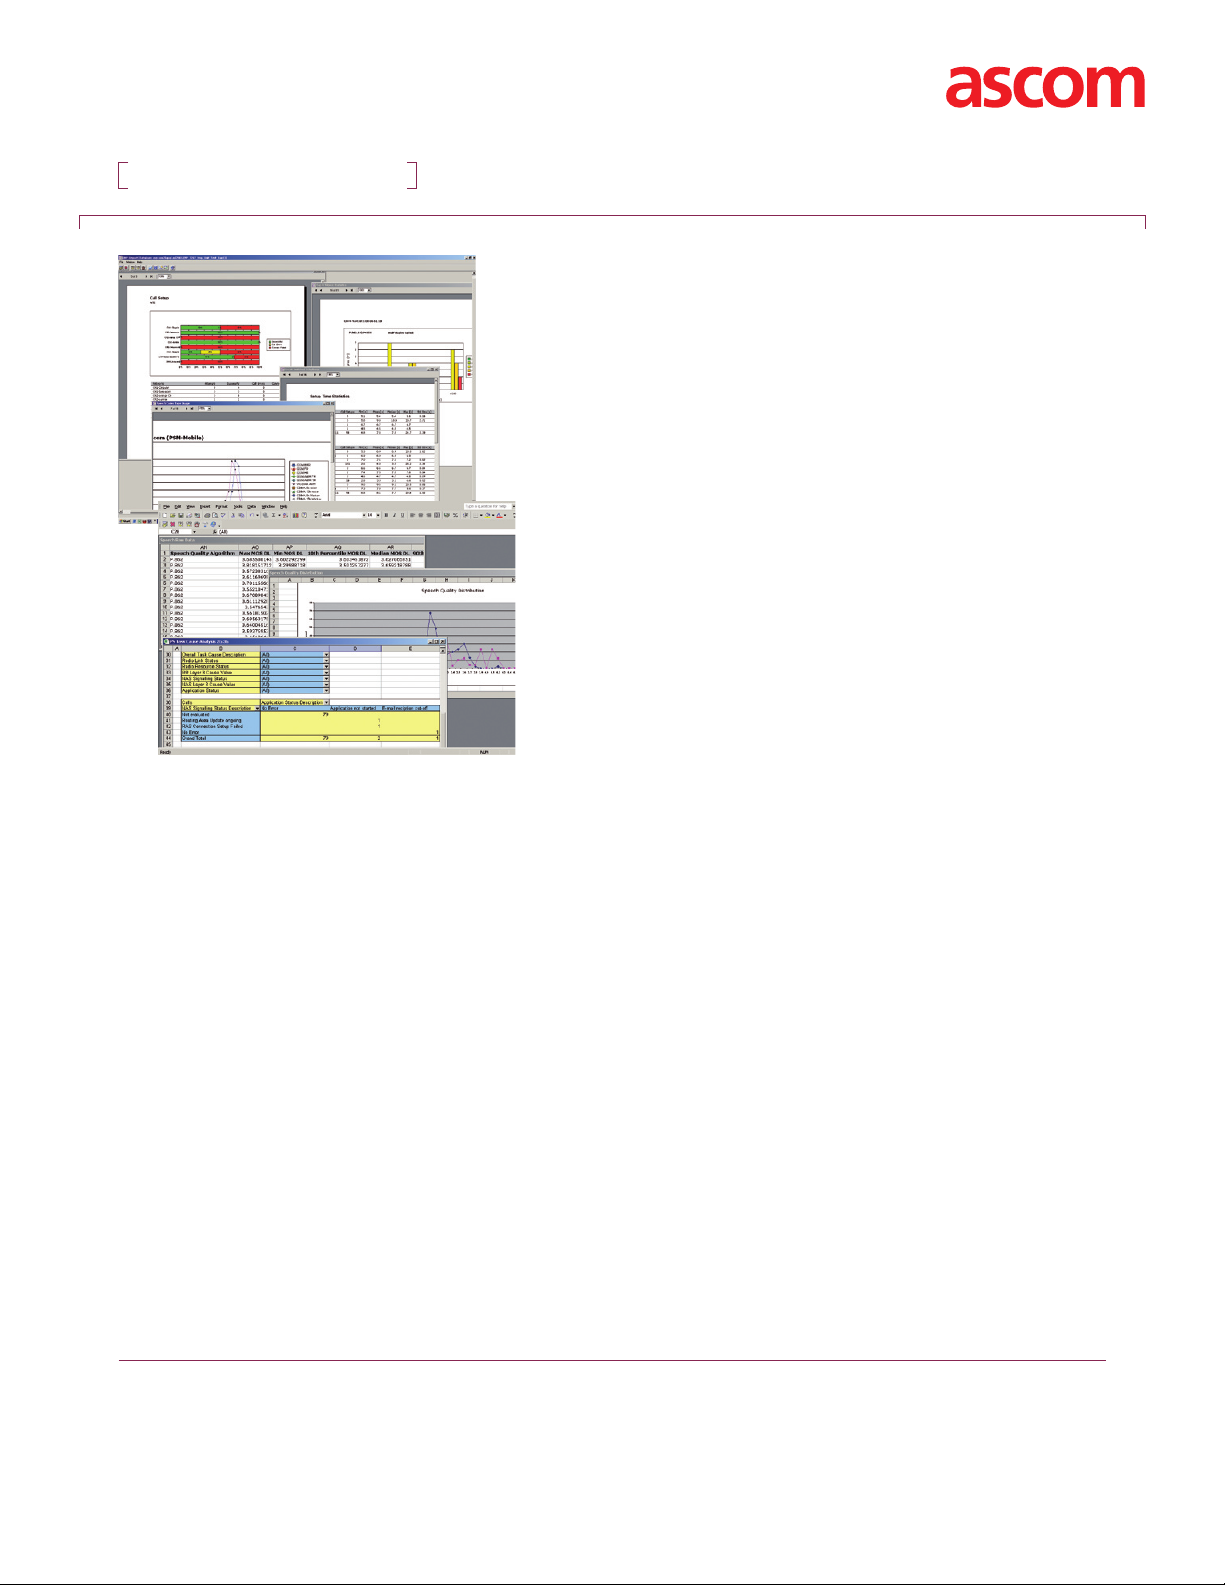
Sample windows QVP Report / Report for Excel
QVP Report
provides a library of out-of-the-box reports spanning a wide range
of technology applications and services. Reports can be modified and self-
made forms added. KPI, benchmarking reports and statistics charts all
evolve into intelligence mangers can act upon.
QVP Report for Excel
lets operator’s export managed or raw data into their own Excel work-
book for further analysis and reporting.
QVP Expert Systems
are the latest innovations in QVoice post-processing architecture.
They autonomously analyze faulty speech, video telephony and data con
nections, turning out details on possible causes of network problems and
failures. Such diagnostics provide the starting point for more in-depth
analyses, thus generating enormous time savings and relieving specialists
from the burden of time-consuming searches and analysis.
-
Ascom reserves the right to change specifications without notice. Ascom acknowledges all registered trademarks appearing herein.
Ascom Network Testing AG
Glutz-Blotzheim-Strasse 3
CH-4503 Solothurn | Switzerland
T + 41 32 624 21 21
F + 41 32 624 21 43
www.ascom.com
Ascom Network Testing Inc.
25541 Commercentre Drive, Suite 100
Lake Forest | CA 92630 | USA
T +1.949.614.8700
F +1.949.598.3693
Ascom Network Testing Ltd
Oak House, Shackleford Road
Elstead | Surrey GU8 6LB | UK
T +44 1252 705 705
F +44 1252 705 706
11.2009 © Ascom Network Testing Inc. | qvoice-presentation_product-sheet_letter_v13
 Loading...