

Page 1

AirWave 8.2.4.1
and Clarity Beta
User Guide
Page 2

Copyright Information
© Copyright 2017 Hewlett Packard Enterprise Development LP
Open Source Code
This product includes code licensed under the GNU General Public License, the GNU Lesser General Public
License, and/or certain other open source licenses. A complete machine-readablecopy of the source code
corresponding to such code is availableupon request. This offer is valid to anyone in receipt of this information
and shall expire three years following the date of the final distribution of this product version by HewlettPackard Enterprise Company. To obtain such source code, send a check or money order in the amount of US
$10.00 to:
Hewlett-Packard Enterprise Company
Attn: General Counsel
3000 Hanover Street
Palo Alto, CA 94304
USA
Please specify the product and version for which you are requesting source code.
You may also request a copy of this source code free of charge at: http://hpe.com/software/opensource.
Nove mber 2017 | Rev. 02 AirWave 8.2.4.1 and Clarity Beta | User Guide
Page 3

Contents
Initial Setup v
System Requirements v
Downloading the Source Code v
Installing the Clarity Engine vi
Provisioning the Clarity Engine vii
Network Configuration vii
AirWave Server Configuration x
NTP Server, Date, and TimeConfiguration xi
Time Zone Configuration xii
Post-Configuration Instructions xiii
Changing the Root Password xiii
Reconfiguring the Clarity Engine xiv
Upgrading the Clarity Engine xv
How to Update the RPM Package xv
Using Clarity xvi
Live Monitoring xvi
About the Clarity Live Charts, Graphs, and Tables xvi
Failures Rates xvi
Process Times xvi
First 25 Results xvii
Thresholds for Failures and Process Times xvii
User Details in Clarity xviii
Authentication Failure Data xix
DHCP Failure Data xix
DNS Failure Data xx
Sorting and Filtering Clarity Data xx
Selecting a Folder from the Navigation Bar xxi
Exporting Clarity Data xxi
Changing the Time Range xxi
Changing the Data Retention Interval xxii
Evaluating User Status xxii
Synthetic Testing xxiii
Adding the Clarity Engine xxiii
Viewing Clarity Engine Information and Graphs xxiv
Clarity Engine Information xxiv
Graphs xxv
How to Set Up Your Synthetic Test xxv
Selecting Your APs xxv
Using Clarity Synthetic to select your client and target APs xxvi
Using VisualRF to select your client AP xxvii
Adding Basic Information to Your Test xxvii
Setting Up and Running Your Tests xxviii
DNS Test xxviii
Ping Test xxviii
Page Load Test xxix
AirWave 8.2.4.1 and Clarity Beta | User Guide Contents | iii
Page 4

Traceroute Test xxx
iPerf3 Test xxx
How to View Test Results xxxi
Viewing Test Results in VisualRF xxxi
Viewing Your Test Results in Clarity xxxi
Status Icons in Clarity Synthetic xxxii
Debugging Issues xxxiii
Collecting Logs xxxiii
Debugging on the Host xxxiii
Example of a Heartbeat Message xxxiii
iv | Contents AirWave 8.2.4.1 and Clarity Beta | Use r Guide
Page 5
Chapter 3
Initial Setup
The Aruba Clarity Engine provides proactive analysis of end user quality of experience by monitoring critical
network services. This document describes how to install the Clarity Engine.
System Requirements
Listed below are the minimum hypervisor host system requirements for the Clarity Engine to run as a guest
virtual machine (VM) and the resources required for the VM to be functional:
l Quad-core Core i5 1.9 GHz processors with hyper threading enabled
l 8 GB RAM
l Minimum 2 physical network interface cards (NICs) on the ESXi host
Deploying the OVA template on the VM requires:
l 4 vCPU
l 4 GB RAM
l 128 GB Disk
.
TheClarity Engine OVA template cannot be installed on the samevirtual machine instance as AirWave. The
Clarity Engine needs its own virtual machine instance.
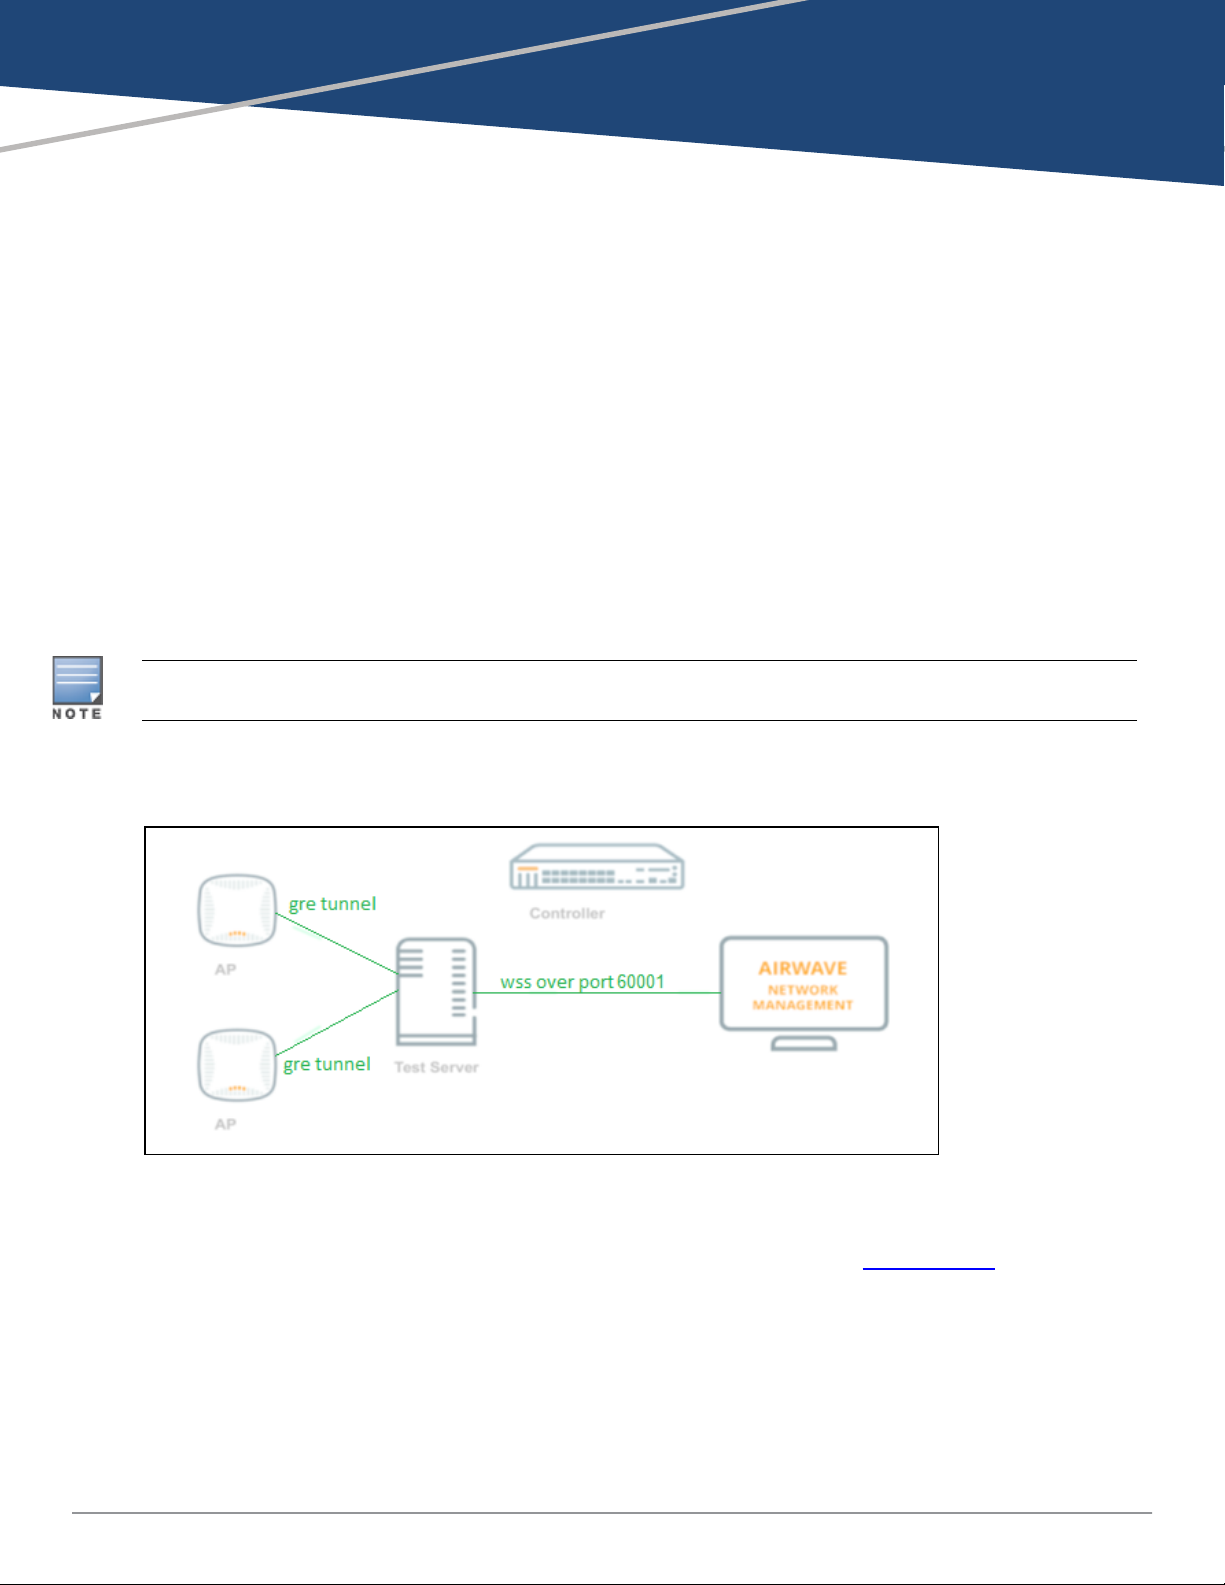
The following illustration shows the topology of the Clarity Engine in your network.
Figure 1: Clarity Engine Topology
Downloading the Source Code
To download the Clarity Engine source code, which is stored as a tar file, log in to Aruba Support and follow these
steps:
1. Go to the Download Software tab and select AirWave > AMP > 8.2.3 from the Navigator.
2. Click the Clarity Engine 1.0.0.0 source file link, as shown in Figure 2.
Figure 2: Downloading the Source
3. Once the file downloads to the Downloads folder, move it to a location that anyone can access.
AirWave 8.2.4.1 and Clarity Beta | User Guide Initial Setup | v
Page 6
Installing the Clarity Engine
You should install the Clarity Engine for AirWave deployment on VMware ESXi infrastructure using the Open
Virtual Format (OVF) template.
Copy the template to the client machine before importing the OVF template.
To install the Clarity Engine:
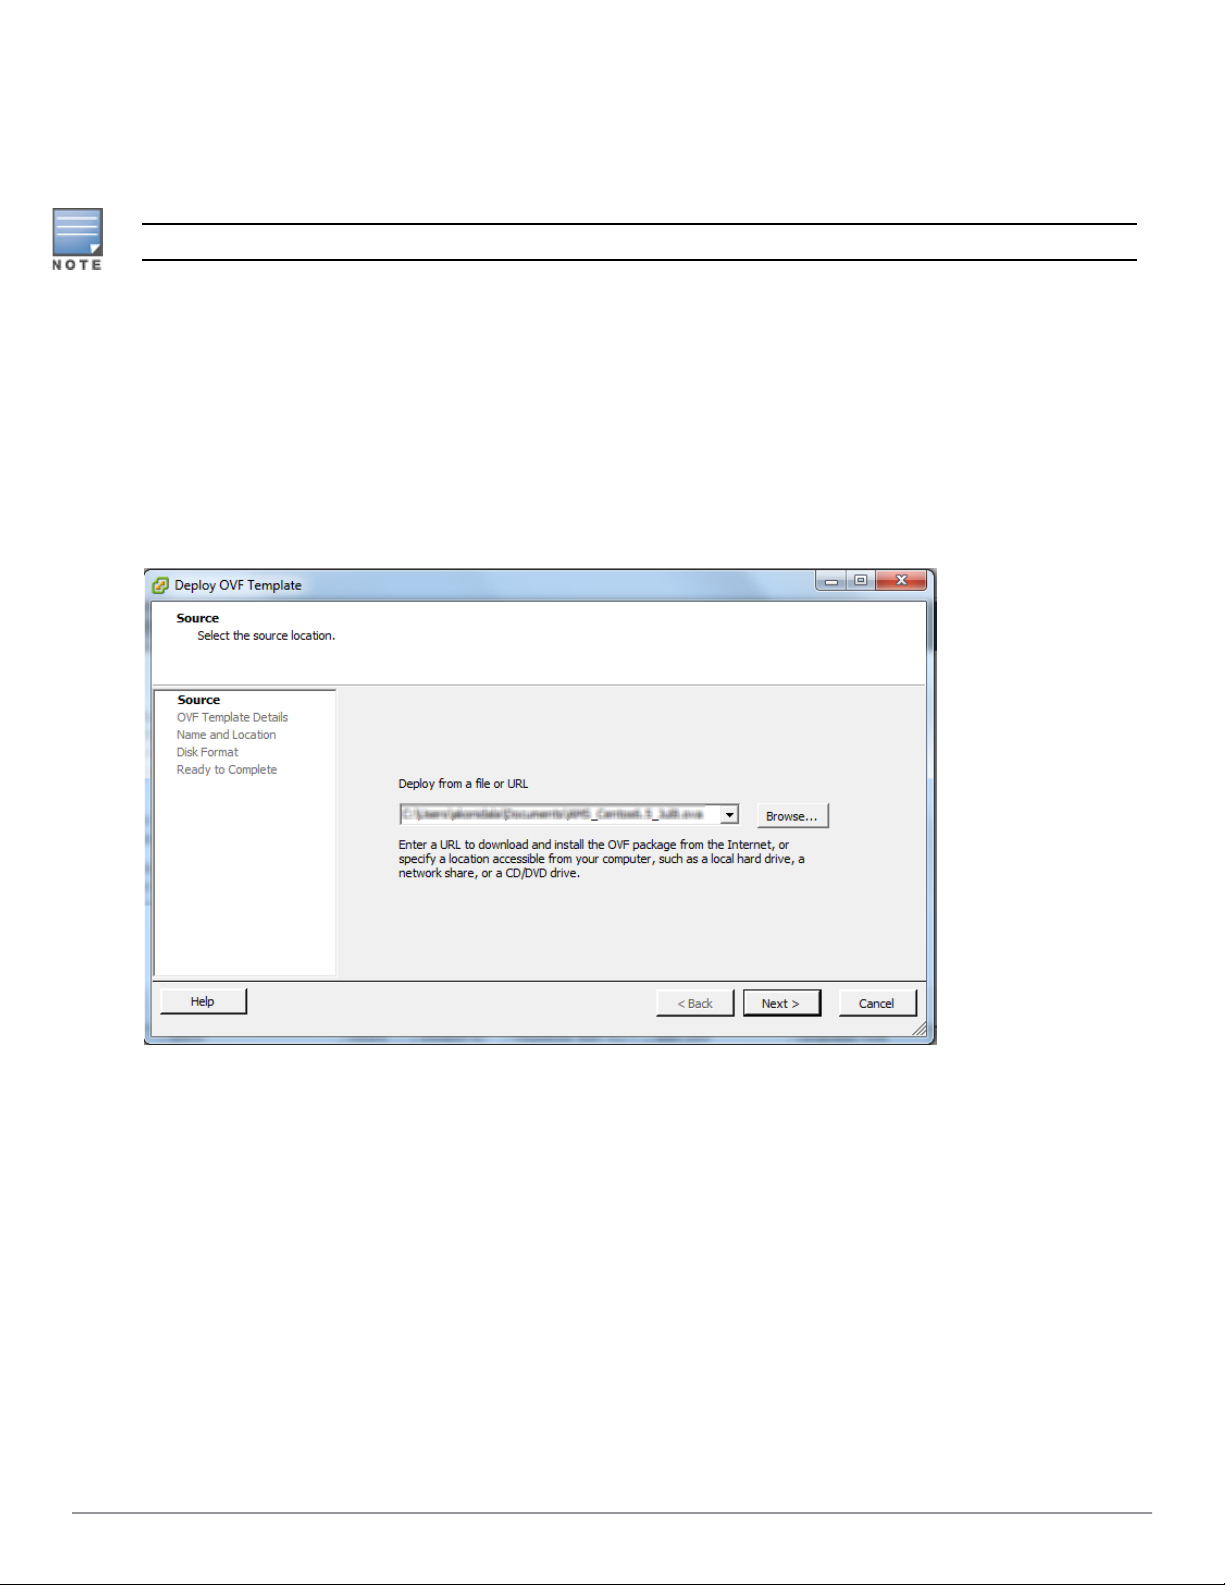
1. Log in to the vSphere ESXi Host using vSphere Client.
2. Click File > Deploy OVF Template. The Deploy OVF Template Wizard is displayed.
3. Click Browse to find the OVF file, then click Next. The OVF Template Details option in the left pane is
displayed.
4. Enter a name for the Clarity Engine, then click Next. This name should be distinguishable from the name of
the virtual host.
Figure 3: Naming the Clarity Engine
5. Review the End User License Agreement and click Accept (see Figure 4).
vi | Initial Setup AirWave 8.2.4.1 and Clarity Beta | User Guide
Page 7
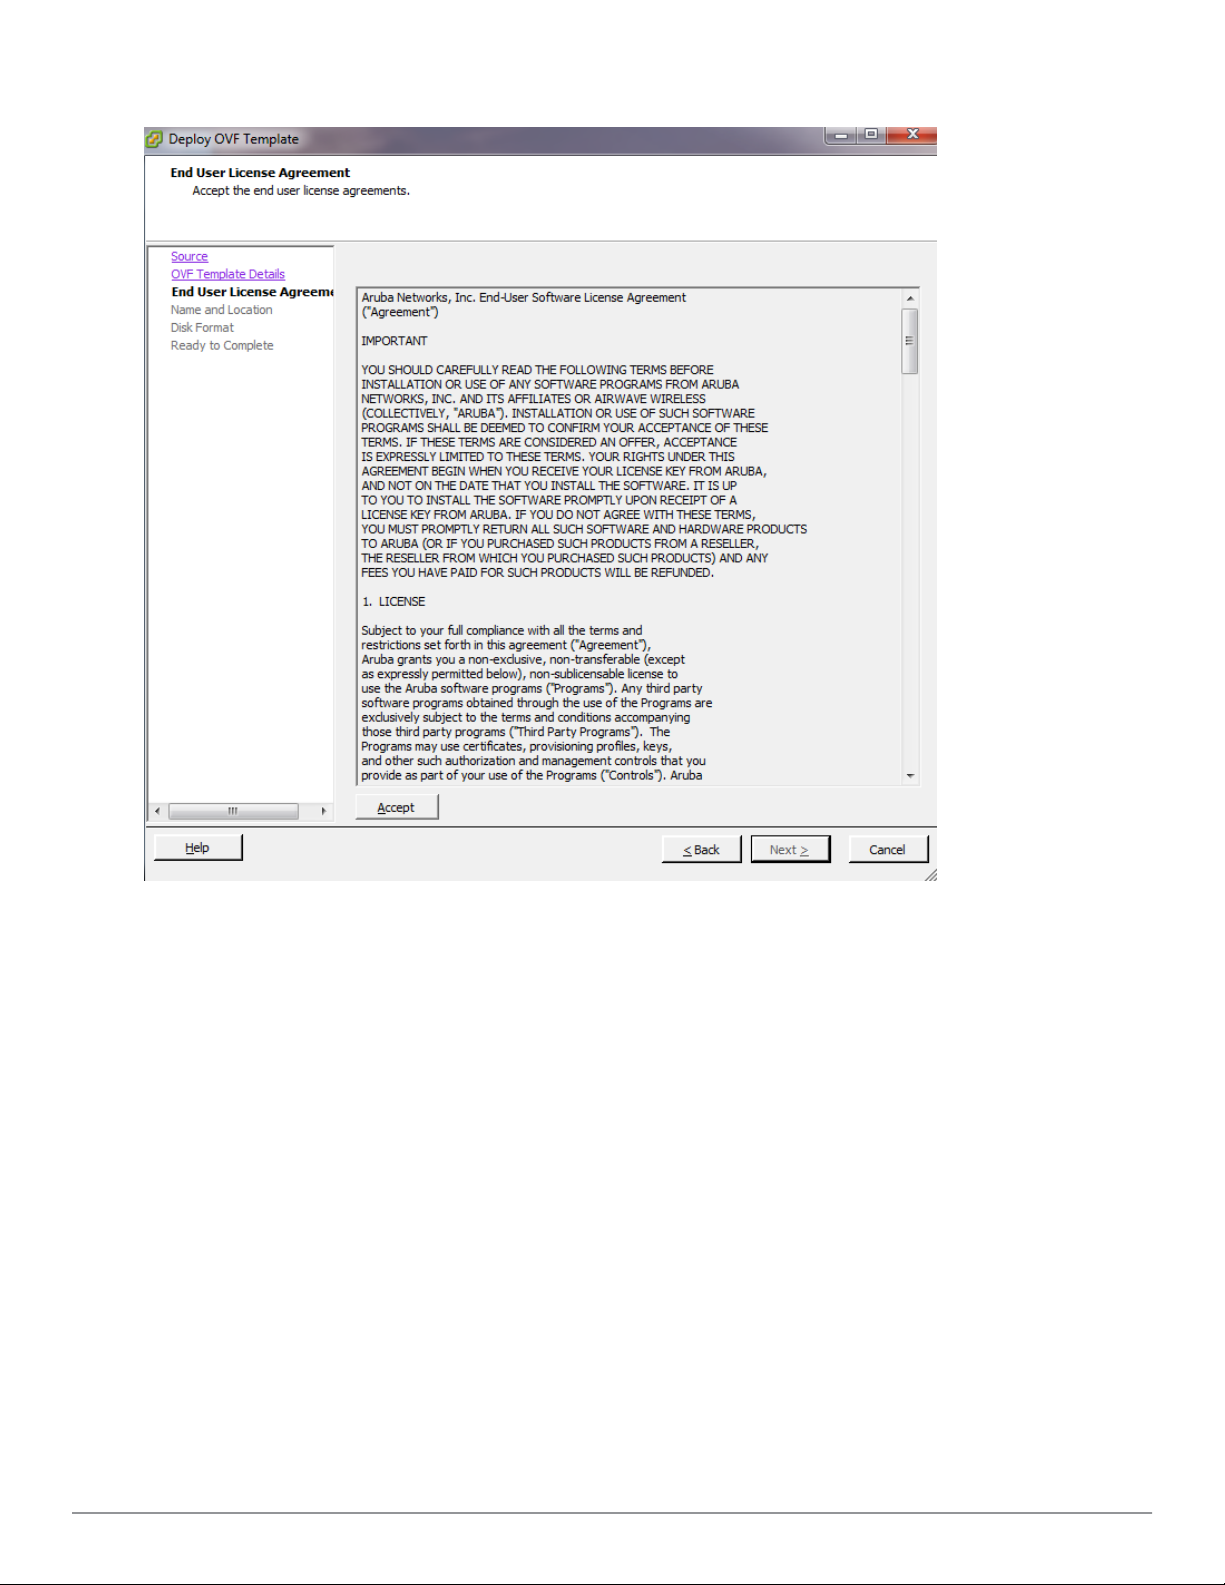
Figure 4: Accepting the End User License Agreement
6. Follow the onscreen instructions, then click Finish.
Provisioning the Clarity Engine
When Clarity Engine first boots, the initial setup window displays, where you can configure network, AirWave,
NTP-related, and time zone settings.
Network Configuration
Follow these steps to configure the ethernet interface and DNS servers.
1. Select Network configuration, as shown in Figure 5.
AirWave 8.2.4.1 and Clarity Beta | User Guide Initial Setup | vii
Page 8
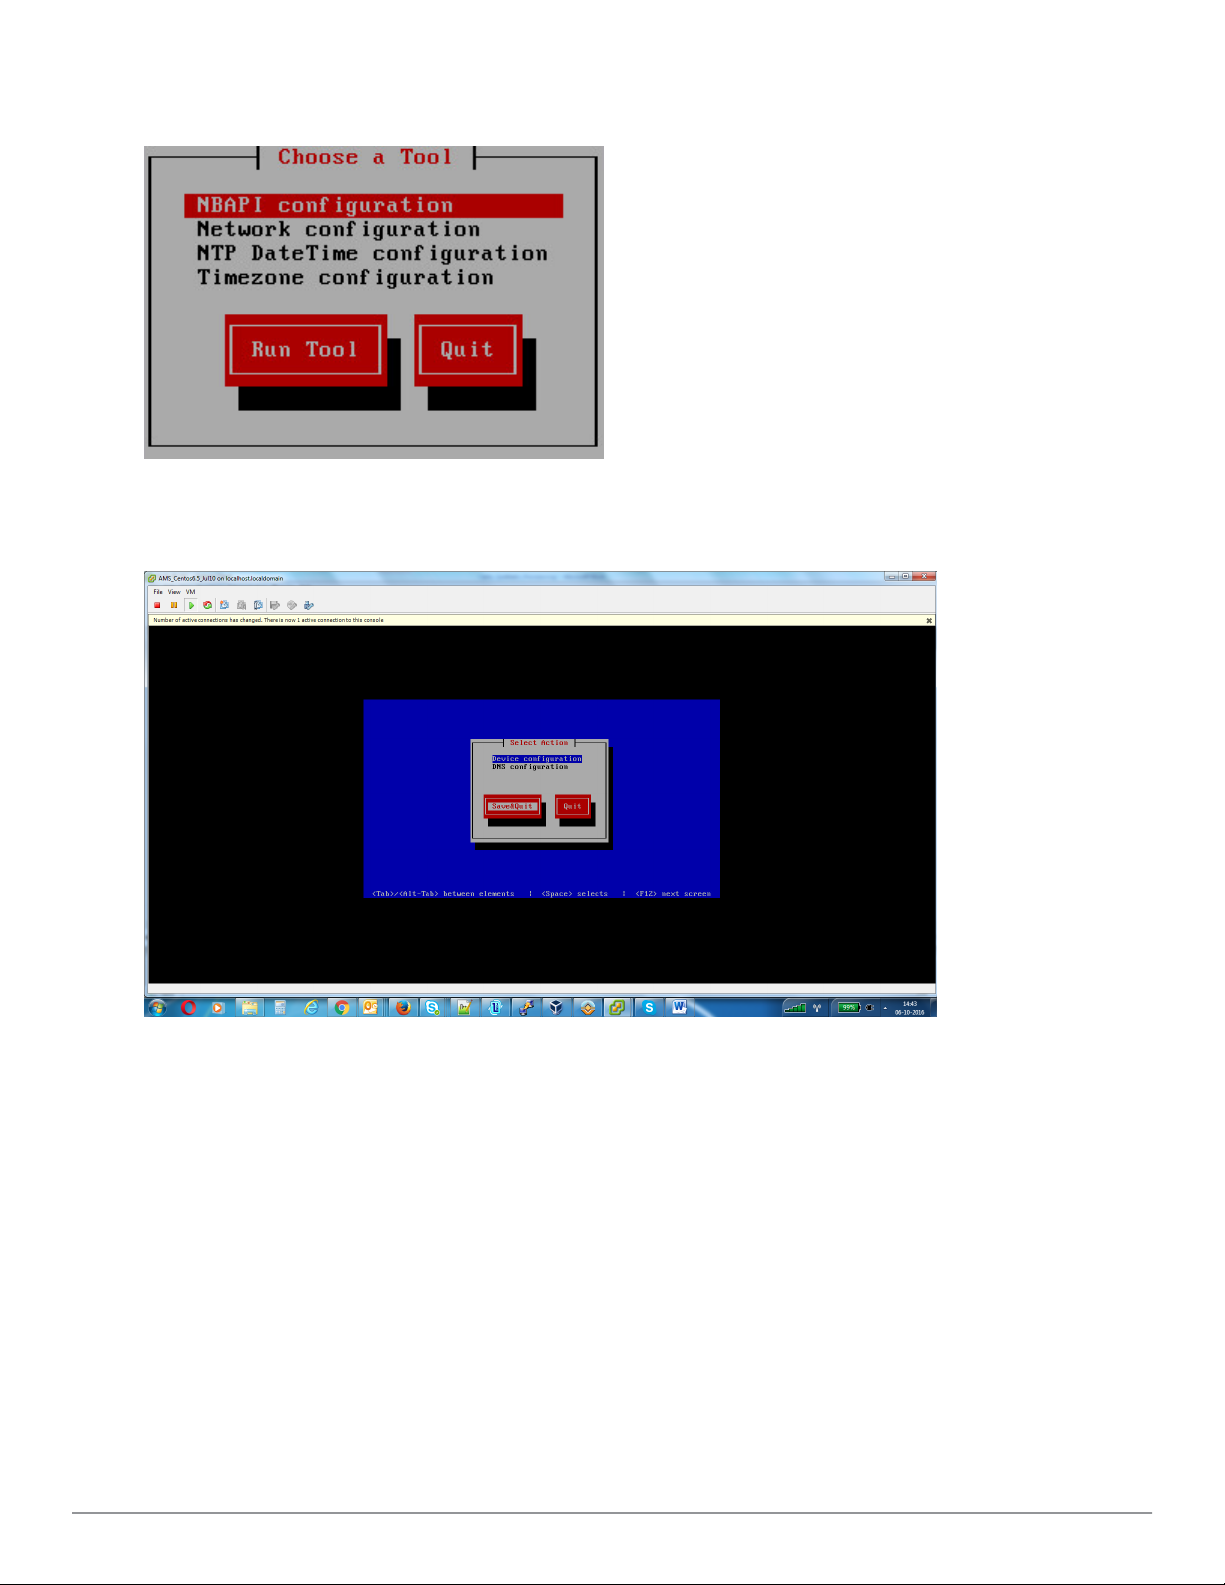
Figure 5: Opening the Network Configuration Tool
2. Select Device configuration, as shown in Figure 6.
Figure 6: Selecting Device Configuration
3. Select an active network interface. Depending on your local host configuration, you might see a different
vendor name than the example shown in Figure 7.
viii | Initial Setup AirWave 8.2.4.1 and Clarity Beta | User Guide
Page 9
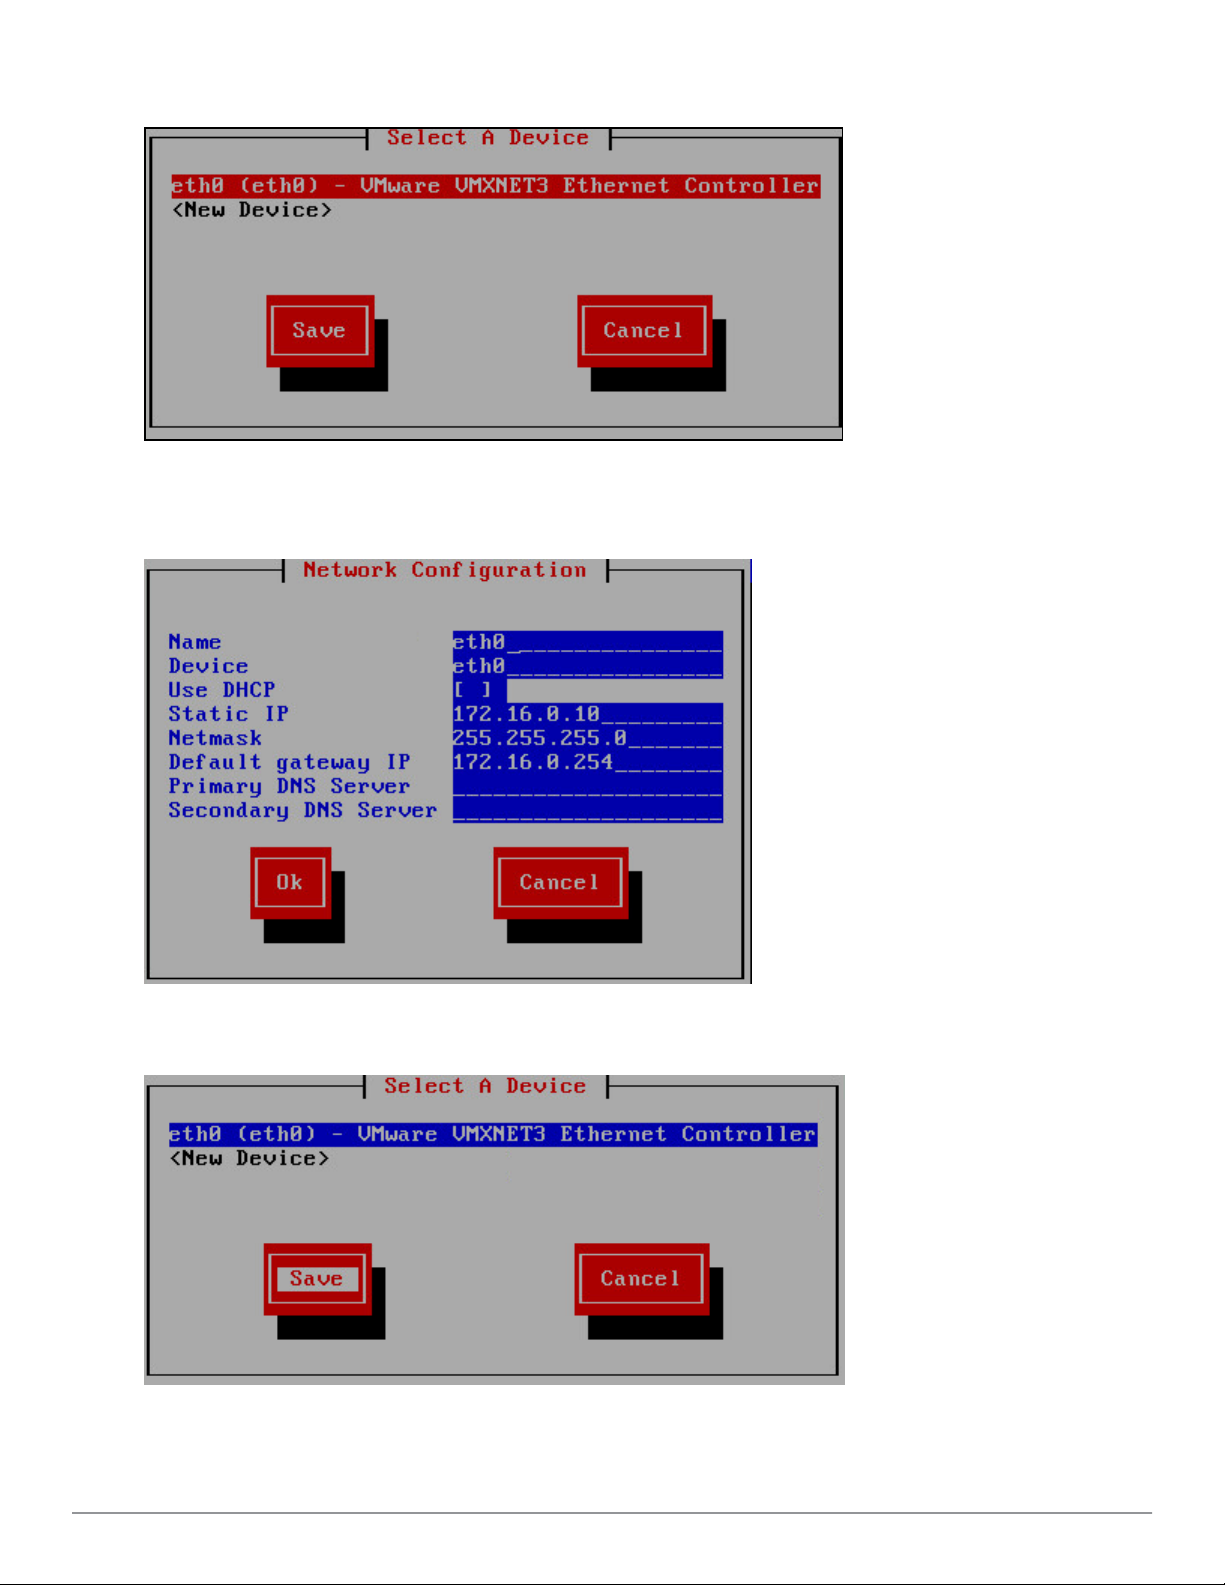
Figure 7: Selecting an Active Network Interface
4. Enter the static IP address, netmask, default gateway IP address, DNS servers, and click Ok. Figure 8 shows an
example for the eth0 interface .
Figure 8: Network Configuration
5. Click Save, as shown in Figure 9.
Figure 9: Saving the Network Configuration
6. Select DNS configuration.
7. Change the default hostname and the primary DNS server, then click Ok.
AirWave 8.2.4.1 and Clarity Beta | User Guide Initial Setup | ix
Page 10
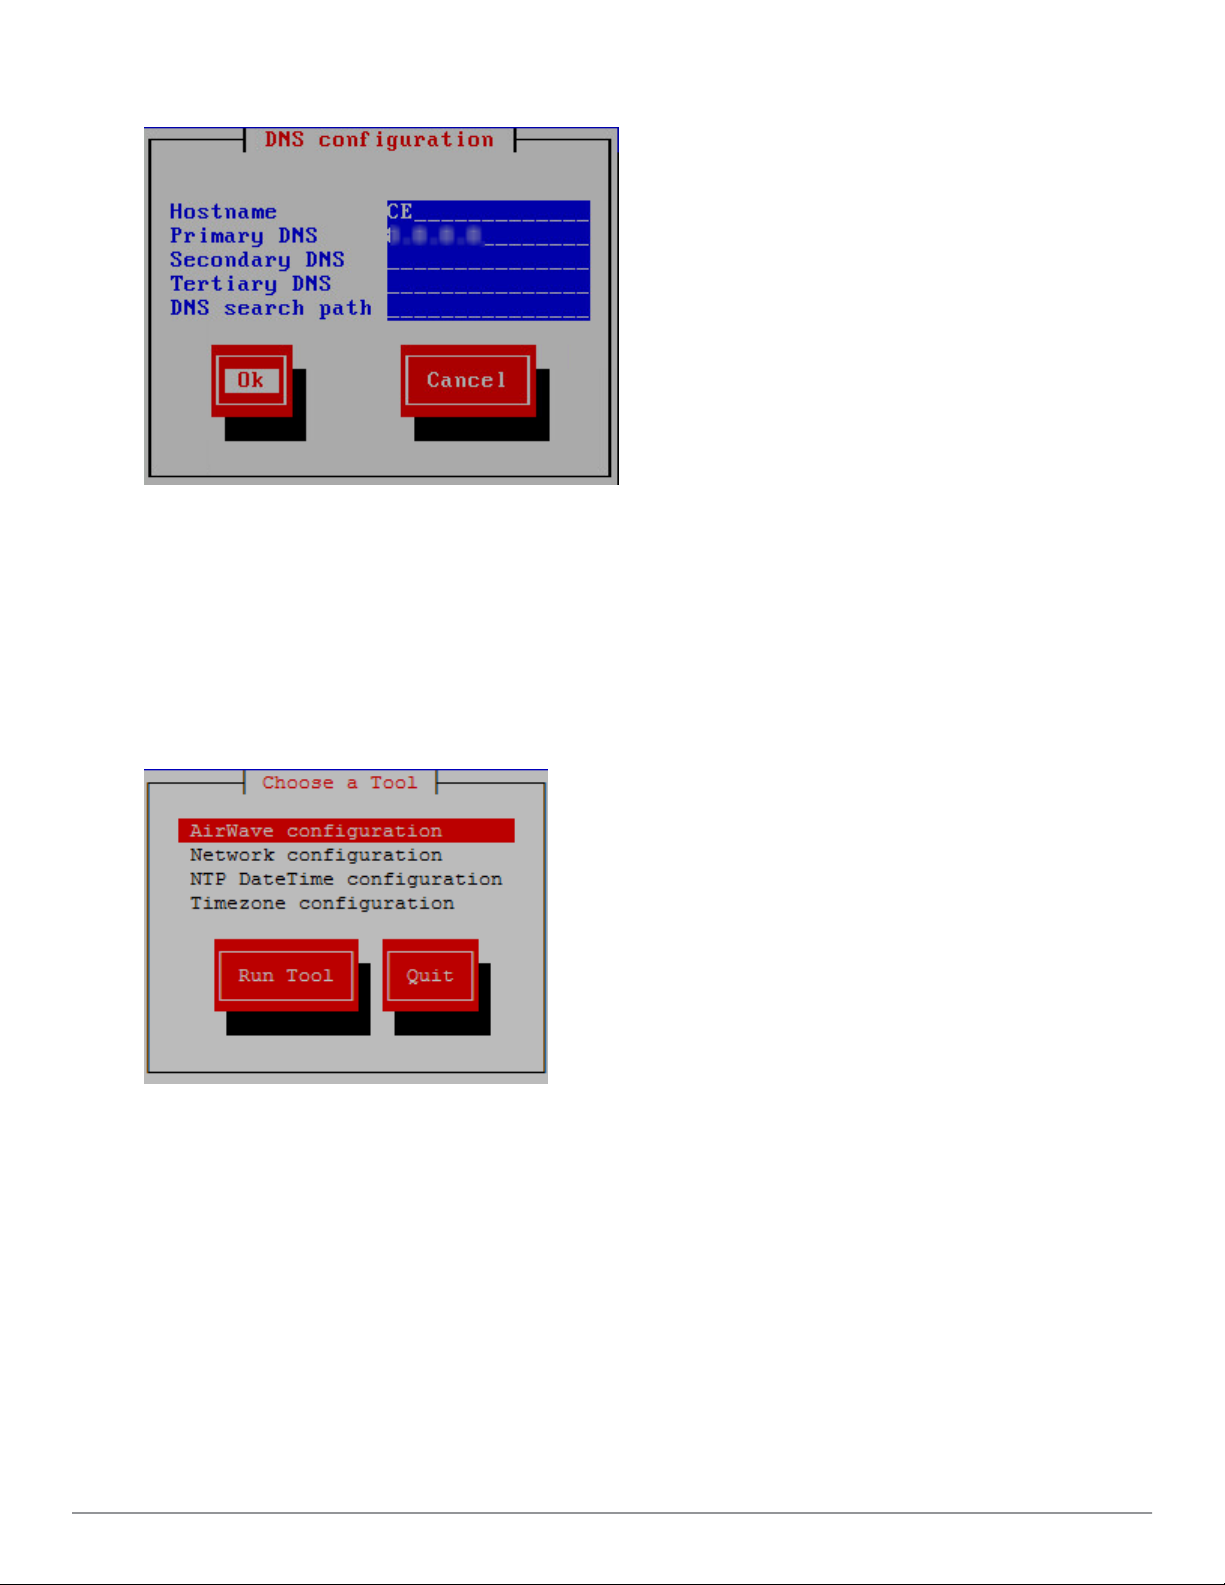
Figure 10: Configuring the DNS Servers
8. Click Save&Quit, as shown in Figure 11.
Figure 11: Saving the Device Configuration
AirWave Server Configuration
Follow these steps to configure the AirWave server.
1. From the initial setup window, select AirWave configuration, then click Enter, as shown in .
Figure 12: Opening the AirWave Configuration Tool
2. Click AirWave configuration, as shown in Figure 13.
Figure 13: Selecting the AirWave Configuration Tool
3. Enter the IP address to associate with the AirWave server, then click Ok. The Clarity Engine uses the default
port number 60001, as shown in Figure 14.
x | Initial Setup AirWave 8.2.4.1 and Clarity Beta | User Guide
Page 11
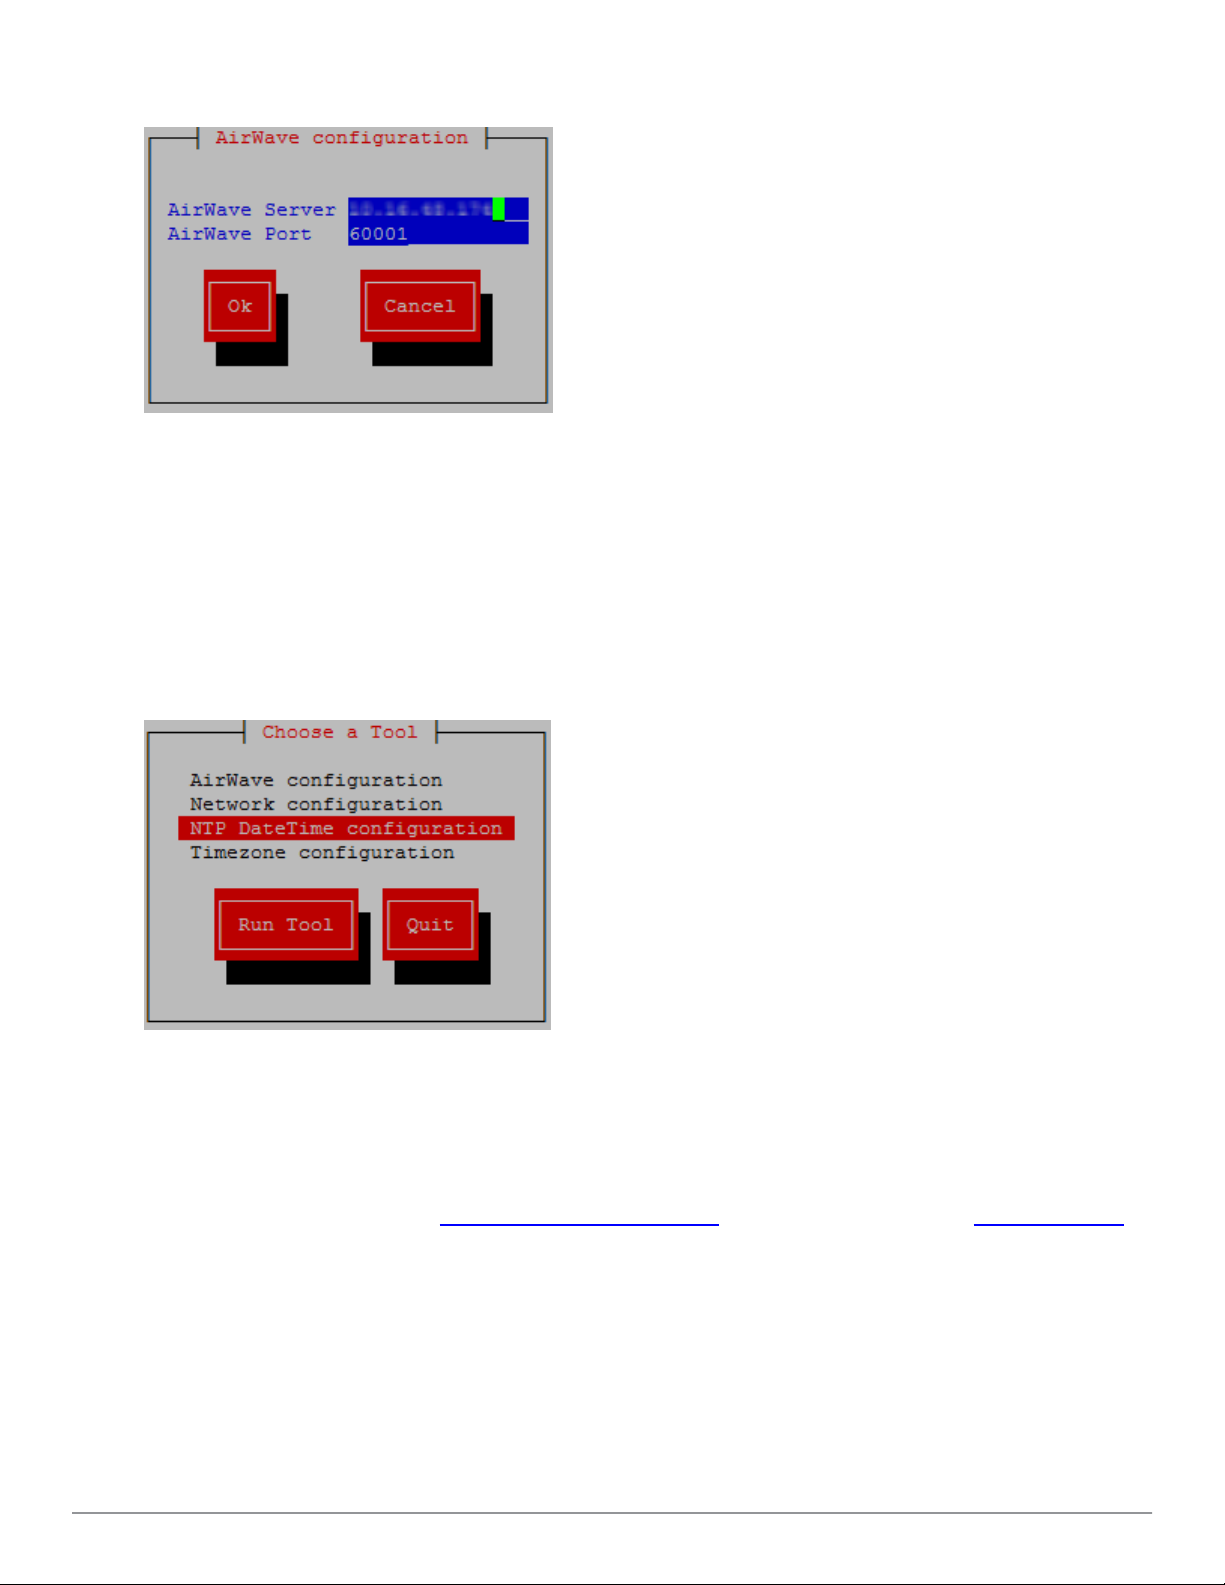
Figure 14: Configuring the IP Address and Port
4. Click Save&Quit.
NTP Server, Date, and Time Configuration
You can configure an NTP server so that time is synchronized among the Clarity Engine, AirWave server, and
Aruba controller. Follow these steps to configure NTP servers and dynamic or static time.
If you do not want to configure NTP servers, go to step 4 on page xii to configure static date and time. Ensure
that this date and time matches the date and time of the Airwave server.
1. From the initial setup window, select NTP DateTime configuration.
Figure 15: Opening the NTP DateTime Tool
2. Select NTP DateTime configuration, as shown in Figure 16, then click Enter.
Figure 16: Selecting NTP DateTime Configuration
3. Enter the NTP server host names, as shown in Figure 17.
Find time servers used by the NIST Internet Time Service (ITS) or pooled into zones by the NTP Pool Project.
AirWave 8.2.4.1 and Clarity Beta | User Guide Initial Setup | xi
Page 12

Figure 17: Configuring NTP Servers
4. In the Use NTP Server field, toggle the asterisk off using the spacebar to manually change the date and time,
then click Ok (see Figure 18).
Figure 18: Configuring the Date and Time
5. Click Save&Quit.
Time Zone Configuration
Follow these steps to configure the time zone:
1. From the initial setup window, select Timezone configuration, as shown in Figure 19.
xii | Initial Setup AirWave 8.2.4.1 and Clarity Beta | User Guide
Page 13

Figure 19: Opening the Timezone Configuration Tool
2. Select the time zone, then click Ok, as shown in Figure 20.
Figure 20: Configuring the Time Zone
3. From the initial setup window, click Quit to exit the setup.
You can start using Clarity Synthetic after you complete the post-configuration instructions and add the
Clarity Engine in AirWave.
Post-Configuration Instructions
After you complete the initial configuration:
1. Reboot the machine after completing the initial configuration.
2. Check IP connectivity to an external host after rebooting the machine.
After provisioning the Clarity Engine, add the Clarity Engine in AirWave. Then you are ready to use the Clarity
Engine for synthetic tests.
Changing the Root Password
After you deploy the OVA template, you need to change the default root password.
1. Log in as root to the Clarity Engine with user name (root) and password (admin).
2. Follow the onscreen instructions to change the default root password, as shown in Figure 21.
AirWave 8.2.4.1 and Clarity Beta | User Guide Initial Setup | xiii
Page 14

Figure 21: Changing the Root Password
Reconfiguring the Clarity Engine
If you need to reconfigure the Clarity Engine, you can use the setup command to open the intial setup window.
1. Open a terminal window and type setup.
Figure 22: Entering the Setup Command
The intial setup window opens.
Figure 23: Initial Setup Window
2. Follow the instructions in "Provisioning the Clarity Engine" on page vii.
3. After making the configuration changes, restart the network using the service network restart command.
xiv | Initial Setup AirWave 8.2.4.1 and Clarity Beta | User Guide
Page 15

Chapter 4
Upgrading the Clarity Engine
How to Update the RPM Package
Before you upgrade the RPM package using the rpm command, you must first use yum to resolve a dependency
on tunctl:
1. yum install tunctl
2. rpm -Uf CE-1.0.0.1-60151.x86_64.rpm
AirWave 8.2.4.1 and Clarity Beta | User Guide Upgrading the Clarity Engine | xv
Page 16

Chapter 5
Using Clarity
AirWave provides more ways to monitor your Clarity data and network performance. You can monitor Wi-Fi
connectivity in real-time with Clarity Live, so you can find problems in the wireless client association,
authentication, IP address configuration, and DNS resolution processes. You can also turn APs into wireless
clients in order to run synthetic tests in Clarity Synthetic mode.
AirWave receives Clarity Live data through AMON messages sent from controllers on the network. The
controllersmust be running ArubaOS 6.4.3 or later.
Live Monitoring
The Clarity Live information on the Home > Clarity page provides a way to observe wireless clients as they
connect to the wireless network. Live monitoring helps you determine the cause of network connectivity and
performance issues.
About the Clarity Live Charts, Graphs, and Tables
The Clarity Live dashboard displays real-time information that helps you identify failure when clients are
connecting to the wireless network. You can drill down and view data for devices associating to APs in a specific
subfolder, or view data for a different time interval.
Failures Rates
Figure 24 shows an example of the statistics displayed in the dashboard. Statistics include:
l Percentage of failures for each process
l Number of failures
l Total number of attempts (both failed and successful) over the selected time period.
Figure 24: Home > Clarity Dashboard Showing Failure Rates
Process Times
To display the average process times over the selected time interval, click the Failure drop-down menu in the
upper left corner of the dashboard and click Time.
AirWave 8.2.4.1 and Clarity Beta | User Guide Using Clarity | xvi
Page 17

Figure 25: Home > ClarityDashboard Showing Average Process Times
First 25 Results
Clarity Live displays only 25 subfolders and APs with the lowest performance levels. If you have more than 25
subfolders or APs in the folder view, you can increase the number of results returned per page.
To see more than 25 results:
1. Click the Details link at the bottom right corner of a Clarity table. A Details pop up window appears.
2. Click the per page drop down list in the lower left corner of the window and select the number of results.
Click to view information about APs, or click to return to the default folder view. To see the top 25 users
by Clarity issue, click at the top right of the Summary table.
Thresholds for Failures and Process Times
Each icon in the Summary table represents quality thresholds for the number failures and the average amount
of time it takes the process to complete.
For example, if a process has a high failure rate but a good process time, the icon will be red, indicating the most
severe threshold crossed in either category. Hover your mouse over an icon to display the number of
authentication process failures and successes for clients associating to individual APs or folders of APs, as well as
the average time it took for each process to complete.
Refer to Table 1 for descriptions of what each icon color represents and the thresholds for process times and
failure rates.
Table 1: Icon Color Codes and Thresholds
Icon Color Description Process Time Thresholds Failure Rate
Threshold
Good failure rate and
process time
l Good Association time: <10 ms
l Good Authentication time: <500ms
l Good DHCP time: <100 ms
l Good DNS time: <100 ms
< 10% failures
Fair failure rate or process
time
xvii | Using Clarity AirWave 8.2.4.1 and Clarity Beta | User Guide
l Fair Association time: 10 -20 ms
l Fair Authentication time: 500-1000ms
l Fair DHCP time: 100 - 200ms
l Fair DNS time: 100 -200ms
>10% to 20% failures
Page 18

Table 1: Icon Color Codes and Thresholds (Continued)
Icon Color Description Process Time Thresholds Failure Rate
Threshold
Poor failure rate or process
time.
l Poor Association time: >20 ms
l Poor Authentication time: >1000 ms
l Poor DHCP time: >200 ms
l Poor DNS time: >200ms
>20% failures
User Details in Clarity
Clarity Live allows you to use the Summary table to navigate directly to user details. For example, you can
narrow your results to list users that have used a specific server to authenticate, and you can click the Client
MAC address link to open the User Detail page for the client.
To view user details for a client:
1. In the Summary table on the Home >Clarity page, locate a client and click in the Authentication column
(see Figure 26). Or, you can open the User Details page by clicking Association or DHCP.
Figure 26: Opening the User Details Page for a Client
The User Details page opens (see Figure 27).
Figure 27: Clarity User Details
2. Narrow the scope of your analysis, by selecting a link from the User Details page. For example, to see
authentication failures for all users who have used a specific Dot1x server, click Auth. Failures (%) for the
server (see Figure 28).
AirWave 8.2.4.1 and Clarity Beta | User Guide Using Clarity | xviii
Page 19

Figure 28: Filtering Your Results
The User Details page displays filtered results (see Figure 29).
Figure 29: Filtered User Details for Authentication Failures for Users on a Dot1x Server
Authentication Failure Data
The Authentication table provides information for the client authentication processes on the network.
Table 2: Authentication Table fields
Column Description
Servers IP address of an authentication server.
Type
Failures (%) This column shows the percentage of authentication failures for that server, followed by the total
Avg. Time (ms) The average time it took to successfully complete the authentication process over the selected
Click in the table heading to display of graph of average authentication times for each server during the
selected time interval. Hover your mouse over any section of the graph to view details about the authentication
times during that portion of the time interval, or click to return to the table view.
Indicates the authentication server type:
l Dot1x: 802.1x
l Captive Portal: Captive portal authentication
l MAC Auth:MAC authentication
l WPA-PSK: WPA encryption with pre-shared key (PSK) authentication
number of failures and the total number of authentication attempts over the selected time
interval.
time interval. Times for both failed and successful attempts are calculated in this average.
DHCP Failure Data
The DHCP table on the Home>Clarity page provides information about authentication on the network.
xix | Using Clarity AirWave 8.2.4.1 and Clarity Beta | Use r Guide
Page 20

Table 3: DHCP Table fields
Column Description
Servers IP address of a DHCP server.
Avg. Time (ms) The average time it took to successfully complete the DHCP provisioning process over the
selected time interval. Times for both failed and successful attempts are calculated in this
average.
Click the in the table heading to display of graph of DHCP times for each server during the selected time
interval. Hover your mouse over any section of the graph to view details about the DHCP provisioning times
during that portion of the time interval, or click to return to the table view.
DNS Failure Data
The DNS table displays the information for DNS resolution attempts.
Table 4: DNS Table fields
Column Description
Servers IP address of a DNS server.
Failures (%) This column shows the percentage of DNS resolution failures for that server, followed by the total
number of failures and the total number of DNS resolution attempts over the selected time
interval.
Avg. Time (ms) The average time it took to successfully complete the DNS resolution process over the selected
time interval. Times for both failed and successful attempts are calculated in this average.
Click in the table heading to display of graph of DNS resolution times for each server during the selected time
interval. Hover your mouse over any section of the graph to view details about the resolution times during that
portion of the time interval, or click to return to the table view.
Association Data
The Association table on the Home>Clarity page displays the following information for association times and
failures on the network.
Table 5: Association Table fields
Column Description
APs Name of an AP.
Failures (%) This column shows the percentage of failed association attempts failures for that AP, followed by
the total number of failures and the total number of association attempts over the selected time
interval.
Avg. Time (ms) The average time it took to for a client to associated to the AP over the selected time interval.
Times for both failed and successful attempts are calculated in this average.
Click in the table heading to display of graph of association times for each AP during the selected time
interval. Hover your mouse over any section of the graph to view details about the association times during that
portion of the time interval, or click to return to the table view.
Sorting and Filtering Clarity Data
Select any column heading in a Clarity table to sort the table by that value. Each Clarity tabledisplays entries for
25 devices with the lowest performance levels. You can also select one or more column headings in the Details
AirWave 8.2.4.1 and Clarity Beta | User Guide Using Clarity | xx
Page 21

pageto sort or filter the table by the selected values.
Selecting a Folder from the Navigation Bar
The navigation bar presents your folders in an organized hierarchy. When you click in the AirWave WebUI (see
Figure 30) and select a folder from the navigation bar, Clarity will present data for the devices in this folder in the
Clarity Live dashboard to the right.
Figure 30: Folder Navigation Bar
Exporting Clarity Data
Click by a Clarity table title to display the following list of data export options and table display settings.
l Export all data as csv: Export the entries currently displayed in the table to a .csv formatted file.
l Export visible data as csv: Export all entries recorded for the selected time frame to a .csv formatted file.
l Export all data as pdf: Export the entries currently displayed in the table to a PDF file.
l Export visible data as pdf: Export all entries recorded for the selected time frame to a PDF file
l Details: Display the details window for the table.
l Columns: Click a column heading to hide or display a column in the table.
Changing the Time Range
The Clarity Live dashboard displays data for the previous two hours. Clarity immediately refreshes and displays
updates in the Clarity Live dashboard after any changes to the time range.
To display data for the previous day, week, or two weeks, select an option from the timerange toolbar.
Figure 31: Select a Clarity Time Range
To select a custom time range, click the arrow on time range toolbar, then select a custom start and end time.
xxi | Using Clarity AirWave 8.2.4.1 and Clarity Beta | Use r Guide
Page 22

Figure 32: Selecting a Custom Time Range
Changing the Data Retention Interval
AirWave saves Clarity Engine statistics for 7 days and client statistics for 2 days. If you want to change the
retention intervals, go to AMP Setup > General > Historical Data Retention.
Evaluating User Status
The Clients Detail page provides Clarity information, such as association, authentication and DHCP events for a
particular client, in a table view, as shown in Figure 33.
Figure 33: Client Diagnostics for Clarity Live Monitoring
You can click to display the Clarity live monitoring data in a timeline view, as shown in Figure 34.
AirWave 8.2.4.1 and Clarity Beta | User Guide Using Clarity | xxii
Page 23

Figure 34: Clarity Timeline
You can access this page by doing one of the following:
l Search for a user. In the resulting window, click the MAC address link.
l Click the MAC address link in the APs/Devices > Monitor page, the Clients > Connected page, or the Clients > All
page.
Synthetic Testing
With Clarity Synthetic, you can simulate user connections over Wi-Fi to find potential problems in your network.
This type of monitoring is useful if you want to test a Wi-Fi network before deployment, monitor application
performance, or to resolve support issues.
Adding the Clarity Engine
Before you can run synthetic tests, you must add the Clarity Engine in AirWave. AirWave communicates with the
Clarity Engine using the WebSocket Secure protocol over Port 60001.
1. Navigate to Home > Clarity and open the link to Synthetic. Clarity redirects you to the Add a Clarity
Engine page
2. In the Add Clarity Engine tab, click New.
3. Enter the hostname and IP address associated with the Clarity Engine (see Figure 35).
xxiii | Using Clarity AirWave 8.2.4.1 and Clarity Beta | User Guide
Page 24

Figure 35: Adding the Clarity Engine
4. Click Save.
Viewing Clarity Engine Information and Graphs
After you add the Clarity Engine, you can view information about it and statistics on memory usage and CPU
resources from the APs/Devices > Clarity Engine page.
Figure 36: Clarity Engine Information and Graphs
Clarity Engine Information
Table 6 describes the fields in the Clarity Engine Information table. You can click the column headings to sort
the data in the column.
AirWave 8.2.4.1 and Clarity Beta | User Guide Using Clarity | xxiv
Page 25

Table 6: Clarity Engine Information
Column Description
Server ID Displays the ID number of the Clarity Engine. This IDis derived from the VMware
vCenter Server Heartbeat.
Status Shows the status of the Clarity Engine:
l Added. This status only appears when a server is first added to AirWave, before
AirWave has initially contacted the server.
l Up. The engine is initializing.
l Idle. The engine is reachable but not running any tests.
l Running. The engine is running synthetic tests.
IP Address Displays the IP address associated with the Clarity Engine.
Test In Progress Displays whether synthetic tests are running.
Version Displays the version of Clarity Engine.
Graphs
You can zoom in to see statistics in detail by dragging your pointer left or right (see Figure 37). Click Reset zoom
to zoom out. The following interactive graphs are available:
l Memory usage. This graph shows the memory in MB used by the Clarity Engine.
l CPU usage. This graph shows the percentage of CPU resources used by the Clarity Engine.
Figure 37: Zoom Horizontally
How to Set Up Your Synthetic Test
There are two places where you can set up and run a synthetic test. One is where you manually select your client
and target APs from the Clarity dashboard. The other is where you select your client AP from a floor plan in
VisualRF. In both scenarios, you can select the targets, or let the Clarity Engine decide.
This process includes: selecting your APs, adding basic information to your test, and setting up and running your
test.
Selecting Your APs
Clarity works with VisualRF, letting you select APs and run tests. When you select your client AP from the floor
plan, Clarity determines which neighboring APs make a good target and automatically lists them in the setup
page.
xxv | Using Clarity AirWave 8.2.4.1 and Clarity Beta | User Guide
Page 26

Using Clarity Synthetic to select your client and target APs
Clarity Synthetic allows you to batch select any AP. When you select the client and target APs, Clarity Synthetic
displays the names of the APs and its folders.
Fora list of supported APs, see "AirWave 8.2.4 Supported Infrastructure Devices". If there are no devices in a
folder, the folder appears grayed out in the folder hierarchy.
1. Go to Home > Clarity and click the Synthetic link.
2. Click Schedule Tests.
3. Select the Client AP(s). You can select as many devices as you want from the AP list. Clarity Synthetic only lists
devices that are up.
Figure 38: Selecting the Client AP
4. Select the Target AP(s). For manual selection, click Select Target AP(s), select one or more devices from the
APlist, and then click Define Test Profile, as shown in Figure 39.
Figure 39: Selecting the Target AP Manually
If you want the Clarity Engine to determine the target AP, skip the target AP selection and click Define Test
Profile. Clarity Engine will select only 1 target AP.
AirWave 8.2.4.1 and Clarity Beta | User Guide Using Clarity | xxvi
Page 27

Figure 40: Selecting the Target AP Automatically
Using VisualRF to select your client AP
1. Go to VisualRF > Floor Plans and select a floor plan.
2. Select an AP in one of the following ways:
n Right-click the AP and choose Clarity Synthetic from the shortcut menu.
n Click the AP, navigate to the Edit tab, and then click Clarity Synthetic.
For information about using VisualRF, including how to create a floor plan, see the AirWave 8.2.4 User Guide.
Adding Basic Information to Your Test
By default, the Clarity Synthetic test is a one-time test. You can provide basic information about the test only
after you select your client and target APs. The format of information required is based on the authentication
setting you choose.
Clarity saves your basic test information in a profile, which you can use later. You can have multiple profiles, each
containing a separate set of information, such as:
l SSID
l Client and target APs
l Authentication method
l Radio channel
l User name and password
l TLS certificate
l Shared key
To provide basic test information:
1. Select a profile. Or, if you're creating a new profile, select CREATE A PROFILE and enter a profile name.
Evenif you select a profile that uses open authentication, that authentication method will not be associated
withthe test until you select Open as shown in Figure 41.
2. Select your SSID.
3. Select the authentication method. The information required depends on the authentication method you
select:
n EAP/PEAP requires a user name and password.
n WPA/PSK requires that every client authenticates to the network using the same key.
n Open authentication allows any client to authenticate to the network. Clarity Synthetic doesn't require
additional login information.
n TLS uses PKCS12 for authentication. PKCS12 is the default certificate generate by ClearPass.
xxvii | Using Clarity AirWave 8.2.4.1 and Clarity Beta | User Guide
Page 28

Figure 41: Creating a Profile for Open Authentication Testing
4. Select the band option, either 2.4 GHz or 5 GHz and click Next.
Setting Up and Running Your Tests
After you enter basic information for your test, you can configure several tests from the SyntheticTests window.
DNS Test
The DNS test checks the ability for an associated client to resolve destinations through DNS query.
To configure the DNS test:
1. From the DNS tab, enter the destination hostname or IP address.
2. Cick to add more destinations to query, or to remove them.
3. Click Next.
Figure 42: Setting up the DNS Test
Ping Test
The ping test confirms whether your network is reachable and the destination is reachable.
To configure the ping test:
AirWave 8.2.4.1 and Clarity Beta | User Guide Using Clarity | xxviii
Page 29

1. From the Ping tab, select the size of the ping packet transmitted in the test
2. Enter the destination hostname or IP address.
3. Cick to add multiple destinations, or to remove them.
4. Click Next.
Figure 43: Setting up the Ping Test
Page Load Test
The page load test measures how long it takes for the first page in a domain to completely load, including the
time to load all images and other displayed files.
1. From the Page load tab, type the website URL.
Thepageload tests default to https://. You can change the URL to http:// for unsecure websites.
2. Cick to add multiple URLs, or to remove them.
3. Click Next.
xxix | Using Clarity AirWave 8.2.4.1 and Clarity Beta | User Guide
Page 30

Figure 44: Setting up the Page Load Test
Traceroute Test
The traceroute test traces a series of pings and the hops taken between the synthetic client and the destination
web page or host server.
1. From the TraceRoute tab, select the type of path check, ICMP, UDP, or TCP and enter the hostname or IP
adress of the web page or server.
2. Cick to add multiple destinations, or to remove them.
3. Click Next.
Figure 45: Setting up the Traceroute Test
iPerf3 Test
The iPerf3 test measures the how long it takes to send a filethrough your network.
Clarity Synthetic supports iPerf 3.0.
1. From the iPerf3 tab, select the iPerf3 server. If you select an external iPerf3 server, enter its IP address.
2. For TCP tests, enter the time duration. Or, for UDP tests, enter the buffer size and bandwidth.
3. Click Run Tests.
AirWave 8.2.4.1 and Clarity Beta | User Guide Using Clarity | xxx
Page 31

Figure 46: Setting up the iPerf3 Test
How to View Test Results
There are two ways to view your test results.
Viewing Test Results in VisualRF
After you run your tests, you'll see an alert in the floor plan view.
To view test results in VisualRF:
1. Hover your mouse over the bell icon to view the notification.
Figure 47: Alert Notification
2. Click the bell icon. In the Results window, as shown in Figure 48, you will see information about the client and
target APs and status icons. Hover over the test type for detailed information in the tooltip.
Figure 48: Viewing Your Test Results
Viewing Your Test Results in Clarity
Navigate to Clarity > Synthetic > Test Details to monitor progress and view test results.
xxxi | Using Clarity AirWave 8.2.4.1 and Clarity Beta | User Guide
Page 32

Status Icons in Clarity Synthetic
Table 7: Icon Color Codes and Thresholds
Icon Color Description Process Time Thresholds Failure Rate
Threshold
Good failure rate and
process time
Fair failure rate or process
time
Poor failure rate or
process time.
l Good Association time: <10 ms
l Good Authentication time: <500ms
l Good DHCP time: <100 ms
l Good DNS time: <100 ms
l Fair Association time: 10 -20 ms
l Fair Authentication time: 500-1000ms
l Fair DHCP time: 100 - 200ms
l Fair DNS time: 100 -200ms
l Poor Association time: >20 ms
l Poor Authentication time: >1000 ms
l Poor DHCP time: >200 ms
l Poor DNS time: >200ms
< 10% failures
>10% to 20% failures
>20% failures
AirWave 8.2.4.1 and Clarity Beta | User Guide Using Clarity | xxxii
Page 33

Chapter 6
Debugging Issues
You can debug issues on the Clarity Engine by collecting logs directly from the AirWave WebUI and evaluating
them. Logs are stored on the remote server of the remote host.
Collecting Logs
You can collect logs for a specific test from the Results window.
To collect a log:
1. Navigate to Home > Clarity > Synthetics > Test Details.
2. Open the Results window from the Timestamp link.
Figure 49: Results Window
3. Click Collect Logs.
4. From the Downloads directory, right-click the collected log .zip file and select an application, such as 7-Zip,
WinRAR, or WinZip, to open the file.
Debugging on the Host
Debugging logs are located at /var/log/.
To debug issues on the host of a Clarity Engine:
1. Run a test from AirWave and check for the /var/log/containtersResults/finalResult_<testId> file to
verify if the test completed successfully.
2. If the test file is not present, verify for an active connection between the Clarity Engine and AirWave.
Validate this information using the /var/log/serverbackend.log file. A heart beat message exchange
between Clarity Engine and AirWave indicates the connection is successful. Note if there are errors in
establishing a connection.
Example of a Heartbeat Message
amsSyntheticClientBackend - DEBUG - amsSyntheticClientSendHeartBeat:=>Heartbeat Data :
[{'numOfTests': 0, 'timeStamp': 1475614236.959801, 'serverIp': '10.16.48.169', 'cpuUsage':
'0.9%us,', 'rpmVersion': 'AMS-1.0.0.0-1, Built by snarayanan at Tue Oct 4 15:58:44 IST
2016\n', 'memFree': '473388k', 'memUsed': '1441104k', 'serverState': 'IDLE'}]
If connection is successful, check if the Clarity Engine received the test configuration log file from AirWave.
/var/log/serverbackend.log and flag if there are any errors.
<testId> for test initiated from AirWave indicates if Clarity Engine received configuration.
3. If the server back end received a configuration from AirWave check /var/log/stats_collector.log filefor
container creation. Flag if there are any errors. Check the following log for successful container creation:
Client IP :=> 10.51.1.66, Client MAC :=> 84:D4:7E:C8:47:1E, Client NAME :=>
aclarity225a,Container Id :=> 177, Test Mode :=> Campus,
amsSyntheticClientInitandStatsCollector - DEBUG - amsContainerInitInfra:=>Starting creation
of container Container_112,
amsSyntheticClientInitandStatsCollector - DEBUG - amsContainerInitInfra:=>received event
amsContainerReadyEvent:Container_112, container up and running, waiting for test request
initiation
AirWave 8.2.4.1 and Clarity Beta | User Guide Debugging Issues | xxxiii
Page 34

amsSyntheticClientInitandStatsCollector - DEBUG - amsContainerInitInfra:=>received event
amsContainerTestRequestStarted:Container_112, container testWheel started test
4. Collect logs as mentioned in above section of log collection.
xxxiv | Debugging Issues AirWave 8.2.4.1 and Clarity Beta | User Guide
 Loading...