

Page 1
ADS
MultiTrace
Tutorial
v2.0
ADS MultiTrace Tutorial 1
Page 2

Introduction
Aim
This guide provides the user with a basic introduction to the ARM MultiTrace tools
and some guidance for their initial setup and use.
The tutorial is split into two sections:
Section 1 – Setting up the MultiTrace unit.
Section 2 – Using MultiTrace with AD.
Pre-requisites
This guide assumes the user has access to a PC workstation with the following tools
installed:
ADS 1.2
Multi ICE 2.2
MultiTrace 1.0
The information provided in this guide also applies to later versions of these tools.
Note: Explanation of File Extensions:
.c C source file.
.h C header file.
.o object file.
.s assembly language source file.
.axf ARM Executable file, as produced by armlink.
.txt ASCII text file.
Additional information
This tutorial is not designed to provide detailed documentation of the MultiTrace
tools, as the user guide covers this and is available both on-line and in hard copy. To
access the on-line user guide:
From the Start menu select Programs → ARM MultiTrace v1.0 →
ADS MultiTrace Tutorial 2
User Guide.
Page 3
Icon conventions
Various icons are used throughout the tutorial to clarify the purpose of text associated
with them. Icons either signify the presence of information on a particular topic, or
the requirement for user interaction.
The following icons all indicate that user interaction is required:
Indicates other keyboard or mouse input is required
Application icon. Suggests an application to be used to perform a
given operation. This example shows Microsoft Notepad
Button icon. This indicates that a corresponding button within the
current application can be used to perform the operation currently
being discussed
The following icons show information:
Suggests that further help is available from other resources.
Identifies a user friendly hint or tip.
Highlights important information regarding the current topic.
ADS MultiTrace Tutorial 3
Page 4
Section 1: Setting up the MultiTrace unit
For full, detailed information on this topic please refer to chapter 2 of
the MultiTrace user guide.
Requirements include access to a Windows PC with the following:
ADS 1.2
Multi-ICE 2.2
MultiTrace 1.0
The information in this guide also applies to later versions of these
tools.
A suitable target will also be needed, such as an Integrator core module
with an ETM connected to the PC via a Multi-ICE unit.
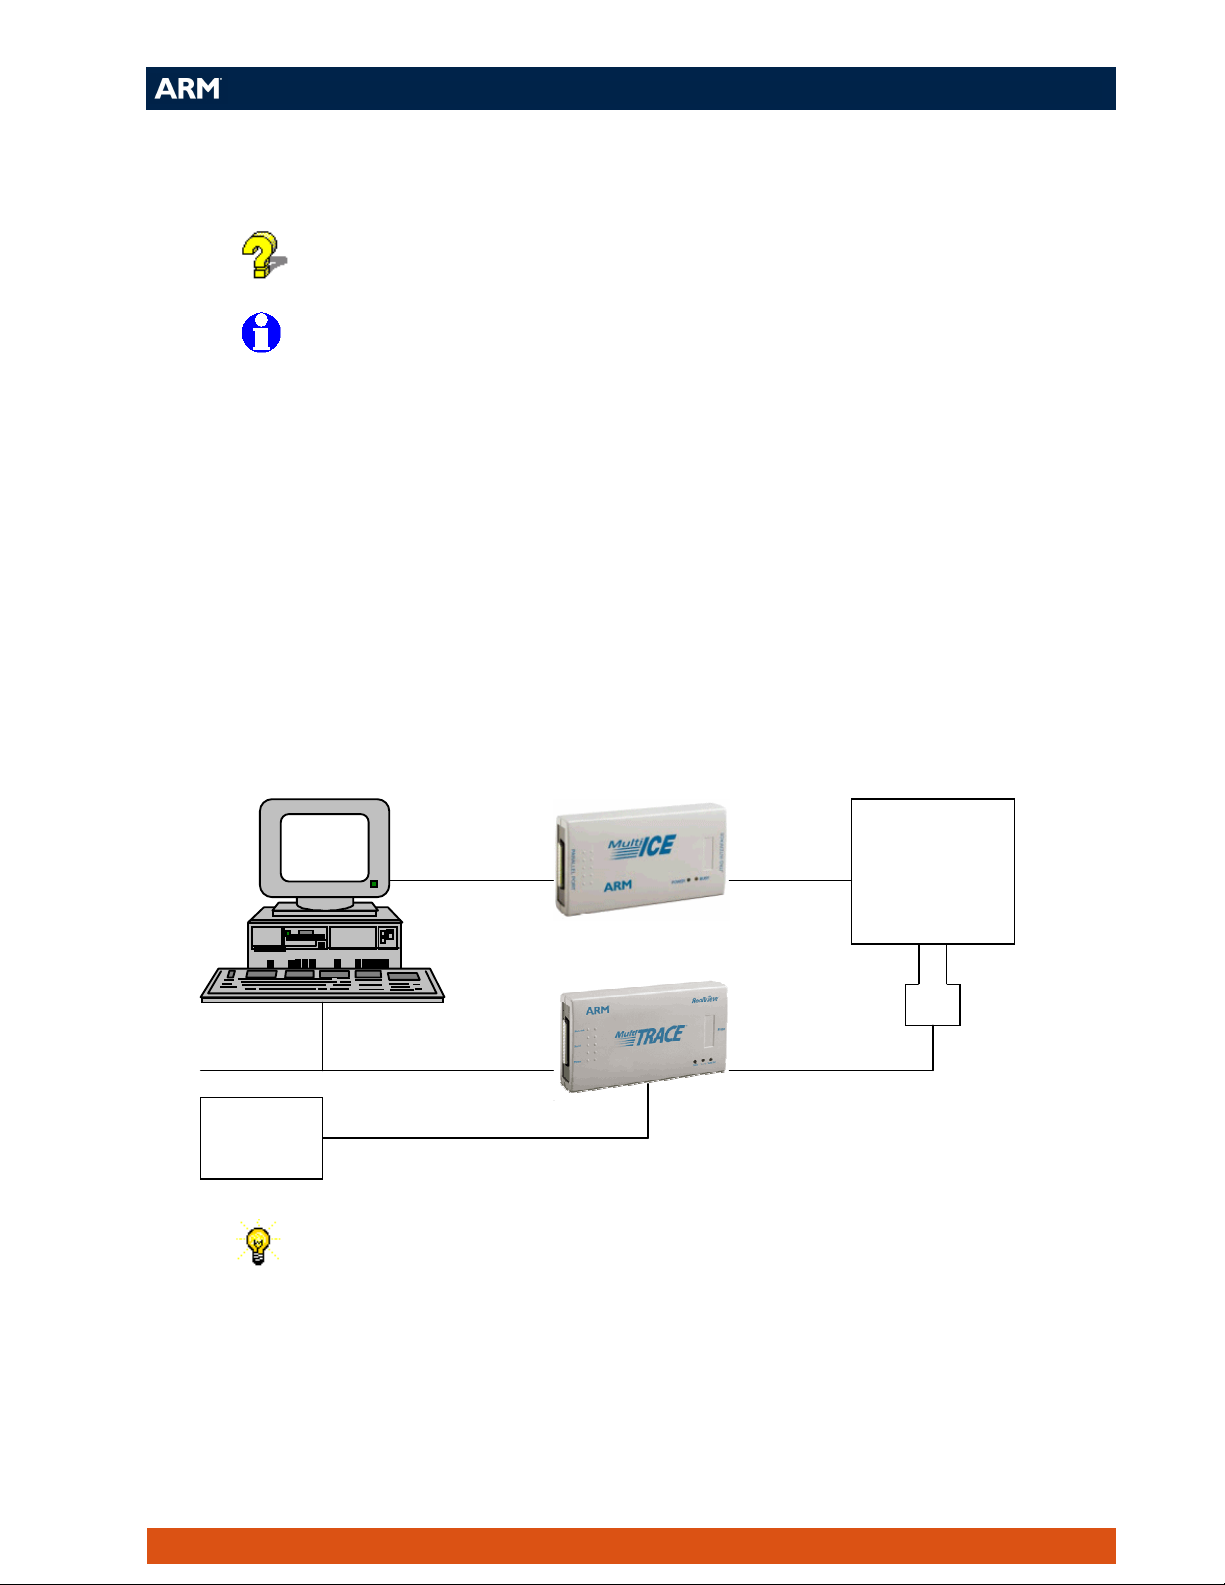
1.1 - Setting up the hardware
Using the cables provided, connect the MultiTrace unit to the target board, the
network and the power supply as follows:
5v PSU
The ‘T piece’ adapter must be used in order to attach the MultiTrace
ribbon cable to the MICTOR connector on the target board.
Ethernet
Parallel Port
JTAG
Mictor Connector
Adapter
Target
board
ADS MultiTrace Tutorial 4
Page 5
1.2 - Configuring the Ethernet connection
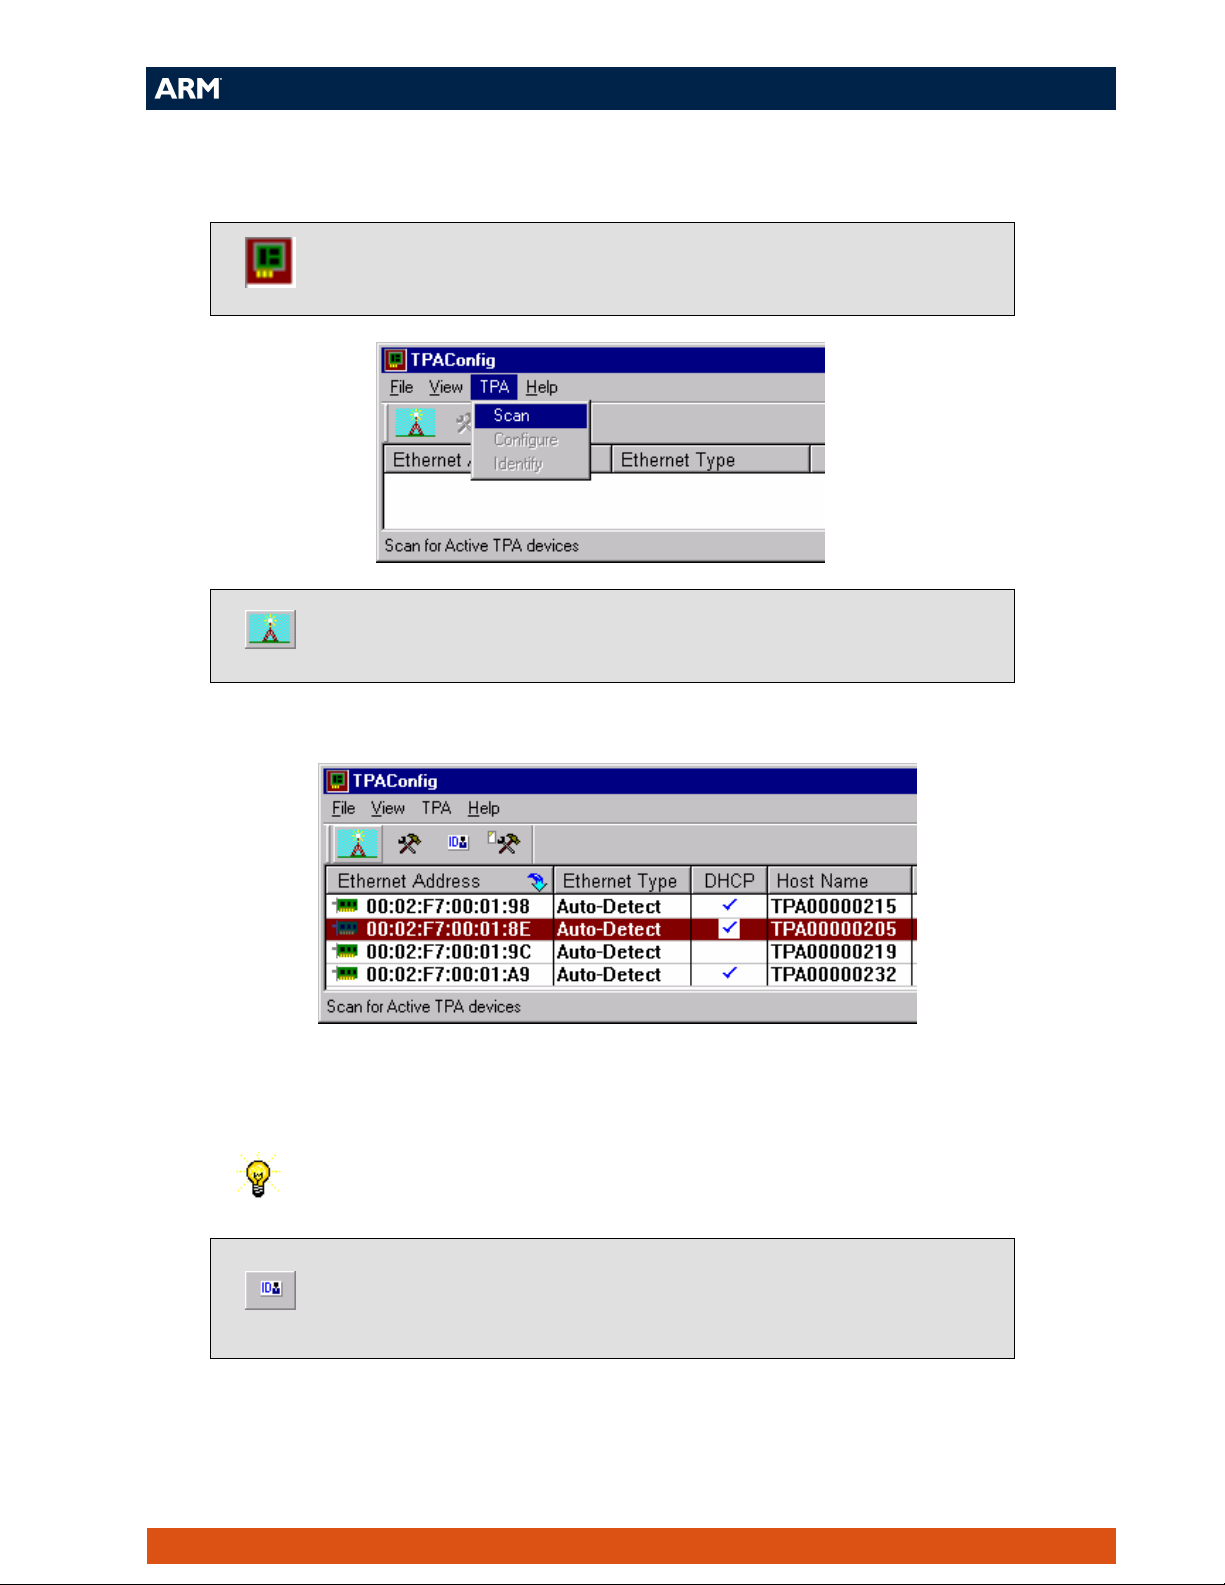
From the Start menu select Programs → ARM MultiTrace 1.0 →
Ethernet Config Utility. You will see a window as shown below:
Scan the local network for MultiTrace units by selecting TPA → Scan
from the menu, or clicking the Scan button on the toolbar.
After a few seconds the utility will display the MultiTrace units it has located:
If there are several MultiTrace units listed the correct unit can be identified by the
Ethernet Address and the Host Name numbers, both of which correspond to numbers
that are printed on a label on the underside of the MultiTrace unit.
A MultiTrace unit with a Host Name of TPA00000205 will have
S/N:205 printed on the label on the base of the unit.
Confirm the correct MultiTrace unit is chosen by highlighting it then
selecting TPA → Identify from the menu or clicking on the ID button
on the toolbar.
The selected MultiTrace unit will flash all three LEDs for a few seconds.
ADS MultiTrace Tutorial 5
Page 6
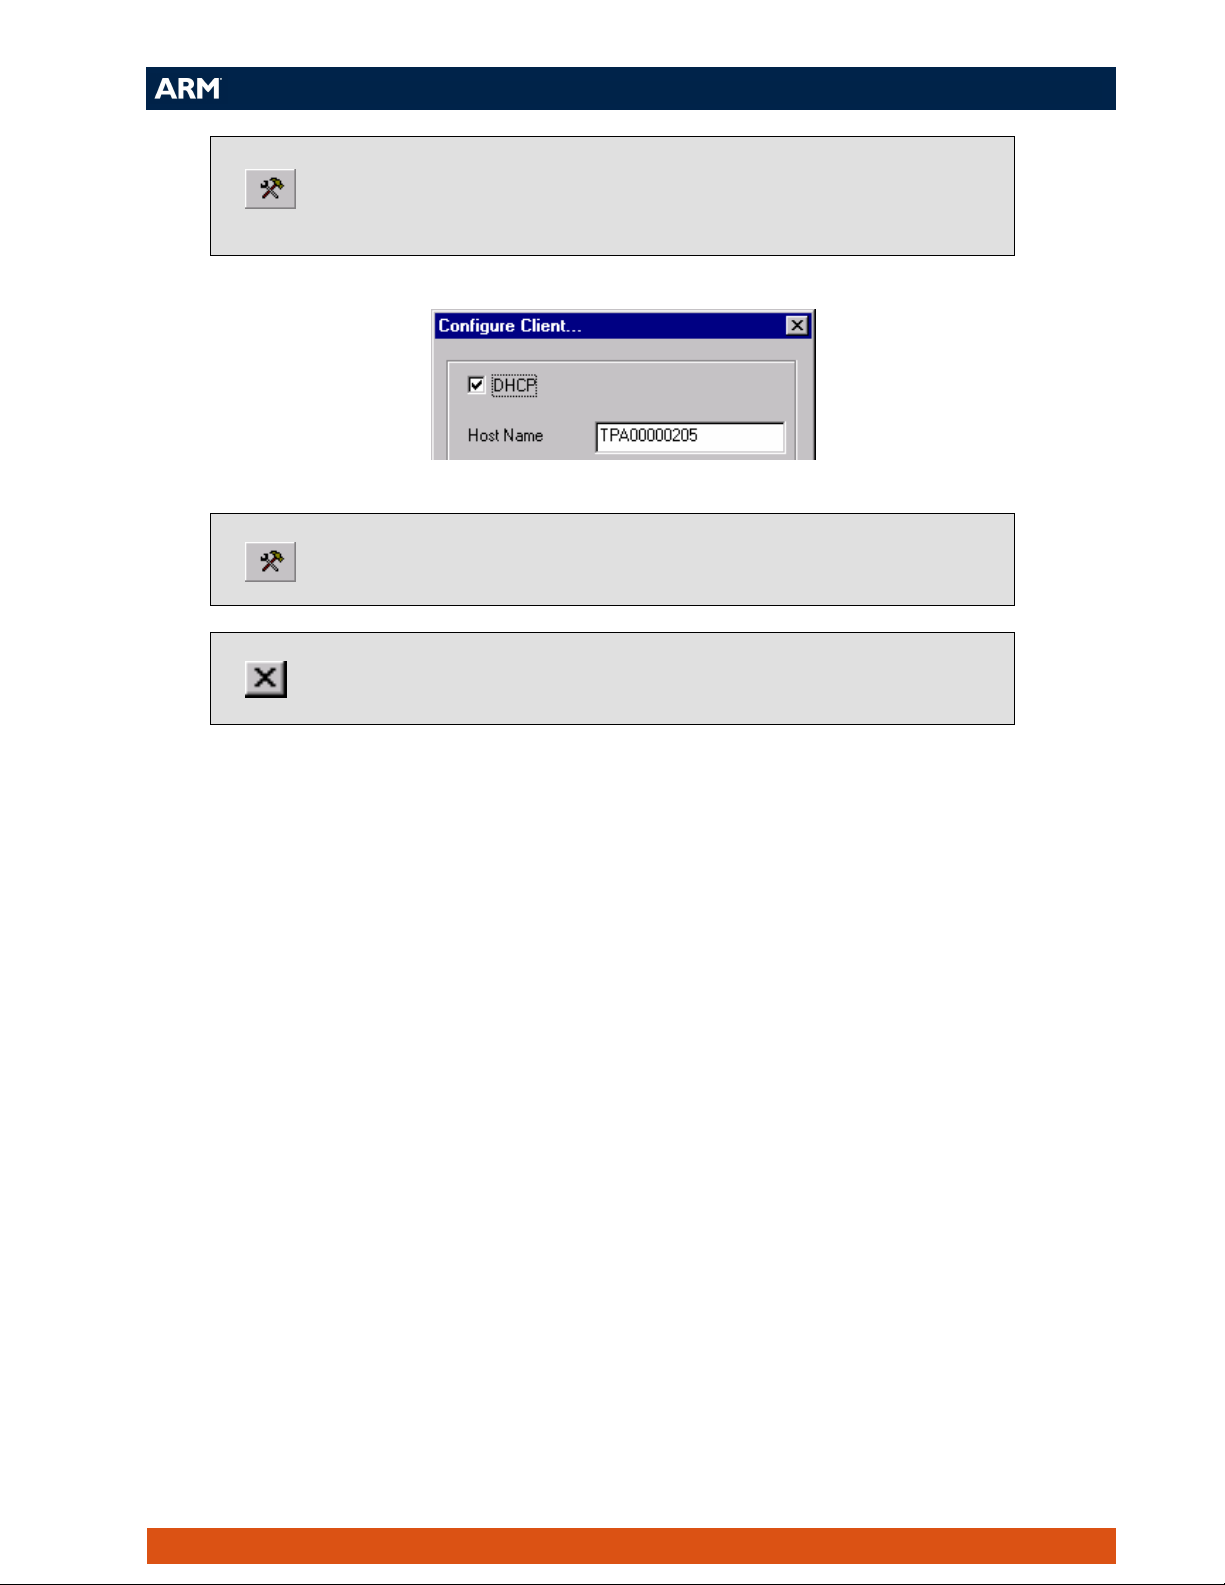
Check the configuration settings of the MultiTrace unit by selecting
TPA → Configure from the menu or clicking on the Configure button
on the toolbar. The Configure Client… dialog is displayed (see over).
Ensure the DHCP checkbox is ticked, then click on Configure to close
the dialog.
The MultiTrace unit is now ready for use with the debug tools. Close
the TPAConfig utility before proceeding to the next section.
ADS MultiTrace Tutorial 6
Page 7
Section 2: Using MultiTrace with ADS
This section provides an introduction to using the MultiTrace unit with ADS to
perform trace capture.
For full, detailed information on this topic please refer to the
MultiTrace user guide.
2.1 - Configuring the Target
Ensure the Multi-ICE server is running and connected to the target
board.
Launch AXD by selecting Programs → ARM Developer Suite v1.2 →
AXD Debugger from the Windows Start menu.
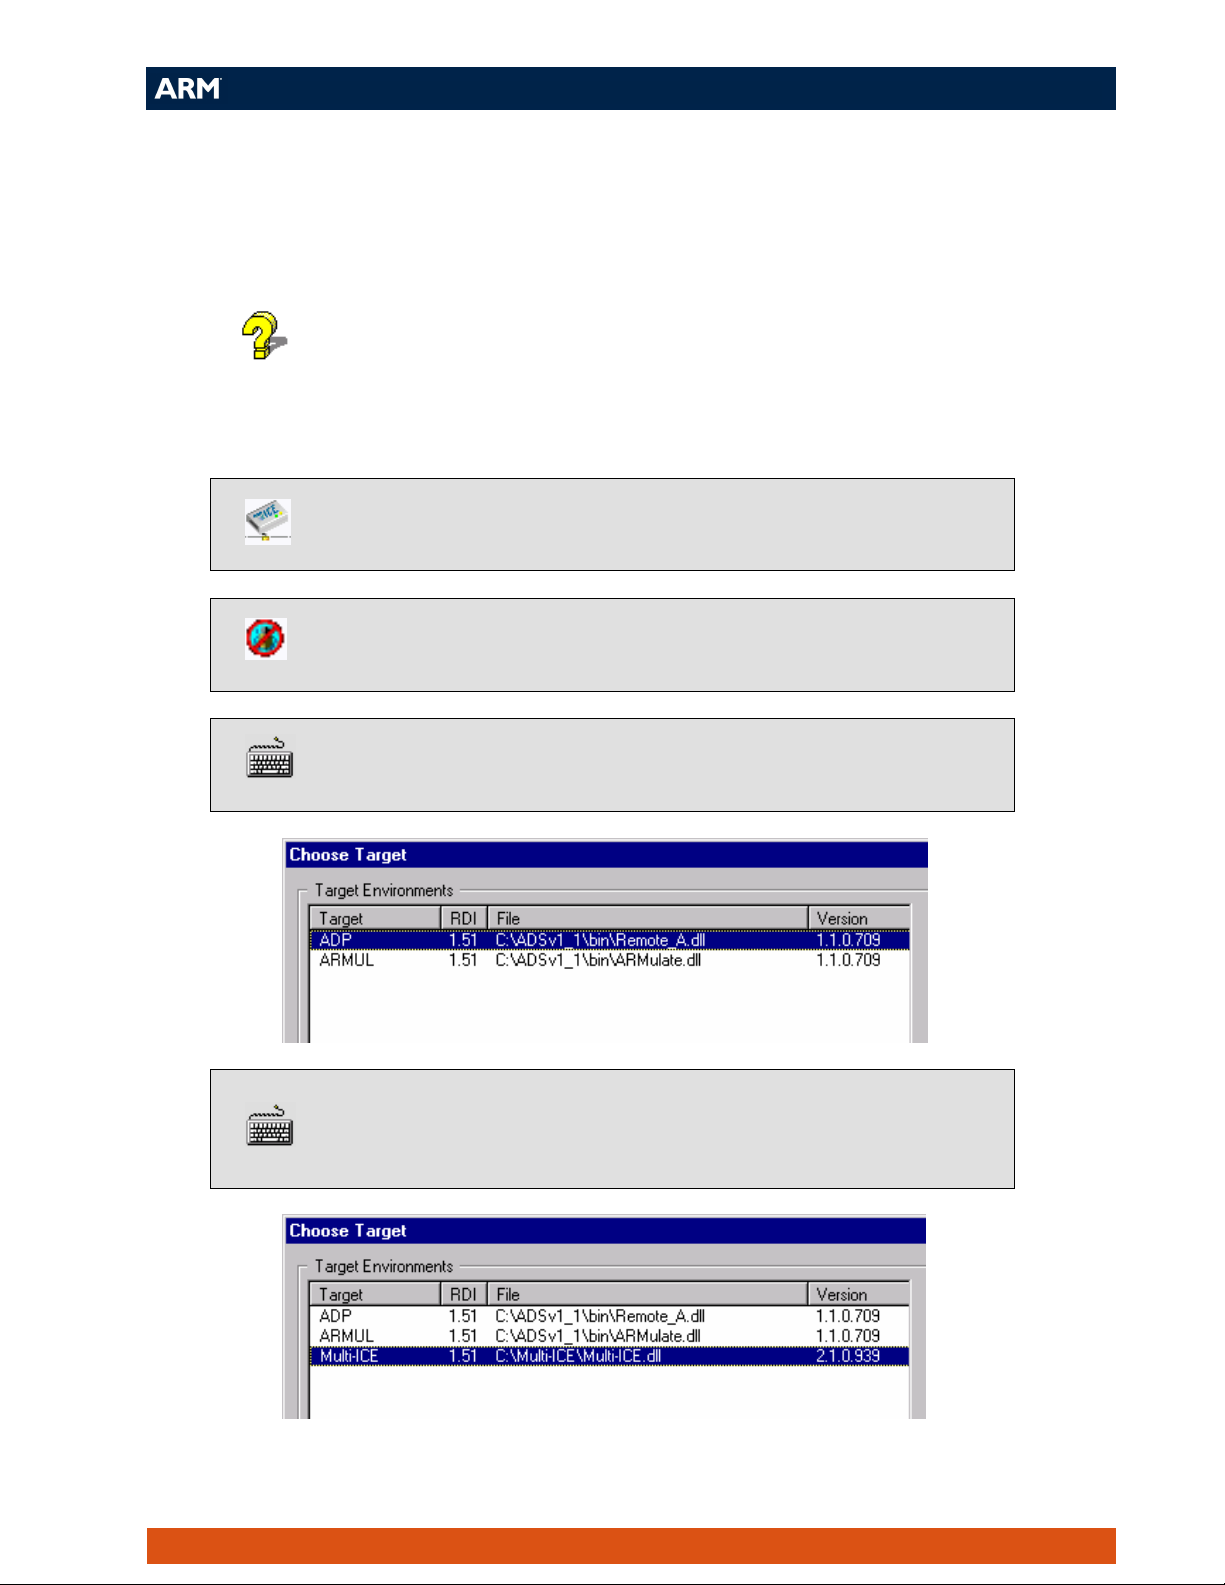
Select Options → Configure Target from the menu. The Choose
Target dialog appears:
Select the Multi-ICE.dll if available, if not click Add to locate the
Multi-ICE.dll (found in the Multi-ICE install directory) and then select
it:
ADS MultiTrace Tutorial 7
Page 8

Click Configure, to open the Multi-ICE configuration window (see
below)
If you see a Multi-ICE Welcome dialog, click OK.
Ensure This computer is selected as the location for the Multi-ICE
connection and that the Device selection frame shows the correct
target, then click on the Trace tab:
ADS MultiTrace Tutorial 8
Page 9
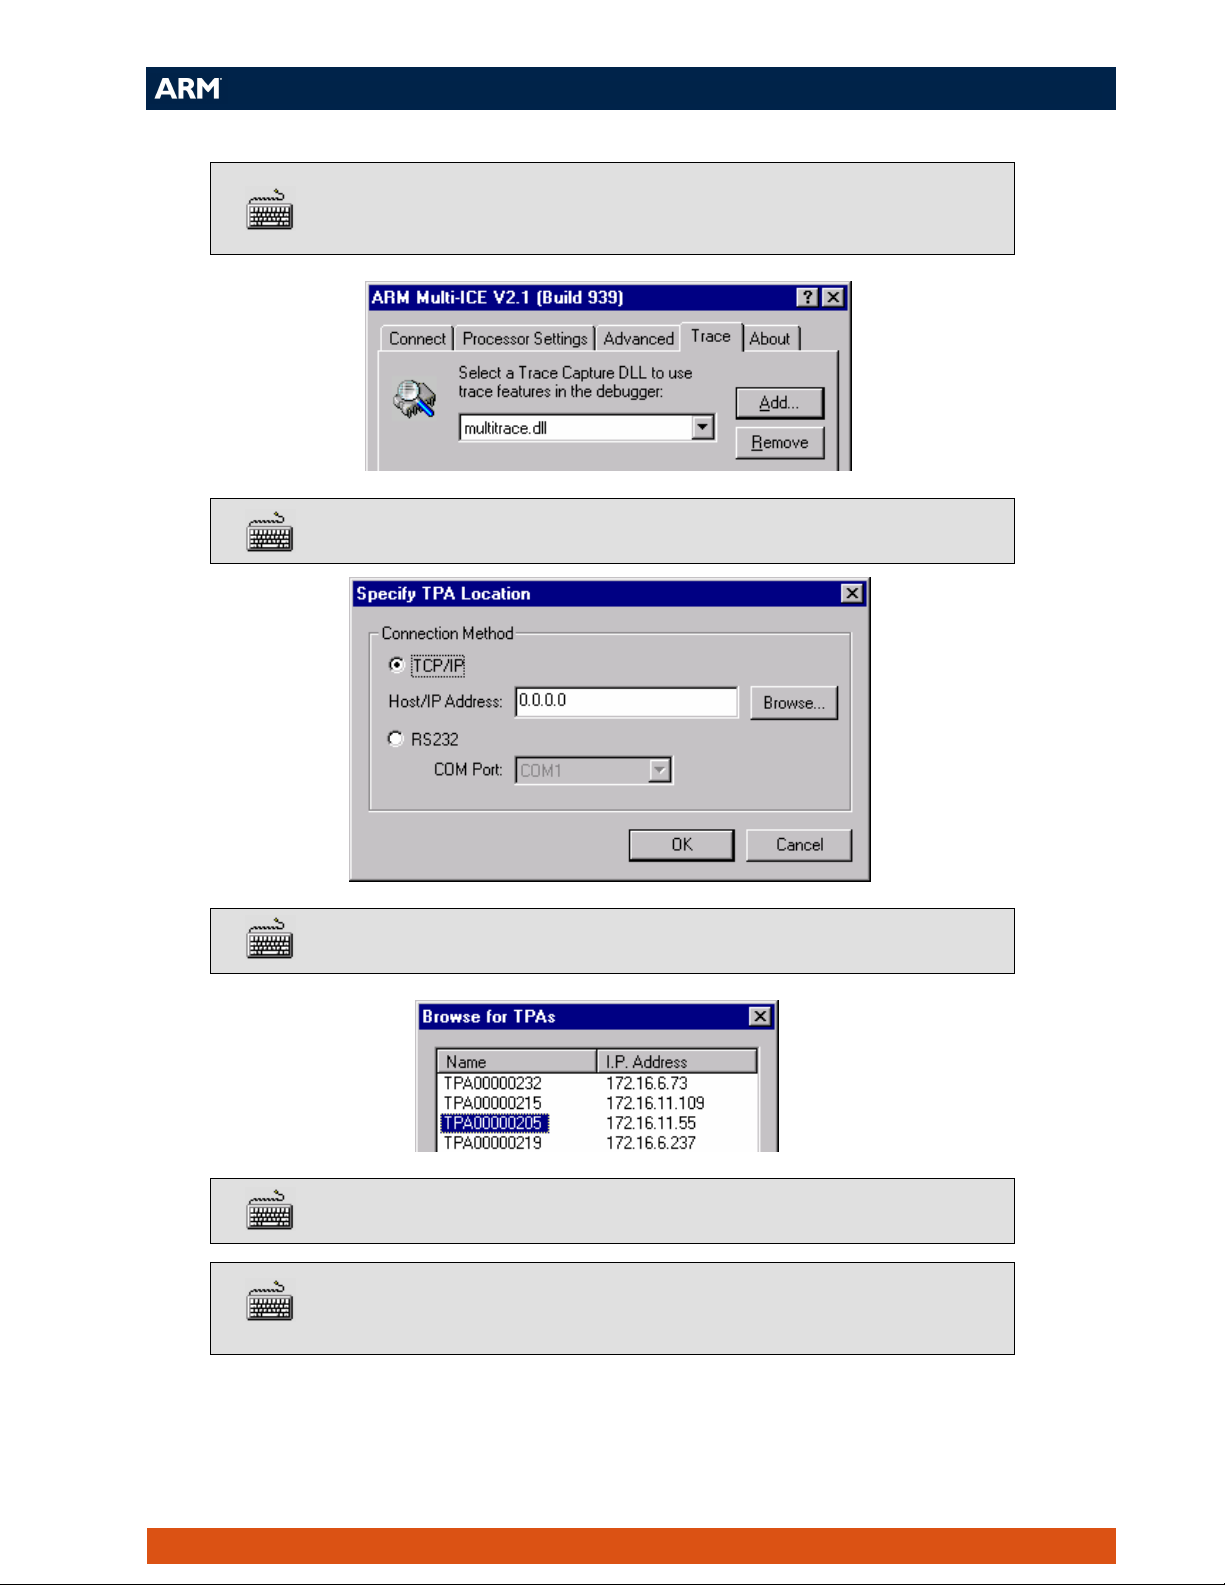
Click Add to locate the MultiTrace.dll (found in the MultiTrace install
directory):
Click Change Location to open the Specify TPA Location dialog:
Click Browse to open the Browse dialog:
Select the appropriate MultiTrace unit from the list and click OK.
Click OK again to close the Specify TPA Location dialog and return to
the Multi-ICE configuration window:
ADS MultiTrace Tutorial 9
Page 10

Click OK, then OK again to close both the Multi-ICE configuration
window and the Choose Target dialog.
ADS MultiTrace Tutorial 10
Page 11

2.2 – Performing Trace Capture
This section uses two simple examples to provide an introduction to using the tools to
perform trace capture.
The files needed for these examples can be found in:
c:\ads_tutorial\trace\
Example 1 – Tracing a function
This is a simple example that shows how trace capture can be done for a specific
function, writefunc.
Select System Views → Debugger Internals from the menu to open the
Debugger Internals window.
Double click in the Value column of the $top_of_memory variable
and enter 0x40000 as the new value.
Load the example image func.axf by selecting File → Load Image
from the menu or clicking on the Load Image button on the toolbar.
Open the Trace view window by selecting Processor Views → Trace
Open the Configure capture dialog by selecting Processor Views →
Trace → Configure Capture from the menu:
Highlight Enable Tracing and click Define Rule to open the Resource
Selection dialog (see over).
→
View Trace from the menu.
ADS MultiTrace Tutorial 11
Page 12

Highlight Enable Tracing in the actions list, then click the Define
Rule…button to display the Resource selection dialog box.
Select the Address Ranges to be Defined radio button then click Next.
Ensure Included Ranges is highlighted and click Add address range,
then click Next.
Ensure the Instruction execute radio button is selected and make the
following entries:
Address range:
%writefunc
%writefunc:$END
to:
ADS MultiTrace Tutorial 12
Page 13

Click Next, then click Finish to return to the Configure capture dialog:
Highlight Enable Data Tracing and click on Define Rule…
Ensure the Entire address space and Trace address and data radio
buttons are selected, then click Next.
ADS MultiTrace Tutorial 13
Page 14

Click Finish to return to the Configure capture dialog:
The necessary trace capture rules are now completely defined. Click
OK to close the Configure capture dialog.
Click Yes when asked if you would like to start tracing.
Start executing the image by selecting Execute → Go (F5) from the
AXD menu.
Execution halts at the breakpoint on main. Select Go again to continue
execution.
Enter a number between 1 and 10 when prompted for input.
ADS MultiTrace Tutorial 14
Page 15

Execution halts and the trace tools load the trace window with data reconstructed from
the trace capture buffer.
To view the trace data more clearly right click inside the trace window
pane and select Float within main window from the context menu.
View the C source code interleaved with the traced instructions by
right clicking in the trace window and selecting Interleave source from
the context menu.
Note how the instructions traced correspond to the operation of writefunc. The
successive writes to memory of the incremental values can also be clearly seen as the
<Word Write> entries.
ADS MultiTrace Tutorial 15
Page 16
Example 2 – Tracing a write to a global variable
This example shows how the ARMulator can be used to capture trace and how trace
capture can be turned on and off according to the value of a global variable.
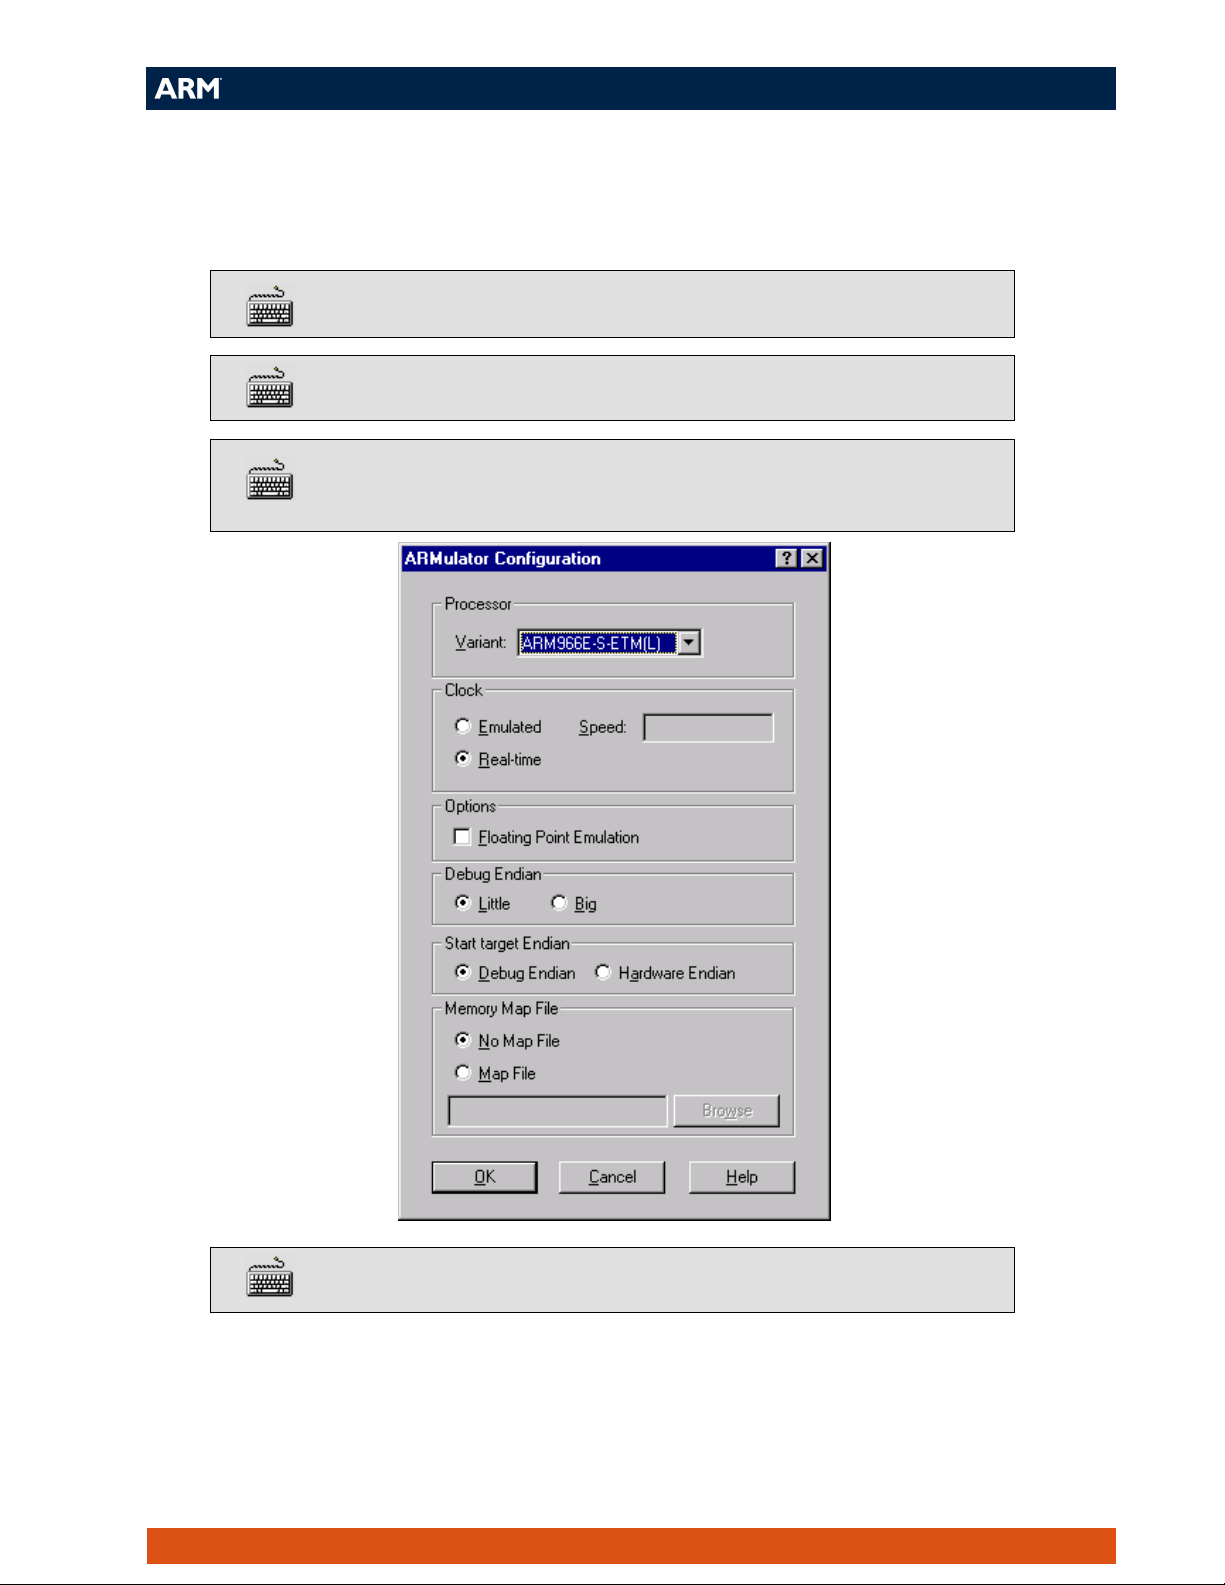
Select Options → Configure Target from the AXD menu.
Select ARMUL as the target and click Configure.
From the drop-down box select ARM966E-S-ETM(L) as your target
processor:
Click OK, then OK again
ADS MultiTrace Tutorial 16
Page 17

Click No when asked if you would like to reload the image.
Load the example image glob.axf by selecting File → Load Image
from the menu or clicking on the Load Image button on the toolbar.
Open the Configure capture dialog by selecting Processor Views →
Trace → Configure Capture from the menu:
Remove the current trace capture rules by clicking on Delete All Rules.
Highlight Enable Tracing and click Define Rule
In the Resource Selection dialog select the Address Range(s) to be
Defined radio button then click Next.
In the Define address range(s) dialog highlight Trace Start Points
and click on Add data point
ADS MultiTrace Tutorial 17
Page 18

In the Define address range(s) dialog highlight Trace Stop Points
and click on Add data point
Click Next and make the following entries in the Trace Start Data
Point dialog:
Address:
Addr. bits ignored:
Data access:
Data value:
Data filter:
&globvar
None
Writes
== 0x1
0xffffffff
ADS MultiTrace Tutorial 18
Page 19
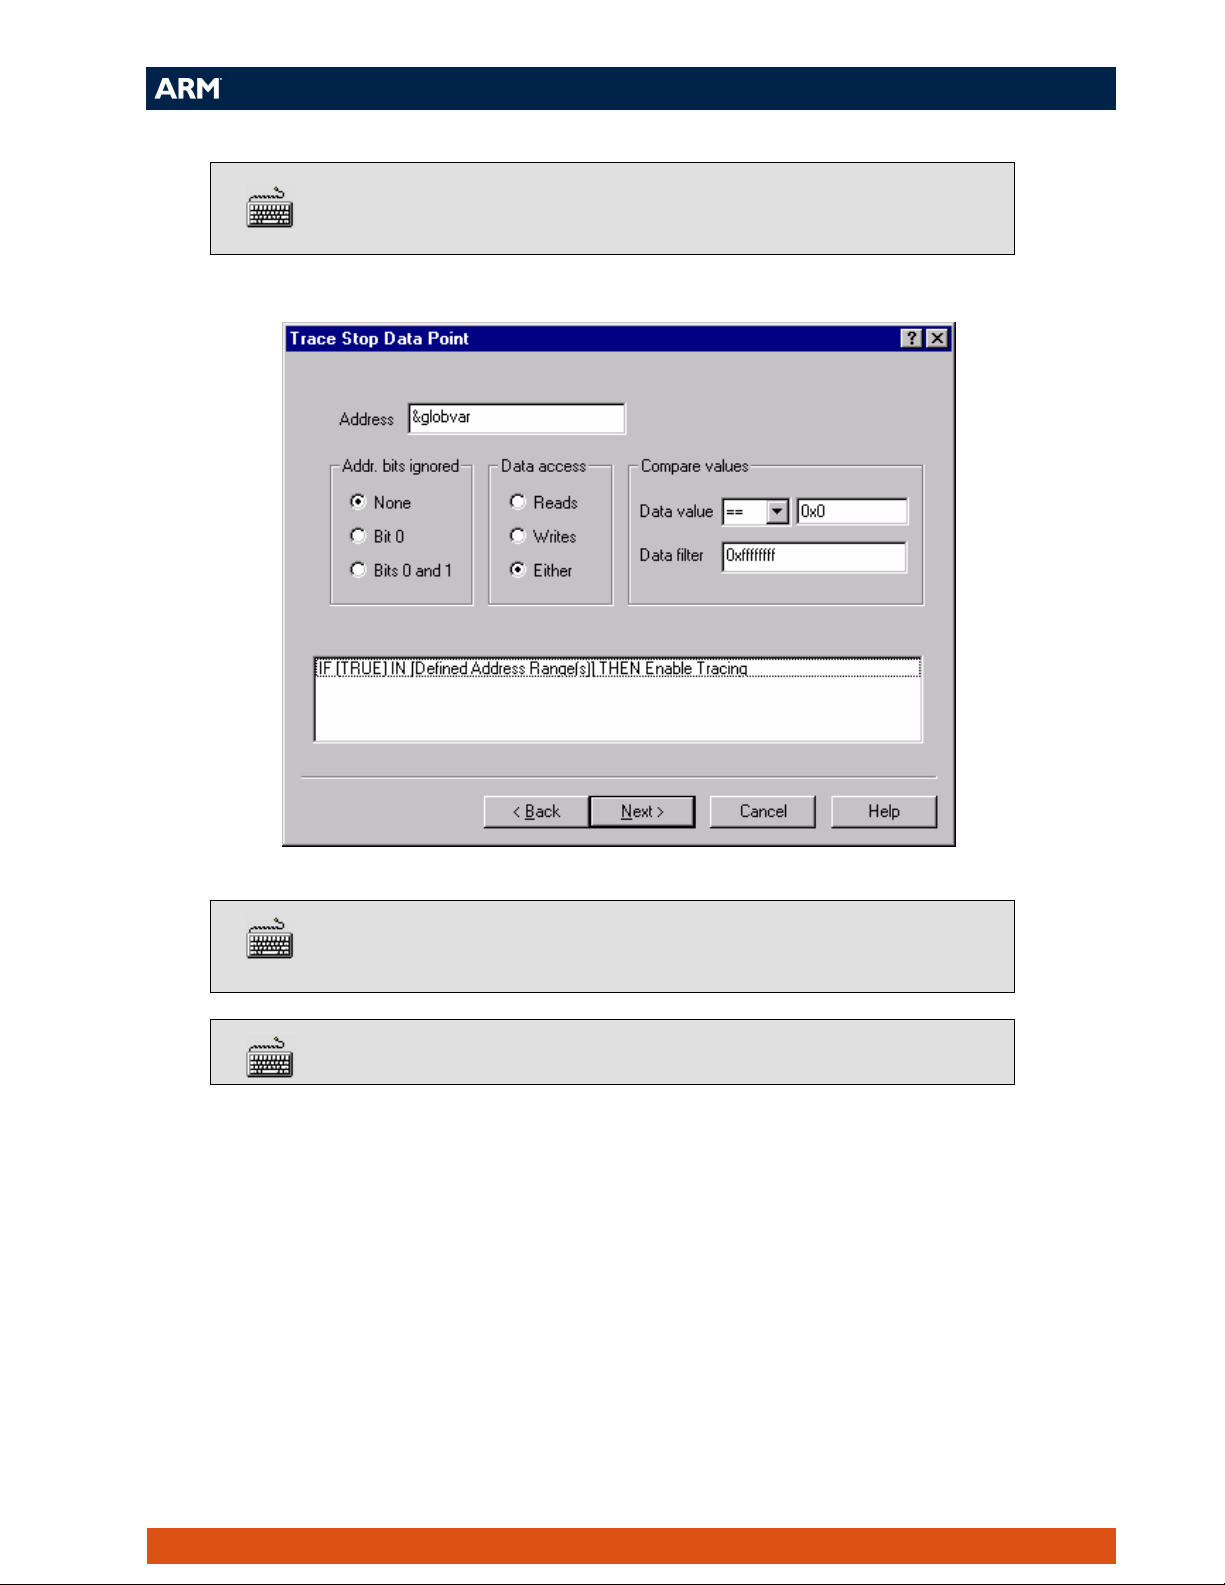
Click Next and use the same details to define the Trace Stop Data
Point except this time use the compare value:
Data value: ==0x0
Click Next to completely define the rule, then click Finish to return to
the Configure capture dialog.
Highlight Enable Data Tracing and click on Define Rule…
ADS MultiTrace Tutorial 19
Page 20
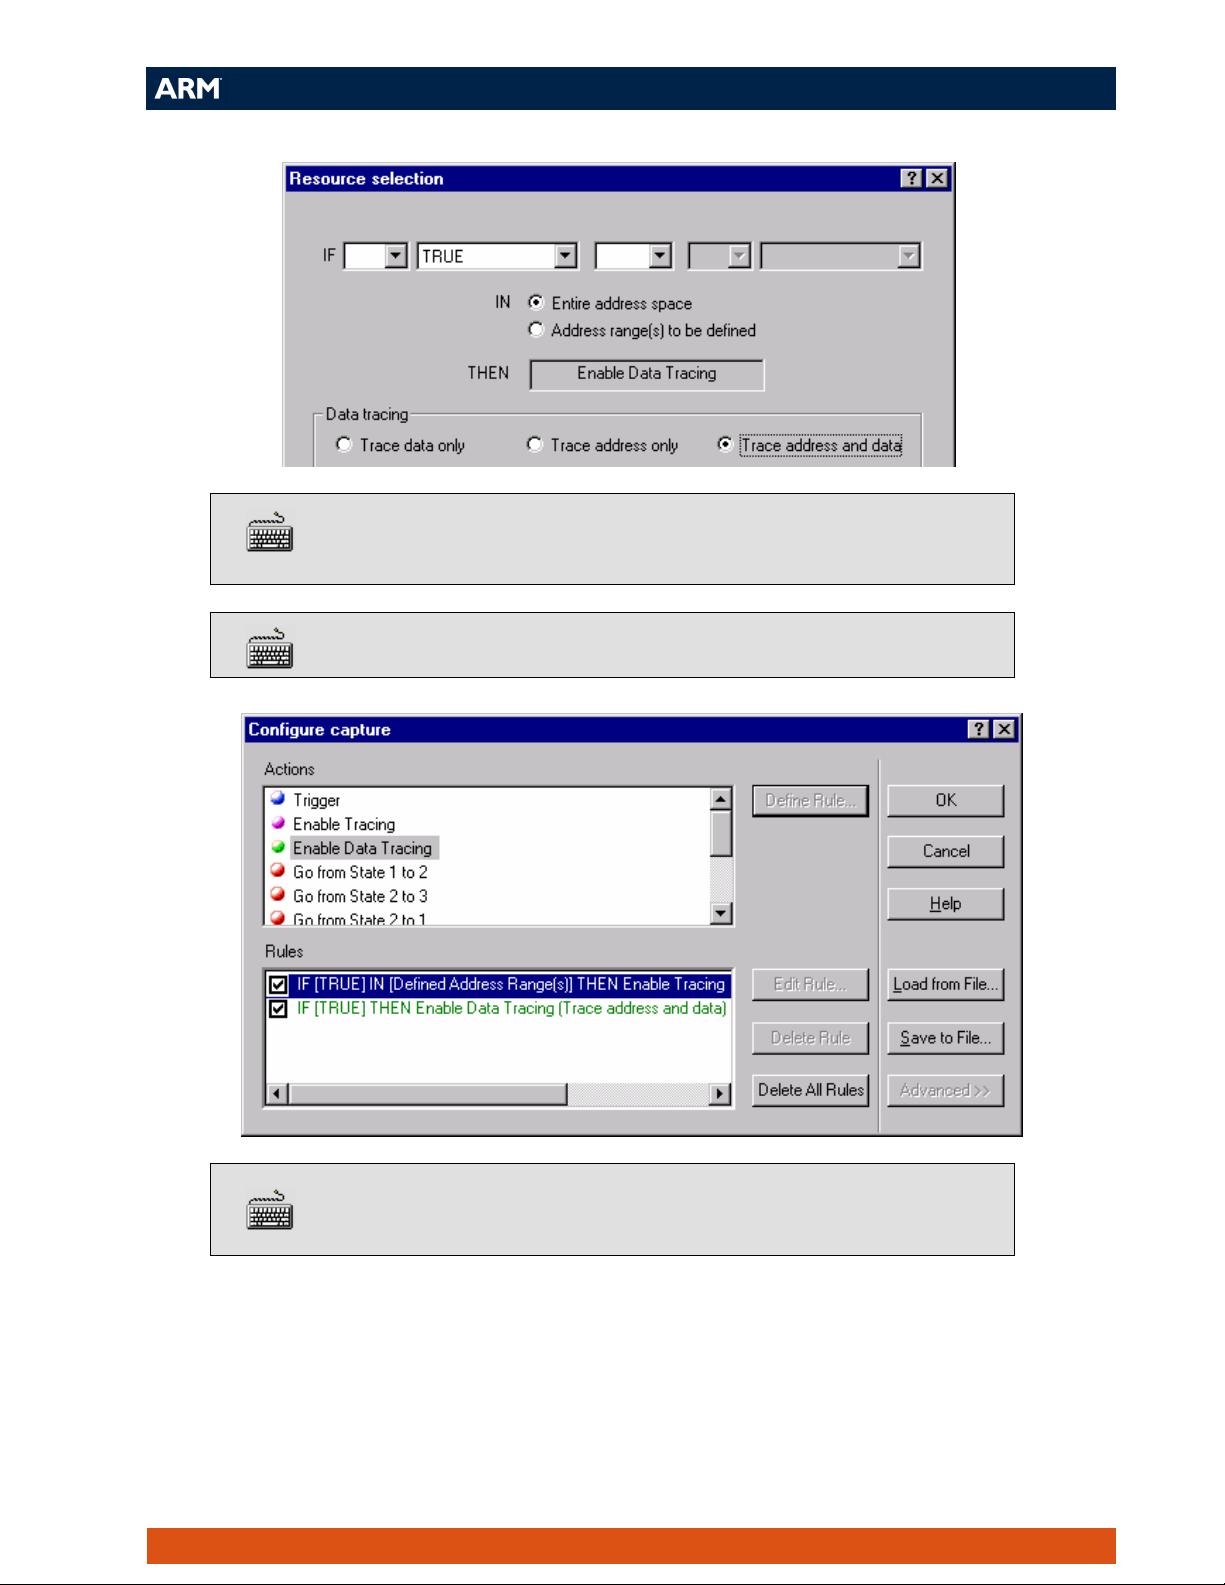
Ensure the Entire address space and Trace address and data radio
buttons are checked, then click Next.
Click Finish to return to the Configure capture dialog:
The necessary trace capture rules are now completely defined. Click
OK to close the Configure capture dialog.
ADS MultiTrace Tutorial 20
Page 21
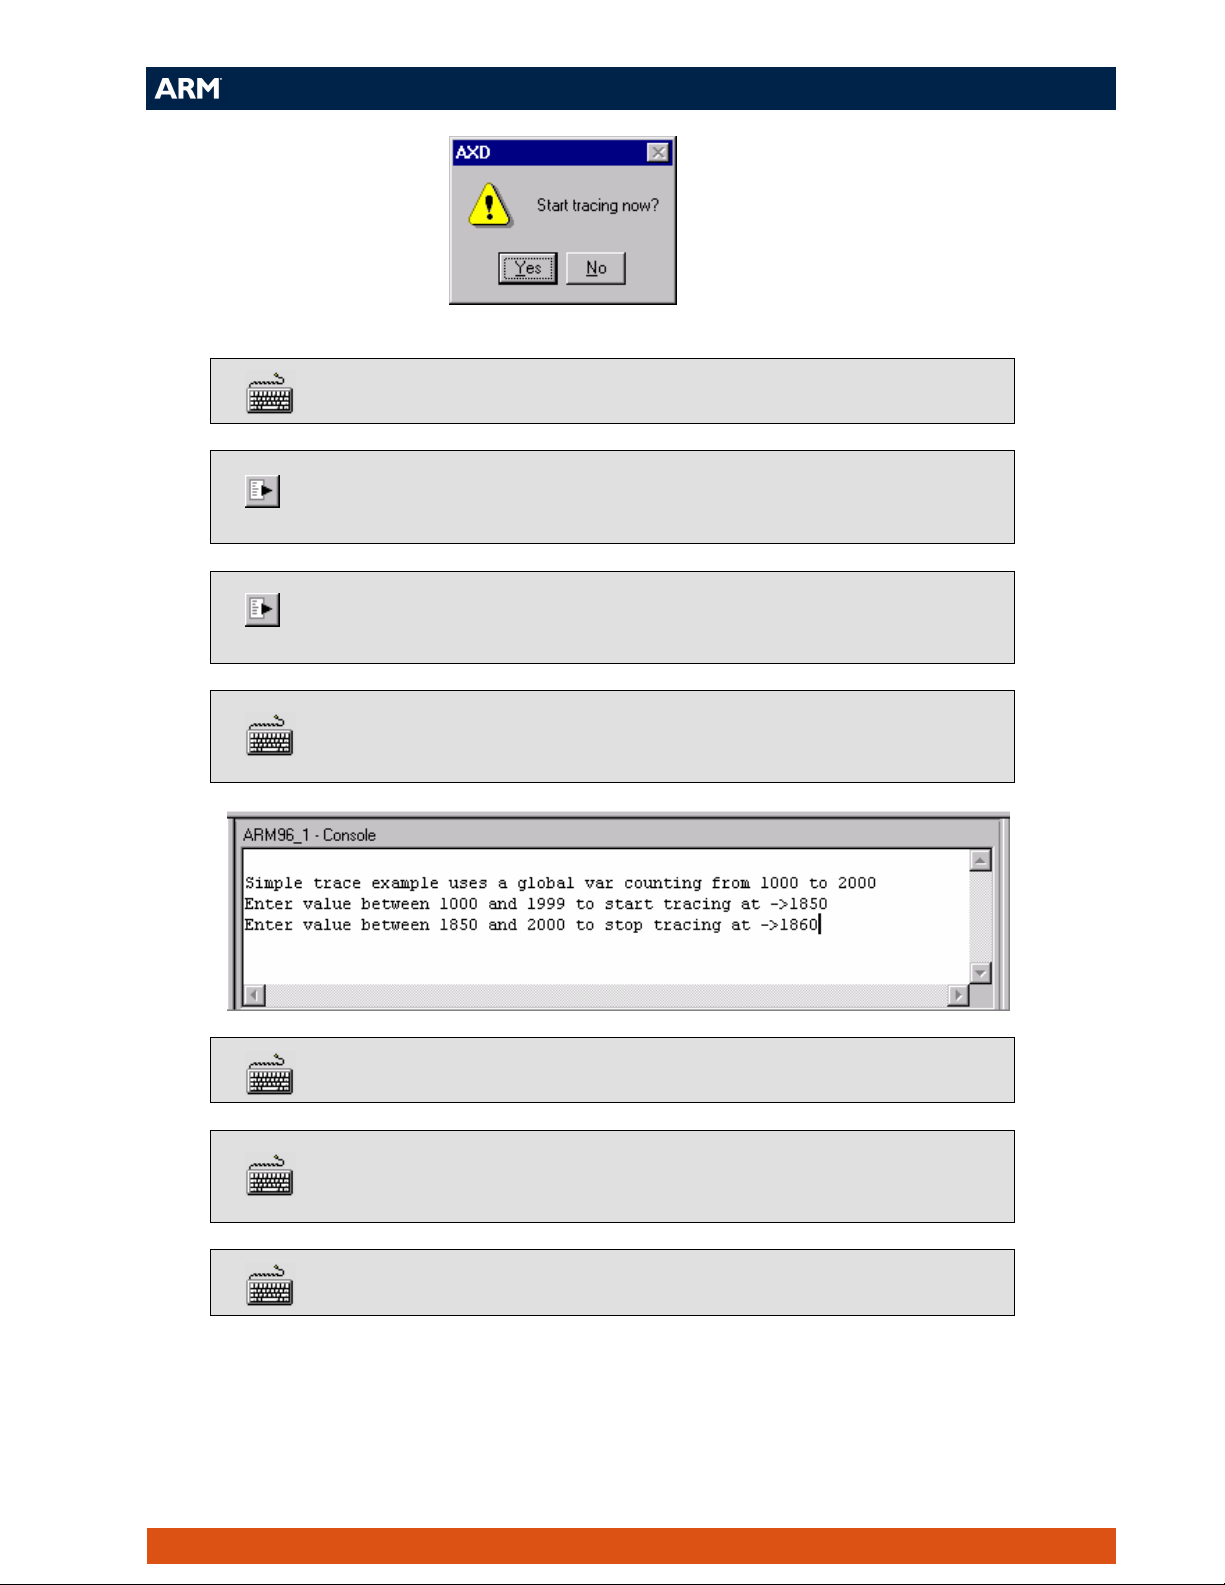
Click Yes when asked if you would like to start tracing.
Start executing the image by selecting Execute → Go (F5) from the
AXD menu.
Execution halts at the breakpoint on main. Select Go again to continue
execution.
When prompted enter two values at which to start and then stop trace
capture:
View the trace capture in the trace window
Right click inside the trace window and ensure the Interleave Source
option is checked
Right click in the Data column and select Format→Decimal
ADS MultiTrace Tutorial 21
Page 22
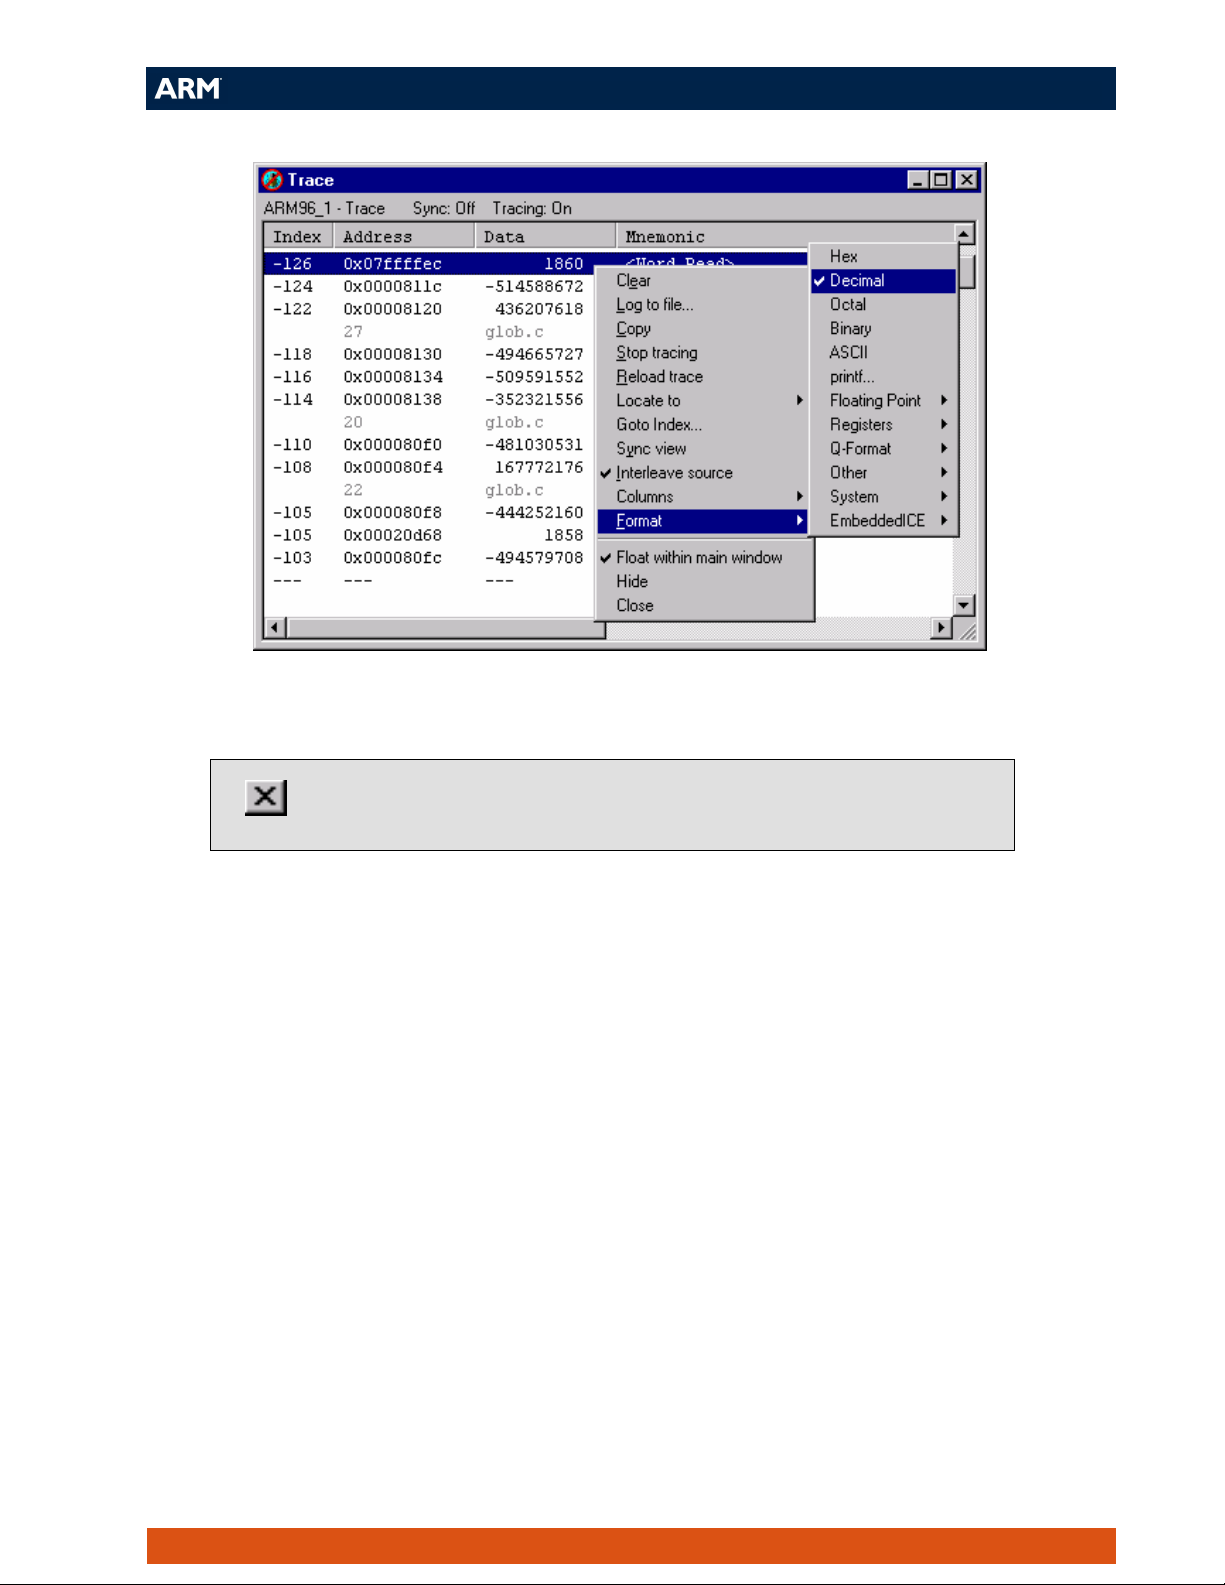
Note the instructions and data <Word Writes> traced correspond to the values
chosen.
Run the example again with different input values and trace capture
rules, or close AXD to finish the tutorial.
ADS MultiTrace Tutorial 22
 Loading...