


Engineer-to-Engineer Note EE-216
a
Technical notes on using Analog Devices DSPs, processors and development tools
Contact our technical support at dsp.support@analog.com and at dsptools.support@analog.com
Or vi sit our o n-li ne r esou rces htt p:/ /www.analog.com/ee-notes and http://www.analog.com/processors
Estimating Power Dissipation for ADSP-21262S SHARC® DSPs
Contributed by C. Coughlin December 2, 2003
Introduction
This EE-Note discusses power consumption of
the ADSP-21262S SHARC® DSPs based on
characterization data measured over power
supply voltage, core frequency (CCLK) and
ambient operating temperature (T
). The intent
A
of this document is to assist board designers in
estimating their power budget for power supply
design and thermal relief designs using the
ADSP-21262S DSP.
The ADSP-21262S DSP is a member of the
SIMD SHARC family of DSPs featuring Analog
Devices’ Super Harvard Architecture. Like other
SHARC DSPs, the ADSP-21262S is a 32-bit
processor optimized for high-precision signal
processing applications. The DSP operates at
core clock frequencies up to 200MHz with the
core operating at 1.2V (V
operating at 3.3V (V
DDEXT
).
) and the I/O
DDINT
Total power consumption has two components:
internal circuitry (i.e. the core and PLL) and
switching of external output drivers (i.e. the I/O).
The following sections detail how to derive both
of these components for estimating total power
consumption.
Estimating Internal Power Consumption
The internal power consumption (on the V
supply) is dependent on the instruction execution
sequence and the data operands involved. The
data sheet
[2]
provides current consumption
DDINT
figures for discrete activity levels. Mapping
system application code to specified values
provides a means of estimating internal power
consumption for an ADSP-21262S DSP in a
given application.
Internal Power Vector Definitions and Activity Levels
The following power vector definitions define
the levels of activity that apply to the internal
power vectors shown in Table 1:
• I
DD-IDLE
V
supply current for Idle
DDINT
activity. Idle activity is the core executing the
IDLE instruction only, without core memory
accesses, DMA, or interrupts.
• I
DD-INLOW
V
supply current for Low
DDINT
activity. Low activity is the core executing a
single-function instruction fetched from
internal memory with no core memory
accesses and no DMA.
• I
DD-INHIGH VDDINT
supply current for High
activity. High activity is the core executing a
multifunction instruction fetched from
internal memory, with 4 core memory
accesses per CLKIN cycle (DMx64) and
DMA through 3 SPORTs running @ 50MHz.
The DMA is chained to itself (running
continuously) and does not use interrupts.
The bit pattern for each core memory access
and DMA is random.
• I
DD-INTYP
Same code as High activity,
however, operating under nominal power
Copyright 2003, Analog Devices, Inc. All rights reserved. Analog Devices assumes no responsibility for customer product design or the use or application of
customers’ products or for any infringements of patents or rights of others which may result from Analog Devices assistance. All trademarks and logos are property
of their respective holders. Information furnished by Analog Devices Applications and Development Tools Engineers is believed to be accurate and reliable, however
no responsibility is assumed by Analog Devices regarding technical accuracy and topicality of the content provided in Analog Devices’ Engineer-to-Engineer Notes.

a
supply conditions (V
= 1.2V) and TA =
DDINT
+25°C.
• I
DD-INPEAK VDDINT
supply current for Peak
activity. Peak activity is the core executing a
multifunction instruction fetched from
internal memory and/or cache, with 8 core
memory accesses per CLKIN cycle (DMx64,
PMx64) and DMA through 6 SPORTs
running @ 50MHz. The DMA is chained to
itself (running continuously) and does not use
interrupts. The bit pattern for each core
memory access is random, and the DMA bit
pattern is worst case.
Vector
I
T
DD-IDLE
I
DD-INLOW
I
DD-INHIGH
I
DD-INTYP
I
DD-INPEAK
T
T
T
T
Test Conditions (worst case except where noted)
= +70°C, V
A
= +70°C, V
A
= +70°C, V
A
= +25°C, V
A
= +70°C, V
A
= Max, CCLK = Max 0.70 0.70
DDINT
= Max, CCLK = Max 0.85 0.85
DDINT
= Max, CCLK = Max 1.00 1.00
DDINT
= 1.2V, CCLK = 200MHz 0.50 0.50
DDINT
= Max, CCLK = Max 1.26 1.06
DDINT
Table 1 lists the maximum internal current
consumption for the DSP at different levels of
activity. These figures represent the worst case
I
as measured across process, voltage,
DDINT
temperature, and frequency (PVTF). From these
internal activity levels (and from an
understanding of the program flow using
profiling or some other method), you can
calculate a worst-case weighted-average of
power consumption for each ADSP-21262S DSP
in a system.
1
I
(A) 2 I
DDINT
DDINT
(A) 3
Table 1: Maximum Internal Current Consumption per Vector Type
1
Worst-case conditions: TJ < +125°C, V
2 Worst case across process, voltage, temperature and frequency (PVTF) for 136-ball mBGA package option. See “Estimating Total Power
Consumption and Power Budget” for more information pertaining to the power budget and the mBGA package option.
3 Worst case across process, voltage, temperature and frequency (PVTF) for 144-lead LQFP package option. See “Estimating Total Power
Consumption and Power Budget” for more information pertaining to the power budget and the LQFP package option.
DDEXT
= 3.47V, V
= 1.26V, CCLK = 200MHz; does not apply to I
DDINT
DD-INTYP
Operation Low Activity High Activity Peak Activity
Instruction Type Single Function Multifunction Multifunction
Instruction Fetch Internal Memory Internal Memory Internal Memory, Cache
4
Core Memory Access
DMA Transmit Int to Ext N/A 3 SPORTs running @ 50 MHz 6 SPORTs running @ 50MHz
Data Bit Pattern for core
Memory Access and DMA
None 4 per tCK cycle (DMx64) 8 per tCK cycle (DMx64, PMx64)
N/A Random Worst case
Table 2: Activity Level Definitions
4 tCK = CLKIN; Core clock ratio 8:1
Estimating Power Dissipation for ADSP-21262S SHARC® DSPs Page 2 of 9
a
Table 2 summarizes low, high and peak activity
levels corresponding to the vectors listed in
Table 1.
The average current consumption for an ADSP21262S device in a specific application is
calculated according to the following formula,
where “%” is the percentage of the time that the
application spends in that state.
% Peak Activity Level * I
% High Activity Level * I
% Low Activity Level * I
% Idle Activity Level * I
---------------------------------------------Total Current for V
Equation 1: Internal Current (IDDINT) Calculation
DDINT
DD-INPEAK
DD-INHIGH
DD-INLOW
DD-IDLE
(I
DDINT
)
Estimated average internal power consumption
(P
Equation 2: Internal Power (PDDINT) Calculation
) can then be calculated as follows:
DDINT
P
DDINT
= V
DDINT
x I
DDINT
30% * 1.26
30% * 1.00
20% * 0.85
20% * 0.70
-------------------
I
= 0.988 A
DDINT
Example 2: Internal Current Estimation Example
Therefore, an estimate of the average internal
power for the processor can be calculated from
Example 2 as follows:
P
= 1.20 V x 0.988 A = 1.1856 W
DDINT
Example 3: Internal Power Estimation
Estimating External Power Consumption
The external power consumption (on the V
supply) is dependent on the switching of the
output pins. The magnitude of the external power
depends on:
DDEXT
For example, after profiling the application code
for a particular system, activity is determined to
be proportioned a:
Peak Activity Level 30%
High Activity Level 30%
Low Activity Level 20%
Idle Activity Level 20%
• The number of output pins (O) that switch
during each cycle
• The maximum frequency (f) at which the
output pins can switch
• The voltage swing of the output pins (V
• The load capacitance of the output pins (C
DDEXT
L
)
In addition to the input capacitance of each
device connected to an output, the total load
capacitance includes the capacitance (C
OUT
) of
the DSP pin itself which is driving the load. The
Example 1: Internal System Activity Levels
Using the percentages in this example and the
currents provided for each activity level in Table
1 (mBGA package used for this example), a
value for the worst case average internal current
consumption of a single processor is estimated as
follows:
parallel port address/data pins (AD15-0) can
transfer data at 1/3 the DSP core clock rate. This
corresponds to a maximum switching frequency
of 33MHz for AD15-0 and 66MHz for
/WR at a
core clock rate of 200MHz. In addition, the serial
ports can operate up to 1/8 the DSP core clock
rate. This corresponds to a maximum switching
frequency of 12.5MHz for SDATA and a
Estimating Power Dissipation for ADSP-21262S SHARC® DSPs Page 3 of 9
)

a
maximum switching frequency of 25MHz for
SCLK at a core clock rate of 200MHz.
Equation 3 shows how to calculate the average
external current (I
) using the above
DDEXT
parameters:
I
= O x f x V
DDEXT
Equation 3: External Current (IDDEXT) Calculation
DDEXT
x C
L
Estimated average external power consumption
(P
Equation 4: External Power (P
) can then be calculated as:
DDEXT
P
= V
DDEXT
DDEXT
x I
DDEXT
) Calculation
DDEXT
Using the sample configuration shown in Figure
1, we can estimate the external current and
thereby the external power consumption with the
following assumptions:
• DSP core running at 200MHz (CCLK)
• 64K x 16-bit external memory, C
= 10pF 9
L
• 16-bit external latch (used to hold the address
when accessing external memory), C
5
10pF
=
L
• AD15-0 can transfer data at a rate of 1/3 *
CCLK, with 50% of the pins switching
• External memory write cycles can occur at a
rate of 1/6 * CCLK (32-bit transfer to 16-bit
external memory)
• DAI configured to transmit and receive 32-
bit words at 1/8 * CCLK, C
• Output capacitance of DSP pin, C
Using Equation 3, I
can then be calculated
DDEXT
= 10pF 5
L
OUT
= 4.7pF
for each class of pins that can drive as shown in
Table 3.
9
Trace capacitance is ignored
Figure 1: ADSP-2126x System Sample Configuration
Estimating Power Dissipation for ADSP-21262S SHARC® DSPs Page 4 of 9

a
Pin Type No. of Pins Switching (%) F (MHz) V
AD15-0
RD
WR
ALE
FLAG0
DAI_P18 (SCLK)
DAI_P19 (FS)
DAI_P20 (SDATA)
Table 3: External Current (I
16 50 66.67 3.3V 4.7 + (2 x 10) 0.0434
1 0 n/a 3.3V 4.7 + (1 x 10) 0.0000
1 100 33.33 3.3V 4.7 + (1 x 10) 0.0016
1 100 33.33 3.3V 4.7 + (1 x 10) 0.0016
1 0 n/a 3.3V 4.7 + (1 x 10) 0.0000
1 100 50 3.3V (2 x 4.7) + (2 x 10) 0.0048
1 100 1.5 3.3V (2 x 4.7) + (2 x 10) 0.0001
1 100 25 3.3V 4.7 + (1 x 10) 0.0012
) Summary for Figure 1.
DDEXT
Summing the individual currents from Table 3, the total
external current (I
) for the example configuration
DDEXT
shown in Figure 1 is 0.0527 A. Using this current, the
estimated average external power can then be calculated
as:
P
= 3.3 V x 0.0527 A
DDEXT
= 0.1739 W
Example 4: External Power (P
At T
= +70
A
°
C, the P
TOTAL
) Calculation
DDEXT
for any ADSP-2126x
should not exceed 1.95W in the mBGA or 1.69W
in the LQFP package for proper DSP operation.
Power consumption greater than these limits
(V) C (pF) I
DDEXT
DDEXT
(A)
(1.95W or 1.69W) could result in permanent
damage to the DSP.
TJ = P
TOTAL
x θJA + T
A
Equation 5: Junction Temperature (TJ ) Calculation
Table 4 contains examples of power supply
currents that satisfy the total power budget for an
ADSP-2126x DSP in an mBGA package
operating at T
using V
DDMAX
= +70
A
for each power supply:
°
C. Power is calculated
I
(A) I
DDINT
0.9 0.231 0.01 1.134 0.8016 0.0126 1.95
1.0 0.195 0.01 1.260 0.6774 0.0126 1.95
1.1 0.159 0.01 1.386 0.5514 0.0126 1.95
1.2 0.123 0.01 1.512 0.4254 0.0126 1.95
(A) AIDD (A) P
DDEXT
(W) P
DDINT
(W) P
DDEXT
(W) P
PLL
TOTAL
(W)
Table 4: Power Supply Currents and Total Power Budget
** Note: the total power budget (P
insure that the maximum junction temperature (T
For additional information regarding the power
budget and its relationship to the thermal
) can be increased by reducing the ambient operating temperature (TA). However, the user must
TOTAL
), as defined by Equation 6, does not exceed +125°C.
J
Thermal Characteristics section of ADSP-2126x
data sheet.
characteristics of the ADSP-2126x DSP, see the
Estimating Power Dissipation for ADSP-21262S SHARC® DSPs Page 5 of 9

a
Estimating Total Power Consumption and Power Budget
For a particular system, the total power budget is
equal to the sum of the individual components:
P
= P
TOTAL
Equation 6: Total Power (P
DDINT + PDDEXT
TOTAL
where:
P
Average internal power consumption
DDINT
as defined by Equation 2
P
Average external power consumption
DDEXT
as defined by Equation 4
P
Power consumption due to the PLL
PLL
as defined by (AI
the max value for AI
listed in the data sheet
For ADSP-2126x DSPs, the total power budget
is limited to 1.95W (mBGA package) and 1.69W
(LQFP package). The power budget is
determined by the package thermal resistance
(θ
), 28.2°C/W for the mBGA and 32.5°C/W for
JA
+ P
PLL
) Calculation
x AVDD) where
DD
and AVDD is
DD
the LQFP, a maximum operating temperature
(T
) of +70°C and a maximum junction
A
temperature (T
) of +125°C. Equation 5 shows
J
the relationship between these three parameters
and power:
I
versus Voltage, Frequency and Operating
DDINT
Temperature
The following section contains graphs of I
DDINT
for various activity levels versus the specified
ranges of processor core voltage (V
DDINT
),
operating frequency (CCLK) and ambient
operating temperature (T
represent the mean value for I
). Each of these curves
A
across
DDINT
process, voltage, temperature and frequency
(PVTF). These graphs provide the system
designer with data showing the effect of core
voltage, processor operating frequency and
ambient operating temperature on internal power
consumption (P
). With this information, a
DDINT
system can be designed to meet the power budget
requirements of an ADSP-2126x DSP as
discussed in the previous section of this EENote.
Estimating Power Dissipation for ADSP-21262S SHARC® DSPs Page 6 of 9
a
I
DD-INLOW
0.45
0.4
0.35
0.3
0.25
(A)
DDINT
I
0.2
0.15
0.1
0.05
0
versus. Voltage, Frequency and Operating Temperature
I
vs V
DD-INLOW
(CCLK = 200MHz and V
1.14 1.20 1.26
DDINT
= 3.3V)
DDEXT
0.45
0.4
0.35
0.3
TA = 0C
TA = 25C
TA = 70C
(V)
V
DDINT
0.25
(A)
DDINT
I
0.2
0.15
0.1
0.05
0
I
vs Ambient Operating Temp (TA)
DD-INLOW
(CCLK = 200MHz and V
0.45
DDEXT
= 3.3V)
I
vs CCLK FREQ
DD-INLOW
(T
= +70oC and V
A
100 150 200
CCLK (MHz)
DDEXT
= 3.3V)
1.14V
1.20V
1.26V
0.4
0.35
0.3
0.25
(A)
DDINT
I
0.2
0.15
0.1
0.05
0
02570
(oC)
T
A
1.14V
1.20V
1.26V
Estimating Power Dissipation for ADSP-21262S SHARC® DSPs Page 7 of 9

a
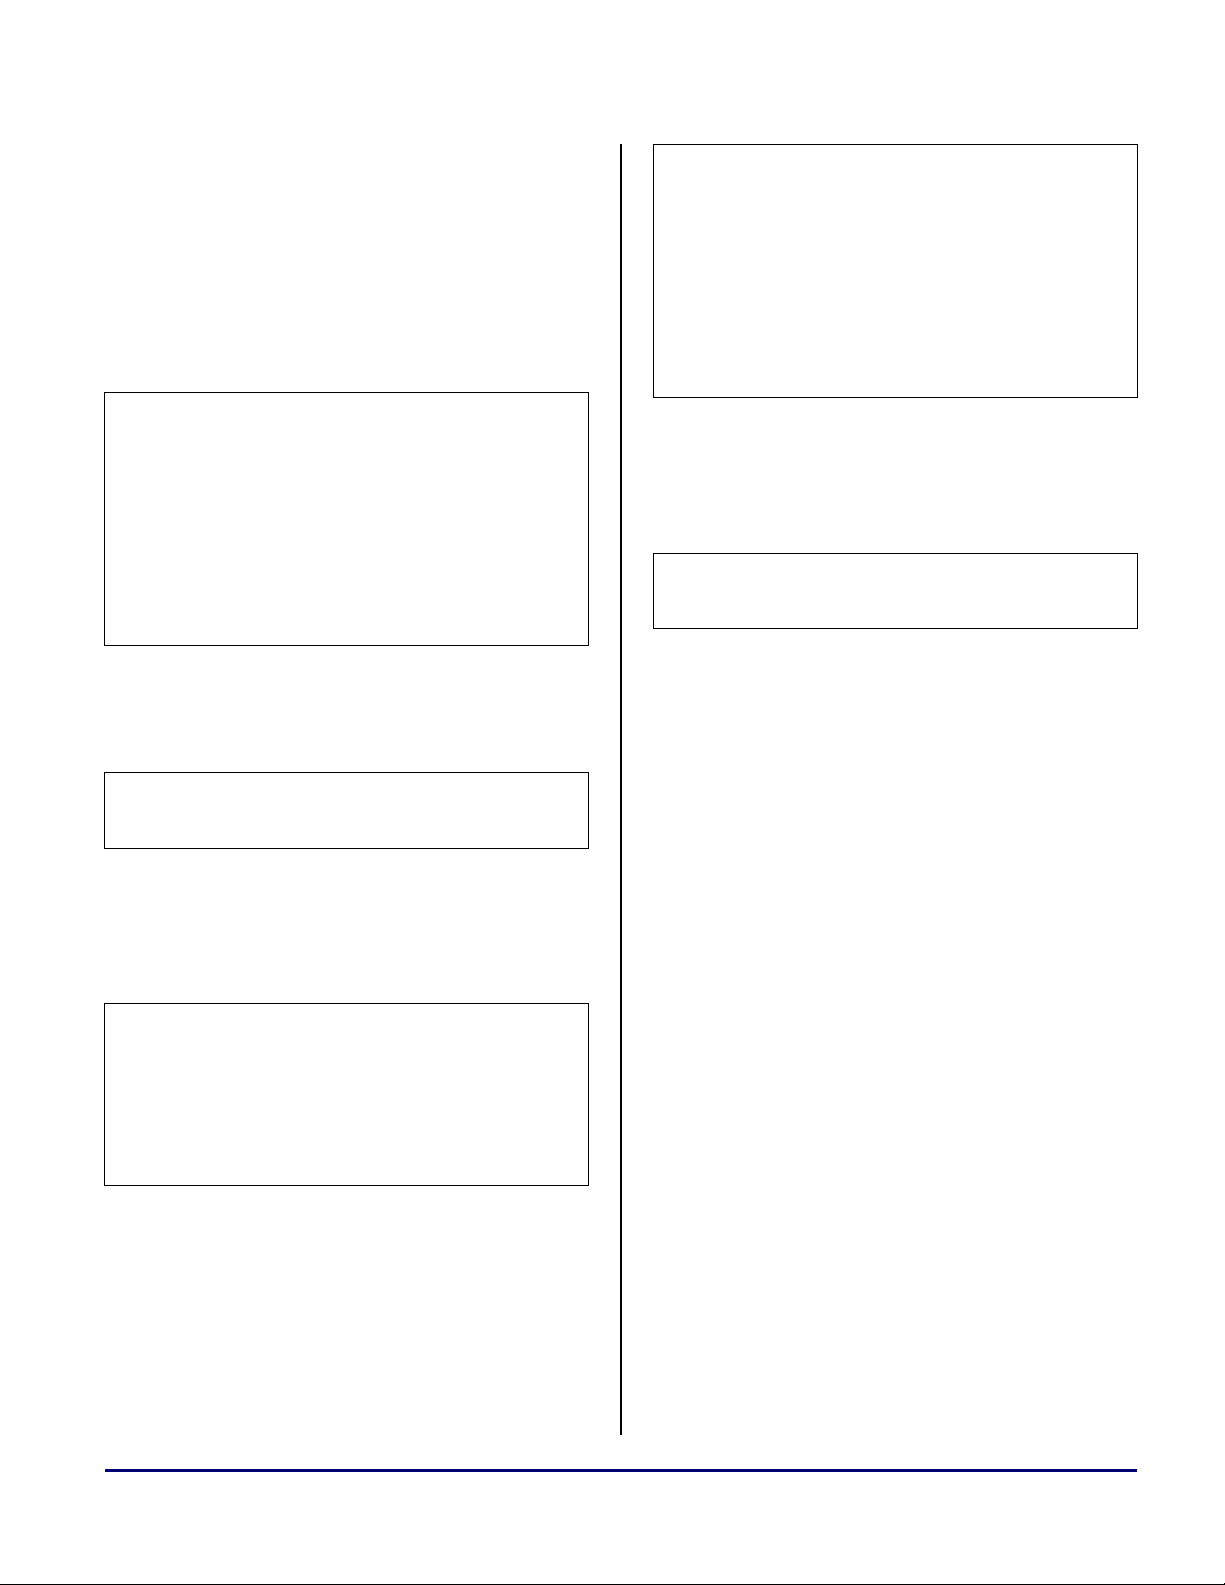
I
DD-INHIGH
versus Voltage, Frequency and Operating
Temperture
0.6
0.5
0.4
(A )
0.3
DDINT
I
0.2
0.1
0
I
vs V
DD-INHIGH
(CCLK = 200MHz, V
1.14 1.20 1.26
DDINT
= 3.3V)
DDEXT
(V)
V
DDINT
TA = 0C
TA = 25C
TA = 70C
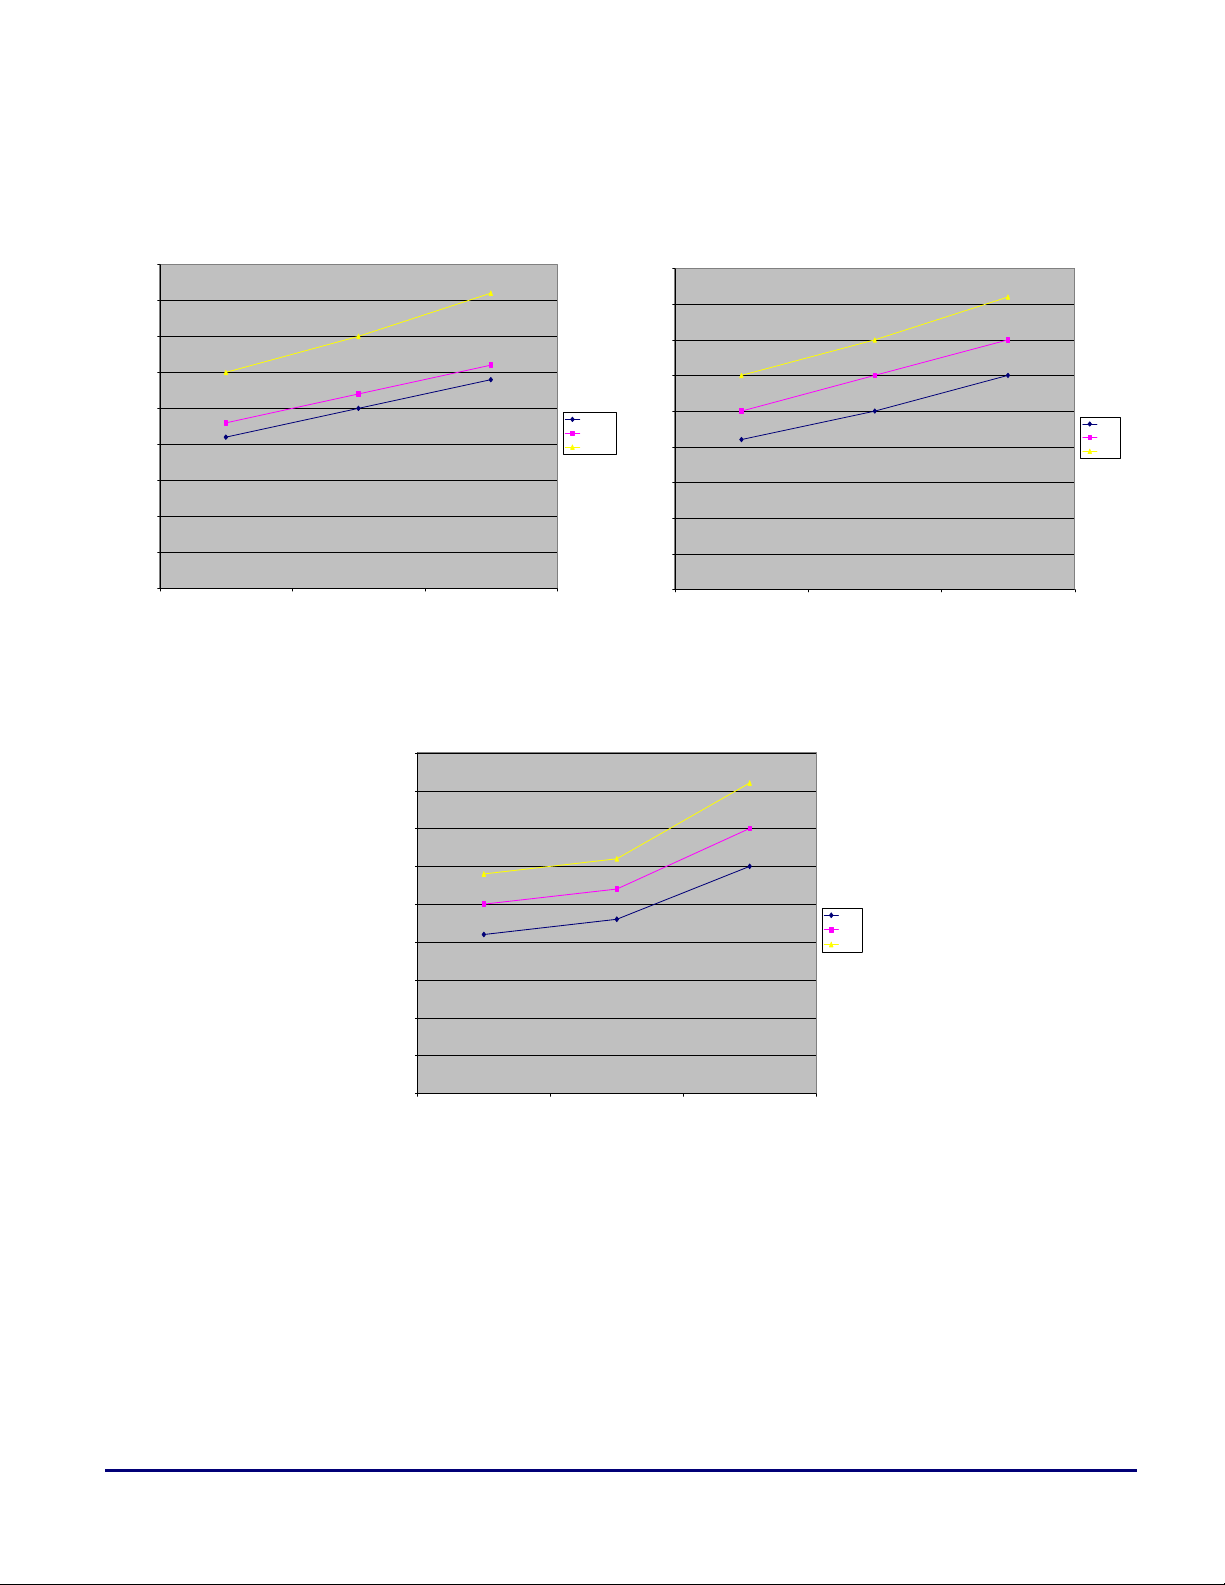
I
DD-INPEAK
versus Voltage, Frequency and
Operating Temperature
I
DD-INPEAK
0.8
0.7
0.6
0.5
(A)
0.4
DDINT
I
0.3
0.2
0.1
0
1.14 1.20 1.26
(CCLK = 200MHz, V
V
DDINT
(V)
vs V
DDINT
DDEXT
= 3.3V)
TA = 0C
TA = 25C
TA = 70C
I
vs CCLK FREQ
DD-INHIGH
= +70oC and V
(T
0.6
0.5
0.4
(A )
0.3
DDINT
I
0.2
0.1
0
100 150 200
A
CCLK (MHz)
DDEXT
= 3.3V)
1.14V
1.20V
1.26V
0.8
0.7
0.6
0.5
(A )
0.4
DDINT
I
0.3
0.2
0.1
0
100 150 200
I
DD-INPEAK
(T
= +70oC and V
A
CCLK (MHz)
vs CCLK FREQ
= 3.3V)
DDEXT
1.14V
1.20V
1.26V
Estimating Power Dissipation for ADSP-21262S SHARC® DSPs Page 8 of 9

0.6
0.5
I
vs Ambient Operating Temp (T
DD-INHIGH
DDEX
d V
= 3.3V) (CCLK = 200MHz an
T
a
I
vs Ambient Operating Temp (TA)
)
A
0.8
0.7
0.6
DD-INPEAK
(CCLK = 200MHz and V
DDEXT
= 3.3V)
(A)
DDINT
I
0.4
0.3
0.2
0.1
0
0 2
5
O
T
(
C)
A
70
1.14V
1.20V
1.26V
0.5
(A)
0.4
DDINT
I
0.3
0.2
0.1
0
02570
(OC)
T
A
1.14V
1.20V
1.26V
References
[1] ADSP-2126x SHARC DSP Hardware Reference. December 2003. Analog Devices, Inc.
[2] ADSP-21262 SHARC DSP Microcomputer Data Sheet. Rev. 0. December 2003. Analog Devices,
Inc.
Document History
Version Description
December 02, 2003 by R. Murphy Initial Release
Estimating Power Dissipation for ADSP-21262S SHARC® DSPs Page 9 of 9
 Loading...