

Page 1
AN-613
a
APPLICATION NOTE
One Technology Way • P.O. Box 9106 • Norwood, MA 02062-9106 • Tel: 781/329-4700 • Fax: 781/326-8703 • www.analog.com
Programming the Automatic Fan Speed Control Loop
By Mary Burke
AUTOMATIC FAN SPEED CONTROL
The ADT7460/ADT7463 have a local temperature sensor
and two remote temperature channels that may be connected to an on-chip diode-connected transistor on a
CPU. These three temperature channels may be used as
the basis for automatic fan speed control to drive fans
using pulsewidth modulation (PWM). In general, the
greater the number of fans in a system, the better the
cooling, but this is to the detriment of system acoustics.
Automatic fan speed control reduces acoustic noise
by optimizing fan speed according to measured temperature. Reducing fan speed can also decrease system
current consumption. The automatic fan speed control
mode is very flexible owing to the number of programmable parameters, including T
discussed in detail later. The T
MIN
MIN
and T
and T
values for a
RANGE
RANGE
, as
temperature channel and thus for a given fan are critical
since these define the thermal characteristics of the system. The thermal validation of the system is one of the
most important steps of the design process, so these
values should be carefully selected.
AIM OF THIS SECTION
The aim of this application note is not only to provide
the system designer with an understanding of the automatic fan control loop, but to also provide step-by-step
guidance as to how to most effectively evaluate and
select the critical system parameters. To optimize the
system characteristics, the designer needs to give some
forethought to how the system will be configured, i.e.,
the number of fans, where they are located, and what
temperatures are being measured in the particular
REMOTE 1
TEMP
LOCAL
TEMP
REMOTE 2
TEMP
THERMAL CALIBRATION
T
MIN
THERMAL CALIBRATION
T
MIN
THERMAL CALIBRATION
T
MIN
T
T
T
RANGE
RANGE
RANGE
100%
0%
100%
0%
100%
0%
MUX
PWM
MIN
PWM
MIN
PWM
MIN
RAMP
CONTROL
(ACOUSTIC
ENHANCEMENT
TACHOMETER 1
MEASUREMENT
RAMP
CONTROL
(ACOUSTIC
ENHANCEMENT
TACHOMETER 2
MEASUREMENT
RAMP
CONTROL
(ACOUSTIC
ENHANCEMENT
TACHOMETER 3
AND 4
MEASUREMENT
PWM
CONFIG
PWM
GENERATOR
PWM
CONFIG
PWM
GENERATOR
PWM
CONFIG
PWM
GENERATOR
PWM1
PWM2
PWM3
REV. 0
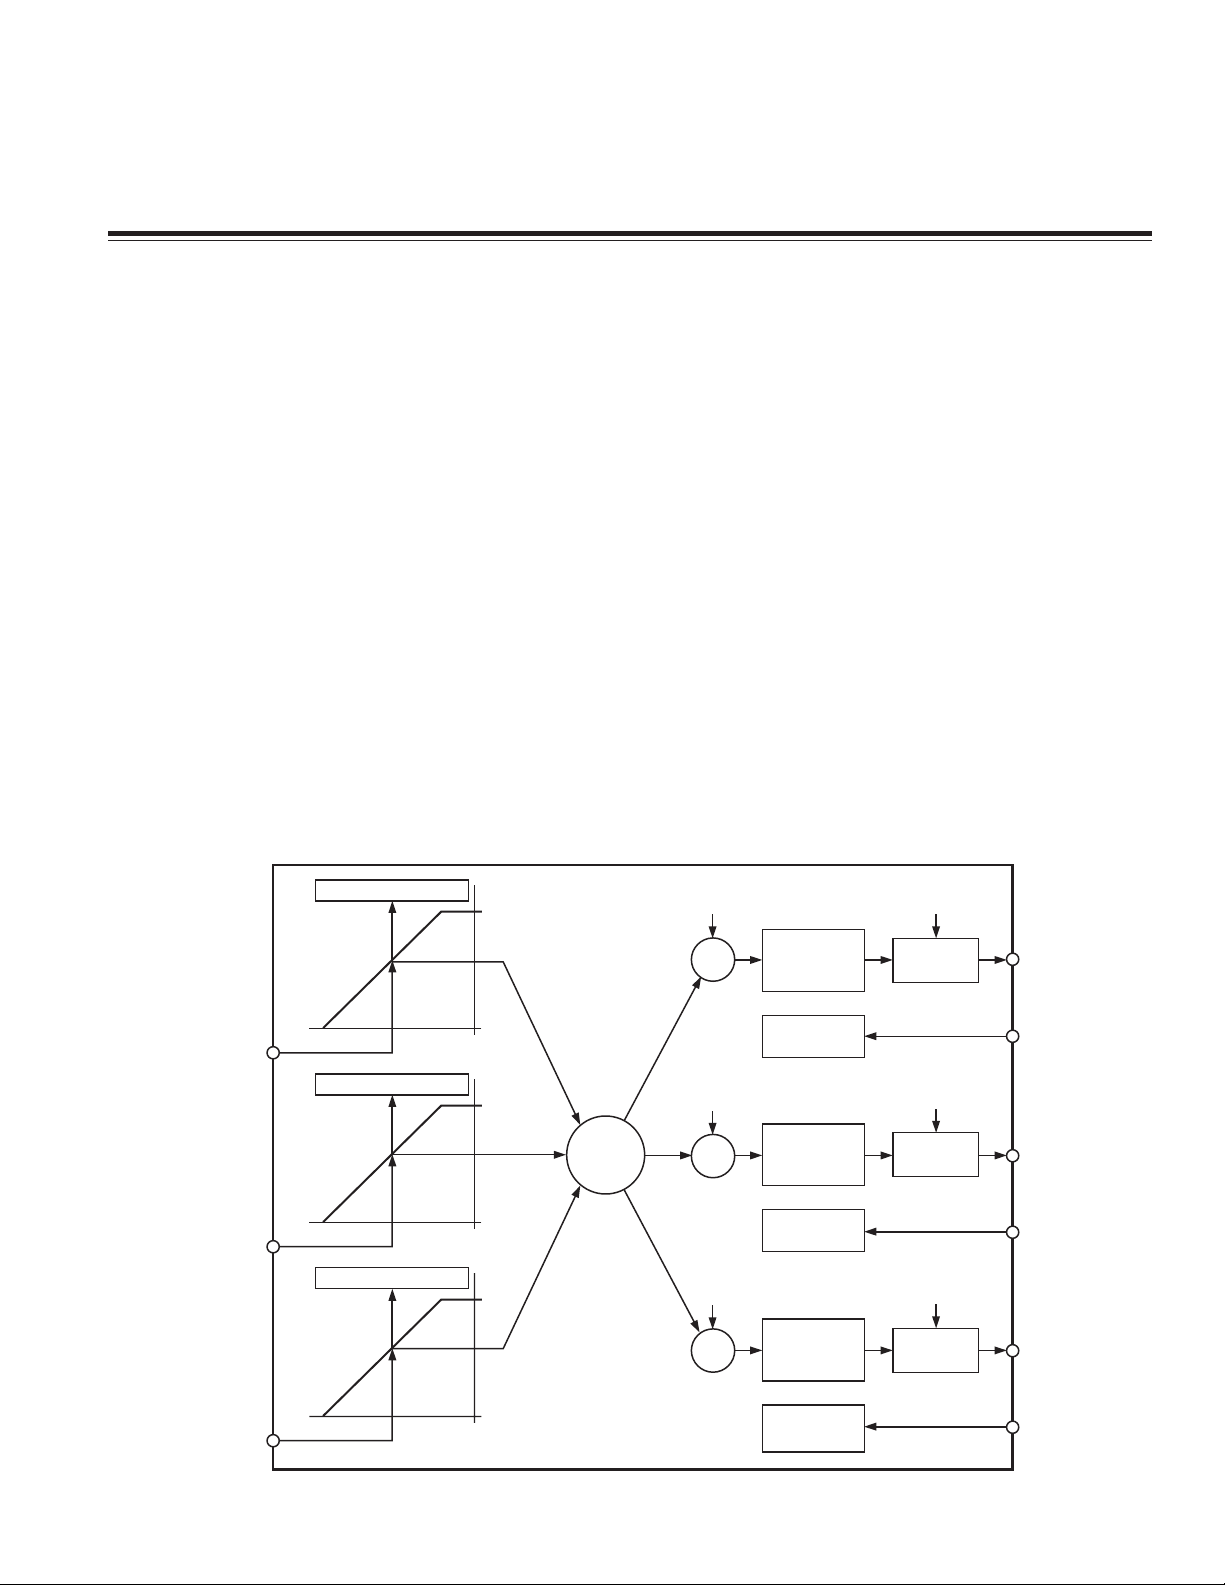
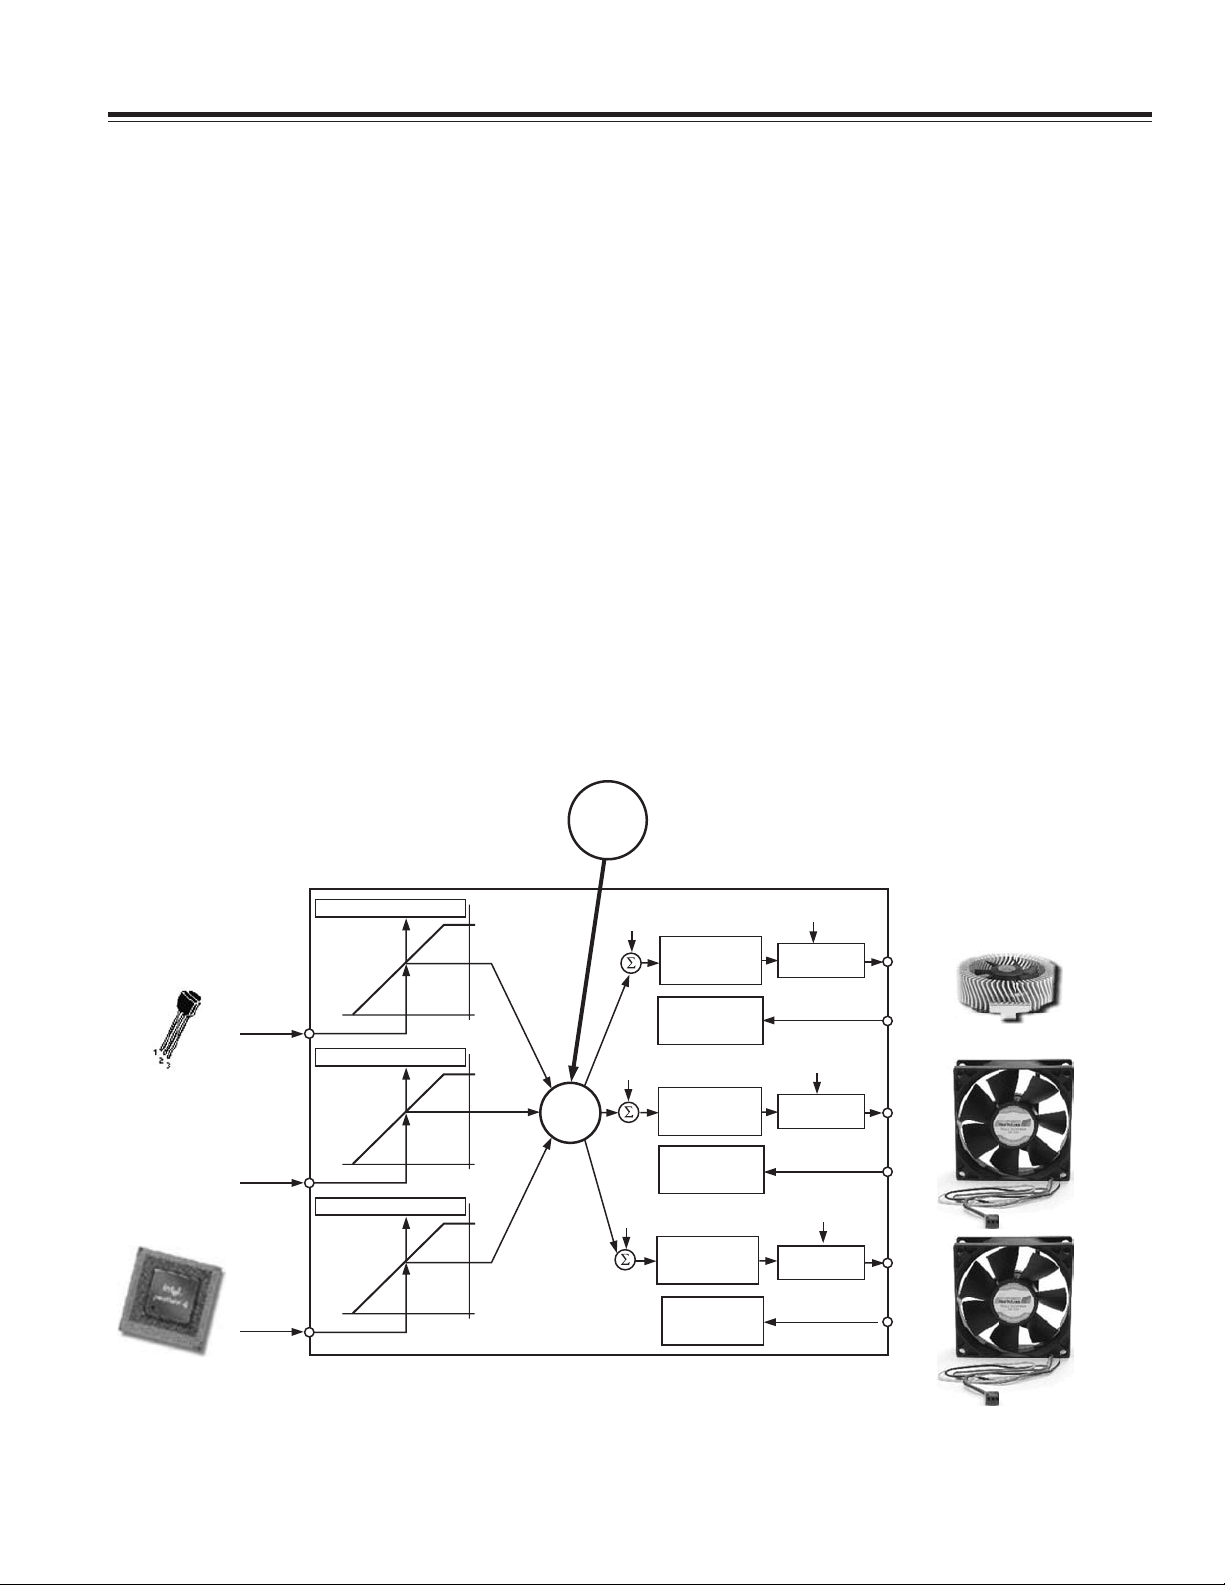
Figure 1. Automatic Fan Control Block Diagram
Page 2
AN-613
system. The mechanical or thermal engineer who is
tasked with the actual system evaluation should also be
involved at the beginning of the process.
AUTOMATIC FAN CONTROL OVERVIEW
Figure 1 gives a top-level overview of the automatic fan
control circuitry on the ADT7460/ADT7463. From a systems level perspective, up to three system temperatures
can be monitored and used to control three PWM outputs. The three PWM outputs can be used to control up
to four fans. The ADT7460/ADT7463 allow the speed of
four fans to be monitored. Each temperature channel
has a thermal calibration block. This allows the
designer to individually configure the thermal characteristics of each temperature channel. For example, one
may decide to run the CPU fan when CPU temperature
increases above 60°C, and a chassis fan when the local
temperature increases above 45°C. Note that at this
stage, you have not assigned these thermal calibration
settings to a particular fan drive (PWM) channel. The
right side of the Block Diagram (Figure 1) shows controls
that are fan-specific. The designer has individual control
over parameters such as minimum PWM duty cycle, fan
speed failure thresholds, and even ramp control of the
PWM outputs. This ultimately allows graceful fan speed
changes that are less perceptible to the system user.
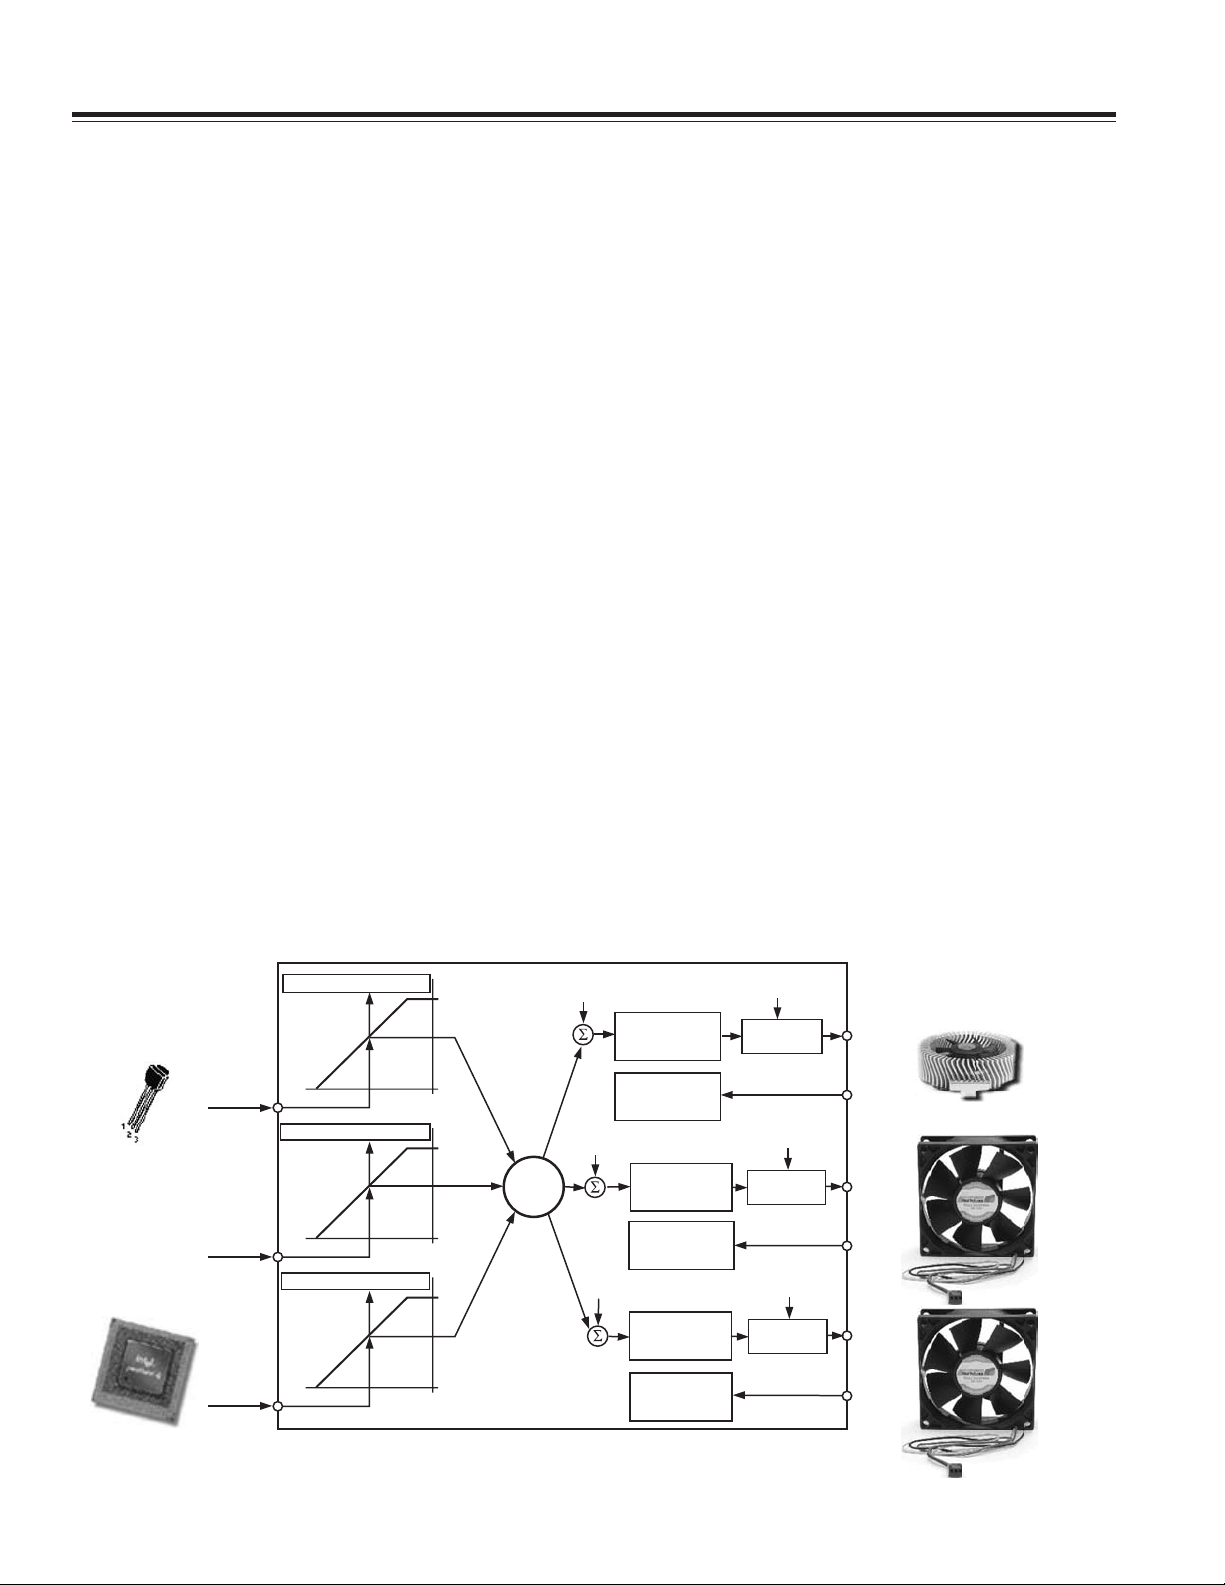
STEP 1: DETERMINING THE HARDWARE CONFIGURATION
During system design, the motherboard sensing and
control capabilities should not be an afterthought, but
addressed early in the design stages. Decisions about
how these capabilities are used should involve the system thermal/mechanical engineer. Ask the following
questions:
1. What ADT7460/ADT7463 functionality will be used?
• PWM2 or SMBALERT?
• 2.5 V voltage monitoring or SMBALERT?
• 2.5 V voltage monitoring or processor power
monitoring?
• TACH4 fan speed measurement or over-
temperature THERM function?
• 5 V voltage monitoring or overtemperature
THERM function?
• 12 V voltage monitoring or VID5 input?
The ADT7460/ADT7463 offers multifunctional pins that
can be reconfigured to suit different system requirements and physical layouts. These multifunction pins
are software programmable. Various pinout options
are discussed in a separate application note.
2. How many fans will be supported in system, three or
four? This will influence the choice of whether to use
the TACH4 pin or to reconfigure it for the THERM
function.
3. Is the CPU fan to be controlled using the ADT7460/
ADT7463 or will it run at full speed 100% of the time?
If run at 100%, it will free up a PWM output, but the
system will be louder.
REMOTE 1 =
AMBIENT TEMP
LOCAL =
VRM TEMP
REMOTE 2 =
CPU TEMP
THERMAL CALIBRATION
T
MIN
THERMAL CALIBRATION
T
MIN
THERMAL CALIBRATION
T
MIN
T
RANGE
T
RANGE
T
RANGE
Figure 2. Hardware Configuration Example
100%
0%
100%
0%
100%
0%
MUX
PWM
MIN
PWM
–2–
MIN
PWM
MIN
RAMP CONTROL
(ACOUSTIC
ENHANCEMENT)
TACHOMETER 1
MEASUREMENT
RAMP CONTROL
(ACOUSTIC
ENHANCEMENT)
TACHOMETER 2
MEASUREMENT
RAMP CONTROL
(ACOUSTIC
ENHANCEMENT)
TACHOMETER 3
AND 4
MEASUREMENT
PWM
CONFIG
PWM
GENERATOR
PWM
CONFIG
PWM
GENERATOR
PWM
CONFIG
PWM
GENERATOR
PWM1
TACH1
PWM2
TACH2
PWM3
TACH3
CPU
FAN SINK
FRONT
CHASSIS
REAR
CHASSIS
REV. 0
Page 3
FRONT
CHASSIS
FAN
TACH2
AN-613
PWM1
TACH1
COMP
PWM3
TACH3
D1+
D1–
3.3VSB
5V
12V/VID5
CURRENT
V
CORE
REAR
CHASSIS
FAN
AMBIENT
TEMPERATURE
ADP316x
VRM
CONTROLLER
V
Figure 3. Recommended Implementation 1
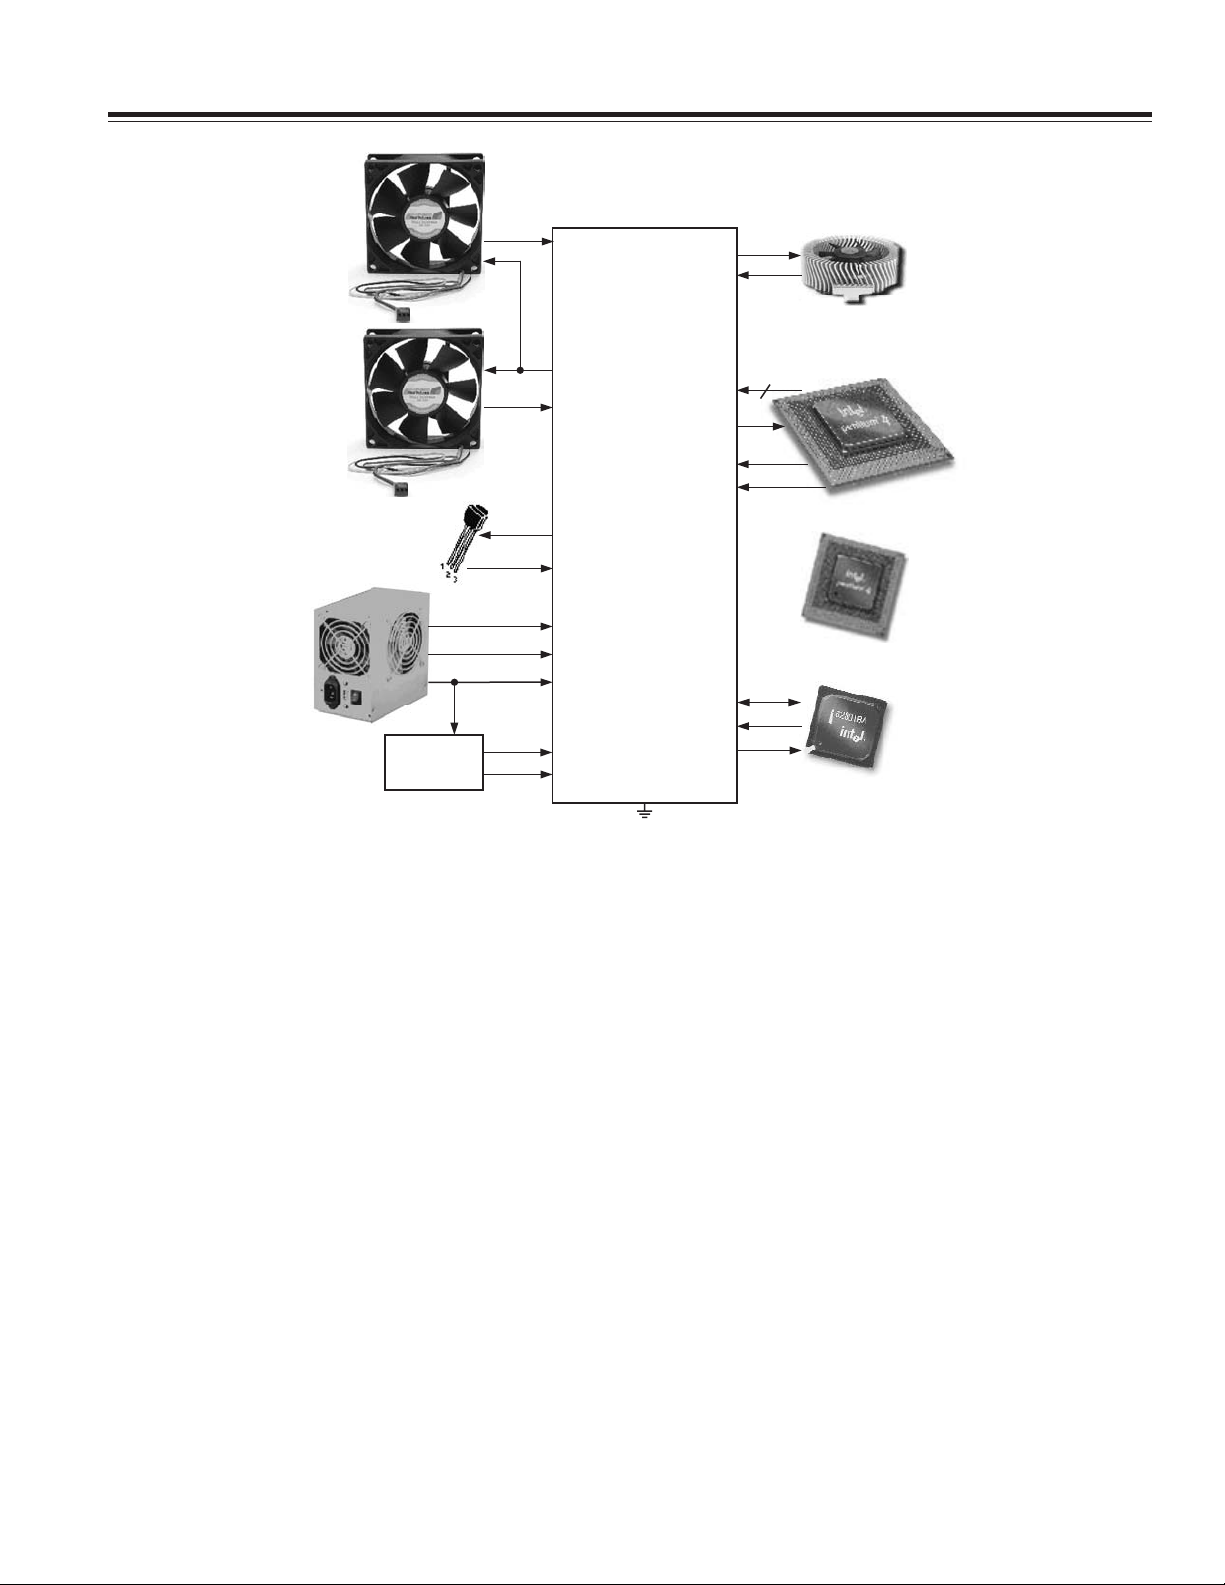
4. Where will the ADT7460/ADT7463 be physically
located in the system?
This influences the assignment of the temperature
measurement channels to particular system thermal
zones. For example, locating the ADT7460/ADT7463
close to the VRM controller circuitry allows the VRM
temperature to be monitored using the local temperature channel.
RECOMMENDED IMPLEMENTATION 1
Configuring the ADT7460/ADT7463 as in Figure 3 provides the systems designer with the following features:
1. Six VID Inputs (VID0 to VID5) for VRM10 Support.
2. Two PWM Outputs for Fan Control of up to Three
Fans. (The front and rear chassis fans are connected
in parallel.)
3. Three TACH Fan Speed Measurement Inputs.
4. V
5. CPU Core Voltage Measurement (V
Measured Internally through Pin 4.
CC
CORE
).
VID[0:4]/VID[0.5]
ADT7463
GND
5(VRM9)/6(VRM10)
D2+
D2–
THERM
SMBALERT
PROCHOT
SDA
SCL
6. 2.5 V Measurement Input Used to Monitor CPU Current (connected to V
output of ADP316x VRM
COMP
controller). This is used to determine CPU power
consumption.
7. 5 V Measurement Input.
8. VRM temperature uses local temperature sensor.
9. CPU Temperature Measured Using Remote 1 Temperature Channel.
10. Ambient Temperature Measured through Remote 2
Temperature Channel.
11. If not using VID5, this pin can be reconfigured as the
12 V monitoring input.
12. Bidirectional THERM Pin. Allows monitoring of
PROCHOT output from Intel
®
P4 processor, for
example, or can be used as an overtemperature
THERM output.
13. SMBALERT System Interrupt Output.
REV. 0
–3–
Page 4
AN-613
FRONT
CHASSIS
FAN
TACH2
PWM2
PWM1
TACH1
COMP
PWM3
TACH3
D1+
D1–
3.3VSB
5V
12V/VID5
CURRENT
V
CORE
REAR
CHASSIS
FAN
AMBIENT
TEMPERATURE
ADP316x
VRM
CONTROLLER
V
Figure 4. Recommended Implementation 2
RECOMMENDED IMPLEMENTATION 2
Configuring the ADT7460/ADT7463 as in Figure 4 provides the systems designer with the following features:
1. Six VID Inputs (VID0 to VID5) for VRM10 Support.
2. Three PWM Outputs for Fan Control of up to Three
Fans. (All three fans can be individually controlled.)
3. Three TACH Fan Speed Measurement Inputs.
4. V
5. CPU Core Voltage Measurement (V
Measured Internally through Pin 4.
CC
CORE
).
6. 2.5 V Measurement Input Used to Monitor CPU Current (connected to V
output of ADP316x VRM
COMP
Controller). This is used to determine CPU power
consumption.
VID[0:4]/VID[0.5]
ADT7463
GND
5(VRM9)/6(VRM10)
D2+
D2–
THERM
PROCHOT
SDA
SCL
7. 5 V Measurement Input.
8. VRM Temperature Uses Local Temperature Sensor.
9. CPU Temperature Measured Using Remote 1 Temperature Channel.
10. Ambient Temperature Measured through Remote 2
Temperature Channel.
11. If not using VID5, this pin can be reconfigured as the
12 V monitoring input.
12. BIDIRECTIONAL THERM Pin. Allows monitoring
of PROCHOT output from Intel P4 processor, for
example, or can be used as an overtemperature
THERM output.
–4–
REV. 0
Page 5
AN-613
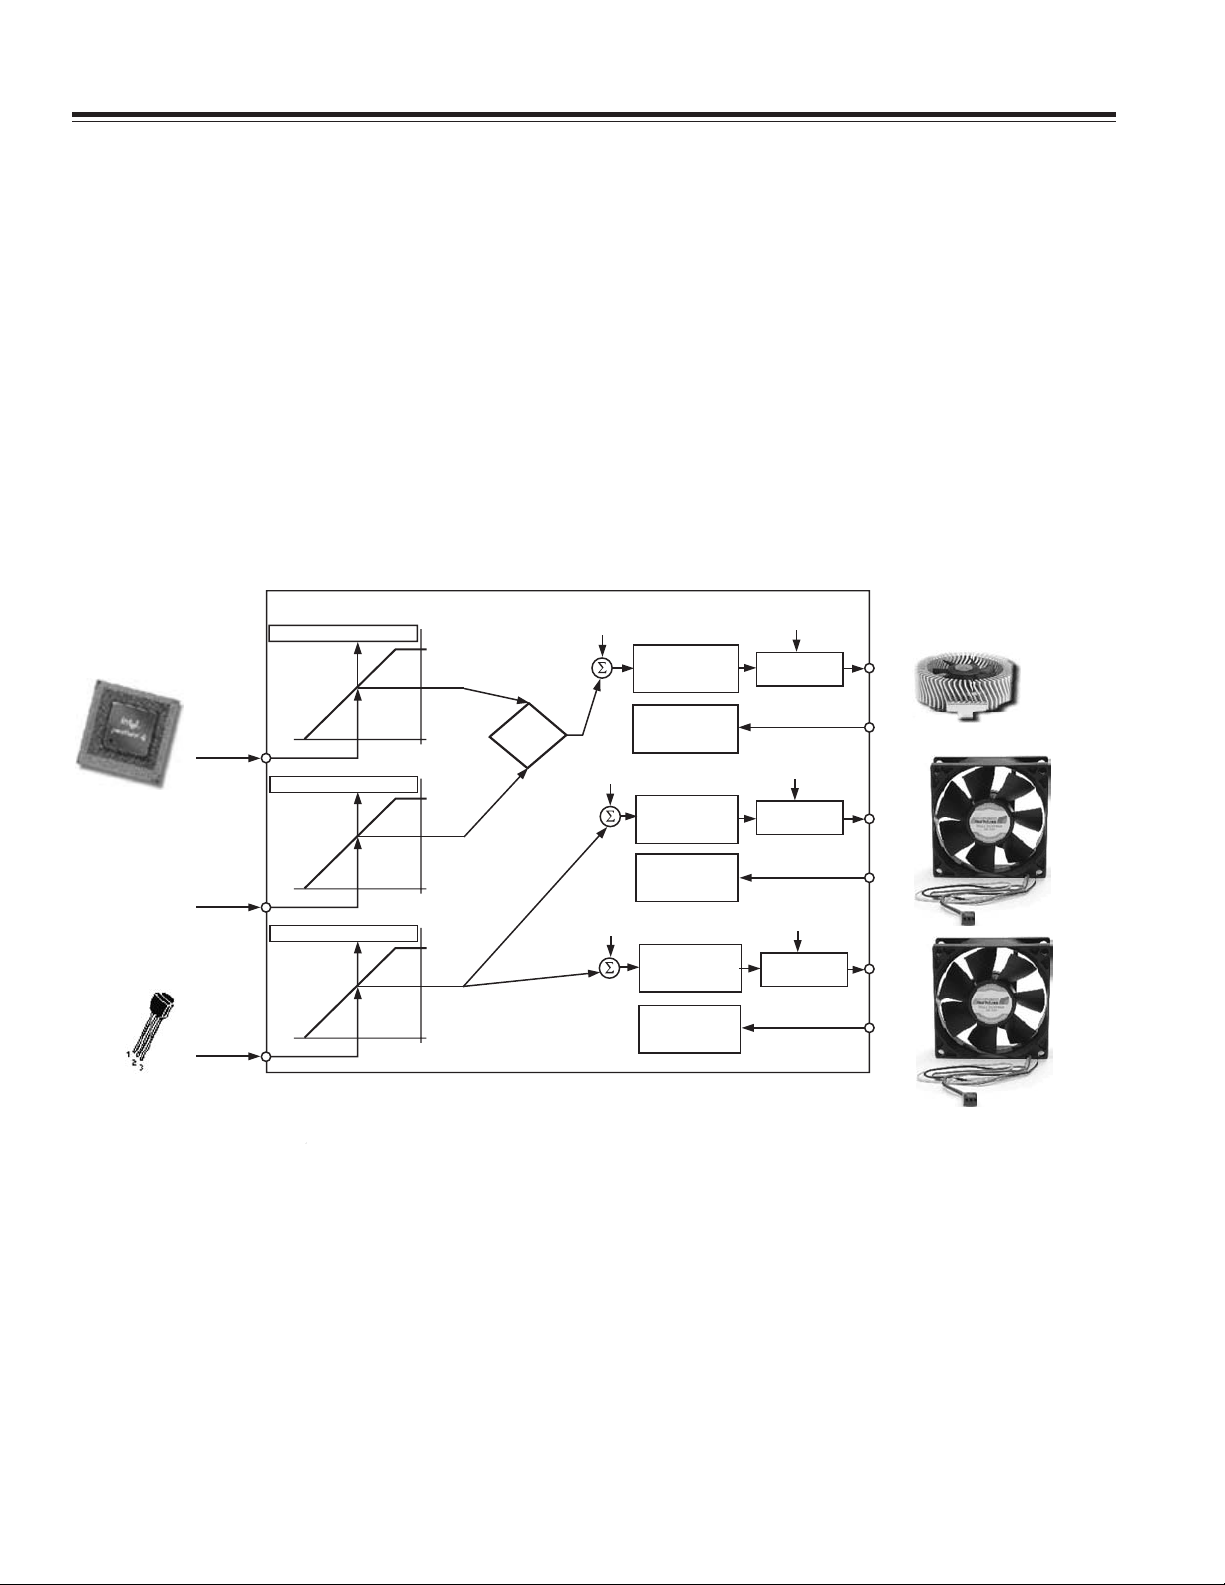
STEP 2: CONFIGURING THE MUX—WHICH TEMPERATURE CONTROLS WHICH FAN?
After the system hardware configuration is determined,
the fans can be assigned to particular temperature channels. Not only can fans be assigned to individual
channels, but the behavior of fans is also configurable.
For example, fans can be run under automatic fan control, can run manually (under software control), or can
run at the fastest speed calculated by multiple temperature channels. The MUX is the bridge between
temperature measurement channels and the three PWM
outputs.
Bits <7:5> (BHVR bits) of registers 0x5C, 0x5D, and 0x5E
(PWM configuration registers) control the behavior of
the fans connected to the PWM1, PWM2, and PWM3 outputs. The values selected for these bits determine how
the MUX connects a temperature measurement channel
to a PWM output.
AUTOMATIC FAN CONTROL MUX OPTIONS
<7:5> (BHVR) REGISTERS 0x5C, 0x5D, 0x5E
000 = Remote 1 Temp controls PWMx
001 = Local Temp controls PWMx
010 = Remote 2 Temp controls PWMx
101 = Fastest Speed calculated by Local and Remote 2
Temp controls PWMx
110 = Fastest Speed calculated by all three temperature
channels controls PWMx
The "Fastest Speed Calculated" options pertain to the
ability to control one PWM output based on multiple
temperature channels. The thermal characteristics of
the three temperature zones can be set to drive a
single fan. An example would be if the fan turns on
when Remote 1 temperature exceeds 60°C or if the local
temperature exceeds 45°C.
OTHER MUX OPTIONS
<7:5> (BHVR) REGISTERS 0x5C, 0x5D, 0x5E
011 = PWMx runs full speed (default)
100 = PWMx disabled
111 = Manual Mode. PWMx is run under software control.
In this mode, PWM duty cycle registers (registers 0x30 to
0x32) are writable and control the PWM outputs.
REMOTE 1 =
AMBIENT TEMP
LOCAL =
VRM TEMP
REMOTE 2 =
CPU TEMP
THERMAL CALIBRATION
T
MIN
THERMAL CALIBRATION
T
MIN
THERMAL CALIBRATION
T
MIN
T
RANGE
T
RANGE
T
RANGE
100%
0%
100%
0%
100%
0%
MUX
MUX
PWM
MIN
PWM
MIN
PWM
MIN
RAMP CONTROL
(ACOUSTIC
ENHANCEMENT)
TACHOMETER 1
MEASUREMENT
RAMP CONTROL
(ACOUSTIC
ENHANCEMENT)
TACHOMETER 2
MEASUREMENT
RAMP CONTROL
(ACOUSTIC
ENHANCEMENT)
TACHOMETER 3
AND 4
MEASUREMENT
PWM
CONFIG
PWM
GENERATOR
PWM
CONFIG
PWM
GENERATOR
PWM
CONFIG
PWM
GENERATOR
PWM1
TACH1
PWM2
TACH2
PWM3
TACH3
CPU
FAN SINK
FRONT
CHASSIS
REAR
CHASSIS
REV. 0
Figure 5. Assigning Temperature Channels to Fan Channels
–5–
Page 6
AN-613
MUX CONFIGURATION EXAMPLE
This is an example of how to configure the MUX in a
system using the ADT7460/ADT7463 to control three
fans. The CPU fan sink is controlled by PWM1, the front
chassis fan is controlled by PWM 2, and the rear chassis
fan is controlled by PWM3. The MUX is configured for
the following fan control behavior:
PWM1 (CPU fan sink) is controlled by the fastest speed
calculated by the Local (VRM Temp) and Remote 2 (processor) temperature. In this case, the CPU fan sink is
also being used to cool the VRM.
PWM2 (front chassis fan) is controlled by the Remote 1
temperature (ambient).
PWM3 (rear chassis fan) is controlled by the Remote 1
temperature (ambient).
REMOTE 2 =
CPU TEMP
THERMAL CALIBRATION
T
MIN
THERMAL CALIBRATION
T
RANGE
100%
0%
100%
MUX
EXAMPLE MUX SETTINGS
<7:5> (BHVR) PWM1 CONFIGURATION REG 0x5C
101 = Fastest speed calculated by Local and Remote 2
Temp controls PWM1.
<7:5> (BHVR) PWM2 CONFIGURATION REG 0x5D
000 = Remote 1 Temp controls PWM2.
<7:5> (BHVR) PWM3 CONFIGURATION REG 0x5E
000 = Remote 1 Temp controls PWM3.
These settings configure the MUX, as shown in Figure 6.
PWM
MIN
PWM
MIN
RAMP CONTROL
(ACOUSTIC
ENHANCEMENT)
TACHOMETER 1
MEASUREMENT
RAMP CONTROL
(ACOUSTIC
ENHANCEMENT)
PWM
CONFIG
PWM
GENERATOR
PWM
CONFIG
PWM
GENERATOR
PWM1
TACH1
PWM2
CPU
FAN SINK
FRONT
CHASSIS
LOCAL =
VRM TEMP
REMOTE 1 =
AMBIENT TEMP
T
MIN
THERMAL CALIBRATION
T
MIN
T
RANGE
T
RANGE
TACHOMETER 2
PWM
MIN
MEASUREMENT
RAMP CONTROL
(ACOUSTIC
ENHANCEMENT)
TACHOMETER 3
AND 4
MEASUREMENT
0%
100%
0%
Figure 6. MUX Configuration Example
PWM
CONFIG
PWM
GENERATOR
TACH2
PWM3
TACH3
REAR
CHASSIS
–6–
REV. 0
Page 7
AN-613
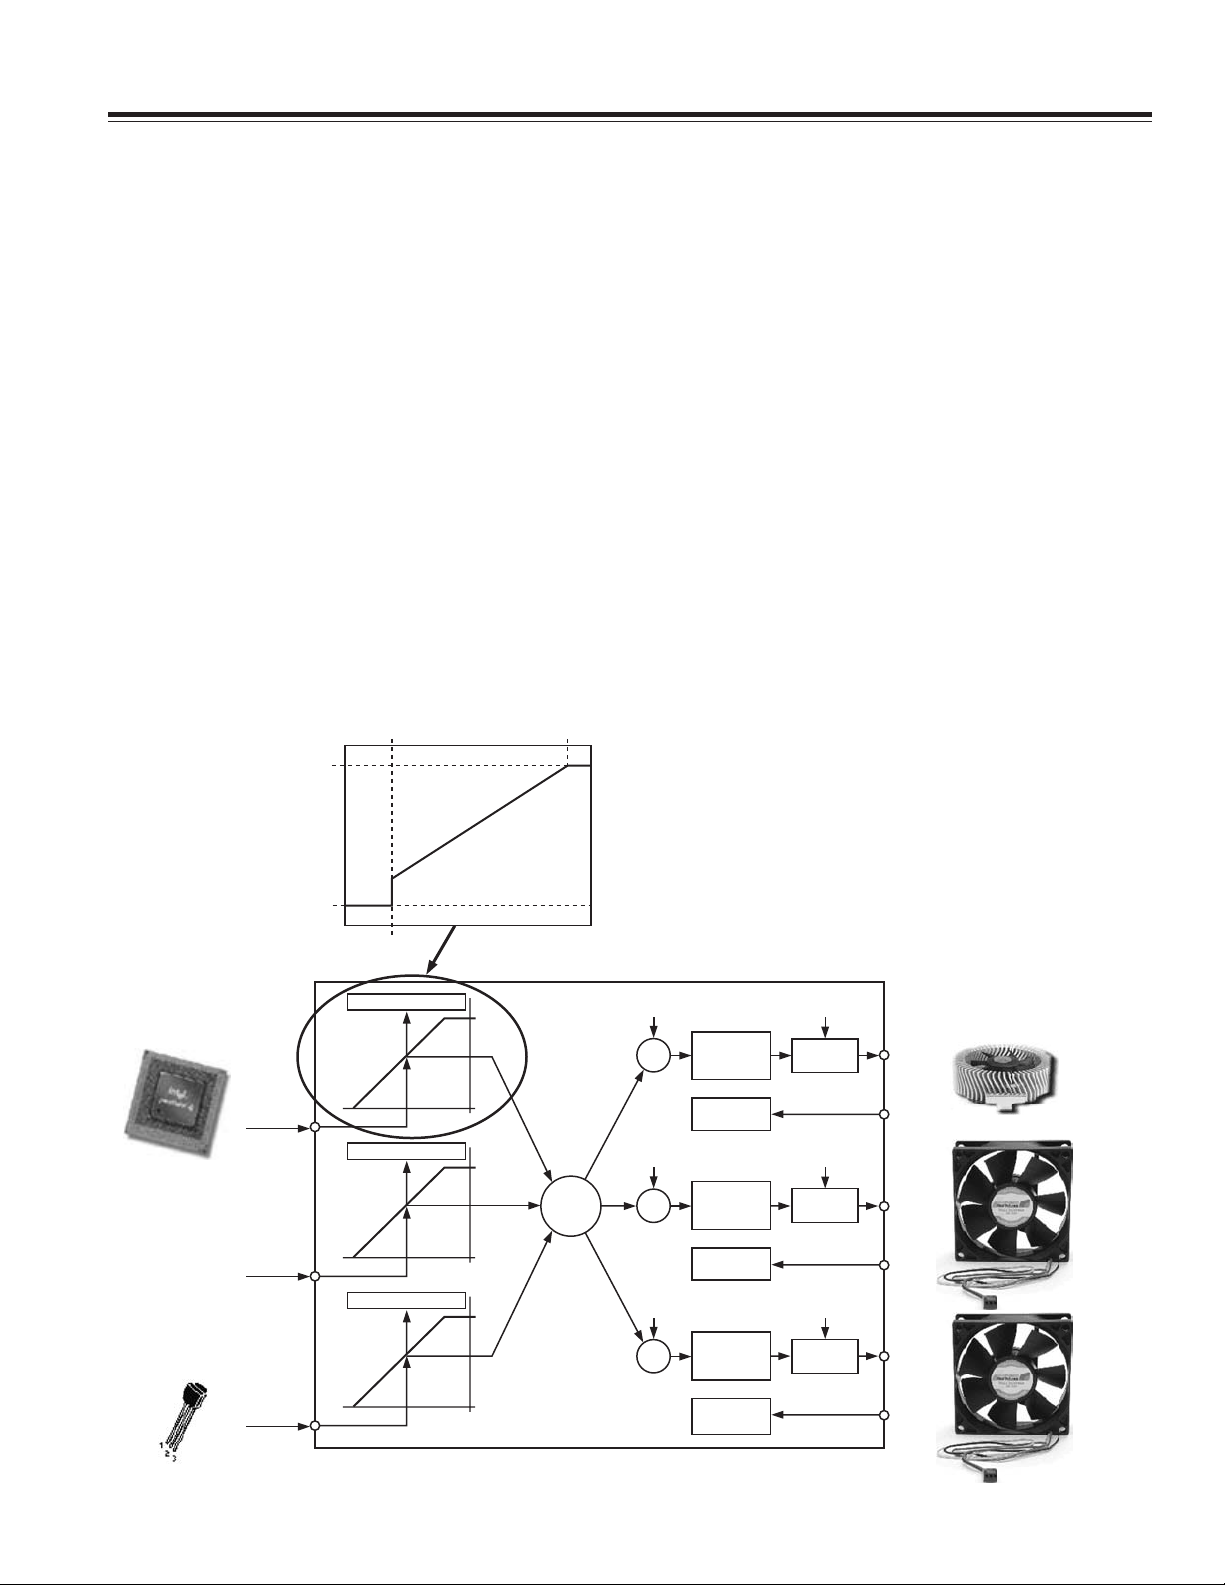
STEP 3: DETERMINING T
SETTING FOR EACH
MIN
THERMAL CALIBRATION CHANNEL
T
is the temperature at which the fans will start to
MIN
turn on under automatic fan control. The speed at which
the fan runs at T
is programmed later. The T
MIN
MIN
values
chosen will be temperature channel specific, e.g., 25°C
for ambient channel, 30°C for VRM temperature, and
40°C for processor temperature.
T
is an 8-bit twos complement value that can be pro-
MIN
grammed in 1°C increments. There is a T
register
MIN
associated with each temperature measurement channel:
Remote 1, Local, and Remote 2 Temp. Once the T
MIN
value is exceeded, the fan turns on and runs at minimum
PWM duty cycle. The fan will turn off once temperature
has dropped below T
MIN
– T
(detailed later).
HYST
To overcome fan inertia, the fan is spun up until two
valid tach rising edges are counted. See the Fan Startup
Timeout section of the ADT7460/ADT7463 data sheet
for more details. In some cases, primarily for psychoacoustic reasons, it is desirable that the fan never
switches off below T
. Bits <7:5> of enhance acoustics
MIN
Register 1 (Reg. 0x62), when set, keeps the fans running
at PWM minimum duty cycle if the temperature should
fall below T
T
REGISTERS
MIN
Reg. 0x67 Remote 1 Temp T
Reg. 0x68 Local Temp T
Reg. 0x69 Remote 2 Temp T
MIN
.
= 0x5A (90°C default)
MIN
= 0x5A (90°C default)
MIN
= 0x5A (90°C default)
MIN
ENHANCE ACOUSTICS REG 1 (REG. 0x62)
Bit 7 (MIN3) = 0, PWM3 is OFF (0% PWM duty cycle)
when Temp is below T
MIN
– T
HYST
.
Bit 7 (MIN3) = 1, PWM3 runs at PWM3 minimum duty
cycle below T
MIN
– T
HYST
.
Bit 6 (MIN2) = 0, PWM2 is OFF (0% PWM duty cycle)
when Temp is below T
MIN
– T
HYST
.
Bit 6 (MIN2) = 1, PWM2 runs at PWM2 minimum duty
cycle below T
MIN
– T
HYST
.
Bit 5 (MIN1) = 0, PWM1 is OFF (0% PWM duty cycle)
when Temp is below T
MIN
– T
HYST
.
Bit 5 (MIN1) = 1, PWM1 runs at PWM1 minimum duty
cycle below T
MIN
– T
HYST
.
REMOTE 2 =
CPU TEMP
LOCAL =
VRM TEMP
REMOTE 1 =
AMBIENT TEMP
100%
PWM DUTY CYCLE
0%
T
THERMAL CALIBRATION
T
MIN
THERMAL CALIBRATION
T
MIN
THERMAL CALIBRATION
T
MIN
MIN
T
RANGE
T
RANGE
T
RANGE
100%
0%
100%
0%
100%
0%
MUX
PWM
MIN
PWM
MIN
PWM
MIN
RAMP
CONTROL
(ACOUSTIC
ENHANCEMENT
TACHOMETER 1
MEASUREMENT
RAMP
CONTROL
(ACOUSTIC
ENHANCEMENT
TACHOMETER 2
MEASUREMENT
RAMP
CONTROL
(ACOUSTIC
ENHANCEMENT
TACHOMETER 3
AND 4
MEASUREMENT
PWM
CONFIG
PWM
GENERATOR
PWM
CONFIG
PWM
GENERATOR
PWM
CONFIG
PWM
GENERATOR
PWM1
TACH1
PWM2
TACH2
PWM3
TACH3
CPU
FAN SINK
FRONT
CHASSIS
REAR
CHASSIS
REV. 0
Figure 7. Understanding the T
–7–
Parameter
MIN
Page 8
AN-613
STEP 4: DETERMINING PWM
FOR EACH PWM (FAN)
MIN
OUTPUT
PWM
is the minimum PWM duty cycle at which each
MIN
fan in the system will run. It is also the “start” speed for
each fan under automatic fan control once the temperature rises above T
benefit, PWM
MIN
. For maximum system acoustic
MIN
should be as low as possible. Starting
the fans at higher speeds than necessary will merely
make the system louder than necessary. Depending on
the fan used, the PWM
setting should be in the 20% to
MIN
33% duty cycle range. This value can be found through
fan validation.
100%
PWM DUTY CYCLE
PWM
MIN
0%
TEMPERATURE
Figure 8. PWM
T
MIN
Determines Minimum PWM
MIN
Duty Cycle
It is important to note that more than one PWM
output can be controlled from a single temperature
measurement channel. For example, Remote 1 Temp
can control PWM1 and PWM2 outputs. If two different
fans are used on PWM and PWM2, then the fan characteristics can be set up differently. As a result, Fan 1
driven by PWM1 can have a different PWM
value than
MIN
that of Fan 2 connected to PWM2. Figure 9 illustrates
this as PWM1
duty cycle of 20%, whereas PWM2
(front fan) is turned on at a minimum
MIN
(rear fan) turns
MIN
on at a minimum of 40% duty cycle. Note, however,
that both fans turn on at exactly the same temperature, defined by T
MIN
.
100%
PWM2
PWM2
MIN
PWM DUTY CYCLE
PWM1
MIN
0%
T
MIN
PWM1
TEMPERATURE
Figure 9. Operating Two Different Fans from a Single
Temperature Channel
PROGRAMMING THE PWM
The PWM
registers are 8-bit registers that allow the
MIN
REGISTERS
MIN
minimum PWM duty cycle for each output to be configured anywhere from 0% to 100%. This allows minimum
PWM duty cycle to be set in steps of 0.39%.
The value to be programmed into the PWM
register is
MIN
given by:
Value (decimal) = PWM
MIN
/0.39
Example 1: For a minimum PWM duty cycle of 50%,
Value (decimal) = 50/0.39 = 128 decimal
Value = 128 decimal or 80 hex
Example 2: For a minimum PWM duty cycle of 33%,
Value (decimal) = 33/0.39 = 85 decimal
Value = 85 decimal or 54 hex
PWM
REGISTERS
MIN
Reg. 0x64 PWM1 Min Duty Cycle = 0x80 (50% default)
Reg. 0x65 PWM2 Min Duty Cycle = 0x80 (50% default)
Reg. 0x66 PWM3 Min Duty Cycle = 0x80 (50% default)
FAN SPEED AND PWM DUTY CYCLE
It should be noted that PWM duty cycle does not
directly correlate to fan speed in RPM. Running a fan at
33% PWM duty cycle does not equate to running the fan
at 33% speed. Driving a fan at 33% PWM duty cycle
actually runs the fan at closer to 50% of its full speed.
This is because fan speed in %RPM relates to the square
root of PWM duty cycle. Given a PWM square wave as
the drive signal, fan speed in RPM equates to:
–8–
% fan speed PWM duty cycle 10=×
REV. 0
Page 9
AN-613
STEP 5: DETERMINING T
FOR EACH TEMPERATURE
RANGE
CHANNEL
T
is the range of temperature over which automatic
RANGE
fan control occurs once the programmed T
ture has been exceeded. T
is actually a temperature
RANGE
slope and not an arbitrary value, i.e., a T
only holds true for PWM
creased or decreased, the effective T
= 33%. If PWM
MIN
RANGE
tempera-
MIN
of 40°C
RANGE
is in-
MIN
is changed, as
described later.
T
RANGE
100%
PWM DUTY CYCLE
PWM
MIN
0%
TEMPERATURE
Figure 10. T
The T
RANGE
T
MIN
Parameter Affects Cooling Slope
RANGE
or fan control slope is determined by the fol-
lowing procedure:
1. Determine the maximum operating temperature for
that channel, e.g., 70°C.
2. Determine experimentally the fan speed (PWM duty
cycle value) that will not exceed the temperature at
the worst-case operating points, e.g., 70°C is reached
when the fans are running at 50% PWM duty cycle.
3. Determine the slope of the required control loop to
meet these requirements.
4. Use best fit approximation to determine the most
suitable T
value. ADT7460/ADT7463 evaluation
RANGE
software is available to calculate the best fit value.
Ask your local Analog Devices representative for
more details.
100%
50%
PWM DUTY CYCLE
33%
0%
30C
T
MIN
Figure 11. Adjusting PWM
40C
MIN
Affects T
RANGE
T
is implemented as a slope, which means as
RANGE
PWM
is changed, T
MIN
changes but the actual slope
RANGE
remains the same. The higher the PWM
smaller the effective T
will be, i.e., the fan will reach
RANGE
full speed (100%) at a lower temperature.
100%
50%
33%
25%
PWM DUTY CYCLE
10%
0%
30C
40C
45C
54C
T
MIN
Figure 12. Increasing PWM
T
RANGE
For a given T
value, the temperature at which the
RANGE
Changes Effective
MIN
fan will run at full speed for different PWM
easily be calculated:
T
=
T
+ ((
MAX
Max D. C. – Min D. C.
MIN
)
T
RANGE
where
T
= Temperature at which the fan runs full speed
MAX
T
= Temperature at which the fan will turn on
MIN
Max D. C.
Min D. C.
T
RANGE
Example: Calculate
40°C, and PWM
T
MAX
T
MAX
T
MAX
T
MAX
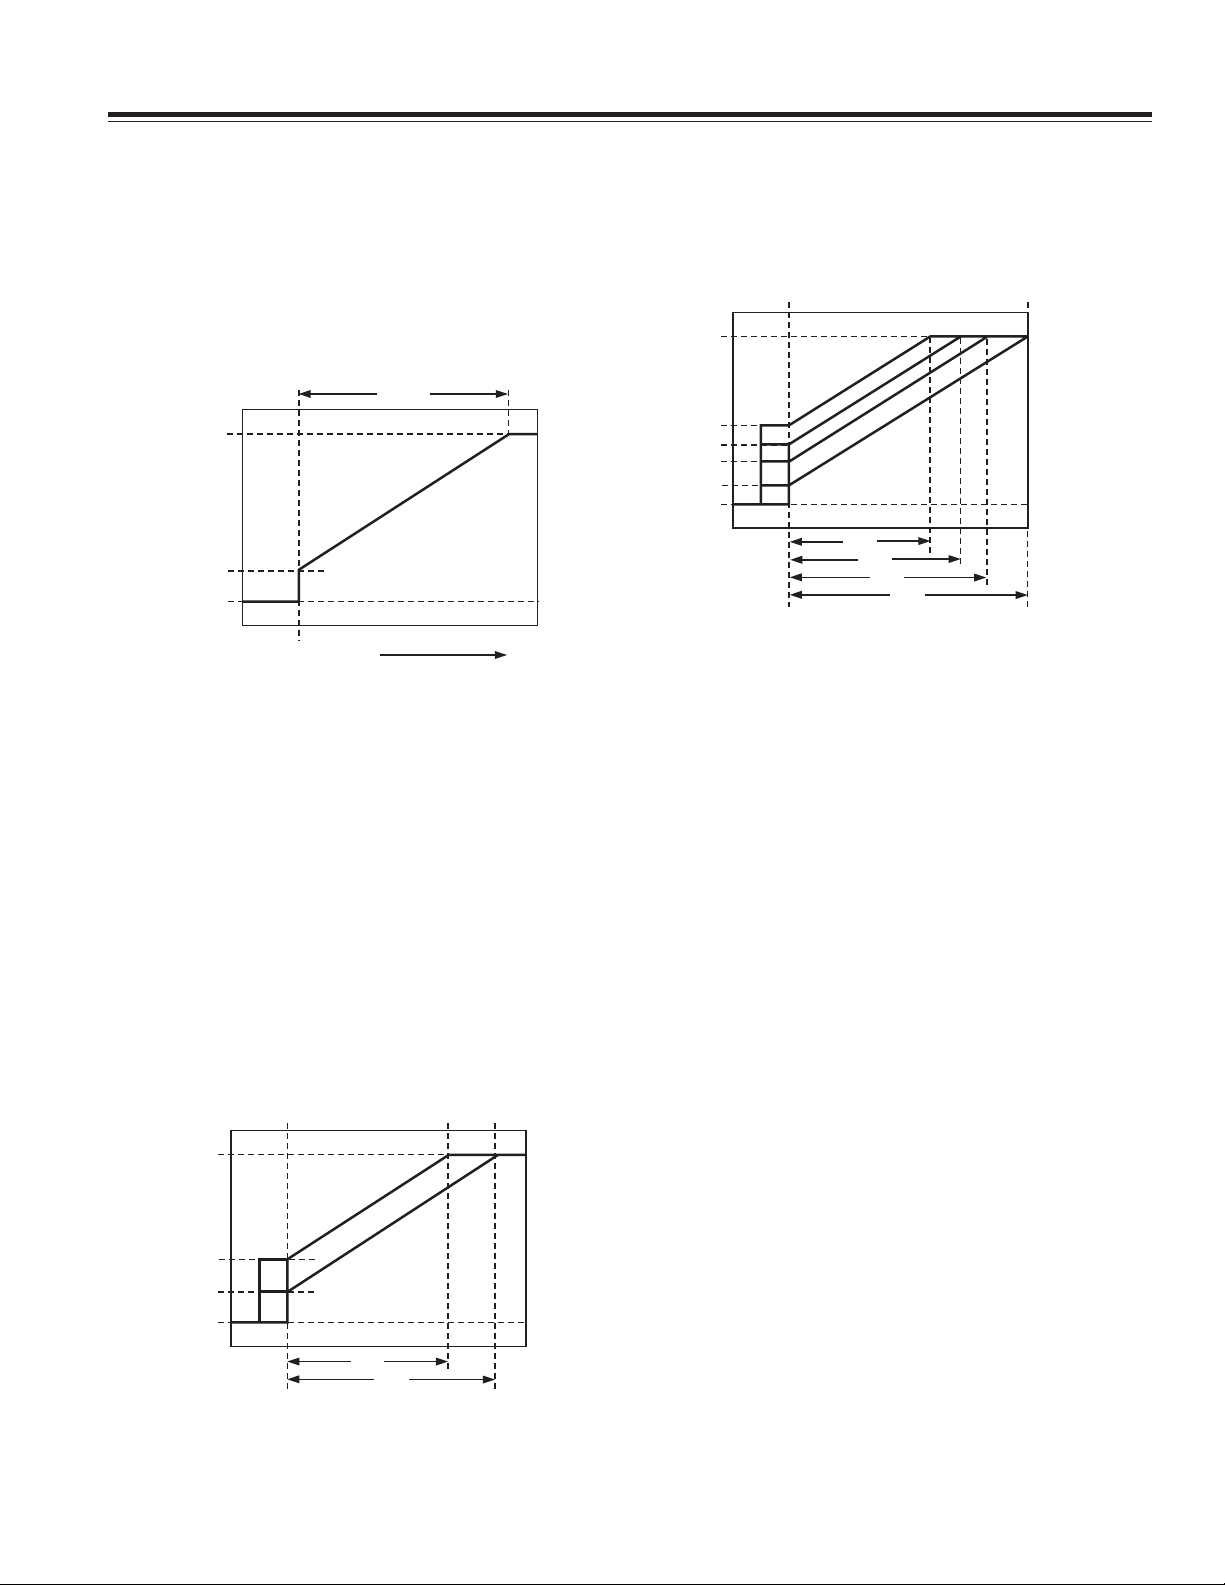
Example: Calculate
40°C, and PWM
T
MAX
T
MAX
T
MAX
T
MAX
Example: Calculate
40°C, and PWM
T
MAX
T
MAX
T
MAX
T
MAX
= Maximum duty cycle (100%) = 255 decimal
= PWM
MIN
= PWM duty cycle versus temperature slope
T
=
, given
MAX
= 10% duty cycle = 26 decimal
MIN
T
+ (
MIN
Max D. C.
–
Min D. C.
T
MIN
)
= 30°C,
T
RANGE
= 30°C + (100% – 10%) 40°C/170
= 30°C + (255 – 26) 40°C/170
= 84°C (
=
T
MIN
effective T
MIN
+ (
Max D. C.
= 54°C)
RANGE
T
MAX
, given
T
MIN
= 30°C,
= 25% duty cycle = 64 decimal
–
Min D. C.
)
T
RANGE
= 30°C + (100% – 25%) 40°C/170
= 30°C + (255 – 64) 40°C/170
= 75°C (
=
T
MIN
effective T
MIN
+ (
Max D. C.
= 45°C)
RANGE
T
MAX
, given
T
MIN
= 30°C,
= 33% duty cycle = 85 decimal
–
Min D. C.
)
T
RANGE
= 30°C + (100% – 33%) 40°C/170
= 30°C + (255 – 85) 40°C/170
= 70°C (
effective T
RANGE
= 40°C)
value, the
MIN
values can
MIN
/170
T
/170
T
/170
T
/170
RANGE
RANGE
RANGE
=
=
=
REV. 0
–9–
Page 10

AN-613
TEMPERATURE ABOVE T
MIN
020406080100 120
0
FAN SPEED – % OF MAX
10
20
30
40
50
60
70
80
90
100
2
C
80
C
53.3
C
40
C
32
C
26.6
C
20
C
16
C
13.3
C
10
C
8
C
6.67
C
5
C
4
C
3.33
C
2.5
C
TEMPERATURE ABOVE T
MIN
020406080100 120
0
PWM DUTY CYCLE – %
10
20
30
40
50
60
70
80
90
100
2
C
80
C
53.3
C
40
C
32
C
26.6
C
20
C
16
C
13.3
C
10
C
8
C
6.67
C
5
C
4
C
3.33
C
2.5
C
Example: Calculate
40°C, and PWM
T
=
T
+ (
MIN
= 30°C + (100% – 50%) 40°C/170
= 30°C + (255 – 128) 40°C/170
= 60°C (
effective T
T
T
T
MAX
MAX
MAX
MAX
SELECTING A T
The T
value can be selected for each temperature
RANGE
T
, given
MAX
= 50% duty cycle = 128 decimal
MIN
Max D. C.
RANGE
–
RANGE
SLOPE
Min D. C.
= 30°C)
channel: Remote 1, Local, and Remote 2 Temp. Bits
<7:4> (T
) of registers 0x5F to 0x61 define the T
RANGE
value for each temperature channel.
Table I. Selecting a T
Bits <7:4>* T
RANGE
0000 2°C
0001 2.5°C
0010 3.33°C
0011 4°C
0100 5°C
0101 6.67°C
0110 8°C
0111 10°C
1000 13.33°C
1001 16°C
1010 20°C
1011 26.67°C
1100 32°C (default)
1101 40°C
1110 53.33°C
1111 80°C
SUMMARY OF T
When using the automatic fan control function, the temperature at which the fan reaches full speed can be
calculated by
T
MAX
Equation 1 only holds true when PWM
duty cycle.
Increasing or decreasing PWM
tive T
same PWM duty cycle to temperature slope. The effective T
calculated using Equation 2.
T
MAX
where:
(
Max D. C.
value
* Register 0x5F configures Remote 1 T
Register 0x60 configures Local T
Register 0x61 configures Remote 2 T
FUNCTION
RANGE
=
T
+ T
MIN
RANGE
MIN
, although the fan control will still follow the
RANGE
for different PWM
RANGE
=
T
+ (
Max D. C.
MIN
–
Min D. C.
–
Min D. C.
)
T
RANGE
.
T
= 30°C,
MIN
)
T
Value
RANGE
RANGE
MIN
will change the effec-
values can be
MIN
)
T
/170 =
effective T
T
RANGE
/170
RANGE
RANGE
RANGE
= 33% PWM
/170 (2)
RANGE
RANGE
RANGE
=
(1)
–10–
Remember that %PWM duty cycle does not correspond
to %RPM. %RPM relates to the square root of the PWM
duty cycle.
% fan speed PWM duty cycle 10=×
Figure 13. T
vs. Actual Fan Speed Profile
RANGE
Figure 13 shows PWM duty cycle versus temperature for
each T
T
RANGE
setting. The lower graph shows how each
RANGE
setting affects fan speed versus temperature. As
can be seen from the graph, the effect on fan speed is
nonlinear. The graphs in Figure 13 assume that the fan
starts from 0% PWM duty cycle. Clearly, the minimum
PWM duty cycle, PWM
, needs to be factored in to see
MIN
how the loop actually performs in the system. Figure 14
shows how T
is affected when the PWM
RANGE
value is
MIN
set to 20%. It can be seen that the fan will actually run at
about 45% fan speed when the temperature exceeds T
MIN
REV. 0
.
Page 11

100
TEMPERATURE ABOVE T
MIN
010203040 10050 60 70 80 90
0
PWM DUTY CYCLE – %
10
20
30
40
50
60
70
80
90
100
TEMPERATURE ABOVE T
MIN
0
FAN SPEED – % MAX RPM
10
20
30
40
50
60
70
80
90
100
010203040 10050 60 70 80 90
90
80
70
60
50
40
30
PWM DUTY CYCLE – %
20
10
0
020406080100 120
TEMPERATURE ABOVE T
MIN
2
2.5
3.33
4
5
6.67
8
10
13.3
16
20
26.6
32
40
53.3
80
AN-613
C
C
C
C
C
C
C
C
C
C
C
C
C
C
C
C
This example uses the MUX configuration described
in Step 2, with the ADT7460/ADT7463 connected as
shown in Figure 6. Both CPU temperature and VRM temperature drive the CPU fan connected to PWM1.
Ambient temperature drives the front chassis fan and
rear chassis fan connected to PWM2 and PWM3.
The front chassis fan is configured to run at
PWM
at PWM
The CPU fan is configured to run at PWM
= 20%. The rear chassis fan is configured to run
MIN
= 30%.
MIN
= 10%.
MIN
100
90
80
70
60
50
40
30
FAN SPEED – % OF MAX
20
10
0
020406080100 120
Figure 14. T
PWM
EXAMPLE: DETERMINING T
TEMPERATURE CHANNEL
The following example is used to show how T
settings might be applied to three different thermal
zones. In this example, the following T
apply:
T
= 80°C for Ambient Temperature
RANGE
T
= 53.3°C for CPU Temperature
RANGE
T
= 40°C for VRM Temperature
RANGE
TEMPERATURE ABOVE T
RANGE
= 20%
MIN
, % Fan Speed Slopes with
FOR EACH
RANGE
MIN
MIN
RANGE
C
2
2.5
3.33
C
4
C
5
6.67
C
8
C
10
13.3
16
C
C
20
26.6
C
32
C
40
53.3
80
C
, T
RANGE
values
C
C
C
C
C
C
Figure 15. T
, % Fan Speed Slopes for VRM,
RANGE
Ambient, and CPU Temperature Channels
REV. 0
–11–
Page 12

AN-613
STEP 6: DETERMINING T
FOR EACH TEMPERATURE
THERM
CHANNEL
T
is the absolute maximum temperature allowed
THERM
on a temperature channel. Above this temperature, a
component such as the CPU or VRM may be operating
beyond its safe operating limit. When the temperature
measured exceeds T
, all fans are driven at 100% PWM
THERM
duty cycle (full speed) to provide critical system cooling.
The fans remain running 100% until the temperature drops
below T
– hysteresis. The hysteresis value is the
THERM
number programmed into hysteresis registers 0x6D and
0x6E. The default hysteresis value is 4°C.
The T
limit should be considered the maximum
THERM
worst-case operating temperature of the system. Since
exceeding any T
limit runs all fans at 100%, it has
THERM
very negative acoustic effects. Ultimately, this limit
should be set up as a failsafe, and one should ensure
that it is not exceeded under normal system operating
conditions.
T
RANGE
100%
Note that the T
limits are nonmaskable and affect
THERM
the fan speed no matter what automatic fan control settings are configured. This allows some flexibility since a
T
value can be selected based on its slope, while a
RANGE
“hard limit,” e.g., 70°C, can be programmed as T
MAX
(the
temperature at which the fan reaches full speed) by setting T
THERM
to 70°C.
THERM REGISTERS
Reg. 0x6A Remote 1 THERM limit = 0x64 (100°C default)
Reg. 0x6B Local Temp THERM limit = 0x64 (100°C
default)
Reg. 0x6C Remote 2 THERM limit = 0x64 (100°C default)
HYSTERESIS REGISTERS
Reg. 0x6D Remote 1, Local Hysteresis Register
<7:4> = Remote 1 Temp Hysteresis (4°C default)
<3:0> = Local Temp Hysteresis (4°C default)
Reg. 0x6E Remote 2 Temp Hysteresis Register
<7:4> = Remote 2 Temp Hysteresis (4°C default)
Since each hysteresis setting is four bits, hysteresis values
are programmable from 1°C to 15°C. It is not recommended that hysteresis values ever be programmed to
0°C, as this actually disables hysteresis. In effect, this
would cause the fans to cycle between normal speed and
100% speed, creating unsettling acoustic noise.
PWM DUTY CYCLE
0%
REMOTE 2 =
CPU TEMP
LOCAL =
VRM TEMP
REMOTE 1 =
AMBIENT TEMP
T
MIN
THERMAL CALIBRATION
T
MIN
THERMAL CALIBRATION
T
MIN
THERMAL CALIBRATION
T
MIN
T
RANGE
T
RANGE
T
RANGE
T
THERM
100%
0%
100%
0%
100%
0%
MUX
PWM
MIN
PWM
PWM
MIN
MIN
RAMP CONTROL
(ACOUSTIC
ENHANCEMENT)
TACHOMETER 1
MEASUREMENT
RAMP CONTROL
(ACOUSTIC
ENHANCEMENT)
TACHOMETER 2
MEASUREMENT
RAMP CONTROL
(ACOUSTIC
ENHANCEMENT)
TACHOMETER 3
AND 4
MEASUREMENT
PWM
CONFIG
PWM
GENERATOR
PWM
CONFIG
PWM
GENERATOR
PWM
CONFIG
PWM
GENERATOR
PWM1
TACH1
PWM2
TACH2
PWM3
TACH3
CPU
FAN SINK
FRONT
CHASSIS
REAR
CHASSIS
Figure 16. Understanding How T
Relates to Automatic Fan Control
THERM
–12–
REV. 0
Page 13

AN-613
STEP 7: DETERMINING T
FOR EACH TEMPERATURE
HYST
CHANNEL
T
is the amount of extra cooling a fan provides after
HYST
the temperature measured has dropped back below T
MIN
before the fan turns off. The premise for temperature
hysteresis (T
) is that without it, the fan would merely
HYST
“chatter,” or cycle on and off regularly, whenever temperature is hovering at about the T
The T
value chosen will determine the amount of
HYST
setting.
MIN
time needed for the system to cool down or heat up as
the fan is turning on and off. Values of hysteresis are
programmable in the range 1°C to 15°C. Larger values of
T
prevent the fans from chattering on and off as pre-
HYST
viously described. The T
100%
PWM DUTY CYCLE
0%
default value is set at 4°C.
HYST
T
RANGE
T
HYST
T
MIN
T
THERM
Note that the T
setting applies not only to the
HYST
temperature hysteresis for fan turn on/off, but the same
setting is used for the T
hysteresis value described
THERM
in Step 6. So programming registers 0x6D and 0x6E sets
the hysteresis for both fan on/off and the THERM function.
HYSTERESIS REGISTERS
Reg. 0x6D Remote 1, Local Hysteresis Register
<7:4> = Remote 1 Temp Hysteresis (4°C default)
<3:0> = Local Temp Hysteresis (4°C default)
Reg. 0x6E Remote 2 Temp Hysteresis Register
<7:4> = Remote 2 Temp Hysteresis (4°C default)
Note that in some applications, it is required that the
fans not turn off below T
PWM
. Bits <7:5> of Enhance Acoustics Register 1
MIN
but remain running at
MIN
(Reg. 0x62) allow the fans to be turned off, or to be kept
spinning below T
. If the fans are always on, the T
MIN
HYST
value has no effect on the fan when the temperature drops
below T
MIN
.
REMOTE 2 =
CPU TEMP
LOCAL =
VRM TEMP
REMOTE 1 =
AMBIENT TEMP
Figure 17. The T
THERMAL CALIBRATION
T
MIN
THERMAL CALIBRATION
T
MIN
THERMAL CALIBRATION
T
MIN
HYST
T
RANGE
T
RANGE
T
RANGE
100%
0%
100%
0%
100%
0%
MUX
PWM
MIN
PWM
MIN
PWM
MIN
RAMP
CONTROL
(ACOUSTIC
ENHANCEMENT)
TACHOMETER 1
MEASUREMENT
RAMP
CONTROL
(ACOUSTIC
ENHANCEMENT)
TACHOMETER 2
MEASUREMENT
RAMP
CONTROL
(ACOUSTIC
ENHANCEMENT)
TACHOMETER 3
AND 4
MEASUREMENT
PWM
CONFIG
PWM
GENERATOR
PWM
CONFIG
PWM
GENERATOR
PWM
CONFIG
PWM
GENERATOR
PWM1
TACH1
PWM2
TACH2
PWM3
TACH3
Value Applies to Fan On/Off Hysteresis and THERM Hysteresis
CPU
FAN SINK
FRONT
CHASSIS
REAR
CHASSIS
REV. 0
–13–
Page 14

AN-613
ENHANCE ACOUSTICS REG 1 (REG. 0x62)
Bit 7 (MIN3) = 0, PWM3 is OFF (0% PWM duty cycle)
when Temp is below T
MIN
– T
HYST
.
Bit 7 (MIN3) = 1, PWM3 runs at PWM3 minimum duty
cycle below T
MIN
– T
HYST
.
Bit 6 (MIN2) = 0, PWM2 is OFF (0% PWM duty cycle)
when Temp is below T
MIN
– T
HYST
.
Bit 6 (MIN2) = 1, PWM2 runs at PWM2 minimum duty
cycle below T
MIN
– T
HYST
.
Bit 5 (MIN1) = 0, PWM1 is OFF (0% PWM duty cycle)
when Temp is below T
MIN
– T
HYST
.
Bit 5 (MIN1) = 1, PWM1 runs at PWM1 minimum duty
cycle below T
DYNAMIC T
– T
MIN
CONTROL MODE
MIN
HYST
.
In addition to the automatic fan speed control mode described in the previous section, the ADT7460/ADT7463
have a mode that extends the basic automatic fan speed
control loop. Dynamic T
control allows the
MIN
ADT7460/ADT7463 to intelligently adapt the system’s
cooling solution for best system performance or lowest
possible system acoustics, depending on user or design
requirements.
AIM OF THIS SECTION
This section has two primary goals:
1. To show how dynamic T
control alleviates the
MIN
need for designing for worst-case conditions.
2. To illustrate how the dynamic T
control function
MIN
significantly reduces system design and validation
time.
DESIGNING FOR WORST-CASE CONDITIONS
When designing a system, you always design for worstcase conditions. In PC design, the worst-case conditions
include, but are not limited to:
1. Worst-Case Altitude. A computer can be operated at
different altitudes. The altitude affects the relative air
density, which will alter the effectiveness of the fan
cooling solution. For example, comparing 40°C air
temperature at 10,000 ft to 20°C air temperature at
sea level, relative air density is increased by 40%. This
means that the fan can spin 40% slower, and make less
noise, at sea level than at 10,000 ft while keeping the
system at the same temperature at both locations.
2. Worst-Case Fan. Due to manufacturing tolerances,
fan speeds in RPM are normally quoted with a tolerance of ±20%. The designer needs to assume that the
fan RPM can be 20% below tolerance. This translates
to reduced system airflow and elevated system temperature. Note that fans 20% out of tolerance will
negatively impact system acoustics since they run
faster and generate more noise.
3. Worst-Case Chassis Airflow. The same motherboard
can be used in a number of different chassis configurations. The design of the chassis and physical
location of fans and components determine the system thermal characteristics. Moreover, for a given
chassis, the addition of add-in cards, cables, or other
system configuration options can alter the system
airflow and reduce the effectiveness of the system
cooling solution. The cooling solution can also be
inadvertently altered by the end user, e.g., placing a
computer against a wall can block the air ducts and
reduce system airflow.
VENTS
I/O CARDS
GOOD CPU AIRFLOW
FAN
VENTS
GOOD VENTING = GOOD AIR EXCHANGE POOR VENTING = POOR AIR EXCHANGE
FAN FAN
I/O CARDS
POOR CPU
AIRFLOW
POWER
SUPPLY
CPU
DRIVE
BAYS
VENTS
POWER
SUPPLY
CPU
DRIVE
BAYS
Figure 18. Chassis Airflow Issues
4. Worst-Case Processor Power Consumption. This is a
data sheet maximum that does not necessarily reflect
the true processor power consumption. Designing for
worst-case CPU power consumption results in that
the processor getting overcooled (generating excess
system noise).
5. Worst-Case Peripheral Power Consumptions. The
tendency is to design to data sheet maximums for
these components (again overcooling the system).
6. Worst-Case Assembly. Every system manufactured is
unique because of manufacturing variations. Heat
sinks may be loose fitting or slightly misaligned. Too
much or too little thermal grease may be used, or variations in application pressure for thermal interface
material can affect the efficiency of the thermal solution.
How can this be accounted for in every system? Again,
the system is designed for the worst case.
T
A
SA
TIMS
CTIM
TIMC
JTIM
T
S
T
TIM
T
C
T
TIM
T
CA
CS
JA
J
HEAT
THERMAL
INTERFACE
MATERIAL
INTEGRATED
HEAT
SPREADER
SINK
SUBSTRATE
THERMAL INTERFACE MATERIAL
PROCESSOR
EPOXY
Figure 19. Thermal Model
–14–
REV. 0
Page 15

AN-613
The design usually accounts for worst-case conditions
in all of these cases.
Note, however, that the actual system is almost never
operated at worst-case conditions.
The alternative to designing for the worst case is to use
the dynamic T
DYNAMIC T
Dynamic T
matic fan control loop by adjusting the T
control function.
MIN
CONTROL—OVERVIEW
MIN
Control mode builds upon the basic auto-
MIN
MIN
value based on system performance and measured temperature. Why is this important?
Instead of designing for the worst case, the system
thermals can be defined as “operating zones.” The
ADT7460/ADT7463 will self-adjust its fan control loop to
maintain an operating zone temperature or system target temperature. For example, you can specify that the
ambient temperature in a system should be maintained
at 50°C. If the temperature is below 50°C, the fans may not
need to run or may run very slowly. If the temperature is
higher than 50°C, the fans need to throttle up. How is this
different from the automatic fan control mode?
The challenge presented by any thermal design is finding the right settings to suit the system’s fan control
solution. This can involve designing for the worst case
(as previously outlined), followed by weeks of system
thermal characterization, and finally fan acoustic optimization (for psycho-acoustic reasons). Getting the most
benefit from the automatic fan control mode involves
characterizing the system to find the best T
T
settings for the control loop, and the best
RANGE
PWM
the ADT7460/ADT7463’s dynamic T
value for the quietest fan speed setting. Using
MIN
control mode
MIN
MIN
and
shortens the characterization time and alleviates tweaking the control loop settings because the device can
self-adjust during system operation.
DYNAMIC T
The dynamic T
CONTROL—THE SPECIFICS
MIN
control mode is operated by specify-
MIN
ing the “operating zone temperatures” required for the
system. Associated with this control mode are three
operating point registers, one for each temperature
channel. This allows the system thermal solution to be
broken down into distinct thermal zones, e.g., CPU operating temperature = 70°C, VRM operating temperature =
80°C, ambient operating temperature = 50°C. The
ADT7460/ADT7463 will dynamically alter the control
solution to maintain each zone temperature as closely
as possible to their target operating points.
OPERATING POINT REGISTERS
Reg. 0x33 Remote 1 Operating Point = 0x64 (100°C)
Reg. 0x34 Local Temp Operating Point = 0x64 (100°C)
Reg. 0x35 Remote 2 Operating Point = 0x64 (100°C)
PWM DUTY CYCLE
T
T
MIN
OPERATING
POINT
LOW
Figure 20. Dynamic T
T
HIGHTTHERMTRANGE
Control Loop
MIN
TEMPERATURE
Figure 20 shows an overview of the parameters that
affect the operation of the dynamic T
control loop. A
MIN
brief description of each parameter follows:
1. T
. If temperature drops below the T
LOW
limit, an
LOW
error flag is set in a status register and an SMBALERT
interrupt can be generated.
2. T
. If temperature exceeds the T
HIGH
limit, an error
HIGH
flag gets set in a status register and an SMBALERT
interrupt can be generated.
3. T
. This is the temperature at which the fan turns on
MIN
under automatic fan speed control.
4. Operating Point. This temperature defines the target
temperature or optimal operating point for a
particular temperature zone. The ADT7460/ADT7463
attempt to maintain system temperature at about the
operating point by adjusting the T
parameter of
MIN
the control loop.
5. T
. If temperature exceeds this critical limit, the
THERM
fans can be run at 100% for maximum cooling.
6. T
. This programs the PWM duty cycle versus
RANGE
temperature control slope.
DYNAMIC T
Since the dynamic T
CONTROL PROGRAMMING
MIN
control mode is a basic extension
MIN
of the automatic fan control mode, the automatic fan control mode parameters should be programmed first. Follow
the seven steps in the Automatic Fan Control section of the
ADT7460/ADT7463 data sheet before proceeding with
dynamic T
control mode programming.
MIN
REV. 0
–15–
Page 16

AN-613
STEP 8: DETERMINING THE OPERATING POINT FOR EACH TEMPERATURE CHANNEL
The operating point for each temperature channel is the
optimal temperature for that thermal zone. The hotter
each zone is allowed to be, the quieter the system since
the fans are not required to run at 100% all of the time.
The ADT7460/ADT7463 will increase/decrease fan
speeds as necessary to maintain operating point temperature. This allows for system-to-system variation
and removes the need for worst-case design. As long as
a sensible operating point value is chosen, any T
MIN
value can be selected in the system characterization. If
the T
value is too low, the fans will run sooner than
MIN
required, and the temperature will be below the operating point. In response, the ADT7460/ADT7463 will
increase T
to keep the fans off for longer and allow
MIN
OPERATING
0%
100%
0%
100%
0%
REMOTE 2 =
CPU TEMP
LOCAL =
VRM TEMP
REMOTE 1 =
AMBIENT TEMP
THERMAL CALIBRATION
T
THERMAL CALIBRATION
T
THERMAL CALIBRATION
T
MIN
MIN
MIN
T
RANGE
T
RANGE
T
RANGE
100%
POINT
MUX
PWM
MIN
PWM
MIN
PWM
MIN
the temperature zone to get closer to the operating
point. Likewise, too high a T
value will cause the
MIN
operating point to be exceeded, and in turn, the
ADT7460/ADT7463 will reduce T
to turn the fans on
MIN
earlier to cool the system.
PROGRAMMING OPERATING POINT REGISTERS
There are three operating point registers, one associated with each temperature channel. These 8-bit
registers allow the operating point temperatures to be
programmed with 1°C resolution.
OPERATING POINT REGISTERS
Reg. 0x33 Remote 1 Operating Point = 0x64 (100°C)
Reg. 0x34 Local Temp Operating Point = 0x64 (100°C)
Reg. 0x35 Remote 2 Operating Point = 0x64 (100°C)
PWM
CONFIG
RAMP CONTROL
(ACOUSTIC
ENHANCEMENT)
TACHOMETER 1
MEASUREMENT
RAMP CONTROL
(ACOUSTIC
ENHANCEMENT)
TACHOMETER 2
MEASUREMENT
RAMP CONTROL
(ACOUSTIC
ENHANCEMENT)
TACHOMETER 3
AND 4
MEASUREMENT
PWM
GENERATOR
PWM
CONFIG
PWM
GENERATOR
PWM
CONFIG
PWM
GENERATOR
PWM1
TACH1
PWM2
TACH2
PWM3
TACH3
CPU
FAN SINK
FRONT
CHASSIS
REAR
CHASSIS
Figure 21. Operating Point Value Dynamically Adjusts Automatic Fan Control Settings
–16–
REV. 0
Page 17

AN-613
STEP 9: DETERMINING THE HIGH AND LOW LIMITS FOR EACH TEMPERATURE CHANNEL
The low limit defines the temperature at which the T
value will start to be increased if temperature falls
below this value. This has the net effect of reducing the
fan speed, allowing the system to get hotter. An interrupt can be generated when the temperature drops
below the low limit.
The high limit defines the temperature at which the T
value will start to be reduced if temperature increases
above this value. This has the net effect of increasing fan
speed in order to cool down the system. An interrupt
can be generated when the temperature rises above the
high limit.
MIN
MIN
PROGRAMMING HIGH AND LOW LIMITS
There are six limit registers; a high limit and low limit
are associated with each temperature channel. These
8-bit registers allow the high and low limit temperatures
to be programmed with 1°C resolution.
TEMPERATURE LIMIT REGISTERS
Reg. 0x4E Remote 1 Temp Low Limit = 0x81
Reg. 0x4F Remote 1 Temp High Limit = 0x7F
Reg. 0x50 Local Temp Low Limit = 0x81
Reg. 0x51 Local Temp High Limit = 0x7F
Reg. 0x52 Remote 2 Temp Low Limit = 0x81
Reg. 0x53 Remote 2 Temp High Limit = 0x7F
REV. 0
Figure 22. Dynamic T
Control in Operation
MIN
–17–
Page 18

AN-613
HOW DOES DYNAMIC T
CONTROL WORK?
MIN
The basic premise is as follows:
1. Set the target temperature for the temperature zone,
which could be, for example, the Remote 1 thermal
diode. This value is programmed to the Remote 1
operating temperature register.
2. As the temperature in that zone (Remote 1 temperature)
rises toward and exceeds the operating point temperature, T
is reduced and the fan speed increases.
MIN
3. As the temperature drops below the operating point
temperature, T
is increased, reducing the fan speed.
MIN
The loop operation is not as simple as described above.
There are a number of conditions governing situations
in which T
can increase or decrease.
MIN
SHORT CYCLE AND LONG CYCLE
The ADT7460/ADT7463 implement two loops, a short
cycle and a long cycle. The short cycle takes place every
n monitoring cycles. The long cycle takes place every 2n
monitoring cycles. The value of n is programmable for
each temperature channel. The bits are located at the
following register locations:
Remote 1 = CYR1 = Bits <2:0> of Calibration Control
Register 2 (Addr = 0x37)
Local = CYL = Bits <5:3> of Calibration Control Register 2
(Addr = 0x37)
Remote 2 = CYR2 = Bits <7:6> of Calibration Control
Register 2 and Bit 0 of Calibration Control Register 1
(Addr = 0x36)
Table II. Cycle Bit Assignments
CODE Short Cycle Long Cycle
000 8 cycles (1 s) 16 cycles (2 s)
001 16 cycles (2 s) 32 cycles (4 s)
010 32 cycles (4 s) 64 cycles (8 s)
011 64 cycles (8 s) 128 cycles (16 s)
100 128 cycles (16 s) 256 cycles (32 s)
101 256 cycles (32 s) 512 cycles (64 s)
110 512 cycles (64 s) 1024 cycles (128 s)
111 1024 cycles (128 s) 2048 cycles (256 s)
Care should be taken in choosing the cycle time. A long
cycle time means that the T
is not updated very often;
MIN
if your system has very fast temperature transients, the
dynamic T
control loop will always be lagging. If you
MIN
choose a cycle time that is too fast, the full benefit of
changing T
may not have been realized and you
MIN
change again on the next cycle; in effect you would be
overshooting. It is necessary to carry out some calibration to identify the most suitable response time.
–18–
REV. 0
Page 19

SHORT CYCLE
Figure 23 displays the steps taken during the short cycle.
WAIT n
MONITORING
CYCLES
CURRENT
TEMPERATURE
MEASUREMENT
TEMPERATURE
TEMPERATURE
MEASUREMENT
T1(n)
OPERATING
POINT
OP1
PREVIOUS
T1 (n–1)
IS T1(n) >
(OP1 – HYS)
IS T1(n) – T1(n–1)
0.25 C
YES
NO
NO
YES
DO NOTHING
DO NOTHING
(i.e., SYSTEM IS
COOLING OFF
OR CONSTANT.)
AN-613
IS T1(n) – T1(n–1) = 0.5 – 0.75
IS T1(n) – T1(n–1) = 1.0 – 1.75
IS T1(n) – T1(n–1) > 2.0
Figure 23. Short Cycle
LONG CYCLE
Figure 24 displays the steps taken during the long cycle.
WAIT 2n
MONITORING
CYCLES
CURRENT
TEMPERATURE
MEASUREMENT
TEMPERATURE
T1(n)
OPERATING
POINT
OP1
IS T1(n)
IS T1(n) < LOW TEMP LIMIT
T
< HIGH TEMP LIMIT
MIN
T
MIN
T1(n) > T
AND
AND
< OP1
AND
NO
NO
OP1
MIN
C
C
C
YES
DECREASE T
DECREASE T
DECREASE T
DECREASE T
YES
MIN
MIN
MIN
by 1 C
INCREASE
T
by 1 C
MIN
DO NOT
CHANGE
by 1 C
by 2 C
by 4 C
MIN
REV. 0
Figure 24. Long Cycle
–19–
Page 20

AN-613
EXAMPLES
The following are examples of some circumstances that
may cause T
NORMAL OPERATION—NO T
to increase or decrease or stay the same.
MIN
ADJUSTMENT
MIN
1. If measured temperature never exceeds the programmed operating point–hysteresis temperature,
then T
is not adjusted, i.e., remains at its current
MIN
setting.
2. If measured temperature never drops below the low
temperature limit, then T
THERM LIMIT
HIGH TEMP
LIMIT
OPERATING
POINT
LOW TEMP
LIMIT
HYSTERESIS
ACTUAL
TEMP
T
MIN
is not adjusted.
MIN
Figure 25. Temperature between Operating Point and
Low Temperature Limit
Since neither the operating point–hysteresis temperature nor the low temperature limit has been
exceeded, the T
at a speed determined by the fixed T
value is not adjusted and the fan runs
MIN
and T
MIN
RANGE
val-
ues defined in the automatic fan speed control mode.
OPERATING POINT EXCEEDED—T
REDUCED
MIN
When the measured temperature is below the operating
point temperature less the hysteresis, T
remains
MIN
the same.
Once the temperature exceeds the operating temperature less the hysteresis (OP – Hys), the T
starts to
MIN
decrease. This occurs during the short cycle; see Figure 23.
The rate with which T
decreases depends on the pro-
MIN
grammed value of n. It also depends on how much the
temperature has increased between this monitoring
cycle and the last monitoring cycle, i.e., if the temperature has increased by 1°C, then T
Decreasing T
has the effect of increasing the fan
MIN
is reduced by 2°C.
MIN
speed, thus providing more cooling to the system.
If the temperature is only slowly increasing in the range
(OP – Hys), i.e., ≤ 0.25°C per short monitoring cycle, then
T
does not decrease. This allows small changes in
MIN
temperature in the desired operating zone without
changing T
. The long cycle makes no change to T
MIN
MIN
in the temperature range (OP – Hys) since the temperature has not exceeded the operating temperature.
Once the temperature exceeds the operating temperature, the long cycle will cause T
to reduce by 1°C
MIN
every long cycle while the temperature remains above
the operating temperature. This takes place in addition
to the decrease in T
that would occur due to the short
MIN
cycle. In Figure 26, since the temperature is only increasing at a rate less than or equal to 0.25°C per short cycle,
no reduction in T
takes place during the short cycle.
MIN
Once the temperature has fallen below the operating
temperature, T
ture starts to increase slowly, T
stays the same. Even when the tempera-
MIN
stays the same because
MIN
the temperature increases at a rate ≤ 0.25°C per cycle.
THERM
LIMIT
HIGH TEMP
LIMIT
OPERATING
POINT
LOW TEMP
LIMIT
HYSTERESIS
T
MIN
DECREASE HERE DUE TO
SHORT CYCLE ONLY
T1(n) – T1 (n–1) = 0.5
OR 0.75
DECREASES BY 1 C
EVERY SHORT CYCLE
ACTUAL
TEMP
C = > T
MIN
NO CHANGE IN T
DUE TO ANY CYCLE SINCE
T1(n) – T1 (n–1) 0.25 C
AND T1(n) < OP = > T
STAYS THE SAME
DECREASE HERE DUE TO
C
LONG CYCLE ONLY
T1(n) – T1 (n–1)
AND T1(n) > OP = > T
DECREASES BY 1 C
EVERY LONG CYCLE
0.25 C
MIN
MIN
HERE
MIN
Figure 26. Effect of Exceeding Operating Point – Hysteresis Temperature
–20–
REV. 0
Page 21

AN-613
T
MIN
PREVENTED
FROM INCREASING
T
MIN
THERM
LIMIT
OPERATING
POINT
HIGH TEMP
LIMIT
LOW TEMP
LIMIT
ACTUAL
TEMP
HYSTERESIS
INCREASE T
MIN
CYCLE
When the temperature drops below the low temperature
limit, T
can increase in the long cycle. Increasing T
MIN
MIN
has the effect of running the fan slower and therefore
quieter. The long cycle diagram in Figure 24 shows the
conditions that need to be true for T
to increase. Here
MIN
is a quick summary of those conditions and the reasons
they need to be true.
T
can increase if
MIN
1. The measured temperature has fallen below the low
temperature limit. This means the user must choose
the low limit carefully. It should not be so low that the
temperature will never fall below it because T
MIN
would never increase and the fans would run faster
than necessary.
AND
2. T
is below the high temperature limit. T
MIN
is never
MIN
allowed to increase above the high temperature limit.
As a result, the high limit should be sensibly chosen
because it determines how high T
can go.
MIN
AND
3. T
is below the operating point temperature. T
MIN
MIN
should never be allowed to increase above the operating point temperature since the fans would not switch
on until the temperature rose above the operating point.
AND
4. The temperature is above T
control is turned off below T
. The dynamic T
MIN
.
MIN
MIN
Figure 27 shows how T
perature is above T
limit, and T
is below the high temperature limit and
MIN
increases when the current tem-
MIN
and below the low temperature
MIN
below the operating point. Once the temperature rises
above the low temperature limit, T
WHAT PREVENTS T
Since T
T
MIN
is dynamically adjusted, it is undesirable for
MIN
to reach full scale (127°C) because the fan would
FROM REACHING FULL SCALE?
MIN
never switch on. As a result, T
stays the same.
MIN
is allowed to vary only
MIN
within a specified range:
1. The lowest possible value to T
2. T
cannot exceed the high temperature limit.
MIN
3. If the temperature is below T
off or is running at minimum speed and dynamic T
is –127°C.
MIN
, the fan is switched
MIN
MIN
control is disabled.
Figure 28. T
Adjustments Limited by the High
MIN
Temperature Limit
THERM
LIMIT
HIGH TEMP
LIMIT
OPERATING
POINT
HYSTERESIS
ACTUAL
LOW TEMP
LIMIT
T
MIN
TEMP
Figure 27. Increasing T
REV. 0
for Quieter Operation
MIN
–21–
Page 22

AN-613
STEP 10: DETERMINING WHETHER TO MONITOR THERM
Using the operating point limit ensures that the dynamic
T
control mode is operating in the best possible
MIN
acoustic position while ensuring that the temperature
never exceeds the maximum operating temperature.
Using the operating point limit allows the T
MIN
to be
independent of system level issues because of its selfcorrective nature.
In PC design, the operating point for the chassis is usually the worst-case internal chassis temperature.
The optimal operating point for the processor is determined by monitoring the thermal monitor in the Intel
Pentium
®
4 processor. To do this, the PROCHOT output
of the Pentium 4 is connected to the THERM input of the
ADT7460/ADT7463.
The operating point for the processor can be determined
by allowing the current temperature to be copied to the
operating point register when the PROCHOT output
pulls the THERM input low on the ADT7460/ADT7463.
This gives the maximum temperature at which the
Pentium 4 can be run before clock modulation occurs.
ENABLING THERM TRIP POINT AS THE OPERATING POINT
Bits <4:2> of dynamic T
control Register 1 (Reg. 0x36)
MIN
enable/disable THERM monitoring to program the operating point.
DYNAMIC T
CONTROL REGISTER 1 (0x36)
MIN
<2> PHTR2 = 1 copies the Remote 2 current temperature
to the Remote 2 operating point register if THERM gets
asserted. The operating point will contain the temperature at which THERM is asserted. This allows the system
to run as quietly as possible without system performance being affected.
PHTR2 = 0 ignores any THERM assertions. The Remote 2
operating point register will reflect its programmed
value.
PHTL = 0 ignores any THERM assertions. The local tem-
perature operating point register will reflect its
programmed value.
<4> PHTR1 = 1 copies the Remote 1 current temperature
to the Remote 1 operating point register if THERM gets
asserted. The operating point will contain the temperature at which THERM is asserted. This allows the system
to run as quietly as possible without affecting system
performance.
PHTR1 = 0 ignores any THERM assertions. The Remote 1
operating point register will reflect its programmed
value.
ENABLING DYNAMIC T
Bits <7:5> of dynamic T
enable/disable dynamic T
CONTROL MODE
MIN
control Register 1 (Reg. 0x36)
MIN
control on the temperature
MIN
channels.
DYNAMIC T
<5> R2T = 1 enables dynamic T
temperature channel. The chosen T
CONTROL REGISTER 1 (0x36)
MIN
control on the Remote 2
MIN
value will be
MIN
dynamically adjusted based on the current temperature,
operating point, and high and low limits for this zone.
R2T = 0 disables dynamic T
control. The T
MIN
MIN
value
chosen will not be adjusted and the channel will behave
as described in the Automatic Fan Control section.
<6> LT = 1 enables dynamic T
temperature channel. The chosen T
control on the local
MIN
value will be
MIN
dynamically adjusted based on the current temperature,
operating point, and high and low limits for this zone.
LT = 0 disables dynamic T
control. The T
MIN
value cho-
MIN
sen will not be adjusted and the channel will behave as
described in the Automatic Fan Control section.
<7> R1T = 1 enables dynamic T
temperature channel. The chosen T
control on the Remote 1
MIN
value will be
MIN
dynamically adjusted based on the current temperature,
operating point, and high and low limits for this zone.
<3> PHTL = 1 copies the local current temperature to the
local temperature operating point register if THERM
gets asserted. The operating point will contain the temperature at which THERM is asserted. This allows the
system to run as quietly as possible without system performance being affected.
–22–
R1T = 0 disables dynamic T
control. The T
MIN
MIN
value
chosen will not be adjusted and the channel will behave
as described in the Automatic Fan Control section.
REV. 0
Page 23

AN-613
ENHANCING SYSTEM ACOUSTICS
Automatic fan speed control mode reacts instantaneously to changes in temperature, i.e., the PWM duty
cycle will respond immediately to temperature change.
Any impulses in temperature can cause an impulse in
fan noise. For psycho-acoustic reasons, the ADT7460/
ADT7463 can prevent the PWM output from reacting
instantaneously to temperature changes. Enhanced
acoustic mode will control the maximum change in
PWM duty cycle in a given time. The objective is to prevent the fan from cycling up and down and annoying the
system user.
ACOUSTIC ENHANCEMENT MODE OVERVIEW
Figure 29 gives a top-level overview of the automatic fan
control circuitry on the ADT7460/ADT7463 and where
acoustic enhancement fits in. Acoustic enhancement is
intended as a post-design “tweak” made by a system or
mechanical engineer evaluating best settings for the
system. Having determined the optimal settings for the
thermal solution, the engineer can adjust the system
acoustics. The goal is to implement a system that is
acoustically pleasing without causing user annoyance
due to fan cycling. It is important to realize that although
a system may pass an acoustic noise requirement spec,
(e.g., 36 dB), if the fan is annoying, it will fail the consumer test.
THE APPROACH
There are two different approaches to implementing
system acoustic enhancement. The first method is
temperature-centric. It involves “smoothing” transient
temperatures as they are measured by a temperature
source, e.g., Remote 1 temperature.
The temperature values used to calculate the PWM duty
cycle values would be smoothed, reducing fan speed
variation. However, this approach would cause an inherent delay in updating fan speed and would cause the
thermal characteristics of the system to change. It would
also cause the system fans to stay on longer than necessary, since the fan’s reaction is merely delayed. The user
would also have no control over noise from different
fans driven by the same temperature source. Consider
controlling a CPU cooler fan (on PWM1) and a chassis
fan (on PWM2) using Remote 1 temperature. Because
the Remote 1 temperature is smoothed, both fans would
be updated at exactly the same rate. If the chassis fan is
much louder than the CPU fan, there is no way to
improve its acoustics without changing the thermal solution of the CPU cooling fan.
The second approach is fan-centric. The idea is to control the PWM duty cycle driving the fan at a fixed rate,
e.g., 6%. Each time the PWM duty cycle is updated, it is
incremented by a fixed 6%. As a result, the fan ramps
REMOTE 2 =
CPU TEMP
LOCAL =
VRM TEMP
REMOTE 1 =
AMBIENT TEMP
THERMAL CALIBRATION
T
MIN
THERMAL CALIBRATION
T
MIN
THERMAL CALIBRATION
T
MIN
T
RANGE
T
RANGE
T
RANGE
100%
0%
100%
0%
100%
0%
MUX
ACOUSTIC
ENHANCEMENT
PWM
MIN
RAMP CONTROL
(ACOUSTIC
ENHANCEMENT)
TACHOMETER 1
MEASUREMENT
PWM
MIN
RAMP CONTROL
(ACOUSTIC
ENHANCEMENT)
TACHOMETER 2
MEASUREMENT
PWM
MIN
RAMP CONTROL
(ACOUSTIC
ENHANCEMENT)
TACHOMETER 3
MEASUREMENT
AND 4
PWM
CONFIG
PWM
GENERATOR
PWM
CONFIG
PWM
GENERATOR
PWM
CONFIG
PWM
GENERATOR
PWM1
TACH1
PWM2
TACH2
PWM3
TACH3
CPU
FAN SINK
FRONT
CHASSIS
REAR
CHASSIS
REV. 0
Figure 29. Acoustic Enhancement Smooths Fan Speed Variations under Automatic Fan Speed Control
–23–
Page 24

AN-613
smoothly to its newly calculated speed. If the temperature starts to drop, the PWM duty cycle immediately
decreases by 6% every update. So the fan ramps
smoothly up or down without inherent system delay.
Consider controlling the same CPU cooler fan (on
PWM1) and chassis fan (on PWM2) using Remote 1 temperature. The T
MIN
and T
settings have already
RANGE
been defined in automatic fan speed control mode, i.e.,
thermal characterization of the control loop has been
optimized. Now the chassis fan is noisier than the CPU
cooling fan. So PWM2 can be placed into acoustic
enhancement mode independently of PWM1. The
acoustics of the chassis fan can therefore be adjusted
without affecting the acoustic behavior of the CPU cooling
fan, even though both fans are being controlled by
Remote 1 temperature. This is exactly how acoustic
enhancement works on the ADT7460/ADT7463.
ENABLING ACOUSTIC ENHANCEMENT FOR EACH PWM
OUTPUT
ENHANCE ACOUSTICS REGISTER 1 (Reg. 0x62)
<3> = 1 Enables acoustic enhancement on PWM1 output.
ENHANCE ACOUSTICS REGISTER 2 (Reg. 0x63)
<7> = 1 Enables acoustic enhancement on PWM2 output.
<3> = 1 Enables acoustic enhancement on PWM3 output.
EFFECT OF RAMP RATE ON ENHANCED ACOUSTICS MODE
The PWM signal driving the fan will have a period, T,
given by the PWM drive frequency, f, since T = 1/f. For a
given PWM period, T, the PWM period is subdivided into
255 equal time slots. One time slot corresponds to the
smallest possible increment in PWM duty cycle. A PWM
signal of 33% duty cycle will thus be high for 1/3 255
time slots and low for 2/3 255 time slots. Therefore,
33% PWM duty cycle corresponds to a signal that is high
for 85 time slots and low for 170 time slots.
PWM_OUT
33% DUTY
CYCLE
85
TIME SLOTS
PWM OUTPUT
(ONE PERIOD)
= 255 TIME SLOTS
170
TIME SLOTS
Figure 30. 33% PWM Duty Cycle Represented in
Time Slots
The ramp rates in the enhanced acoustics mode are
selectable from the values 1, 2, 3, 5, 8, 12, 24, and 48. The
ramp rates are actually discrete time slots. For example,
if the ramp rate = 8, then eight time slots will be added to
the PWM high duty cycle each time the PWM duty cycle
needs to be increased. If the PWM duty cycle value
needs to be decreased, it will be decreased by eight time
slots. Figure 31 shows how the enhanced acoustics
mode algorithm operates.
–24–
READ
TEMPERATURE
CALCULATE
NEW PWM
DUTY CYCLE
DECREMENT
YES
NO
PREVIOUS
PWM VALUE
BY RAMP
RATE
IS NEW PWM
VALUE >
PREVIOUS
VALUE?
INCREMENT
PREVIOUS
PWM VALUE
BY RAMP
RATE
Figure 31. Enhanced Acoustics Algorithm
The enhanced acoustics mode algorithm calculates a
new PWM duty cycle based on the temperature measured. If the new PWM duty cycle value is greater than
the previous PWM value, the previous PWM duty cycle
value is incremented by either 1, 2, 3, 5, 8, 12, 24, or 48
time slots, depending on the settings of the enhance
acoustics registers. If the new PWM duty cycle value is
less than the previous PWM value, the previous PWM
duty cycle is decremented by 1, 2, 3, 5, 8, 12, 24, or 48
time slots. Each time the PWM duty cycle is incremented
or decremented, it is stored as the previous PWM duty
cycle for the next comparison.
A ramp rate of 1 corresponds to one time slot, which is
1/255 of the PWM period. In enhanced acoustics mode,
incrementing or decrementing by 1 changes the PWM
output by 1/255 100%.
STEP 11: DETERMINING THE RAMP RATE FOR ACOUSTIC ENHANCEMENT
The optimal ramp rate for acoustic enhancement can be
found through system characterization after the thermal
optimization has been finished. The effect of each ramp
rate should be logged, if possible, to determine the best
setting for a given solution.
ENHANCE ACOUSTICS REGISTER 1 (Reg. 0x62)
<2:0> ACOU Select the Ramp Rate for PWM1.
000 = 1 Time Slot = 35 seconds
001 = 2 Time Slots = 17.6 seconds
010 = 3 Time Slots = 11.8 seconds
011 = 5 Time Slots = 7 seconds
100 = 8 Time Slots = 4.4 seconds
101 = 12 Time Slots = 3 seconds
110 = 24 Time Slots = 1.6 seconds
111 = 48 Time Slots = 0.8 seconds
REV. 0
Page 25

AN-613
TIME – s
120
0
4.4
140
120
100
80
60
40
0
20
100
80
60
40
20
0
R
TEMP
PWM DUTY CYCLE (%)
TIME – s
140
0
17.6
120
100
80
60
40
20
0
120
100
80
60
40
20
0
R
TEMP
(C)
PWM DUTY CYCLE (%)
ENHANCE ACOUSTICS REGISTER 2 (Reg. 0x63)
<2:0> ACOU3 Select the ramp rate for PWM3.
000 = 1 Time Slot = 35 seconds
001 = 2 Time Slots = 17.6 seconds
010 = 3 Time Slots = 11.8 seconds
011 = 5 Time Slots = 7 seconds
100 = 8 Time Slots = 4.4 seconds
101 = 12 Time Slots = 3 seconds
110 = 24 Time Slots = 1.6 seconds
111 = 48 Time Slots = 0.8 seconds
<6:4> ACOU2 Select the ramp rate for PWM2.
000 = 1 Time Slot = 35 seconds
001 = 2 Time Slots = 17.6 seconds
010 = 3 Time Slots = 11.8 seconds
011 = 5 Time Slots = 7 seconds
100 = 8 Time Slots = 4.4 seconds
101 = 12 Time Slots = 3 seconds
110 = 24 Time Slots = 1.6 seconds
111 = 48 Time Slots = 0.8 seconds
Another way to view the ramp rates is the time it takes
for the PWM output to ramp from 0% to 100% duty cycle
for an instantaneous change in temperature. This can be
tested by putting the ADT7460/ADT7463 into manual
mode and changing the PWM output from 0% to 100%
PWM duty cycle. The PWM output takes 35 seconds to
reach 100% with a ramp rate of 1 time slot selected.
Figure 33 shows how changing the ramp rate from 48 to
8 affects the control loop. The overall response of the
fan is slower. Since the ramp rate is reduced, it takes
longer for the fan to achieve full running speed. In this
case, it took approximately 4.4 seconds for the fan to
reach full speed.
Figure 33. Enhanced Acoustics Mode with
Ramp Rate = 8
Figure 34 shows the PWM output response for a ramp
rate of 2. In this instance, the fan took about 17.6 seconds to reach full running speed.
140
R
(C)
120
100
80
60
40
20
0
TEMP
PWM CYCLE (%)
0 0.76
TIME – s
Figure 32. Enhanced Acoustics Mode with
120
100
80
60
40
20
0
Figure 34. Enhanced Acoustics Mode with
Ramp Rate = 2
Ramp Rate = 48
Figure 32 shows remote temperature plotted against
PWM duty cycle for enhanced acoustics mode. The
ramp rate is set to 48, which would correspond to the
fastest ramp rate. Assume that a new temperature reading is available every 115 ms. With these settings, it took
approximately 0.76 seconds to go from 33% duty cycle
to 100% duty cycle (full speed). Even though the temperature increased very rapidly, the fan ramps up to full
speed gradually.
REV. 0
–25–
Page 26

AN-613
Finally, Figure 35 shows how the control loop reacts to
temperature with the slowest ramp rate. The ramp rate
is set to 1, while all other control parameters
remain the same. With the slowest ramp rate selected, it
takes 35 seconds for the fan to reach full speed.
120
100
R
(C)
TEMP
80
60
PWM DUTY CYCLE (%)
40
20
0
0
TIME – s
140
120
100
80
60
40
20
0
35
Figure 35. Enhanced Acoustics Mode with
Ramp Rate = 1
As Figures 32 to 35 show, the rate at which the fan will
react to temperature change is dependent on the ramp
rate selected in the enhance acoustics registers. The
higher the ramp rate, the faster the fan will reach the
newly calculated fan speed.
SLOWER RAMP RATES
The ADT7460/ADT7463 can be programmed for much
longer ramp times by slowing the ramp rates. Each
ramp rate can be slowed by a factor of 4.
PWM1 CONFIGURATION REGISTER (Reg. 0x5C)
<3> SLOW = 1 slows the ramp rate for PWM1 by 4.
PWM2 CONFIGURATION REGISTER (Reg. 0x5D)
<3> SLOW = 1 slows the ramp rate for PWM2 by 4.
PWM3 CONFIGURATION REGISTER (Reg. 0x5E)
<3> SLOW = 1 slows the ramp rate for PWM3 by 4.
The following shows the ramp-up times when the SLOW
bit is set for each PWM output.
ENHANCE ACOUSTICS REGISTER 1 (Reg. 0x62)
<2:0> ACOU Select the ramp rate for PWM1.
000 = 140 seconds
001 = 70.4 seconds
010 = 47.2 seconds
011 = 28 seconds
100 = 17.6 seconds
101 = 12 seconds
110 = 6.4 seconds
111 = 3.2 seconds
Figure 36 shows the behavior of the PWM output as temperature varies. As the temperature is rising, the fan
speed ramps up. Small drops in temperature will not
affect the ramp-up function since the newly calculated
fan speed will still be higher than the previous PWM
value. The enhance acoustics mode allows the PWM
output to be made less sensitive to temperature variations. This will be dependent on the ramp rate selected
and programmed into the enhance acoustics registers.
90
80
70
60
50
40
30
20
10
0
PWM DUTY CYCLE (%)
R
TEMP
Figure 36. How Fan Reacts to Temperature Variation in
Enhanced Acoustics Mode
ENHANCE ACOUSTICS REGISTER 2 (Reg. 0x63)
<2:0> ACOU3 Select the ramp rate for PWM3.
000 = 140 seconds
001 = 70.4 seconds
010 = 47.2 seconds
011 = 28 seconds
100 = 17.6 seconds
101 = 12 seconds
110 = 6.4 seconds
111 = 3.2 seconds
<6:4> ACOU2 Select the ramp rate for PWM2.
000 = 140 seconds
001 = 70.4 seconds
010 = 47.2 seconds
011 = 28 seconds
100 = 17.6 seconds
101 = 12 seconds
110 = 6.4 seconds
111 = 3.2 seconds
© 2003 Analog Devices, Inc. All rights reserved. Trademarks and registered trademarks are the property of their respective companies.
–26–
REV. 0
Page 27

–27–
Page 28

E03235–0–2/03(0)
–28–
PRINTED IN U.S.A.
 Loading...