


3 nV/√Hz Ultralow Distortion,
K
www.BDTIC.com/ADI
FEATURES
Ultralow distortion
SFDR
−101 dBc @ 5 MHz
−90 dBc @ 20 MHz
−63 dBc @ 70 MHz
Third-order intercept
43 dBm @ 10 MHz
Low noise
3 nV/√Hz
3 pA/√Hz
High speed
1 GHz, −3 dB bandwidth (G = +1)
1350 V/µs slew rate
7.5 ns settling time to 0.1%
Standard and low distortion pinout
Supply current: 15 mA
Offset voltage: 1.0 mV max
Wide supply voltage range: 3.3 V to 12 V
GENERAL DESCRIPTION
The AD8045 is a unity gain stable voltage feedback amplifier
with ultralow distortion, low noise, and high slew rate. With a
spurious-free dynamic range of −90 dBc @ 20 MHz, the
AD8045 is an ideal solution in a variety of applications,
including ultrasound, ATE, active filters, and ADC drivers.
ADI’s proprietary next generation XFCB process and innovative
architecture enables such high performance amplifiers.
The AD8045 features a low distortion pinout for the LFCSP,
which improves second harmonic distortion and simplifies the
layout of the circuit board.
The AD8045 has 1 GHz bandwidth, 1350 V/µs slew rate, and
settles to 0.1% in 7.5 ns. With a wide supply voltage range (3.3 V
to 12 V) and low offset voltage (200 µV), the AD8045 is an ideal
candidate for systems that require high dynamic range, precision, and high speed.
High Speed Op Amp
AD8045
APPLICATIONS
Instrumentation
IF and baseband amplifiers
Active filters
ADC drivers
DAC buffers
The AD8045 amplifier is available in a 3 mm × 3 mm LFCSP
and the standard 8-lead SOIC. Both packages feature an
exposed paddle that provides a low thermal resistance path to
the PCB. This enables more efficient heat transfer, and increases
reliability. The AD8045 works over the extended industrial
temperature range (−40°C to +125°C).
–20
G = +1
V
–30
V
R
–40
R
–50
–60
–70
–80
–90
–100
HARMONIC DISTORTION (dBc)
–110
–120
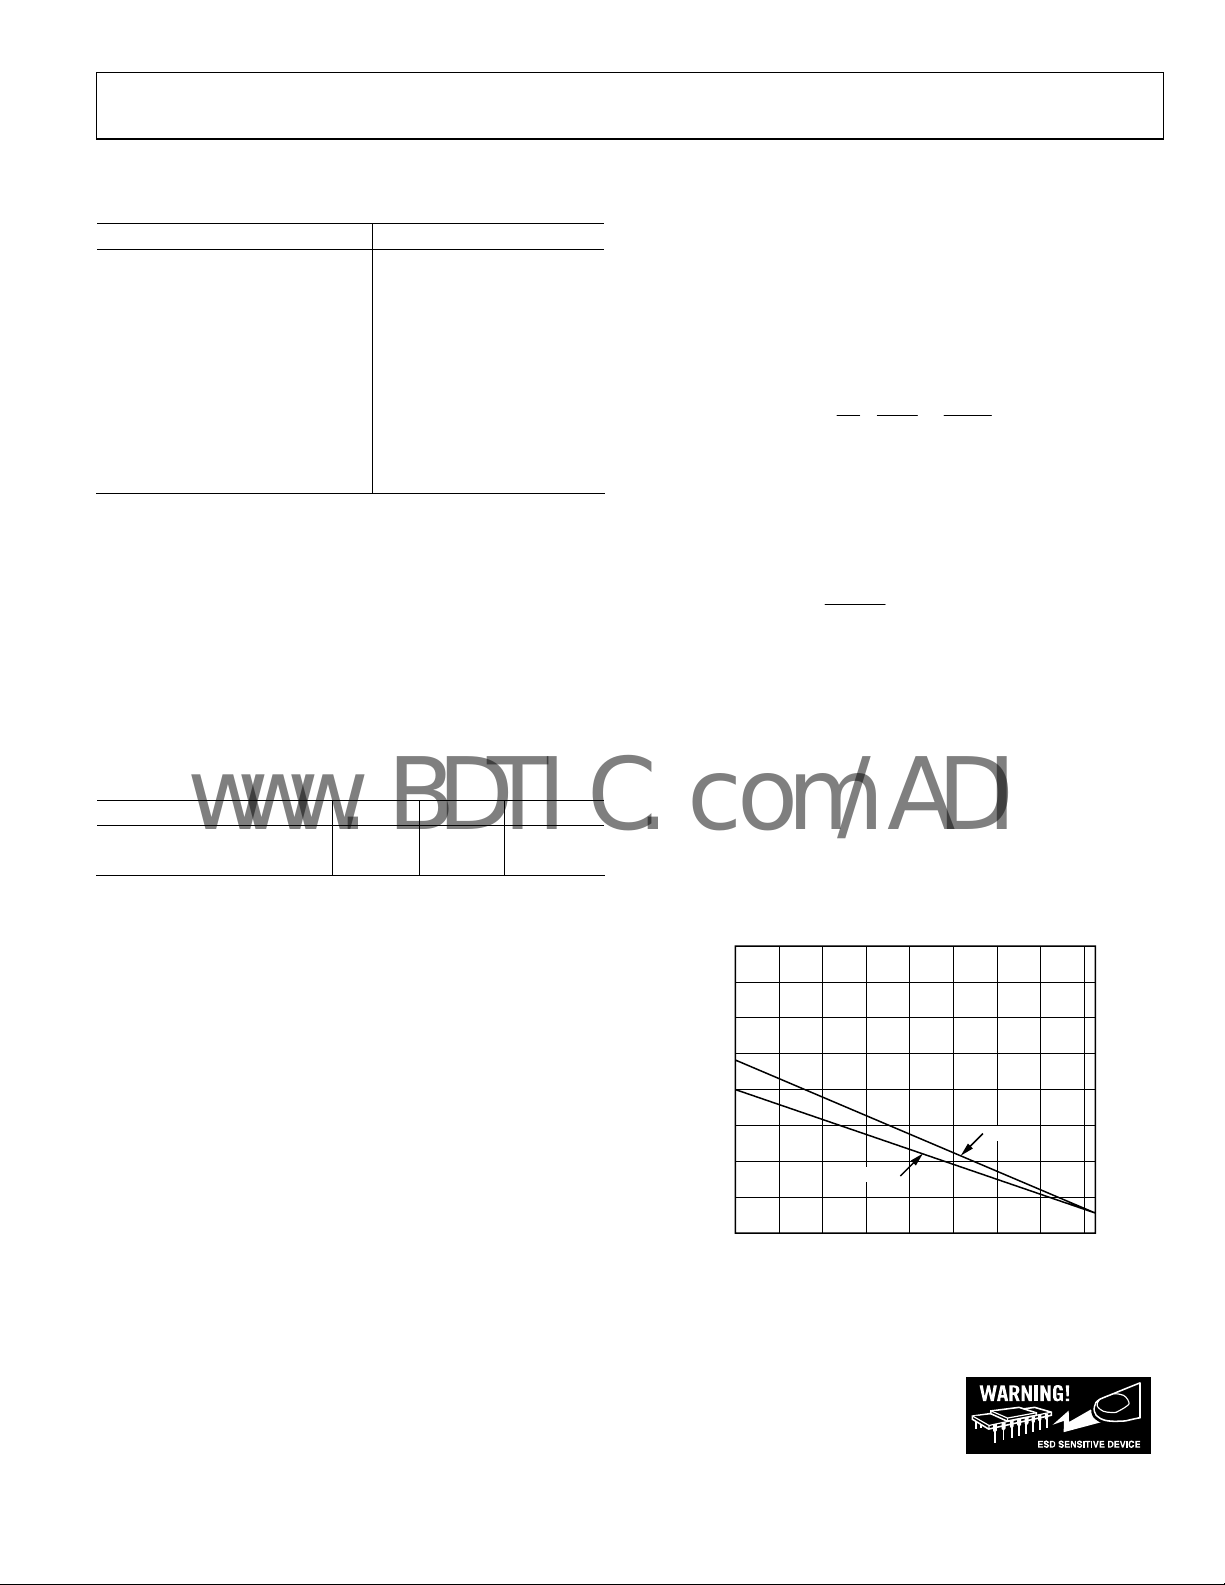
Figure 3. Harmonic Distortion vs. Frequency for Various Packages
CONNECTION DIAGRAMS
1
NC
–IN
+IN
2
3
4
FEEDBAC
Figure 1. 8-Lead AD8045 LFCSP (CP-8)
FEEDBACK
1
2
–IN
3
+IN
4
–V
S
Figure 2. 8-Lead AD8045 SOIC/EP (RD-8)
=±5V
S
= 2V p-p
OUT
= 1kΩ
L
= 100Ω
S
HD3 LFCSP
FREQUENCY (MHz)
8
7
6
5
8
7
6
5
+V
S
OUTPUT
NC
–V
S
NC
+
V
S
OUTPUT
NC
04814-0-001
04814-0-001
HD2 LFCSP
1000.1 1 10
04814-0-079
Rev. A
Information furnished by Analog Devices is believed to be accurate and reliable.
However, no responsibility is assumed by Analog Devices for its use, nor for any
infringements of patents or other rights of third parties that may result from its use.
Specifications subject to change without notice. No license is granted by implication
or otherwise under any patent or patent rights of Analog Devices. Trademarks and
registered trademarks are the property of their respective owners.
One Technology Way, P.O. Box 9106, Norwood, MA 02062-9106, U.S.A.
Tel: 781.329.4700 www.analog.com
Fax: 781.326.8703 © 2004 Analog Devices, Inc. All rights reserved.

AD8045
www.BDTIC.com/ADI
TABLE OF CONTENTS
Specifications with ±5 V Supply..................................................... 3
Applications..................................................................................... 19
Specifications with +5 V Supply..................................................... 4
Absolute Maximum Ratings............................................................ 5
Thermal Resistance ......................................................................5
ESD Caution.................................................................................. 5
Pin Configurations and Function Descriptions ...........................6
Typical Performance Characteristics............................................. 7
Circuit Configurations................................................................... 16
Wideband Operation ................................................................. 16
Theory of Operation ...................................................................... 17
Frequency Response................................................................... 17
DC Errors.................................................................................... 17
Output Noise............................................................................... 18
REVISION HISTORY
9/04—Data Sheet Changed from Rev. 0 to Rev. A
Changes to Features.........................................................................1
Changes to Specifications...............................................................4
Changes to Figure 58.....................................................................15
Changes to Figure 63.....................................................................17
Changes to Frequency Response Section................................... 17
Changes to Figure 64.....................................................................17
Changes to DC Errors Section.....................................................17
Changes to Figure 65.....................................................................17
Changes to Figure 66.....................................................................18
Changes to Output Noise Section ...............................................18
Changes to Ordering Guide.........................................................24
Low Distortion Pinout............................................................... 19
High Speed ADC Driver ........................................................... 19
90 MHz Active Low-Pass Filter (LPF)..................................... 20
Printed Circuit Board Layout ....................................................... 22
Signal Routing............................................................................. 22
Power Supply Bypassing............................................................ 22
Grounding................................................................................... 22
Exposed Paddle........................................................................... 23
Driving Capacitive Loads.......................................................... 23
Outline Dimensions....................................................................... 24
Ordering Guide .......................................................................... 24
7/04—Revision 0: Initial Version
Rev. A | Page 2 of 24

AD8045
www.BDTIC.com/ADI
SPECIFICATIONS WITH ±5 V SUPPLY
TA = 25°C, G = +1, RS = 100 Ω, RL = 1 kΩ to ground, unless noted otherwise. Exposed paddle must be floating or connected to −VS.
Table 1.
Parameter Conditions Min Typ Max Unit
DYNAMIC PERFORMANCE
–3 dB Bandwidth G = +1, V
G = +1, V
G = +2, V
Bandwidth for 0.1 dB Flatness G = +2, V
Slew Rate G = +1, V
Settling Time to 0.1% G = +2, V
NOISE/HARMONIC PERFORMANCE
Harmonic Distortion (dBc) HD2/HD3 fC = 5 MHz, V
LFCSP −102/−101 dBc
SOIC −106/−101 dBc
f
LFCSP −98/−90 dBc
SOIC −97/−90 dBc
f
LFCSP −71/−71 dBc
SOIC −60/−71 dBc
Input Voltage Noise f = 100 kHz 3 nV/√Hz
Input Current Noise f = 100 kHz 3 pA/√Hz
Differential Gain Error NTSC, G = +2, RL = 150 Ω 0.01 %
Differential Phase Error NTSC, G = +2, R
DC PERFORMANCE
Input Offset Voltage 0.2 1.0 mV
Input Offset Voltage Drift See Figure 54 8 µV/°C
Input Bias Current
Input Bias Current Drift 8 nA/°C
Input Bias Offset Current 0.2 1.3 µA
Open-Loop Gain V
INPUT CHARACTERISTICS
Input Resistance Common-mode/differential 3.6/1.0 MΩ
Input Capacitance Common-mode 1.3 pF
Input Common-Mode Voltage Range ±3.8 V
Common-Mode Rejection VCM = ±1 V −83 −91 dB
OUTPUT CHARACTERISTICS
Output Overdrive Recovery Time VIN = ±3 V, G = +2 8 ns
Output Voltage Swing RL = 1 kΩ −3.8 to +3.8 −3.9 to +3.9 V
R
Output Current 70 mA
Short-Circuit Current Sinking/sourcing 90/170 mA
Capacitive Load Drive 30% overshoot, G = +2 18 pF
POWER SUPPLY
Operating Range ±1.65 ±5 ±6 V
Quiescent Current 16 19 mA
Positive Power Supply Rejection +VS = +5 V to +6 V, −VS = −5 V −61 −68 dB
Negative Power Supply Rejection +VS = +5 V, −VS = −5 V to −6 V −66 −73 dB
= 20 MHz, V
C
= 70 MHz, V
C
2 6.3 µA
OUT
= 100 Ω −3.4 to +3.5 −3.6 to +3.6 V
L
= 0.2 V p-p 1000 MHz
OUT
= 2 V p-p 300 350
OUT
= 0.2 V p-p 320 400 MHz
OUT
= 2 V p-p, RL = 150 Ω 55 MHz
OUT
= 4 V step 1000 1350 V/µs
OUT
= 2 V step 7.5 ns
OUT
= 2 V p-p
OUT
= 2 V p-p
OUT
= 2 V p-p
OUT
= 150 Ω 0.01 Degrees
L
= −3 V to +3 V 62 64 dB
Rev. A | Page 3 of 24

AD8045
www.BDTIC.com/ADI
SPECIFICATIONS WITH +5 V SUPPLY
TA = 25°C, G = +1, RS = 100 Ω, RL = 1 kΩ to midsupply, unless otherwise noted. Exposed paddle must be floating or connected to −VS.
Table 2.
Parameter Conditions Min Typ Max Unit
DYNAMIC PERFORMANCE
–3 dB Bandwidth G = +1, V
G = +1, V
G = +2, V
Bandwidth for 0.1 dB Flatness G = +2, V
Slew Rate G = +1, V
Settling Time to 0.1% G = +2, V
NOISE/HARMONIC PERFORMANCE
Harmonic Distortion (dBc) HD2/HD3 fC = 5 MHz, V
LFCSP −89/−83 dBc
SOIC −92/−83 dBc
f
LFCSP −81/−70 dBc
SOIC −83/−70 dBc
f
LFCSP −57/−46 dBc
SOIC −57/−46 dBc
Input Voltage Noise f = 100 kHz 3 nV/√Hz
Input Current Noise f = 100 kHz 3 pA/√Hz
Differential Gain Error NTSC, G = +2, RL = 150 Ω 0.01 %
Differential Phase Error NTSC, G = +2, RL = 150 Ω 0.01 Degrees
DC PERFORMANCE
Input Offset Voltage 0.5 1.4 mV
Input Offset Voltage Drift See Figure 54 7 µV/°C
Input Bias Current
Input Bias Current Drift 7 nA/°C
Input Bias Offset Current 0.2 1.3 µA
Open-Loop Gain V
INPUT CHARACTERISTICS
Input Resistance Common-mode/differential 3/0.9 MΩ
Input Capacitance Common-mode 1.3 pF
Input Common-Mode Voltage Range 1.2 to 3.8 V
Common-Mode Rejection VCM = 2 V to 3 V −78 −94 dB
OUTPUT CHARACTERISTICS
Output Overdrive Recovery Time VIN = −0.5 V to +3 V, G = +2 10 ns
Output Voltage Swing RL = 1 kΩ 2.2 to 3.7 1.1 to 4.0 V
R
Output Current 55 mA
Short-Circuit Current Sinking/sourcing 70/140 mA
Capacitive Load Drive 30% overshoot, G = +2 15 pF
POWER SUPPLY
Operating Range 3.3 5 12 V
Quiescent Current 15 18 mA
Positive Power Supply Rejection +VS = +5 V to +6 V, −VS = 0 V −65 −67 dB
Negative Power Supply Rejection +VS = +5 V, −VS = 0 V to −1 V −70 −73 dB
= 20 MHz, V
C
= 70 MHz, V
C
2 6.6 µA
OUT
= 100 Ω 2.5 to 3.5 1.2 to 3.8 V
L
= 0.2 V p-p 900 MHz
OUT
= 2 V p-p 160 200 MHz
OUT
= 0.2 V p-p 320 395 MHz
OUT
= 2 V p-p, RL = 150 Ω 60 MHz
OUT
= 2 V step 480 1060 V/µs
OUT
= 2 V step 10 ns
OUT
= 2 V p-p
OUT
= 2 V p-p
OUT
= 2 V p-p
OUT
= 2 V to 3 V 61 63 dB
Rev. A | Page 4 of 24
AD8045
(
www.BDTIC.com/ADI
ABSOLUTE MAXIMUM RATINGS
Table 3.
Parameter Rating
Supply Voltage 12.6 V
Power Dissipation See Figure 4
Common-Mode Input Voltage −VS − 0.7 V to +VS + 0.7 V
Differential Input Voltage
Exposed Paddle Voltage −V
±V
S
S
Storage Temperature −65°C to +125°C
Operating Temperature Range −40°C to +125°C
Lead Temperature Range
300°C
(Soldering 10 sec)
Junction Temperature 150°C
Stresses above those listed under Absolute Maximum Ratings
may cause permanent damage to the device. This is a stress
rating only; functional operation of the device at these or any
other conditions above those indicated in the operational
section of this specification is not implied. Exposure to absolute
maximum rating conditions for extended periods may affect
device reliability.
THERMAL RESISTANCE
θJA is specified for the worst-case conditions, i.e., θJA is specified
for device soldered in circuit board for surface-mount packages.
Table 4. Thermal Resistance
Package Type θ
JA
θ
JC
Unit
SOIC 80 30 °C/W
LFCSP 93 35 °C/W
Maximum Power Dissipation
The maximum safe power dissipation for the AD8045 is limited
by the associated rise in junction temperature (T
) on the die. At
J
approximately 150°C, which is the glass transition temperature,
the properties of the plastic change. Even temporarily exceeding
this temperature limit may change the stresses that the package
exerts on the die, permanently shifting the parametric performance of the AD8045. Exceeding a junction temperature of
175°C for an extended period of time can result in changes in
silicon devices, potentially causing degradation or loss of
functionality.
ESD CAUTION
ESD (electrostatic discharge) sensitive device. Electrostatic charges as high as 4000 V readily accumulate
on the human body and test equipment and can discharge without detection. Although this product features
proprietary ESD protection circuitry, permanent damage may occur on devices subjected to high energy electrostatic discharges. Therefore, proper ESD precautions are recommended to avoid performance degradation
and loss of functionality.
The power dissipated in the package (P
) is the sum of the qui-
D
escent power dissipation and the power dissipated in the die
due to the AD8045 drive at the output. The quiescent power is
the voltage between the supply pins (V
current (I
).
S
= Quiescent Power + (Total D riv e Pow e r – Load Power)
P
D
⎛
V
V
()
D
⎜
IVP
SS
⎜
⎝
OUTS
×+×=
R
2
L
RMS output voltages should be considered. If
−
V
, as in single-supply operation, the total drive power is VS ×
S
. If the rms signal levels are indeterminate, consider the
I
OUT
worst case, when
D
V
= VS/4 for RL to midsupply.
OUT
2
)
4
/V
()
+×=
IVP
SS
S
R
L
In single-supply operation with R
= VS/2.
is V
OUT
Airflow increases heat dissipation, effectively reducing θ
) times the quiescent
S
⎞
⎟
⎟
⎠
L
2
V
OUT
–
R
L
R
is referenced to
L
referenced to −VS, worst case
.
JA
Also, more metal directly in contact with the package leads and
exposed paddle from metal traces, through holes, ground, and
power planes reduce θ
.
JA
Figure 4 shows the maximum safe power dissipation in the
package versus the ambient temperature for the exposed paddle
SOIC (80°C/W) and LFCSP (93°C/W) package on a JEDEC
standard 4-layer board. θ
4.0
3.5
3.0
2.5
2.0
1.5
1.0
0.5
MAXIMUM POWER DISSIPATION (Watts)
0.0
Figure 4. Maximum Power Dissipation vs. Temperature for a 4-Layer Board
values are approximations.
JA
LFCSP
AMBIENT TEMPERATURE (°C)
SOIC
120–40 –20 0 20 40 60 80 100
04814-0-080
Rev. A | Page 5 of 24

AD8045
www.BDTIC.com/ADI
PIN CONFIGURATIONS AND FUNCTION DESCRIPTIONS
NC
+V
OUTPUT
NC
8
7
S
6
BOTTOM VIEW
5
(Not to Scale)
NC = NO CONNECT
AD8045
FEEDBACK
1
–IN
2
+IN
3
4
–V
S
04814-0-003
Figure 5. SOIC Pin Configuration
Note: The exposed paddle must be connected to −VS or it must be electrically isolated (floating).
Table 5. 8-Lead SOIC Pin Function Descriptions
Pin No. Mnemonic Description
1 FEEDBACK Feedback Pin
2 −IN Inverting Input
3 +IN Noninverting Input
4 −V
S
Negative Supply
5 NC NC
6 OUTPUT Output
7 +V
S
Positive Supply
8 NC NC
9 Exposed Paddle
Must Be Connected to −V
or
S
Electrically Isolated
+V
OUTPUT
NC
–V
8
S
S
BOTTOM
7
VIEW
6
(Not to Scale)
54
1
NC
2
FEEDBACK
3
–IN
+IN
NC = NO CONNECT
04814-0-004
Figure 6 . 8-Lead LFCSP Pin Configuration
Table 6. 8-Lead LFCSP Pin Function Descriptions
Pin No. Mnemonic Description
1 NC No Connect
2 FEEDBACK Feedback Pin
3 −IN Inverting Input
4 +IN Noninverting Input
5 −V
S
Negative Supply
6 NC No Connect
7 OUTPUT Output
8 +V
S
9 Exposed Paddle
Positive Supply
Must Be Connected to −V
or
S
Electrically Isolated
Rev. A | Page 6 of 24
AD8045
www.BDTIC.com/ADI
TYPICAL PERFORMANCE CHARACTERISTICS
1
V
=±5V
S
= 1kΩ
R
L
0
–1
–2
–3
–4
–5
–6
NORMALIZED CLOSED-LOOP GAIN (dB)
–7
G = +10
FREQUENCY (MHz)
G = +2
G = –1
Figure 7. Small Signal Frequency Response for Various Gains
10001 10 100
04814-0-049
12
G = +2
11
=±5V
V
S
= 1kΩ
R
L
10
= 499Ω
R
F
9
8
7
6
5
4
3
CLOSED-LOOP GAIN (dB)
2
1
0
FREQUENCY (MHz)
18pF
10pF
5pF
0pF
100010 100
Figure 10. Small Signal Frequency Response for Various Capacitive Loads
04814-0-048
4
G = +1
=±5V
V
3
S
= 100Ω
R
S
2
1
0
–1
–2
–3
CLOSED-LOOP GAIN (dB)
–4
–5
–6
FREQUENCY (MHz)
R
L
R
= 1kΩ
L
= 500Ω
R
L
= 100Ω
100010 100
Figure 8. Small Signal Frequency Response for Various Loads
5
G = +1
R
= 1kΩ
L
4
= 100Ω
R
S
3
2
1
0
–1
–2
CLOSED-LOOP GAIN (dB)
–3
–4
–5
V
= ±2.5V
S
VS = ±5V
FREQUENCY (MHz)
100010 100
Figure 9. Small Signal Frequency Response for Various Supplies
04814-0-050
04814-0-051
4
G = +1
=±5V
V
S
3
= 1kΩ
R
L
2
1
0
–1
–2
–3
CLOSED-LOOP GAIN (dB)
–4
–5
–6
FREQUENCY (MHz)
+125°C
+25°C
–40°C
100010 100
Figure 11. Small Signal Frequency Response for Various Temperatures
6.3
G = +2
=±5V
V
S
= 499Ω
R
F
6.2
= 150Ω
R
L
6.1
6.0
5.9
CLOSED-LOOP GAIN (dB)
5.8
5.7
V
= 2V p-p
OUT
V
= 200mV p-p
OUT
1 10 100
FREQUENCY (MHz)
Figure 12. 0.1 dB Flatness vs. Frequency for Various Output Voltages
04814-0-052
04814-0-039
Rev. A | Page 7 of 24
AD8045
www.BDTIC.com/ADI
2
1
0
–1
–2
–3
–4
–5
–6
–7
CLOSED-LOOP GAIN (dB)
–8
–9
–10
V
= ±2.5V
S
FREQUENCY (MHz)
Figure 13. Large Signal Frequency Response for Various Supplies
V
OUT
G = +1
= 1kΩ
R
L
= 100Ω
R
S
= 2V p-p
V
=±5V
S
70
60
50
40
30
20
OPEN-LOOP GAIN (dB)
10
0
100010 100
04814-0-043
–10
FREQUENCY (MHz)
VS=±5V
= 1kΩ
R
L
10000.01 0.1 1 10 100
0
–45
–90
–135
–180
–225
–270
–315
–360
OPEN-LOOP PHASE (Degrees)
04814-0-064
Figure 16. Open-Loop Gain and Phase vs. Frequency
2
V
R
OUT
V
S
= 100Ω
S
= 2V p-p
R
L
1
0
–1
–2
–3
–4
–5
–6
–7
CLOSED-LOOP GAIN (dB)
–8
–9
–10
FREQUENCY (MHz)
R
L
= 100Ω
Figure 14. Large Signal Frequency Response for Various Loads
2
1
0
–1
–2
–3
–4
–5
–6
–7
NORMALIZED CLOSED-LOOP GAIN (dB)
–8
VS = ±5V
= 499Ω
R
F
= 1kΩ
R
L
= 2V p-p
V
OUT
G = +10
FREQUENCY (MHz)
G = +2
G = –1
Figure 15. Large Signal Frequency Response for Various Gains
G = +1
= ±5V
= 1kΩ
–20
G = +1
=±5V
V
S
–30
= 2V p-p
V
OUT
= 1kΩ
R
L
–40
= 100Ω
R
S
–50
–60
–70
–80
–90
–100
HARMONIC DISTORTION (dBc)
–110
100010 100
04814-0-042
–120
HD3 SOIC AND LFCSP
FREQUENCY (MHz)
HD2 LFCSP
HD2 SOIC
1000.1 1 10
04814-0-030
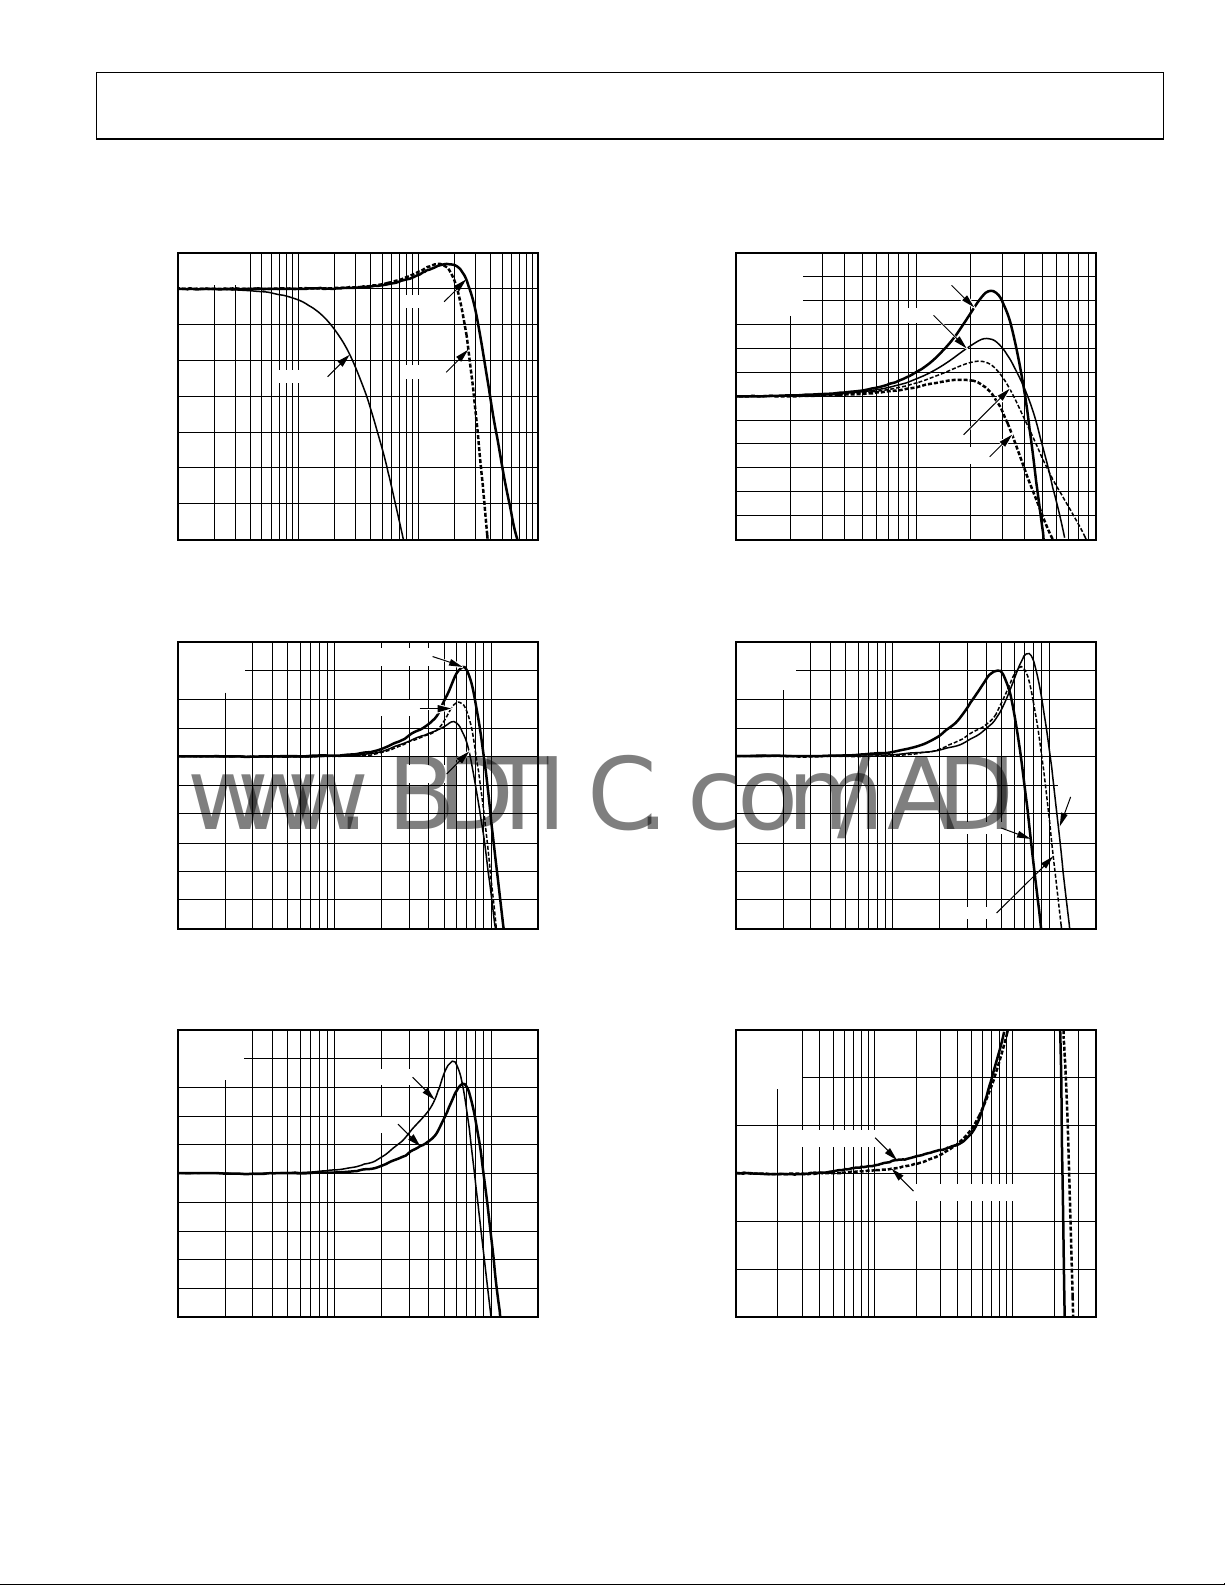
Figure 17. Harmonic Distortion vs. Frequency for Various Packages
–30
G = +1
=±5V
V
S
–40
= 4V p-p
V
OUT
= 1kΩ
R
L
–50
–60
–70
–80
–90
–100
HARMONIC DISTORTION (dBc)
–110
10001 10 100
04814-0-041
–120
0.1 1 10 100
HD3 LFCSP AND SOIC
FREQUENCY (MHz)
HD2 SOIC
HD2 LFCSP
04814-0-028
Figure 18. Harmonic Distortion vs. Frequency for Various Packages
Rev. A | Page 8 of 24

AD8045
www.BDTIC.com/ADI
–20
G = +1
=±5V
V
S
–30
= 2V p-p
V
OUT
= 100Ω
R
L
–40
= 100Ω
R
S
–50
–60
–70
–80
–90
HARMONIC DISTORTION (dBc)
HD2 LFCSP
–100
–110
0.1 1 10 100
HD2 SOIC
HD3 SOIC AND LFCSP
FREQUENCY (MHz)
Figure 19. Harmonic Distortion vs. Frequency for Various Packages
04814-0-032
–30
G = +2
=±5V
V
S
–40
= 2V p-p
V
OUT
= 150Ω
R
L
= 499Ω
R
F
–50
–60
–70
–80
–90
HARMONIC DISTORTION (dBc)
–100
–110
0.1 1 10 100
HD2 LFCSP
HD2 SOIC
HD3 SOIC AND LFCSP
FREQUENCY (MHz)
Figure 22. Harmonic Distortion vs. Frequency for Various Packages
04814-0-033
–20
G = –1
=±5V
V
S
–30
= 2V p-p
V
OUT
= 1kΩ
R
L
–40
SOIC AND LFCSP
–50
–60
–70
–80
–90
HARMONIC DISTORTION (dBc)
–100
–110
0.1 1 10 100
FREQUENCY (MHz)
HD2
HD3
Figure 20. Harmonic Distortion vs. Frequency for Various Packages
–30
G = –1
=±5V
V
S
–40
= 150Ω
R
L
= 2V p-p
V
OUT
–50
–60
–70
–80
–90
HARMONIC DISTORTION (dBc)
–100
–110
0.1 1 10 100
HD2 SOIC
HD2 LFCSP
HD3 SOIC AND LFCSP
FREQUENCY (MHz)
Figure 21. Harmonic Distortion vs. Frequency for Various Packages
04814-0-036
04814-0-037
–40
G = +10
= ±5V
V
S
= 2V p-p
V
OUT
–50
= 1kΩ
R
HARMONIC DISTORTION (dBc)
–60
–70
–80
–90
–100
–110
L
HD2 LFCSP
FREQUENCY (MHz)
HD2 SOIC
HD3 SOIC AND LFCSP
1000.1 1 10
Figure 23. Harmonic Distortion vs. Frequency for Various Packages
–50
G = +1
=±5V
V
S
= 1kΩ
R
–60
L
= 100Ω
R
S
f = 10MHz
HARMONIC DISTORTION (dBc)
–70
–80
–90
–100
–110
–120
HD3 SOIC AND LFCSP
HD2 SOIC
HD2 LFCSP
8012345 76
OUTPUT AMPLITUDE (V p-p)
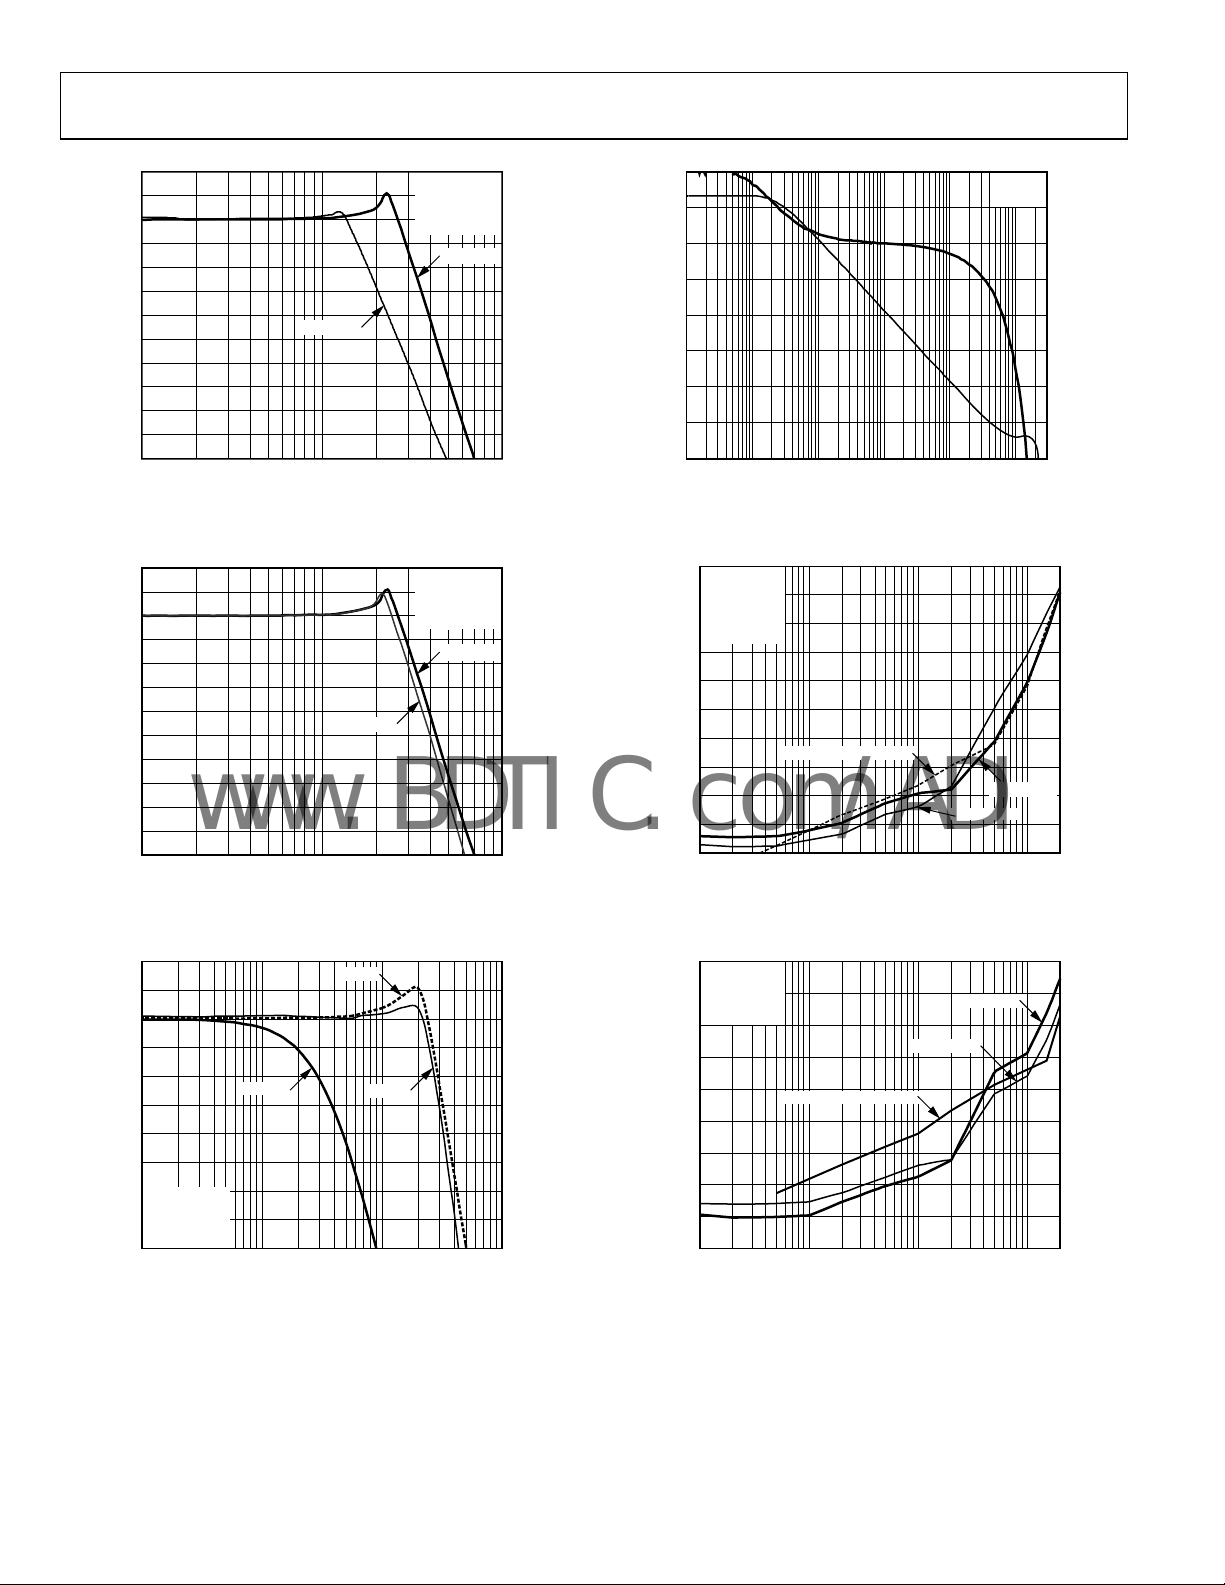
Figure 24. Harmonic Distortion vs. Output Voltage for Various Packages
04814-0-034
04814-0-025
Rev. A | Page 9 of 24

AD8045
www.BDTIC.com/ADI
–40
G = +1
V
S
R
–50
R
f = 10MHz
–60
–70
–80
=±5V
= 150Ω
L
= 100Ω
S
HD2 SOIC
HD2 LFCSP
–30
–40
–50
–60
–70
G = +1
= ±2.5
V
S
V
OUT
= 1kΩ
R
L
= 100Ω
R
S
= 2V p-p
HD3 SOIC AND LFCSP
–90
HARMONIC DISTORTION (dBc)
–100
–110
HD3 SOIC AND LFCSP
8012345 76
OUTPUT AMPLITUDE (V p-p)
Figure 25. Harmonic Distortion vs. Output Voltage for Various Packages
–40
G = –1
=±5V
V
S
–50
= 1kΩ
R
L
f = 10MHz
SOIC AND LFCSP
–60
–70
HARMONIC DISTORTION (dBc)
–80
–90
–100
–110
–120
HD2
HD3
801234567
OUTPUT VOLTAGE (V p-p)
Figure 26. Harmonic Distortion vs. Output Voltage
–40
G = –1
=±5V
V
S
–50
= 150Ω
R
L
f = 10MHz
–60
–70
HARMONIC DISTORTION (dBc)
HD2 SOIC
–80
–90
–100
–110
–120
HD2 LFCSP
HD3 SOIC AND LFCSP
801234567
OUTPUT VOLTAGE (V p-p)
Figure 27. Harmonic Distortion vs. Output Voltage
04814-0-024
04814-0-026
04814-0-027
HARMONIC DISTORTION (dBc)
–80
–90
–100
FREQUENCY (MHz)
HD2 LFCSP
HD2 SOIC
100110
Figure 28. Harmonic Distortion vs. Frequency for Various Packages
–20
G = +1
V
= ±2.5V
S
–30
= 2V p-p
V
OUT
= 100Ω
R
L
= 100Ω
R
S
–40
–50
HARMONIC DISTORTION (dBc)
–60
–70
–80
–90
–100
HD3 SOIC AND LFCSP
HD2 LFCSP
HD2 SOIC
100110
FREQUENCY (MHz)
Figure 29. Harmonic Distortion vs. Frequency for Various Packages
–20
G = –1
= ±2.5V
V
S
–30
= 2V p-p
V
OUT
= 1kΩ
R
L
SOIC AND LFCSP
–40
–50
–60
HD3
HD2
1000.1 1 10
HARMONIC DISTORTION (dBc)
–70
–80
–90
–100
FREQUENCY (MHz)
Figure 30. Harmonic Distortion vs. Frequency for Various Packages
04814-0-029
04814-0-031
04814-0-035
Rev. A | Page 10 of 24

AD8045
www.BDTIC.com/ADI
–40
G = +1
= +5V
V
S
= 1kΩ
R
–50
L
= 100Ω
R
S
f = 10MHz
–60
HD3 SOIC AND LFCSP
HD2 SOIC
HD2 LFCSP
3.00.5 1.0 1.5 2.0 2.5
OUTPUT VOLTAGE (V p-p)
HARMONIC DISTORTION (dBc)
–70
–80
–90
–100
–110
Figure 31. Harmonic Distortion vs. Output Voltage for Various Packages
04814-0-022
0.15
RS = 100Ω
= 150Ω
R
L
G = +1
0.10
= ±2.5
V
S
= ±5V
OR V
S
0.05
0
–0.05
OUTPUT VOLTAGE (V)
–0.10
–0.15
TIME (ns)
250 5 10 15 20
04814-0-012
Figure 34. Small Signal Transient Response for Various Supplies and Loads
–40
G = +1
= +5V
V
S
–50
= 150Ω
R
L
= 100Ω
R
S
f = 10MHz
–60
HARMONIC DISTORTION (dBc)
–70
–80
–90
–100
–110
HD3 SOIC AND LFCSP
HD2 SOIC
OUTPUT VOLTAGE (V p-p)
HD2 LFCSP
2.50.5 0.7 0.9 1.1 1.3 1.5 1.7 1.9 2.1 2.3
Figure 32. Harmonic Distortion vs. Output Voltage for Various Packages
s)
µ
SLEW RATE (V/
1600
1400
1200
1000
800
600
400
200
RL = 1kΩ
= ±5V
V
S
POSITIVE SLEW RATE
NEGATIVE SLEW RATE
04814-0-023
0.15
RL = 1kΩ
= 10pF
C
L
= 30Ω
R
SNUB
0.10
= ±5V
V
S
G = +1
0.05
0
–0.05
OUTPUT VOLTAGE (V)
–0.10
–0.15
R
SNUB
30Ω
C
10pF
TIME (ns)
R
L
L
1kΩ
250 5 10 15 20
Figure 35. Small Signal Transient Response for Various Supplies and Loads
0.15
0.10
0.05
0
–0.05
OUTPUT VOLTAGE (V)
–0.10
OR R
VS = ±2.5V
G = +2
= 1kΩ
R
C
= 150kΩ
C
04814-0-013
0
OUTPUT VOLTAGE STEP (V)
501234
04814-0-076
Figure 33. Slew Rate vs. Output Voltage
–0.15
Figure 36. Small Signal Transient Response for Various Loads
Rev. A | Page 11 of 24
TIME (ns)
250 5 10 15 20
04814-0-014

AD8045
www.BDTIC.com/ADI
0.20
0.15
0.10
0.05
0
–0.05
OUTPUT VOLTAGE (V)
–0.10
G = +2
–0.15
= ±5V
V
S
= 1kΩ
R
L
–0.20
Figure 37. Small Signal Transient Response with Capacitive Load
18pF
0pF
TIME (ns)
3
V
= ±5V
S
= 1kΩ
R
L
2
G = +2
1
0
–1
–2
OUTPUT VOLTAGE (V)
–3
250 5 10 15 20
04814-0-015
–4
TIME (ns)
0pF
10pF
18pF
250 5 10 15 20
04814-0-018
Figure 40. Large Signal Transient Response with Capacitive Load
3
VS = ±5V
= 100Ω
R
S
G = +2
2
1
0
–1
OUTPUT VOLTAGE (V)
–2
–3
LOAD = 1kΩ OR 150Ω
TIME (ns)
Figure 38. Large Signal Transient Response for Various Loads
3
= 1kΩ
R
L
= 100Ω
R
S
G = +1
2
1
0
–1
OUTPUT VOLTAGE (V)
–2
–3
V
= ±5V
S
VS = ±2.5V
TIME (ns)
Figure 39. Large Signal Transient Response for Various Supplies
3
2
1
0
–1
OUTPUT VOLTAGE (V)
–2
G = –1
= ±5V
V
S
= 1kΩ
R
L
250 5 10 15 20
04814-0-016
–3
TIME (ns)
250 5 10 15 20
04814-0-019
Figure 41. Large Signal Transient Response, Inverting
6
G = +1
=±5V
V
5
S
f = 5MHz
4
3
2
1
0
–1
–2
–3
–4
INPUT AND OUTPUT VOLTAGE (V)
–5
250 5 10 15 20
04814-0-017
–6
OUTPUT
INPUT
TIME (ns)
2000 20 40 60 80 100 120 140 160 180
04814-0-061
Figure 42. Input Overdrive Recovery
Rev. A | Page 12 of 24

AD8045
www.BDTIC.com/ADI
6
G = +2
=±5V
V
5
S
f = 5MHz
4
3
2
1
0
–1
–2
–3
–4
INPUT AND OUTPUT VOLTAGE (V)
–5
–6
OUTPUT
2 × INPUT
TIME (ns)
2000 20 40 60 80 100 120 140 160 180
04814-0-062
Figure 43. Output Overdrive Recovery
0
VS=±5V
–10
–20
–30
–40
–50
–60
POWER SUPPLY REJECTION (dB)
–70
–80
–PSR
+PSR
FREQUENCY (MHz)
Figure 46. Power Supply Rejection vs. Frequency
10000.01 0.1 1 10 100
04814-0-045
100
10
VOLTAGE NOISE (nV/ Hz)
1
FREQUENCY (Hz)
1G10 100 1k 10k 100k 1M 10M 100M
04814-0-053
Figure 44. Voltage Noise vs. Frequency
100
10
–30
VS=±5V
= 499Ω
R
F
–40
–50
–60
–70
–80
COMMON-MODE REJECTION (dB)
–90
FREQUENCY (MHz)
Figure 47. Commo n-Mode Re jection v s. Frequency
100k
VS=±5V
G = +1
)
Ω
10k
1000
10000.1 1 10 100
04814-0-020
CURRENT NOISE (pA/ Hz)
1
FREQUENCY (Hz)
100M100 1k 10k 100k 1M 10M
04814-0-078
Figure 45. Current Noise vs. Frequency
100
CLOSED-LOOP INPUT IMPEDANCE (
10
Figure 48. Input Impedance vs. Frequency
Rev. A | Page 13 of 24
FREQUENCY (MHz)
10001 10 100
04814-0-054

AD8045
www.BDTIC.com/ADI
1000
G = +1
V
S
)
Ω
100
=±5V
100
80
VS = ±5V
N = 450
X = 50µV
σ = 180µV
10
0.1
CLOSED-LOOP OUTPUT IMPEDANCE (
0.01
50
48
46
44
42
40
38
36
34
THIRD-ORDER INTERCEPT (dBm)
32
30
1
FREQUENCY (MHz)
Figure 49. Output Impedance vs. Frequency
10520
FREQUENCY (MHz)
Figure 50. Third-Order Intercept vs. Frequency
60
COUNT
40
20
80
60
40
COUNT
20
0
0
VS = +5V
N = 450
X = 540µV
σ = 195µV
10001 10 100
04814-0-055
G = +10
= ±5V
V
S
= 1kΩ
R
L
3040
04814-0-040
Figure 52. V
Figure 53. V
V
(µV)
OFFSET
Distribution for VS = ±5 V
OS
V
(µV)
OFFSET
Distribution for VS = +5 V
OS
900–900 –600 –300 0 600300
04814-0-063
1500–300 0 300 600 900 1200
04814-0-077
0
–0.02
G = +2
–0.04
V
= ±5V
S
–0.06
–0.08
–0.10
–0.12
–0.14
DIFFERENTIAL GAIN (%)
–0.16
–0.18
–0.20
NUMBER OF 150Ω LOADS
GAIN
PHASE
Figure 51. Differential Gain and Phase vs. Number of 150 Ω Loads
0.25
0.20
0.15
0.10
0.05
DIFFERENTIAL PHASE (Degrees)
0
101
04814-0-021
Rev. A | Page 14 of 24
500
300
100
–100
–300
–500
OFFSET VOLTAGE (µV)
–700
–900
–1100
VS = +5V
V
TEMPERATURE (°C)
= ±5V
S
125–40 –25 –10 5 20 5035 95 1108065
04814-0-058
Figure 54. Offset Voltage vs. Temperature for Various Supplies

AD8045
www.BDTIC.com/ADI
–1.0
–1.2
–1.4
–1.6
–1.8
IB+, VS = ±5V
–2.0
–2.2
–2.4
INPUT BIAS CURRENT (µA)
–2.6
–2.8
–3.0
IB–, VS = ±5V
I
+, VS = 5V
B
TEMPERATURE (°C)
–, VS = 5V
I
B
Figure 55. Input Bias Current vs. Temperature for Various Supplies
125–40 –25 –10 5 20 35 50 65 80 95 110
04814-0-059
1.5
– V
+V
S
–VS– V
OUT
OUT
1.0
0.5
VS= ±5V VS= +5V
0
–0.5
–1.0
OUTPUT SATURATION VOLTAGE (V)
–1.5
LOAD (kΩ)
Figure 58. Output Saturation Voltage vs. Load for Various Supplies
100.1 1
04814-0-044
1.20
VS = ±5V
1.15
–V
1.10
1.05
V
= 5V
1.00
0.95
OUTPUT SATURATION VOLTAGE (V)
0.90
–40 –25 –10 5 20 35 50 65 80 95 110
S
+VS– V
OUT
TEMPERATURE (°C)
S
+ V
OUT
+VS– V
R
L
–VS + V
= 1kΩ
OUT
OUT
125
Figure 56. Output Saturation Voltage vs. Temperature for Various Supplies
17.0
16.5
V
= ±5V
S
16.0
VS = 5V
15.5
SUPPLY CURRENT (mA)
15.0
04814-0-057
4
3
2
1
0
(mV)
OS
V
–1
–2
R
= 150Ω
OUT
L
(V)
–3
–4
V
RL= 1kΩ
4–4–3–2–10123
Figure 59. Input Offset Voltage vs. Output Voltage for Various Loads
0.30
0.20
0.10
0
SETTLING (%)
–0.10
–0.20
G = +2
V
=±5V
S
V
OUT
R
= 150Ω
L
R
= 499Ω
F
= 2V p-p
04814-0-047
14.5
TEMPERATURE (°C)
Figure 57. Supply Current vs. Temperature for Various Supplies
125–40 –25 –10 5 20 35 50 65 80 11095
04814-0-056
–0.30
Figure 60. Short Term 0.1% Settling Time
Rev. A | Page 15 of 24
TIME (ns)
22.50 2.5 5.0 7.5 10.0 12.5 15.0 17.5 20.0
04814-0-046

AD8045
www.BDTIC.com/ADI
CIRCUIT CONFIGURATIONS
WIDEBAND OPERATION
Figure 61 and Figure 62 show the recommended circuit
configurations for noninverting and inverting amplifiers. In
unity gain (G = +1) applications, R
frequency peaking. It is not needed for any other configurations.
For more information on layout, see the Printed Circuit Board
Layout section.
The resistor at the output of the amplifier, labeled R
only when driving large capacitive loads. Using R
stability and minimizes ringing at the output. For more information, see the Driving Capacitive Loads section.
+V
R
G
AD8045
R
S
V
IN
helps to reduce high
S
R
F
10µF
S
+
0.1µF
0.1µF
R
SNUB
SNUB
V
OUT
, is used
SNUB
improves
R
F
10µF
+V
S
+
0.1µF
R
G
V
IN
R = RG||R
F
AD8045
–V
S
0.1µF
10µF
R
SNUB
V
OUT
+
04814-0-075
Figure 62. Inverting Configuration
10µF
–V
+
S
04814-0-074
Figure 61. Noninverting Configuration
Rev. A | Page 16 of 24

AD8045
V
∆
www.BDTIC.com/ADI
THEORY OF OPERATION
The AD8045 is a high speed voltage feedback amplifier fabricated on ADI’s second generation eXtra Fast Complementary
Bipolar (XFCB) process. An H-bridge input stage is used to
attain a 1400 V/µs slew rate and low distortion in addition to a
low 3 nV/√Hz input voltage noise. Supply current and offset
voltage are laser trimmed for optimum performance.
FREQUENCY RESPONSE
The AD8045’s open-loop response over frequency can be
approximated by the integrator response shown in Figure 63.
V
IN
(dB)
IN
/V
OUT
V
f
V
OUT/VIN
0
1 10 100
CROSSOVER
=
f
FREQUENCY (MHz)
Figure 63. Open-Loop Response
f
CROSSOVER
The closed-loop transfer function for the noninverting configuration is shown in Figure 64 and is written as
RRf
V
OUT
=
V
()
IN
F
π2s
+××
F
GCROSSOVER
××++
where:
s is (2 πj)f.
f
is the frequency where the amplifier’s open-loop gain
CROSSOVER
equals 1 (0 dB).
DC gain is therefore
()
V +
OUT
=
V
IN
RR
F
G
R
G
Closed-loop −3 dB bandwidth equals
V
OUT
f
IN
CROSSOVER
V
R
G
×=
()
G
+
RR
F
The closed-loop bandwidth is inversely proportional to the
noise gain of the op amp circuit, (R
+ RG)/RG. This simple
F
model can be used to predict the −3 dB bandwidth for noise
gains above +2. The actual bandwidth of circuits with noise
gains at or below +2 is higher due to the influence of other
poles present in the real op amp.
V
OUT
= 400MHz
1000
)(π2
RfRR
GCROSSOVERG
04814-0-008
IN
DC ERRORS
Figure 65 shows the dc error contributions. The total output
error voltage is
(ERROR)OUT
The voltage error due to IB+ and IB− is minimized if RS = RF||RG.
To include the effects of common-mode and power supply
rejection, model V
VV
where:
V is the offset voltage at nominal conditions.
os
nom
V
is the change in the power supply voltage from nominal
Δ
S
conditions.
PSR is the power supply rejection.
MR is the common-mode rejection.
C
V
is the change in common-mode voltage from nominal
Δ
CM
conditions.
R
S
R
F
R
G
Figure 64. Noninverting Configuration
+
RR
G
R
G
V
∆
CMS
CMR
⎞
F
⎟
B
⎠
R
F
⎛
−=
RIV
⎜
S
B
⎝
V
R
S
OSOS
nom
OS
IB+
I
–
B
R
G
Figure 65. Amplifier DC Errors
as
OS
V
+
+=
PSR
−+
F
V
+–
OUT
⎛
++
VRI
⎜
OS
⎝
V
+–
OUT
G
+
RR
R
G
04814-0-010
04814-0-009
⎞
F
⎟
⎠
Rev. A | Page 17 of 24

AD8045
N
www.BDTIC.com/ADI
OUTPUT NOISE
Figure 66 shows the contributors to the noise at the output of a
noninverting configuration.
V
RS
R
V
IEN+
IEN–
EN
V
RF
R
F
R
G
V
RG
S
Figure 66. Amplifier DC Errors
V
+–
OUT
04814-0-011
Ven ,
V
source resistor,
, and
IN+
are due to the feedback network resistors.
R
S
are due to the amplifier. , , and
IN−
R
. Total output voltage noise,
S
V
V
R
R
F
G
R
and R
ENOUTV_
, and
F
, is the
G
rms sum of all the contributions.
V
()()()
=
ENOUT
_
n
n
S
222
n
F
G
G
f
() ()
n
22
444
GkTRGkTRkTRG||RRINGRINVenG +++××−+××++×
n
S
where:
+
RR
G
is the noise gain
n
⎛
⎜
⎝
⎞
F
G
.
⎟
R
G
⎠
Ven is the op amp input voltage noise.
I
is the op amp input current noise.
Table 7 lists the expected output voltage noise spectral density
for several gain configurations.
Table 7. Noise and Bandwidth for Various Gains
Output
Gain R
−3 dB
R
F
R
G
S
Bandwidth
1
Noise
(nV/√Hz)
+1 0 − 100 1 GHz 3.3
+2 499 499 0 400 MHz 7.4
+5 499 124 0 90 MHz 16.4
+10 499 56 0 40 MHz 31
−1 499 499 N/A 300 MHz 7.4
1
RL = 1 kΩ.
Rev. A | Page 18 of 24

AD8045
V
www.BDTIC.com/ADI
APPLICATIONS
LOW DISTORTION PINOUT
The AD8045 LFCSP package features Analog Devices new low
distortion pinout. The new pinout provides two advantages
over the traditional pinout. First, improved second harmonic
distortion performance, which is accomplished by the physical
separation of the noninverting input pin and the negative power
supply pin. Second, the simplification of the layout due to the
dedicated feedback pin and easy routing of the gain set resistor
back to the inverting input pin. This allows a compact layout,
which helps to minimize parasitics and increase stability.
The traditional SOIC pinout has been slightly modified as well
to incorporate a dedicated feedback pin. Pin 1, previously a no
connect pin on the amplifier, is now a dedicated feedback pin. The
new pinout reduces parasitics and simplifies the board layout.
Existing applications that use the traditional SOIC pinout can
take full advantage of the outstanding performance offered by
the AD8045. An electrical insulator may be required if the SOIC
rests on the ground plane or other metal trace. This is covered
in more detail in the Exposed Paddle section of this data sheet.
In existing designs, which have Pin 1 tied to ground or to
another potential, simply lift Pin 1 of the AD8045 or remove the
potential on the Pin 1 solder pad. The designer does not need to
use the dedicated feedback pin to provide feedback for the
AD8045. The output pin of the AD8045 can still be used to provide feedback to the inverting input of the AD8045.
This dc-coupled differential driver is best suited for ±5 V
operation in which optimum distortion performance is required
and the input signal is ground referenced.
511Ω
– V
V
CML
V
33Ω
CML
33Ω
2.5kΩ
100Ω
1µF0.1µF
+ V
IN
IN
20pF
0.1µF
OP27
V
INA
AD9244
V
INB
CML
AD8045
511Ω
IN
511Ω 511Ω
511Ω 511Ω
AD8045
511Ω511Ω
Figure 67. High Speed ADC Driver
The outputs of the AD8045s are centered about the AD9244’s
common-mode range of 2.5 V. The common-mode reference
voltage from the AD9244 is buffered and filtered via the OP27
and fed to the noninverting resistor network used in the level
shifting circuit.
04814-0-066
HIGH SPEED ADC DRIVER
When used as an ADC driver, the AD8045 offers results comparable to transformers in distortion performance. Many ADC
applications require that the analog input signal be dc-coupled
and operate over a wide frequency range. Under these requirements, operational amplifiers are very effective interfaces to
ADCs. An op amp interface provides the ability to amplify and
level shift the input signal to be compatible with the input range
of the ADC. Unlike transformers, operational amplifiers can be
operated over a wide frequency range down to and including dc.
Figure 67 shows the AD8045 as a dc-coupled differential driver
for the AD9244, a 14-bit 65 MSPS ADC. The two amplifiers are
configured in noninverting and inverting modes. Both amplifiers are set with a noise gain of +2 to provide better bandwidth
matching. The inverting amplifier is set for a gain of –1, while
the noninverting is set for a gain of +2. The noninverting input
is divided by 2 in order to normalize its output and make it
equal to the inverting output.
The spurious-free dynamic range (SFDR) performance is
shown in Figure 68. Figure 69 shows a 50 MHz single-tone FFT
performance.
120
100
80
60
SFDR (dBc)
40
20
0
INPUT FREQUENCY (MHz)
Figure 68. SFDR v s. Frequency
AD8045
100110
04814-0-067
Rev. A | Page 19 of 24

AD8045
K
www.BDTIC.com/ADI
0
–20
–40
–60
AIN = –1dBFS
SNR = 69.9dBc
SFDR = 65.3dBc
Setting the resistors and capacitors equal to each other greatly
simplifies the design equations for the Sallen-Key filter. The
corner frequency, or −3 dB frequency, can be described by the
equation
1
f
=
c
RC
2π
–80
DISTORTION (dBc)
–100
–120
0 5 10 15 20 25 30
Figure 69. Single-Tone FFT, F
FREQUENCY (MHz)
= 50 MHz, Sample Rate = 65 MSPS
Shown in the First Nyquist Zone
IN
04814-0-068
90 MHZ ACTIVE LOW-PASS FILTER (LPF)
Active filters are used in many applications such as antialiasing
filters and high frequency communication IF strips.
With a 400 MHz gain bandwidth product and high slew rate,
the AD8045 is an ideal candidate for active filters. Figure 70
shows the frequency response of the 90 MHz LPF. In addition to
the bandwidth requirements, the slew rate must be capable of
supporting the full power bandwidth of the filter. In this case, a
90 MHz bandwidth with a 2 V p-p output swing requires at least
1200 V/µs. This performance is achievable only at 90 MHz
because of the AD8045’s wide bandwidth and high slew rate.
The circuit shown in Figure 73 is a 90 MHz, 4-pole, Sallen-Key,
LPF. The filter comprises two identical cascaded Sallen-Key LPF
sections, each with a fixed gain of G = +2. The net gain of the
filter is equal to G = +4 or 12 dB. The actual gain shown in
Figure 70 is only 6 dB. This is due to the output voltage being
divided in half by the series matching termination resistor, R
and the load resistor.
,
T
The quality factor, or
1
Q
=
−
3
The gain, or
K, of the circuits are
Q, is shown in the equation
R3
KStageFirst
R4
R8
11, +=+=
R7
KStageSecond
Resistor values are kept low for minimal noise contribution,
offset voltage, and optimal frequency response. Due to the low
capacitance values used in the filter circuit, the PCB layout and
minimization of parasitics is critical. A few picofarads can detune
the filters corner frequency, f
. The capacitor values shown in
c
Figure 73 actually incorporate some stray PCB capacitance.
Capacitor selection is critical for optimal filter performance.
Capacitors with low temperature coefficients, such as NPO
ceramic capacitors and silver mica, are good choices for filter
elements.
20
10
0
–10
–20
–30
–40
GAIN (dB)
–50
–60
–70
–80
–90
0.1 1 10 100 1000
Figure 70. 90 MHz Low-Pass Filter Response
FREQUENCY (MHz)
04814-0-006
Rev. A | Page 20 of 24

AD8045
www.BDTIC.com/ADI
1
CH1 M4.00ns A CH1 0.00V
50.0mV
Figure 71. Small Signal Transient Response of 90 MHz LPF
INPUT
49.9Ω
R1
249Ω
R
T
R2
249Ω
7.1pF
1
CH1 M4.00ns A CH1 0.00V
04814-0-069
500mV
04814-0-070
Figure 72. Large Signal Transient Response of 90 MHz LPF
C1
7.1pF
10µF
+5V
0.1µF
U1
C2
R4
499Ω
–5V
10µF
0.1µF
R3
499Ω
R5
249Ω
R6
249Ω
7.1pF
C4
R7
499Ω
+5V
U1
–5V
C3
7.1pF
10µF
0.1µF
10µF
0.1µF
R8
499Ω
R
49.9Ω
R9
24.9Ω
C5
5pF
T
OUTPUT
04814-0-005
Figure 73. 4-Pole, 90 MHz, Sallen-Key Low-Pass Filter
Rev. A | Page 21 of 24

AD8045
www.BDTIC.com/ADI
PRINTED CIRCUIT BOARD LAYOUT
Laying out the printed circuit board (PCB) is usually the last
step in the design process and often proves to be one of the
most critical. A brilliant design can be rendered useless because
of a poor or sloppy layout. Since the AD8045 can operate into
the RF frequency spectrum, high frequency board layout considerations must be taken into account. The PCB layout, signal
routing, power supply bypassing, and grounding all must be
addressed to ensure optimal performance.
SIGNAL ROUTING
The AD8045 LFCSP features the new low distortion pinout with
a dedicated feedback pin and allows a compact layout. The
dedicated feedback pin reduces the distance from the output to
the inverting input, which greatly simplifies the routing of the
feedback network.
When laying out the AD8045 as a unity gain amplifier, it is rec-
mmended that a short, but wide, trace between the dedicated
o
feedback pin and the inverting input to the amplifier be used to
minimize stray parasitic inductance.
To minimize parasitic inductances, ground planes should be
under high frequency signal traces. However, the ground
used
plane should be removed from under the input and output pins
to minimize the formation of parasitic capacitors, which
degrades phase margin. Signals that are susceptible to noise
pickup should be run on the internal layers of the PCB, which
can provide maximum shielding.
POWER SUPPLY BYPASSING
Power supply bypassing is a critical aspect of the PCB design
process. For best performance, the AD8045 power supply pins
need to be properly bypassed.
A parallel connection of capacitors from each of the power
upply pins to ground works best. Paralleling different values
s
and sizes of capacitors helps to ensure that the power supply
pins “see” a low ac impedance across a wide band of frequencies.
This is important for minimizing the coupling of noise into the
amplifier. Starting directly at the power supply pins, the smallest
value and sized component should be placed on the same side
of the board as the amplifier, and as close as possible to the
amplifier, and connected to the ground plane. This process
should be repeated for the next larger value capacitor. It is
recommended for the AD8045 that a 0.1 µF ceramic 0508 case
be used. The 0508 offers low series inductance and excellent
high frequency performance. The 0.1 µF case provides low
impedance at high frequencies. A 10 µF electrolytic capacitor
should be placed in parallel with the 0.1 µF. The 10 µf capacitor
provides low ac impedance at low frequencies. Smaller values
of electrolytic capacitors may be used depending on the circuit
requirements. Additional smaller value capacitors help to
rovide a low impedance path for unwanted noise out to higher
p
frequencies but are not always necessary.
Placement of the capacitor returns (grounds), where the capaci-
enter into the ground plane, is also important. Returning
tors
the capacitors grounds close to the amplifier load is critical for
distortion performance. Keeping the capacitors distance short,
but equal from the load, is optimal for performance.
In some cases, bypassing between the two supplies can help to
mprove PSRR and to maintain distortion performance in
i
crowded or difficult layouts. It is brought to the designer’s
attention here as another option to improve performance.
Minimizing the trace length and widening the trace from the
apacitors to the amplifier reduce the trace inductance. A series
c
inductance with the parallel capacitance can form a tank circuit,
which can introduce high frequency ringing at the output. This
additional inductance can also contribute to increased distortion due to high frequency compression at the output. The use
of vias should be minimized in the direct path to the amplifier
power supply pins since vias can introduce parasitic inductance,
which can lead to instability. When required, use multiple large
diameter vias because this lowers the equivalent parasitic
inductance.
GROUNDING
The use of ground and power planes is encouraged as a method
of proving low impedance returns for power supply and signal
currents. Ground and power planes can also help to reduce stray
trace inductance and to provide a low thermal path for the
amplifier. Ground and power planes should not be used under
any of the pins of the AD8045. The mounting pads and the
ground or power planes can form a parasitic capacitance at the
amplifiers input. Stray capacitance on the inverting input and
the feedback resistor form a pole, which degrades the phase
margin, leading to instability. Excessive stray capacitance on the
output also forms a pole, which degrades phase margin.
Rev. A | Page 22 of 24

AD8045
www.BDTIC.com/ADI
EXPOSED PADDLE
The AD8045 features an exposed paddle, which lowers the
thermal resistance by 25% compared to a standard SOIC plastic
package. The exposed paddle of the AD8045 is internally connected to the negative power supply pin. Therefore, when laying
out the board, the exposed paddle must either be connected to
the negative power supply or left floating (electrically isolated).
Soldering the exposed paddle to the negative power supply metal
ensures maximum thermal transfer. Figure 74 and Figure 75 show
the proper layout for connecting the SOIC and LFCSP exposed
paddle to the negative supply.
04814-0-071
Figure 74. SOIC Exposed Paddle Layout
The use of thermal vias or “heat pipes” can also be incorporated
into the design of the mounting pad for the exposed paddle.
These additional vias help to lower the overall theta junction to
ambient (θ
). Using a heavier weight copper on the surface to
JA
which the amplifier’s exposed paddle is soldered can greatly
reduce the overall thermal resistance “seen” by the AD8045.
THERMAL CONDUCTIVE INSULATOR
Figure 76. SOIC with Thermal Conductive Pad Material
The thermal pad provides high thermal conductivity but
isolates the exposed paddle from ground or other potential. It is
recommended, when possible, to solder the paddle to the negative power supply plane or trace for maximum thermal transfer.
Note that soldering the paddle to ground shorts the negative
power supply to ground and can cause irreparable damage to
the AD8045.
DRIVING CAPACITIVE LOADS
In general, high speed amplifiers have a difficult time driving
capacitive loads. This is particularly true in low closed-loop
gains, where the phase margin is the lowest. The difficulty arises
because the load capacitance, C
resistance, R
, of the amplifier. The pole can be described by the
O
equation
f
1
=
P
2π
O
CR
L
If this pole occurs too close to the unity gain crossover point,
the phase margin degrades. This is due to the additional phase
loss associated with the pole.
, forms a pole with the output
L
04814-0-072
04814-0-073
Figure 75. LFCSP Exposed Paddle Layout
For existing designs that want to incorporate the AD8045,
electrically isolating the exposed paddle is another option. If the
exposed paddle is electrically isolated, the thermal dissipation is
primarily through the leads, and the thermal resistance of the
package now approaches 125°C/W, the standard SOIC θ
.
JA
However, a thermally conductive and electrically isolated pad
material may be used. A thermally conductive spacer, such as
the Bergquist Company’s Sil-Pad, is an excellent solution to this
problem. Figure 76 shows a typical implementation using
thermal pad material.
The AD8045 output can drive 18 pF of load capacitance directly,
in a gain of +2 with 30% overshoot, as shown in Figure 37.
Larger capacitance values can be driven but must use a snubbing resistor (R
Figure 61 and Figure 62. Adding a small series resistor, R
) at the output of the amplifier, as shown in
SNUB
SNUB
,
creates a zero that cancels the pole introduced by the load
capacitance. Typical values for R
can range from 25 Ω to
SNUB
50 Ω. The value is typically arrived at empirically and based on
the circuit requirements.
Rev. A | Page 23 of 24

AD8045
Y
R
www.BDTIC.com/ADI
OUTLINE DIMENSIONS
4.00 (0.157)
3.90 (0.154)
3.80 (0.150)
5.00 (0.197)
4.90 (0.193)
4.80 (0.189)
85
TOP VIEW
6.20 (0.244)
6.00 (0.236)
41
5.80 (0.228)
BOTTOM VIEW
(PINS UP)
2.29 (0.092)
2.29 (0.092)
1.27 (0.05)
BSC
0.25 (0.0098)
0.10 (0.0039)
COPLANARIT
0.10
CONTROLLING DIMENSIONS ARE IN MILLIMETERS; INCH DIMENSIONS
(IN PARENTHESES) ARE ROUNDED-OFF MILLIMETER EQUIVALENTS FOR
REFERENCE ONLY AND ARE NOT APPROPRIATE FOR USE IN DESIGN
SEATING
PLANE
COMPLIANT TO JEDEC STANDARDS MS-012
1.75 (0.069)
1.35 (0.053)
0.51 (0.020)
0.31 (0.012)
0.25 (0.0098)
0.17 (0.0068)
0.50 (0.020)
0.25 (0.010)
8°
1.27 (0.050)
0°
0.40 (0.016)
× 45°
Figure 77. 8-Lead Standard Small Outline Package with Exposed Pad [SOIC_N_EP], Narrow Body (RD-8-1)—Dimensions shown in millimeters and (inches)
0.50
0.40
PAD
0.30
4
1
1.60
1.45
1.30
1.50
REF
PIN 1
INDICATOR
1.90
1.75
1.60
PIN 1
INDICATO
0.90
0.85
0.80
SEATING
PLANE
12° MAX
3.00
BSC SQ
TOP
VIEW
0.30
0.23
0.18
0.80 MAX
0.65TYP
2.75
BSC SQ
0.20 REF
0.05 MAX
0.02 NOM
0.45
0.50
BSC
0.60 MAX
0.25
MIN
8
EXPOSED
(BOTTOMVIEW)
5
Figure 78. 8-Lead Lead Frame Chip Scale Package [LFCSP], 3 mm × 3 mm Body (CP-8-2)—Dimensions shown in millimeters
ORDERING GUIDE
Minimum
Model
Ordering Quantity Temperature Range Package Description
AD8045ARD 1 –40°C to +125°C 8-Lead SOIC_N_EP RD-8-1
AD8045ARD-REEL 2,500 –40°C to +125°C 8-Lead SOIC_N_EP RD-8-1
AD8045ARD-REEL7 1,000 –40°C to +125°C 8-Lead SOIC_N_EP RD-8-1
AD8045ARDZ
1
1 –40°C to +125°C 8-Lead SOIC_N_EP RD-8-1
AD8045ARDZ-REEL1 2,500 –40°C to +125°C 8-Lead SOIC_N_EP RD-8-1
AD8045ARDZ-REEL71 1,000 –40°C to +125°C 8-Lead SOIC_N_EP RD-8-1
AD8045ACP-R2 250 –40°C to +125°C 8-Lead LFCSP CP-8-2 H8B
AD8045ACP-REEL 5,000 –40°C to +125°C 8-Lead LFCSP CP-8-2 H8B
AD8045ACP-REEL7 1,500 –40°C to +125°C 8-Lead LFCSP CP-8-2 H8B
AD8045ACPZ-R21 250 –40°C to +125°C 8-Lead LFCSP CP-8-2 H8B
AD8045ACPZ-REEL1 5,000 –40°C to +125°C 8-Lead LFCSP CP-8-2 H8B
AD8045ACPZ-REEL71 1,500 –40°C to +125°C 8-Lead LFCSP CP-8-2 H8B
1
Z = Pb-free part.
© 2004 Analog Devices, Inc. All rights reserved. Trademarks and
registered trademarks are the property of their respective owners.
D04814–0–9/04(A)
Rev. A | Page 24 of 24
Package
Option Branding
 Loading...