

Quad 350 MHz
a
FEATURES
Quad High-Speed Current Feedback Amplifier
with Disable
–3 dB Bandwidth 350 MHz @ G = 1
Slew Rate 2400 V/s, V
Drives High Capacitive Loads
Settling Time to 0.1% in 35 ns; 300 pF Load, 6 V Step
Settling Time to 0.1% in 18 ns; 5 pF Load, 2 V Step
Low Power
Operates on +5 V to 12 V (+24 V)
4 mA/Amplifier Supply Current
Excellent Video Specs (R
Gain Flatness 0.1 dB to 70 MHz
0.04% Differential Gain
0.09 Differential Phase
Crosstalk –58 dB @ 5 MHz
THD –72 dBc @ 5 MHz
Outstanding DC Accuracy
is 2 mV (Typ)
V
OFFSET
is 3 A (Max)
I
BIAS
16-Lead SOIC Package
= 12 V
S
= 150 , G = 2)
L
24 V Amplifier
AD8024
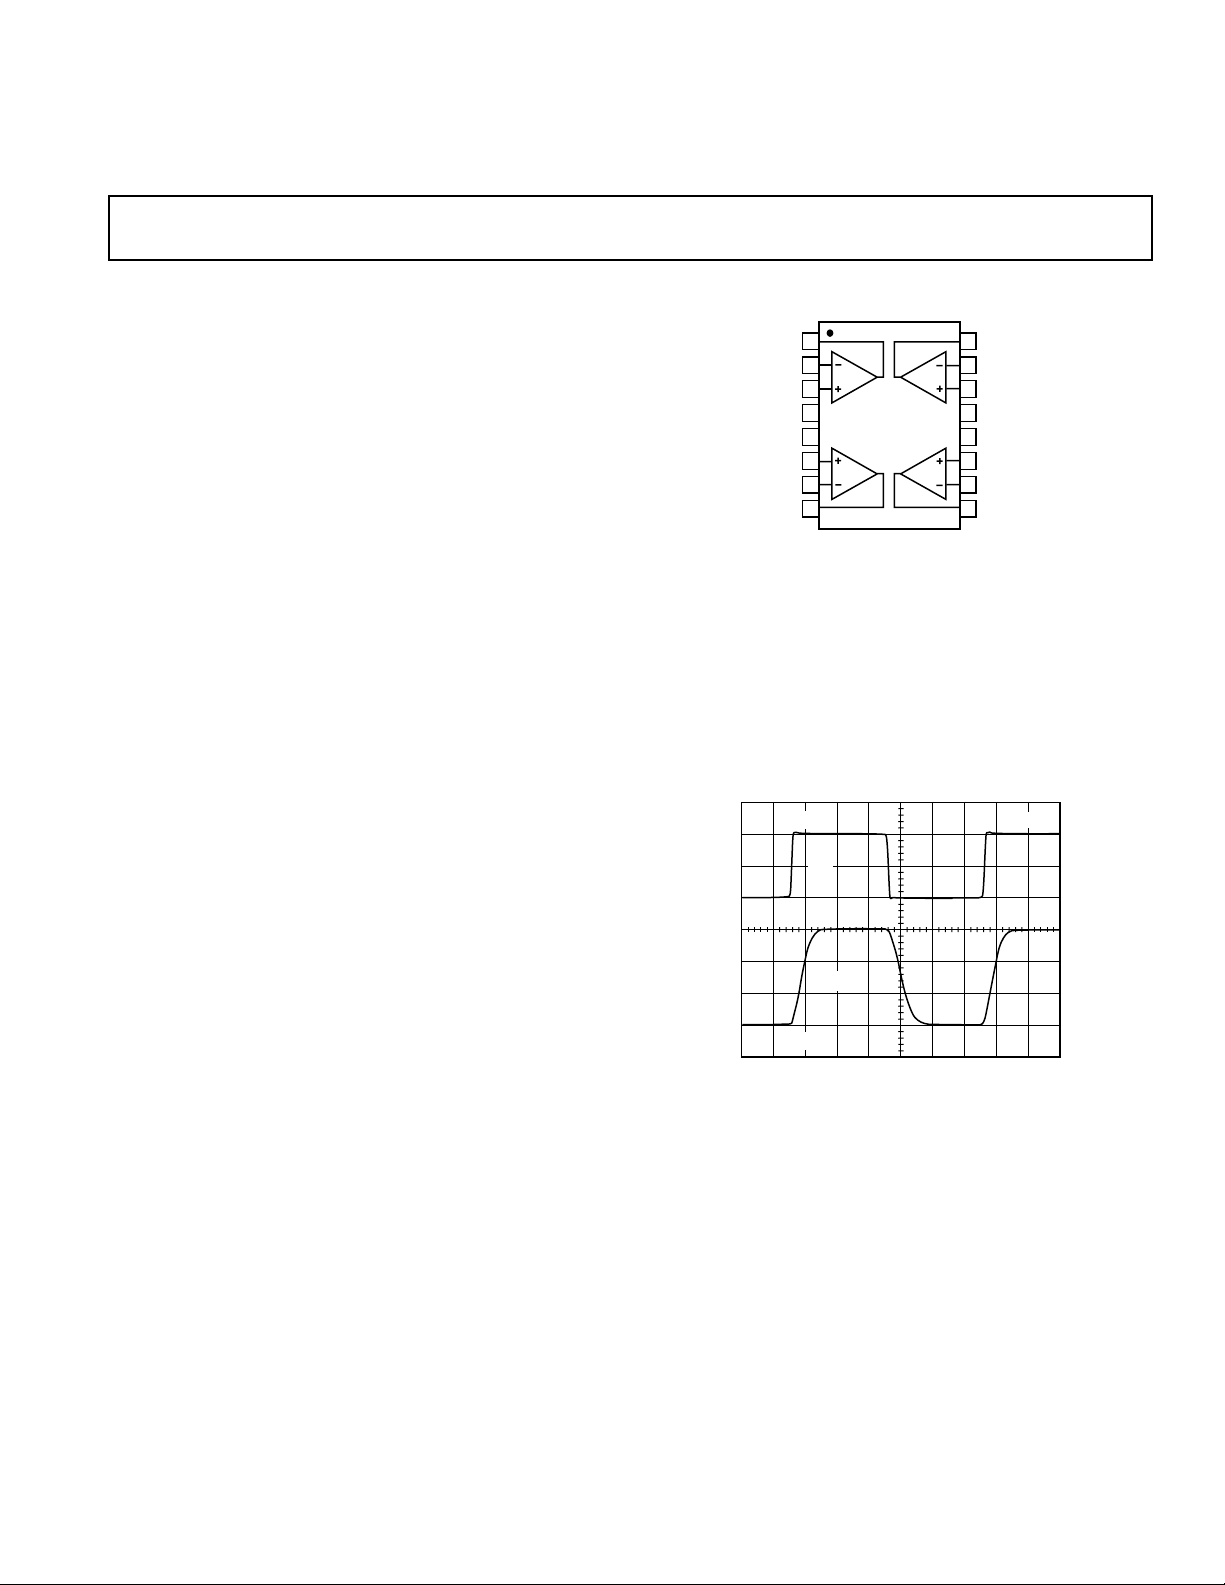
FUNCTIONAL BLOCK DIAGRAM
V
DIS
1
2
3
4
CC
5
6
7
8
AD8024AR
16
15
14
13
12
11
10
9
V
EE
DGND
APPLICATIONS
LCD Column Drivers
High-Performance Test Equipment
Video Line Driver
ATE
PRODUCT DESCRIPTION
The AD8024 is a low settling time, high-speed, high output
voltage quad current feedback operational amplifier. Manufactured on ADI’s proprietary XFHV high-speed bipolar process,
the AD8024 is capable of driving to within 1.3 V of its 24 V
supply rail. Each amplifier has high-output current capability
and can drive high capacitive loads.
The AD8024 outputs settle to 0.1% within 35 ns into a 300 pF
load (6 V swing). The AD8024 can run on both +5 V as well as
± 12 V rails. Slew rate on ± 12 V supplies is 2400 V/µs. DC
Characteristics are outstanding with typical 2 mV offset, and
3 µA maximum input bias current. High-speed disable pin
allows the AD8024 to be shut down when not in use. Low-power
operation is assured with the 4 mA/Amplifier supply current draw.
The high voltage drive capability, low settling time, high slew
rate, low offset, and high bandwidth make the AD8024 ideally
suited as an LCD column driver, a video line driver, and for
use in high-performance test equipment.
The AD8024 is available in a 16-lead SOIC package.
1V 20ns
V
IN
V
OUT
2V
Figure 1. Pulse Response Driving a Large Load Capacitance, C
R
L
= 300 pF, G = 3, RFB = 2.32 kΩ, RS = 10.5 Ω,
L
= 1 kΩ, VS = ±7.5 V
REV. B
Information furnished by Analog Devices is believed to be accurate and
reliable. However, no responsibility is assumed by Analog Devices for its
use, nor for any infringements of patents or other rights of third parties
which may result from its use. No license is granted by implication or
otherwise under any patent or patent rights of Analog Devices.
One Technology Way, P.O. Box 9106, Norwood, MA 02062-9106, U.S.A.
Tel: 781/329-4700 World Wide Web Site: http://www.analog.com
Fax: 781/326-8703 © Analog Devices, Inc., 2000

AD8024–SPECIFICATIONS
(@ TA = 25C, VS = 7.5 V, C
= 10 pF, RL = 150 , unless otherwise noted)
LOAD
Model Conditions Min Typ Max Unit
DYNAMIC PERFORMANCE
Bandwidth (3 dB) R
= 800 Ω, No Peaking, G = 3 160 200 MHz
FB
Bandwidth (0.1 dB) No Peaking, G = 3 25 MHz
Slew Rate 6 V Step, G = 3, C
Settling Time to 0.1% T
= 25°C to 85°C, ±3 V (6 V Step) 30 ns
A
= 300 pF, RS = 10.5 Ω, R
C
LOAD
R
= 2.32 kΩ
FB
±1 V (2 V Step), C
RS = 0 Ω, R
LOAD
= 300 pF 370 390 V/µs
LOAD
> 1 kΩ,
LOAD
= 5 pF, 18 ns
LOAD
> 1 kΩ, RFB = 750 kΩ
NOISE/HARMONIC PERFORMANCE
Total Harmonic Distortion f
= 5 MHz, RL = 1 kΩ –72 dBc
C
f
= 5 MHz, RL = 150 Ω –67 dBc
C
Input Voltage Noise f = 10 kHz 3 nV/√Hz
Input Current Noise f = 10 kHz (–I
Differential Gain (R
= 150 Ω) f = 3.58 MHz, G = 2 0.04 %
L
) 8 pA/√Hz
IN
Differential Phase (RL = 150 Ω) f = 3.58 MHz, G = 2 0.09 Degrees
DC PERFORMANCE
Input Offset Voltage T
MIN
to T
MAX
25 mV
Offset Drift 1.5 µV/°C
+Input Bias Current 1 7.5 µA
–Input Bias Current 13 µA
Open-Loop Transresistance 0.850 1.2 MΩ
T
MIN
to T
MAX
0.840 MΩ
INPUT CHARACTERISTICS
Input Resistance
+Input T
–Input T
MIN
MIN
to T
to T
MAX
MAX
1MΩ
135 Ω
Input Capacitance 2pF
Input Common-Mode Voltage –V
+ 1.2 +VS – 2 V
S
Common-Mode Rejection Ratio
Input Offset Voltage 62 66 dB
–Input Current 0.2 µA/V
+Input Current 1 µA/V
OUTPUT CHARACTERISTICS
Output Voltage Swing
R
= 1 kΩ VOL – V
L
V
R
= 150 Ω VOL – V
L
V
CC
CC
– V
– V
EE
OH
EE
OH
0.8 1.0 V
1.1 1.3 V
1.0 1.35 V
1.3 1.55 V
Linear Output Current Error <3%, R1 = 50 Ω 35 50 mA
Max Dynamic Output Current 300 mA
Capacitive Load Drive 1000 pF
MATCHING CHARACTERISTICS
Dynamic
Crosstalk (Worst Between Any 2) G = 2, f = 5 MHz –58 dB
DC
Input Offset Voltage Match 0.4 1.5 mV
Input Current Match 0.1 2.0 µA
POWER SUPPLY
Operating Range Single Supply 5 24 V
Dual Supply ±2.5 ± 12 V
Total Quiescent Current 16 17 mA
T
MIN to TMAX
19.5 mA
Disable = HIGH 0.5 1 mA
Power Supply Rejection Ratio
Input Offset Voltage V
= ±6.5 V to ±8.5 V 64 70 dB
S
–Input Current 0.03 µA/V
+Input Current 0.07 µA/V
–2–
REV. B
AD8024
WARNING!
ESD SENSITIVE DEVICE
Model Conditions Min Typ Max Unit
DISABLE CHARACTERISTICS
Off Isolation f = 6 MHz 49 dB
Off Output Impedance 20 pF
Turn-On Time 25 ns
Turn-Off Time 20 ns
Switching Threshold VTH – DGND 1.3 1.6 1.9 V
OPERATING TEMPERATURE RANGE –40 +85 °C
Specifications subject to change without notice.
ABSOLUTE MAXIMUM RATINGS*
Supply Voltage VCC – VEE................... 26 V Total
Internal Power Dissipation
Small Outline (R) ..... 1.0Watts (Observe Derating Curve)
Input Voltage (Common Mode) ................... ±V
S
Differential Input Voltage ............... ± 3 V (Clamped)
Output Voltage Limit
Maximum .................................. +V
Minimum ................................... –V
S
S
Output Short Circuit Duration
...................... Observe Power Derating Curve
Storage Temperature Range
R Package ........................ –65°C to +125°C
Operating Temperature Range
AD8024A .......................... –40°C to +85°C
Lead Temperature Range (Soldering 10 sec) ......... 300°C
*Stresses above those listed under Absolute Maximum Ratings may cause perma-
nent damage to the device. This is a stress rating only; functional operation of the
device at these or any other conditions above those indicated in the operational
section of this specification is not implied. Exposure to absolute maximum rating
conditions for extended periods may affect device reliability.
ORDERING GUIDE
Model Range Description Option
AD8024AR-16 –40°C to +85°C 16-Lead Narrow-Body R-16A
Temperature Package Package
SOIC
Maximum Power Dissipation
The maximum power that can be safely dissipated by the AD8024
is limited by the associated rise in junction temperature. The
maximum safe junction temperature for the plastic encapsulated
parts is determined by the glass transition temperature of the
plastic, about 150°C. Temporarily exceeding this limit may
cause a shift in parametric performance due to a change in the
stresses exerted on the die by the package. Exceeding a junction
temperature of 175°C for an extended period can result in
device failure.
Output Short Circuit Limit
The AD8024’s internal short circuit limitation is not sufficient
to protect the device in the event of a direct short circuit between a video output and a power supply voltage rail (V
). Temporary short circuits can reduce an output’s ability to
V
EE
CC
or
source or sink current and therefore impact the device’s ability
to drive a load. Short circuits of extended duration can cause
metal lines to fuse open, rendering the device nonfunctional.
To prevent these problems, it is recommended that a series
resistor be placed as close as possible to the outputs. This will
serve to substantially reduce the magnitude of the fault currents
and protect the outputs from damage caused by intermittent
short circuits. This may not be enough to guarantee that the
maximum junction temperature (150°C) is not exceeded under
all conditions. To ensure proper operation, it is necessary to
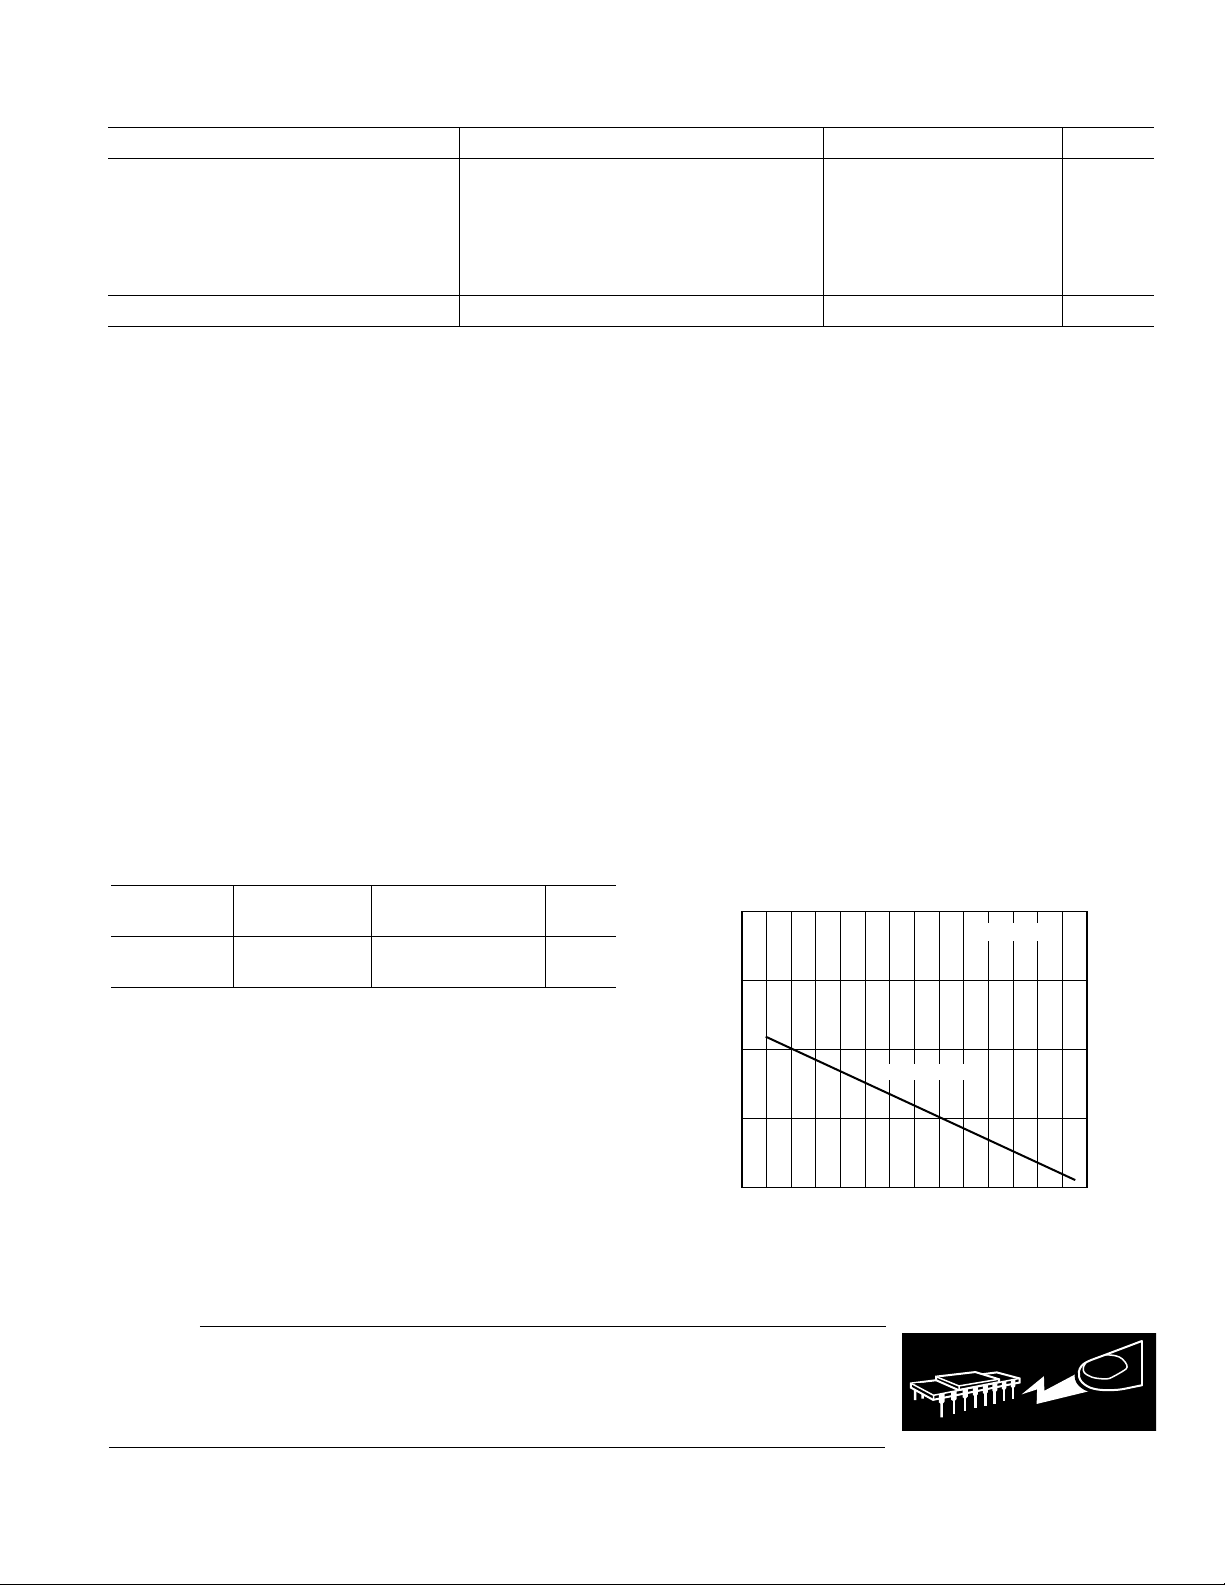
observe the maximum power derating curve in Figure 2.
It must also be noted that in (noninverting) gain configurations
(with low values of gain resistor), a high level of input overdrive
can result in a large input error current, which may then result
in a significant power dissipation in the input stage. This power
must be included when computing the junction temperature rise
due to total internal power.
2.5
2.0
1.5
16-LEAD SOIC
1.0
MAXIMUM POWER DISSIPATION – Watts
0.5
–50 90–40 –30 –20 0 10 20 30 40 50 60 70 80
–10
AMBIENT TEMPERATURE – C
TJ = 150C
Figure 2. Maximum Power Dissipation vs. Ambient
Temperature
CAUTION
ESD (electrostatic discharge) sensitive device. Electrostatic charges as high as 4000 V readily
accumulate on the human body and test equipment and can discharge without detection. Although
the AD8024 features proprietary ESD protection circuitry, permanent damage may occur on
devices subjected to high-energy electrostatic discharges. Therefore, proper ESD precautions are
recommended to avoid performance degradation or loss of functionality.
REV. B
–3–
AD8024
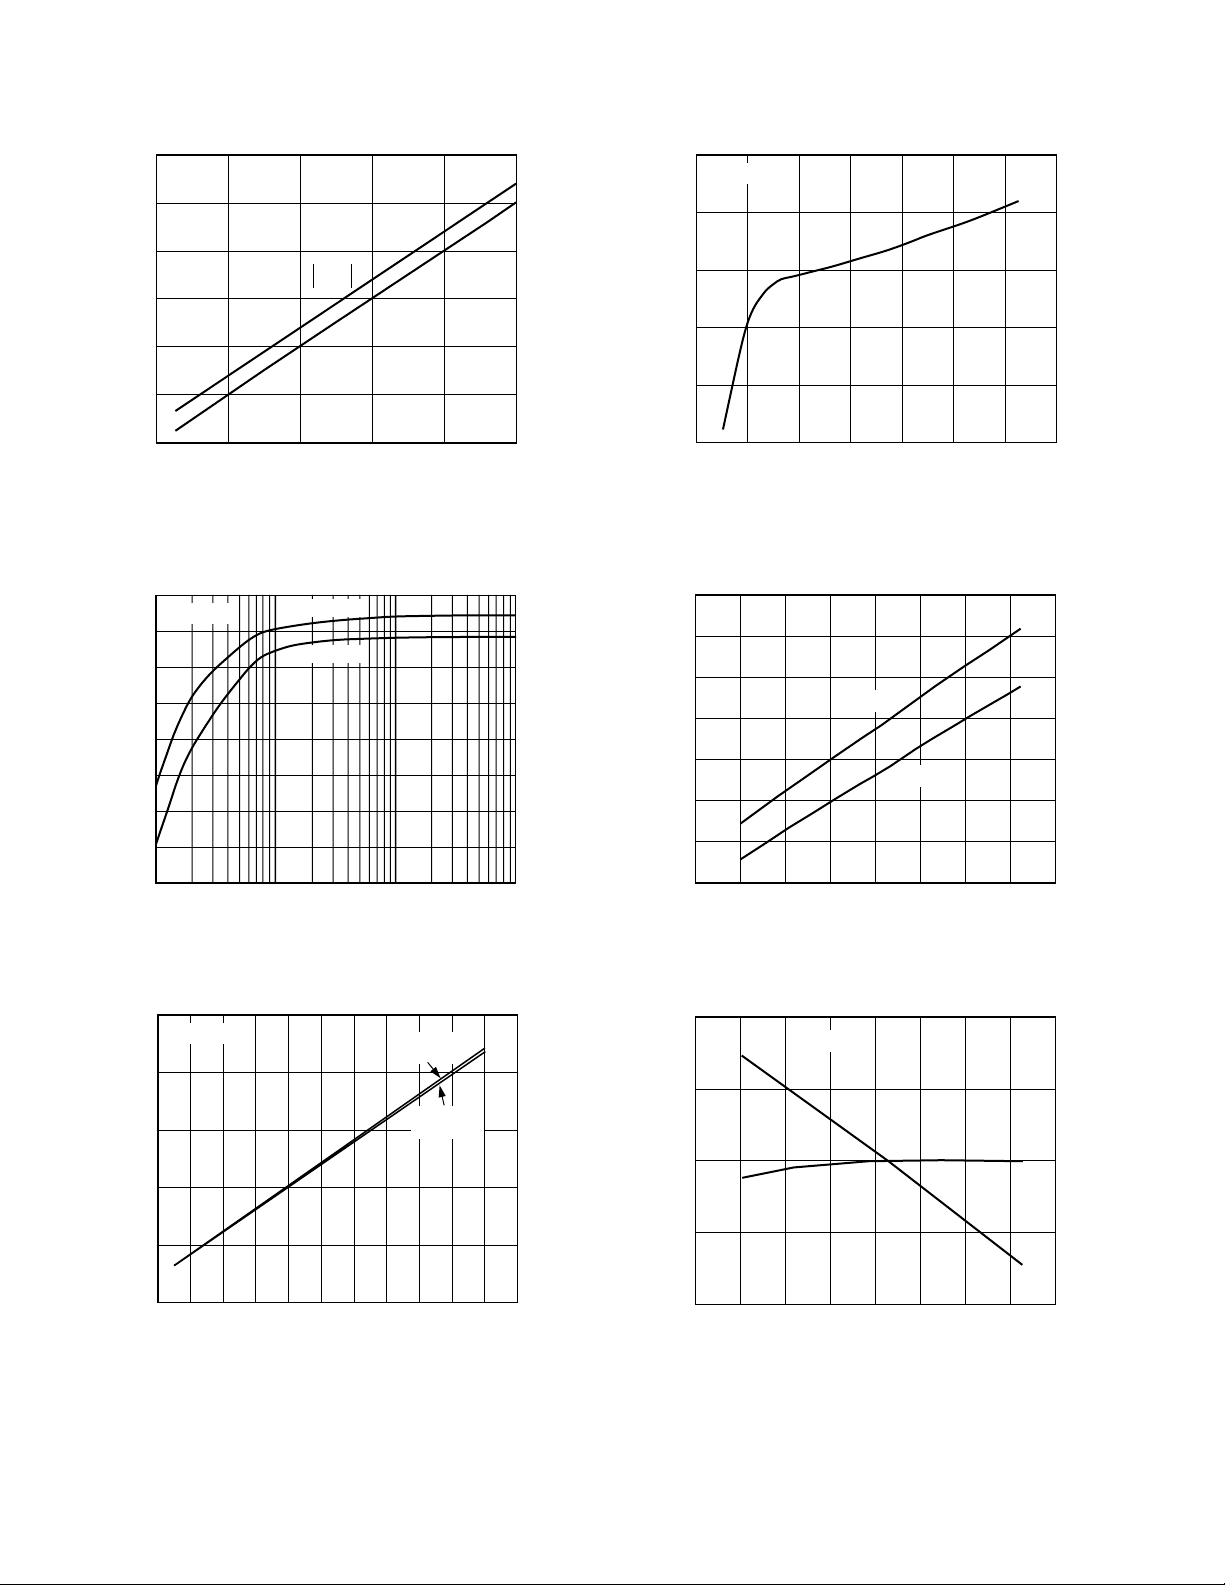
–Typical Performance Characteristics
12
= 25C
T
A
10
8
–V
CM
6
+V
4
COMMON-MODE VOLTAGE – Volts
2
0
2
4 6 8 10 12
SUPPLY VOLTAGE – Volts
CM
Figure 3. Input Common-Mode Voltage Range vs.
Supply Voltage
OUTPUT VOLTAGE SWING – V
7.0
6.5
6.0
5.5
5.0
4.5
4.0
3.5
VS = 7.5V
–SWING
+SWING
25
TA = 25C
20
15
10
5
TOTAL SUPPLY CURRENT – mA
0
2
4681012
SUPPLY VOLTAGE – Volts
140
Figure 6. Total Supply Current vs. Supply Voltage
24
22
20
VS = 12V
VS = 7.5V
TOTAL SUPPLY CURRENT – mA
18
16
14
12
3.0
10
100 1k 10k
LOAD RESISTANCE –
Figure 4. Output Voltage Swing vs. Load Resistance
25
20
15
10
5
OUTPUT VOLTAGE SWING – V p-p
0
2
TA = 25C
4681012
SUPPLY VOLTAGE – Volts
SWING
(NO LOAD)
SWING
= 150)
(R
L
1335 7911
Figure 5. Output Voltage Swing vs. Supply Voltage
10
–40
–20 0 20 40 60 100–60
TEMPERATURE – C
80
Figure 7. Total Supply Current vs. Temperature
3
VS = 7.5V
2
1
0
INPUT BIAS CURRENT – A
–1
–20 0 20 40 60 100–60 80
–40
–I
B
+I
B
TEMPERATURE – C
Figure 8. Input Bias Current vs. Temperature
–4–
REV. B
AD8024
FREQUENCY – MHz
90
1
COMMON-MODE REJECTION – dB
80
0
10 100
70
60
50
40
30
20
10
VS = 7.5V
VS = 12V
R
R
R
R
V
CM
2.5
VS = 7.5V
2.0
1.5
VS = 12V
1.0
INPUT OFFSET VOLTAGE – mV
0.5
–40
–20 0 20 40 60 100–60 80
TEMPERATURE – C
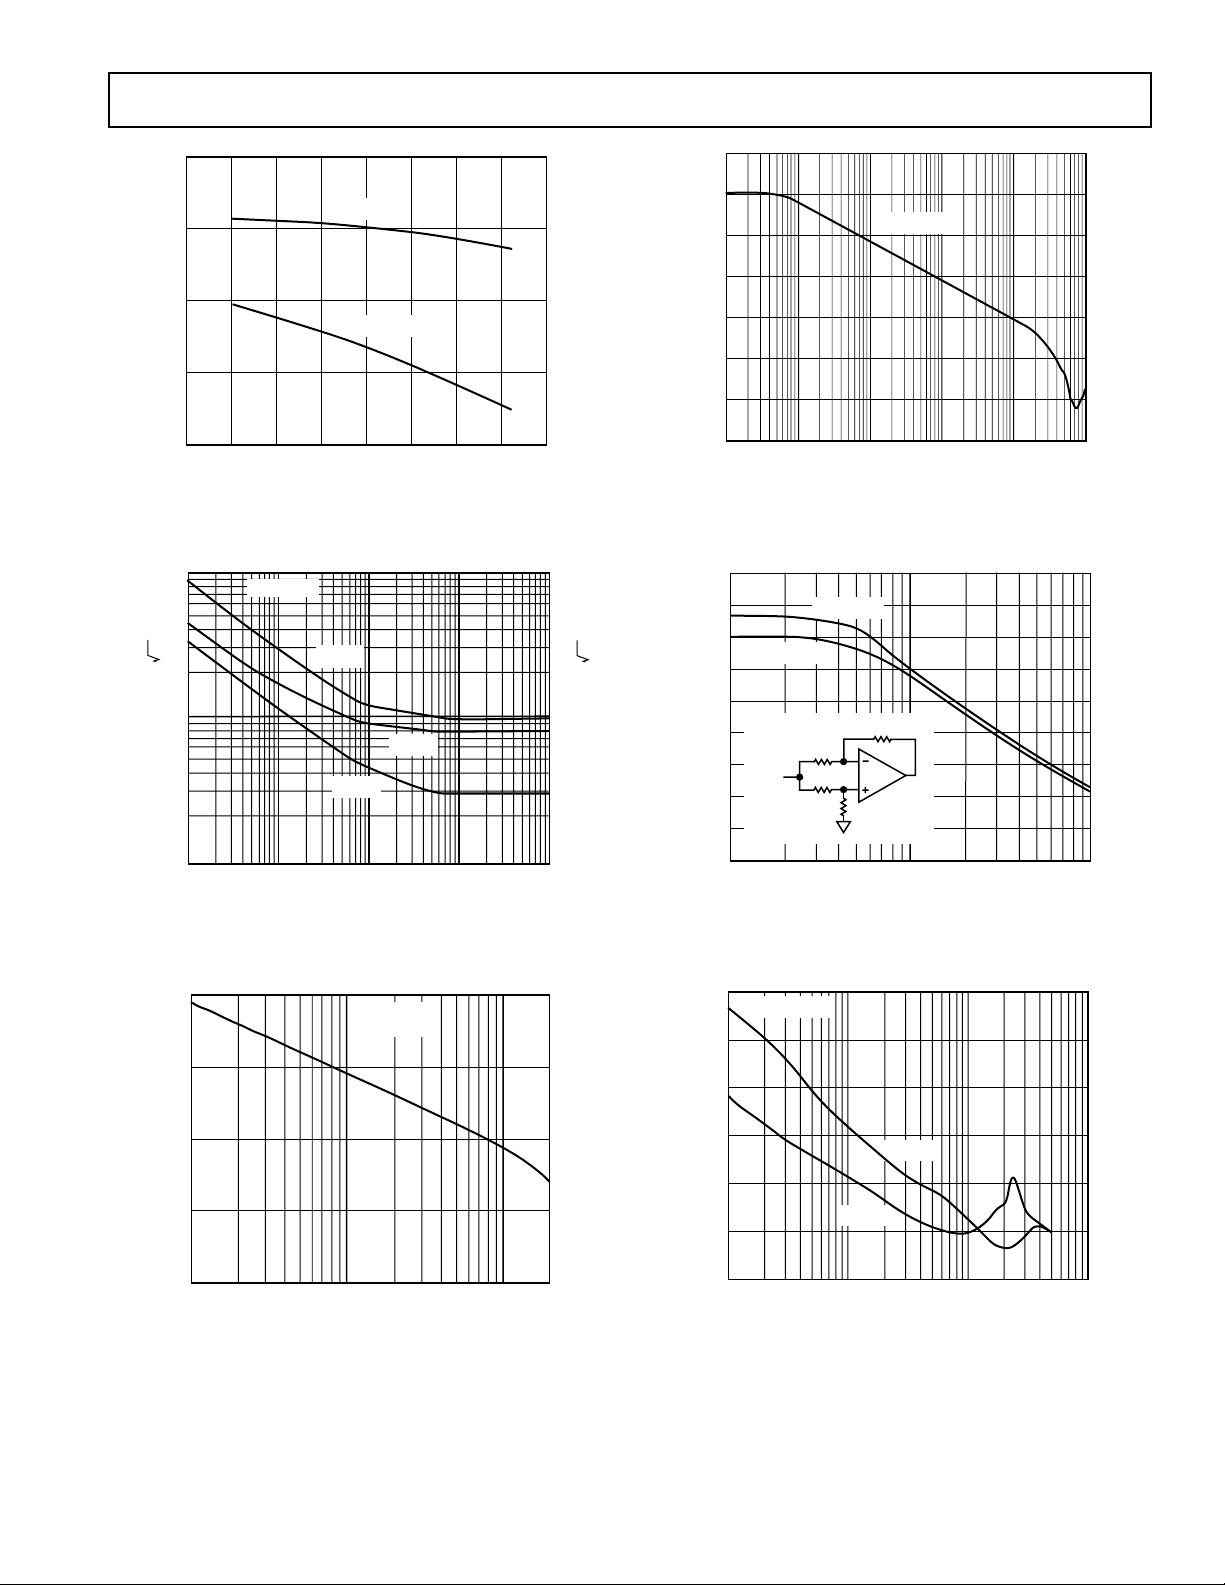
Figure 9. Input Offset Voltage vs. Temperature
100
10
VS = 7.5V
+I
NOISE
–I
NOISE
100
10
10M
1M
100k
10k
1k
100
TRANSIMPEDANCE –
10
1
0.01 0.1 1 10 100 1000
VS = 7.5V
FREQUENCY – MHz
Figure 12. Open-Loop Transimpedance vs. Frequency,
= 150
R
L
Ω
V
VOLTAGE NOISE – nV/ Hz
1
0.01
0.1 1 10 100
Figure 10. Input Current and Voltage Noise vs. Frequency
10000
1000
100
OUTPUT IMPEDANCE –
10
Figure 11. Output Impedance vs. Frequency, Disabled State
REV. B
0
1
NOISE
FREQUENCY – kHz
G = +1
= 7.5V
V
S
10 100 200
FREQUENCY – MHz
CURRENT NOISE – pA/ Hz
1
Figure 13. Common-Mode Rejection vs. Frequency
60
VS = 7.5V
50
40
POWER SUPPLY REJECTION – dB
30
20
10
0
1
+PSRR
–PSRR
10 100 1000
FREQUENCY – MHz
Figure 14. Power Supply Rejection vs. Frequency
–5–

AD8024
p
g
g
–30
G = 2
= 7.5V
V
S
HARMONIC DISTORTION – dBc
–40
–50
–60
–70
–80
–90
= 2V p-p
V
O
2ND
3RD
1 10 100
FREQUENCY – MHz
Figure 15. Harmonic Distortion vs. Frequency, RL = 150
0
10
20
30
40
50
CROSSTALK – dB
60
70
80
1
Figure 16. Crosstalk vs. Frequency, G = 2, RL = 150
VS = 2.5V
VS = 7.5V
10 100
FREQUENCY – MHz
Ω
3000
RL = 150
2500
2000
1500
1000
SLEW RATE – V/s
500
0
2
Ω
Figure 18. Maximum Slew Rate vs. Supply Voltage
3
2
1
0
–1
–2
–3
–4
–5
–6
–7
CLOSED-LOOP GAIN (NORMALIZED) – dB
–8
–9
1 10 100 1000
4681012
GAIN
PHASE
G = +1
SUPPLY VOLTAGE – V
FREQUENCY – MHz
G = +2
G = –1
VS = 12V
VS = 7.5V
G = +10
180
90
rees
0
–90
PHASE SHIFT – De
–180
–270
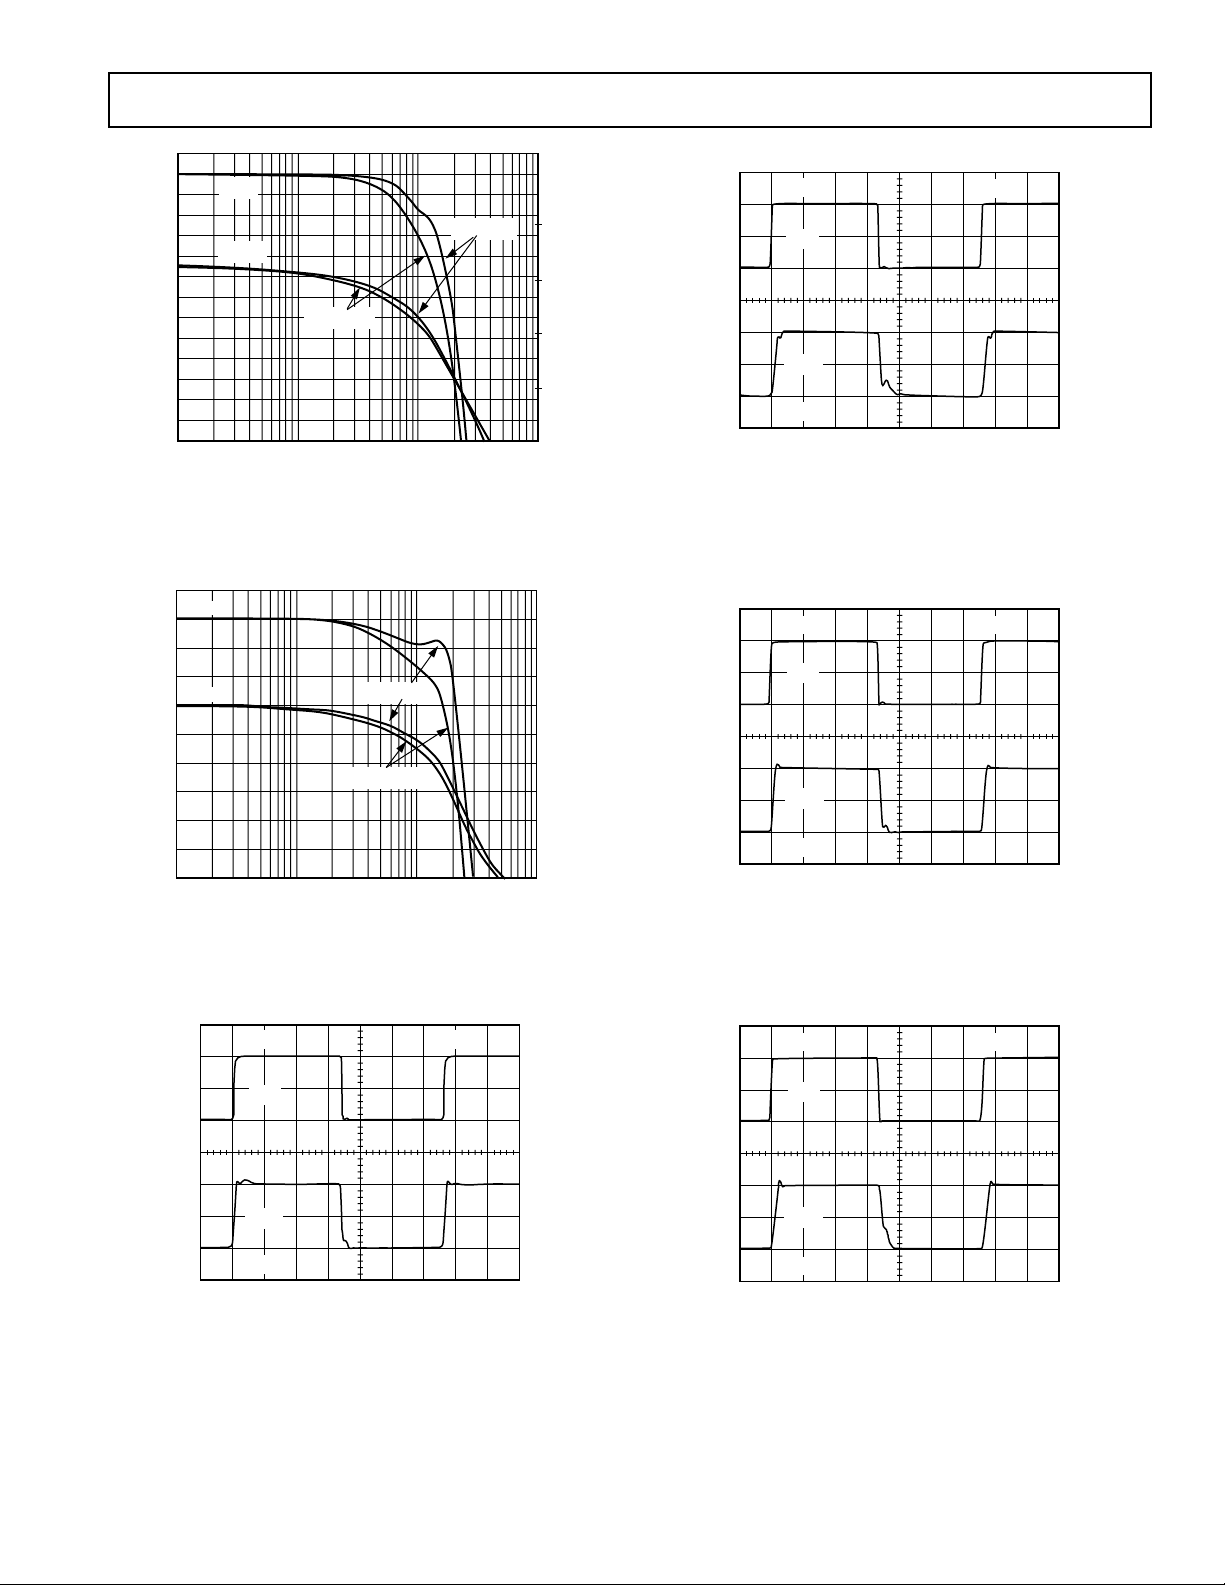
Figure 19. Closed-Loop Gain and Phase vs. Frequency,
G = 1, R
= 150
L
Ω
1200
VS = 7.5V
= 150
R
L
1000
800
600
400
SLEW RATE – V/s
200
0
1
G = +10
23 4 605
OUTPUT VOLTAGE STEP – V p-
G = –1
Figure 17. Slew Rate vs. Output Step Size
G = +1
G = +2
2
CLOSED-LOOP GAIN (NORMALIZED) – dB
1
0
–1
–2
–3
–4
–5
–6
–7
–8
–9
–10
–11
–12
GAIN
PHASE
1 10 100 1000
VS = 2.5V
VS = 7.5V
FREQUENCY – MHz
Figure 20. Closed-Loop Gain and Phase vs. Frequency,
G = 2, R
= 150
L
Ω
–6–
180
90
rees
0
–90
PHASE SHIFT – De
–180
–270
REV. B
AD8024
g
1
0
GAIN
VS = 12V
PHASE
VS = 7.5V
1 10 100 1000
FREQUENCY – MHz
CLOSED LOOP GAIN (NORMALIZED) – dB
–1
–2
–3
–4
–5
–6
–7
–8
–9
–10
–11
–12
–13
180
90
0
–90
–180
–270
Figure 21. Closed-Loop Gain and Phase vs. Frequency,
= 150
G = 10, R
L
1
GAIN
0
–1
–2
PHASE
–3
–4
–5
–6
–7
–8
CLOSED-LOOP GAIN (NORMALIZED) – dB
–9
1 10 100 1000
Ω
FREQUENCY – MHz
VS = 12V
VS = 7.5V
180
90
0
–90
–180
–270
Figure 22. Closed-Loop Gain and Phase vs. Frequency,
G = –1, R
= 150
L
Ω
PHASE SHIFT – Degrees
rees
PHASE SHIFT – De
2V
V
IN
V
OUT
2V
20ns
Figure 24. Large Signal Pulse Response, Gain = 1
= 5 kΩ, RL = 150 Ω, VS = ±7.5 V)
(R
FB
250mV 20ns
V
IN
V
OUT
500mV
Figure 25. Small Signal Pulse Response, Gain = 2
(R
= 750 Ω, RL = 150 Ω, VS = ±7.5 V)
FB
500mV 20ns
V
IN
V
OUT
500mV
Figure 23. Small Signal Pulse Response, Gain = 1
= 5 kΩ, RL = 150 Ω, VS = ±7.5 V)
(R
FB
REV. B
–7–
1V 20ns
V
IN
V
OUT
2V
Figure 26. Large Signal Pulse Response, Gain = 2
= 750 Ω, RL = 150 Ω, VS = ±7.5 V)
(R
FB

AD8024
50mV 20ns
V
IN
V
OUT
500mV
Figure 27. Small Signal Pulse Response, Gain = 10
= 400 Ω, RL = 150 Ω, VS = ±7.5 V)
(R
FB
200mV
V
IN
V
OUT
20ns
500mV 20ns
V
IN
V
OUT
500mV
Figure 29. Small Signal Pulse Response, Gain = –1
= 909 Ω, RL = 150 Ω, VS = ±7.5 V)
(R
FB
2V 20ns
V
IN
V
OUT
2V
Figure 28. Large Signal Pulse Response, Gain = 10
(R
= 400 Ω, RL = 150 Ω, VS = ±7.5 V)
FB
2V
Figure 30. Large Signal Pulse Response, Gain = –1
= 909 Ω, RL = 150 Ω, VS = ±7.5 V)
(R
FB
–8–
REV. B

AD8024
General
The AD8024 is a wide bandwidth, quad video amplifier. It offers a
high level of performance on 16 mA total quiescent supply current for closed-loop gains of ±1 or greater.
Bandwidth up to 380 MHz, low differential gain and phase errors,
and high output current make the AD8024 an efficient video
amplifier.
The AD8024’s wide phase margin and high output current make it
an excellent choice when driving any capacitive load.
Choice of Feedback Resistor
Because it is a current feedback amplifier, the closed-loop
bandwidth of the AD8024 may be customized with the feedback resistor.
A larger feedback resistor reduces peaking and increases the
phase margin at the expense of reduced bandwidth. A smaller
feedback resistor increases bandwidth at the expense of increased
peaking and reduced phase margin.
The closed-loop bandwidth is affected by attenuation due to the
finite output resistance. The open-loop output resistance of ≈6 Ω
reduces the bandwidth somewhat when driving load resistors less
than ≈150 Ω. The bandwidth will be ≈10% greater for load resis-
tance above a few hundred ohms.
The value of the feedback resistor is not critical unless maintaining
the widest or flattest frequency response is desired. Table I shows
the bandwidth at different supply voltages for some useful closedloop gains when driving a 150 Ω load. The recommended resistors
are for the widest bandwidth with less than 2 dB peaking.
Driving Capacitive Loads
When used in combination with the appropriate feedback resistor,
the AD8024 will drive any load capacitance without oscillation.
In accordance with the general rule for current feedback amplifiers, increased load capacitance requires the use of a higher
feedback resistor for stable operation.
Due to the high open-loop transresistance and low inverting
input current of the AD8024, large feedback resistors do not
create large closed-loop gain errors. In addition, the high output
current allows rapid voltage slewing on large load capacitors.
For wide bandwidth and clean pulse response, an additional
small series output resistor of about 10 Ω is recommended.
R
F
R
G
V
IN
–
AD8024
+
R
T
1.0F
+V
S
0.1F
R
1.0F
0.1F
–V
S
S
V
O
C
L
Figure 31. Circuit for Driving a Capacitive Load
1V 20nS
V
IN
Table I. –3 dB Bandwidth vs. Closed-Loop Gain Resistor,
= 150
R
L
VS – Volts Gain RF – BW – MHz
±7.5 +1 5000 350
+2 750 275
+10 400 105
–1 750 165
±12 +1 8000 380
+10 215 150
–1 750 95
±2.5 +2 1125 125
V
OUT
2V
Figure 32. Pulse Response Driving a Large Load
Capacitance, C
R
= 10.5 Ω, RL = 1 kΩ, VS = ±7.5 V
S
= 300 pF, G = 3, RFB = 2.32 kΩ,
L
REV. B
–9–

AD8024
Overload Recovery
The most important overload conditions are:
Input Common-Mode Voltage Overdrive
Output Voltage Overdrive
Input Current Overdrive.
When configured for a low closed-loop gain, the AD8024
recovers quickly from an input common-mode voltage overdrive; typically in <25 ns.
When configured for a higher gain and overloaded at the output,
recovery from an output voltage overdrive is also short; approximately 55 ns (see Figure 33). For higher overdrive, the response
is somewhat slower. For 100% overdrive, the recovery time is
substantially longer.
When configured for a high noninverting gain, a high input overdrive can result in a large current into the input stage. Although
this current is internally limited to approximately 30 mA, its
effect on the total power dissipation may be significant. See also
the warning under Maximum Power Dissipation.
1V
V
IN
50ns
Disable Mode Operation
When the Disable pin is tied to DGND, all amplifiers are operational, in the enabled state.
When the voltage on the Disable pin is raised to 1.6 V or more
above DGND, all amplifiers are in the disabled, powered-down
state. In this condition, the DISABLE pin sources approximately
0.1 µA, the total quiescent current is reduced to approximately
500 µA, all outputs are in a high impedance state, and there is a
high level of isolation from inputs to outputs.
The output impedance in the disabled mode is the equivalent of all
external resistors, seen from the output pin, in parallel with the
total disabled output impedance of the amplifier, typically 20 pF.
The input stages of the AD8024 include protection from large
differential input voltages that may be present in the disabled
mode. Internal clamps limit this voltage to 1.5 V. The high inputto-output isolation is maintained for voltages below this limit.
V
OUT
5V
Figure 33. 15% Overload Recovery, Gain = 10
(R
= 400 Ω, RL = 1 kΩ, VS = ±7.5 V)
FB
–10–
REV. B

0.1574 (4.00)
0.1497 (3.80)
OUTLINE DIMENSIONS
Dimensions shown in inches and (mm).
16-Lead Plastic SOIC
(R-16A)
0.3937 (10.00)
0.3859 (9.80)
16
1
9
0.2440 (6.20)
0.2284 (5.80)
8
AD8024
PIN 1
0.0098 (0.25)
0.0040 (0.10)
0.050 (1.27)
BSC
0.0192 (0.49)
0.0138 (0.35)
0.0688 (1.75)
0.0532 (1.35)
SEATING
PLANE
0.0099 (0.25)
0.0075 (0.19)
0.0196 (0.50)
0.0099 (0.25)
8
0
0.0500 (1.27)
0.0160 (0.41)
45
C01054–0–6/00 (rev. B)
REV. B
PRINTED IN U.S.A.
–11–
 Loading...