

Page 1
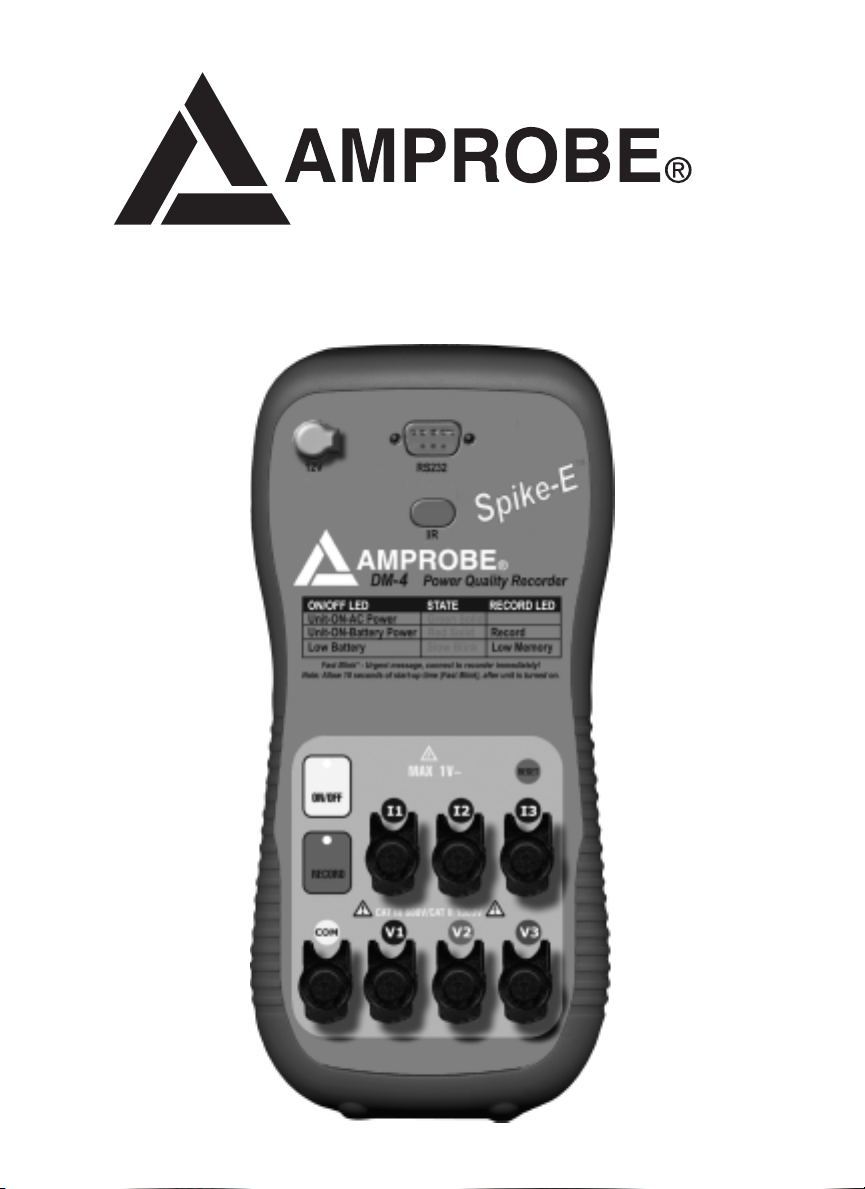
DM-4 Power Quality Recorder
Page 2

DM-4 Power Quality Recorder
TABLE OF CONTENTS
1. PRECAUTIONS AND SAFETY MEASURES.............................................................................. 3
1.1 GENERAL................................................................................................................... 3
1.2 PRELIMINARY INSTRUCTIONS ............................................................................... 3
1.3 DURING USE.............................................................................................................. 4
1.4 AFTER USE................................................................................................................ 4
2.GENERAL DESCRIPTION ........................................................................................................... 5
2.1 INTRODUCTION ........................................................................................................ 5
2.2 FUNCTIONS............................................................................................................... 5
3. PREPARING THE INSTRUMENT................................................................................................ 6
3.1 INITIAL CHECK.......................................................................................................... 6
3.2 INSTRUMENT POWER SUPPLY............................................................................... 6
3.3 CALIBRATION............................................................................................................ 6
3.4 STORAGE.................................................................................................................. 7
4. HOW TO OPERATE..................................................................................................................... 7
4.1 INSTRUMENT: DESCRIPTION................................................................................. 7
4.2 KEYBOARD: DESCRIPTION.................................................................................... 7
4.3 USING THE DM-4 WITH THE REMOTE USER INTERFACE (PDA)........................ 8
4.4 DISPLAY DESCRIPTION OF THE REMOTE USER INTERFACE (PDA................... 9
4.4.1 VIEW REAL TIME DATA........................................................................................ 9
4.4.2 SETUP ANEW RECORDING SESSION................................................................13
5. MAIN MENU................................................................................................................................15
6. RECORDING CONFIGURATION.............................................................................................
7. STARTING A RECORDING
4.4.3 SET DATE AND TIME FOR AUTOMATIC RECORDING SESSION.....................14
5.1 INITIAL SETTINGS....................................................................................................15
5.1.1 HOW TO SET THE DATE AND TIME?...................................................................16
5.2 DEFAULT SETTINGS: ANALYZER CONFIG.............................................................16
5.2.1 HOW TO SET THE TYPE OF ELECTRICAL SYSTEM UNDER TEST.................17
5.3 BASIC SETTING: RECORDER CONFIG..................................................................18
5.3.1 MDL PARAMETER SETUP.....................................................................................18
5.3.2 MDL VOLTAGE ANOMALIES.................................................................................18
5.4 ADVANCED SETTING: RECORDER CONFIGURATION..........................................19
5.4.1 SETTING THE PARAMETERS INDIVIDUALLY......................................................20
5.4.2 ADVANCED MDL PARAMETER SETUP.................................................................20
5.4.3 SET UP THE PARAMETERS FOR VOLTAGE........................................................20
5.4.4 SETUP THE PARAMETERS FOR CURRENT........................................................21
5.4.5 SETUP THE PARAMETERS FOR POWER............................................................21
5.4.6 SETUP THE PARAMETERS FOR VOLTAGE HARMONICS..................................22
5.4.7 SETUP THE PARAMETERS FOR CURRENT HARMONICS.................................23
5.5 DOWNLOAD DATA....................................................................................................24
5.5.1 DOWNLOAD DATA WITH THE REMOTE USER INTERFACE (PDA)...................24
5.5.2 VIEW DOWNLOADED DATA..................................................................................25
5.5.3 RECORDING INFORMATION................................................................................25
5.5.4 DELETE SESSION.................................................................................................26
5.5.5 RESET....................................................................................................................29
........................................................................................................30
.
.
30
Page 3

DM-4 Power Quality Recorder
8. RECORDING IN PROCESS........................................................................................................32
9. STOPPING A RECORDING........................................................................................................33
10. CONNECTING THE INSTRUMENT TO A PC...........................................................................34
11. MEASURING PROCEDURES..................................................................................................35
12. MAINTENANCE........................................................................................................................40
13. TECHNICAL SPECIFICATIONS..............................................................................................41
14. APPENDIX 1 – RECORDABLE PARAMETERS: SYMBOLS.................................................46
15. APPENDIX 2 – THEORETICAL OUTLINES............................................................................47
16. AFTER-SALE SERVICE..........................................................................................................56
9.1 STOP A RECORDING WITH THE REMOTE USER INTERFACE (PDA).................33
9.2 STOPA RECORDING WITH THE DOWNLOAD SUITE............................................33
11.1 USING THE INSTRUMENT IN A SINGLE PHASE SYSTEM..................................35
11.2 USING THE INSTRUMENT IN A THREE PHASE
4- WIRE SYSTEM (WYE)........................................................................................36
11.3 USING THE INSTRUMENT IN A THREE PHASE 3- WIRE
SYSTEM (DELTA).......................................................................................................38
12.1 GENERAL................................................................................................................40
12.2 BATTERY REPLACEMENT.....................................................................................40
13.1 FEATURES............................................................................................................. 41
13.1.1 VOLTAGE MEASUREMENT................................................................................41
13.1.2 VOLTAGE ANOMALIES DETECTION (MANUAL SELECTION OF
RANGE) VOLTAGE.................................................................................................41
13.1.3 CURRENT MEASUREMENT (USING EXTERNALTRANSDUCER)................. ..41
13.1.4 POWER MEASUREMENT (COS
13.1.5 COSΘ MEASUREMENT.....................................................................................42
13.1.6 MEASUREMENT OF HARMONICS....................................................................43
13.1.7 TEMPERATURE DRIFT....................................................................................... 43
13.1.8 SAFETY............................................................................................................... 43
13.1.9 GENERAL CHARACTERISTICS......................................................................... 44
13.2 ENVIRONMENT...................................................................................................... 44
13.2.1 OPERATING CONDITIONS................................................................................ 44
13.3 ACCESSORIES...................................................................................................... 45
13.3.1 STANDARD ACCESSORIES...............................................................................45
15.1 VOLTAGE ANOMALIES (VOLTAGE SAG AND SURGE; SPIKE).......................... .47
15.2 VOLTAGE AND CURRENT HARMONICS..............................................................48
15.2.1 THEORY............................................................................................................. . 48
15.2.2 LIMIT VALUES FOR HARMONICS.....................................................................49
15.2.3 PRESENCE OF HARMONICS: CAUSES........................................................... 50
15.2.4 PRESENCE OF HARMONICS: CONSEQUENCES............................................50
15.3 POWER AND POWER FACTOR: DEFINITIONS...................................................51
15.3.1 CONVENTIONS ON POWERS AND POWER FACTORS..................................53
15.3.2 3 PHASE 3 WIRE SYSTEM..............................................................................54
15.4 MEASURING METHOD: OUTLINES......................................................................55
15.4.1 INTEGRATION PERIODS................................................................................... .55
15.4.2 POWER FACTOR CALCULATIONS.................................................................. ..55
ARRANTY............................................................................................................56
16.1 W
16.2 SERVICE................................................................................................................56
Θ: 0.5C – 0.5I).................................................42
Page 4

DM-4 Power Quality Recorder
1. PRECAUTIONS AND SAFETY MEASURES
1.1 GENERAL
For your own safety and to avoid damaging the instrument we suggest you follow
the procedures hereby prescribed and to carefully read all the notes preceded by
the symbol m.
Before and during measurements please be very diligent in following instructions below:
• Do not measure voltage or current in wet or dusty places
• Do not measure in presence of gas, explosive materials or combustibles
• Do not touch the circuit under test if no measurement is being taken
• Do not touch exposed metal parts, unused terminals, circuits and so on
• Do not use the instrument if it seems to be malfunctioning
• Use only cables and accessories approved by Amprobe
The following symbols are used in this manual:
m Caution: keep to what is prescribed by the manual. An incorrect use could
damage the instrument or its components
c High voltage: risk of electric shock
1.2 PRELIMINARY INSTRUCTIONS
• This instrument has been designed for use in places with pollution class 2.
• It can be used for
voltage category III 600 V~ phase to phase / 346 V~ phase to earth and of excess
voltage category II 1000 V~ phase to phase / 577 V~ phase to earth.
voltage and current measurements in installations of excess
3
Page 5

DM-4 Power Quality Recorder
• Please keep to the usual safety standards aimed at:
Protecting against dangerous currents;
Protecting the instrument against incorrect operations.
• Only the accessories supplied with the instrument guarantee compliance with the
safety standards. Accordingly, they must be in good condition and, if necessary,
they must be replaced with identical models.
• Do not take measurements on circuits exceeding the specified current and
voltage limits.
• Before connecting voltage leads and clamps to the circuit under test, make sure
that the circuit configuration has been selected.
1.3 DURING USE
Please read carefully:
CAUTION
Should you fail to keep to the prescribed instructions you could damage
m
the instrument and/or its components or endanger your safety.
• When the instrument is connected to the circuit under test, do not touch any
unused terminal.
• When measuring current, other currents located near the leads may affect the
measuring accuracy.
• When measuring current, always position the wire in the very middle of the jaws
in order to obtain the highest accuracy.
1.4 AFTER USE
• After use, turn off the instrument by pressing the ON/OFF push button.
• If you won’t be using the instrument for long periods of time, use the storage
instructions described in paragraph 3.4.
4
Page 6

DM-4 Power Quality Recorder
2.GENERAL DESCRIPTION
2.1 INTRODUCTION
The DM-4 also referred to as the Modular Data Logger (MDL), addresses the needs
of the most demanding Power Quality professionals. The device incorporates full set
of measuring features crucial for complete Power Quality analysis. An innovative
Remote User Interface (PDA) allows safe, easy and convenient operation of the
device remotely. Remote User Interface (PDA) is also used for data viewing, analysis and transfer. Independently, the DM-4 can be used directly with a PC using
Download Suite software. Since the DM-4 does not have any control buttons on its
enclosure, it is protected against setup changes by unauthorized persons while the
device is recording, eliminating the need for password protection.
2.2 FUNCTIONS
The DM-4 is able to:
• Display in real time the electrical parameters of a single phase, two phase or
three-phase system (wye or delta) and the harmonic analysis of voltages and currents.
• Conduct a direct Energy measurement.
• Record simultaneously (pressing the RECORD key after a proper connection &
device configuration): RMS values of voltages, currents, corresponding harmonics;
active, reactive and apparent powers, power factor and cos
Θ; active, reactive and
apparent energies; voltage sag and surge with 14ms resolution; and voltage spike
with 100ns resolution.
It will be possible to analyze the recorded data by down-
loading the file using the Remote User Interface (PDA) or Download Suite.
• Record Data (pressing RECORD key) the sampled values of the Parameters
present at the instrument’s input.
It will be possible to analyze the recorded
data by downloading the file with the Remote User Interface (PDA) device
or a PC using the Download Suite.
5
Page 7

DM-4 Power Quality Recorder
3. PREPARING THE INSTRUMENT
3.1 INITIAL CHECK
This instrument has been checked before shipment from an electrical and mechanical point of view. All possible precautions have been taken in order to deliver it in
perfect condition. Notwithstanding, on receipt of the instrument we suggest that
you check it summarily to make sure that no damage has occurred in transit.
Should you find irregularities, please contact the carrier immediately. Furthermore,
make sure that the parcel contains all the accessories and parts listed on Table
13.3.1. In case of discrepancies, please contact your dealer. Should it be necessary to return the instrument to the supplier, please keep to the instructions given
at paragraph 16.1.
3.2 INSTRUMENT POWER SUPPLY
The instrument can be powered by:
• 8 batteries 1.5V AA located in the compartment on the back of the instrument
• An external power supply code DM-4EXTPS supplied with the instrument
(standard accessory).
CAUTION
m
3.3 CALIBRATION
The instrument complies with the standards mentioned in this manual. Its performance is guaranteed for one year from the purchase date.
For recordings ALWAYS use the external power supply (even though the
instrument allows the operator to perform a recording using internal batteries).
6
Page 8
DM-4 Power Quality Recorder
3.4 STORAGE
For long time storage, please remove batteries to prevent leakage into the unit. Store
unit in a safe location with room temperature conditions. To guarantee accurate
measurements after a long storage period in severe environmental conditions, wait
until the instrument resumes its normal conditions (see environmental conditions
listed in paragraph 13.2).
4. HOW TO OPERATE
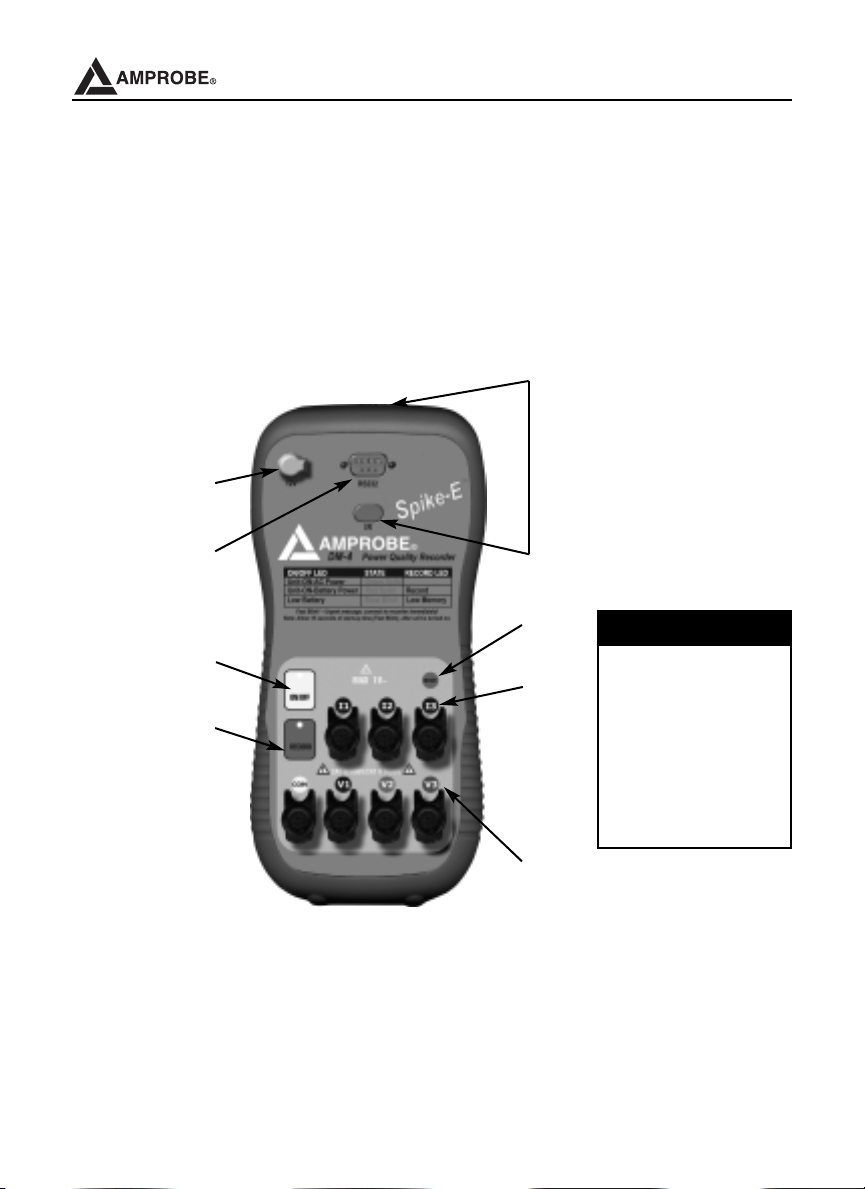
4.1 INSTRUMENT: DESCRIPTION
4
5
6
7
3
8
2
LEGEND
1. Voltage Inputs
2. Current Inputs
3. Infrared Ports
4. External Power
Supply Plug
5. RS232 Serial Connector
6. ON/OFF Push Button
7. Record Push Button
8. Reset Push Button
1
4.2 KEYBOARD: DESCRIPTION
The following keys are available:
ON/OFF: turning on – turning off / (Green LED for AC and Red LED for Battery)
RECORD: to start/stop manually a recording
RESET: to reset the unit
7
Page 9
DM-4 Power Quality Recorder
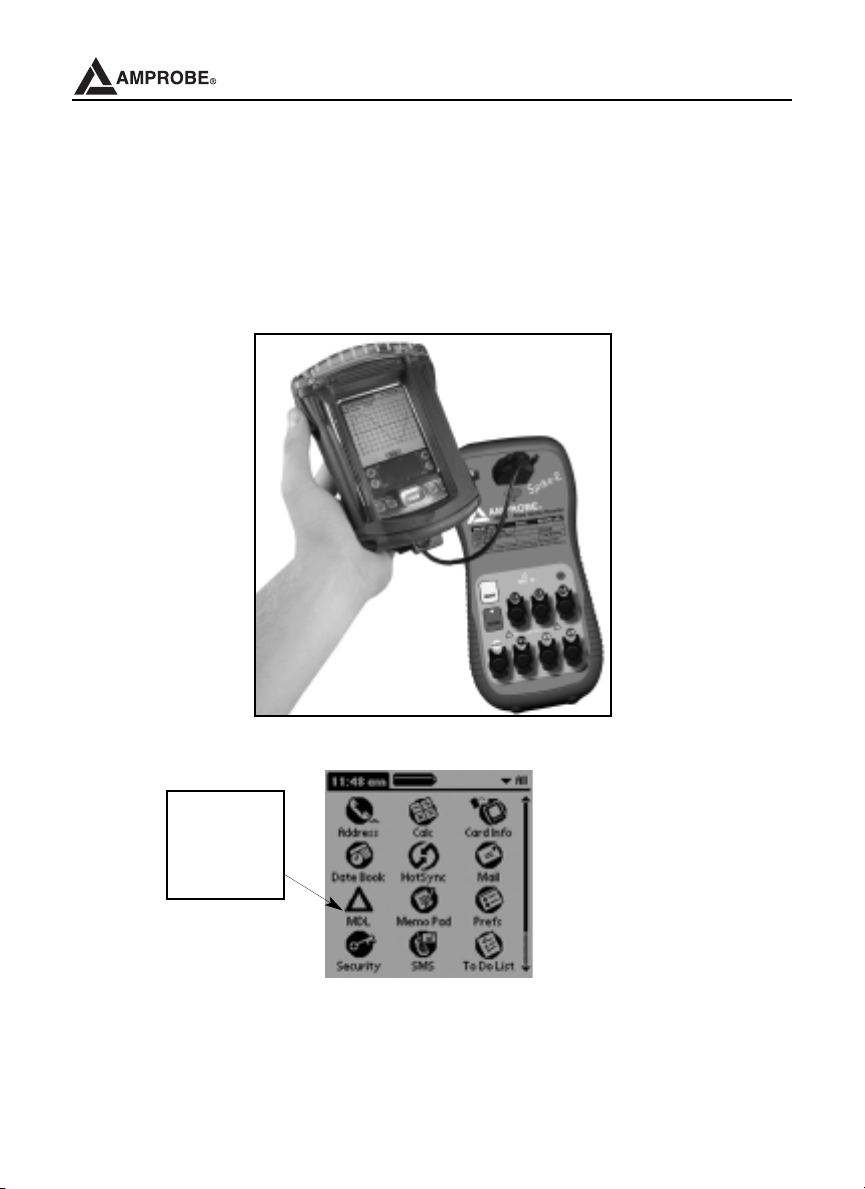
4.3 USING THE DM-4 WITH THE REMOTE USER INTERFACE (PDA)
• Connect the Remote User Interface (PDA) to the DM-4 using the provided cable
• Turn ON the DM-4 by pressing on the ON/OFF push button
• Turn ON the Remote User Interface (PDA) by pressing the power button
• Click on the MDL (Modular Data Logger) icon
Click MDL
icon to
enter the
program.
8
Page 10
DM-4 Power Quality Recorder
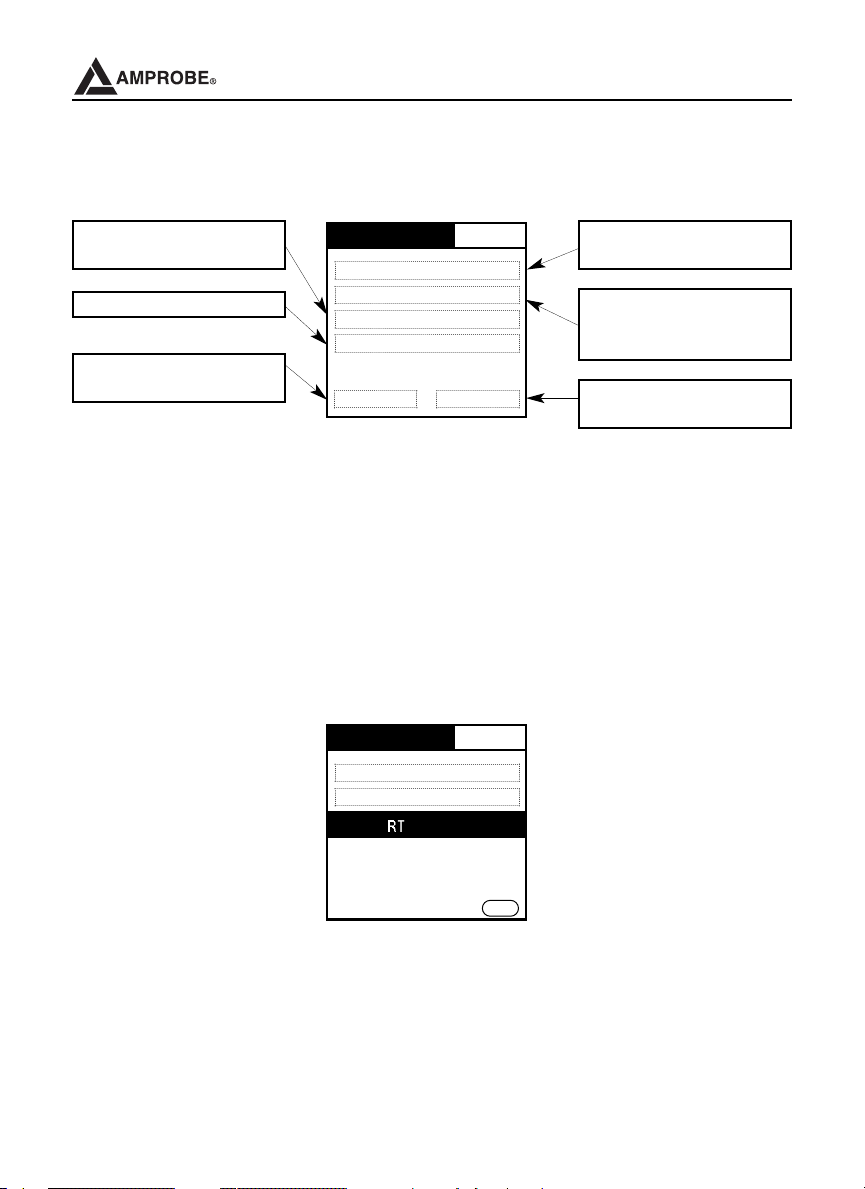
4.4 DISPLAY DESCRIPTION OF THE REMOTE USER INTERFACE (PDA)
Download the
recorded files.
View the downloaded files.
MDL-Main Menu
View Real Time Data
Setup a New Recording Session
Download Data
View Downloaded Data
Display real time information
of the monitored system.
Allow the user to setup
recording sessions with the
desired configuration.
Delete recording or
downloaded files.
Delete Session Device Status
Display the status of the
device.
4.4.1 View Real Time Data
When monitoring an electrical system in real time, the user needs to know the
type of system configuration the device is hooked up to in order to have the
correct readings. Refer to section 11 for more information on the different types of
electrical system configurations.
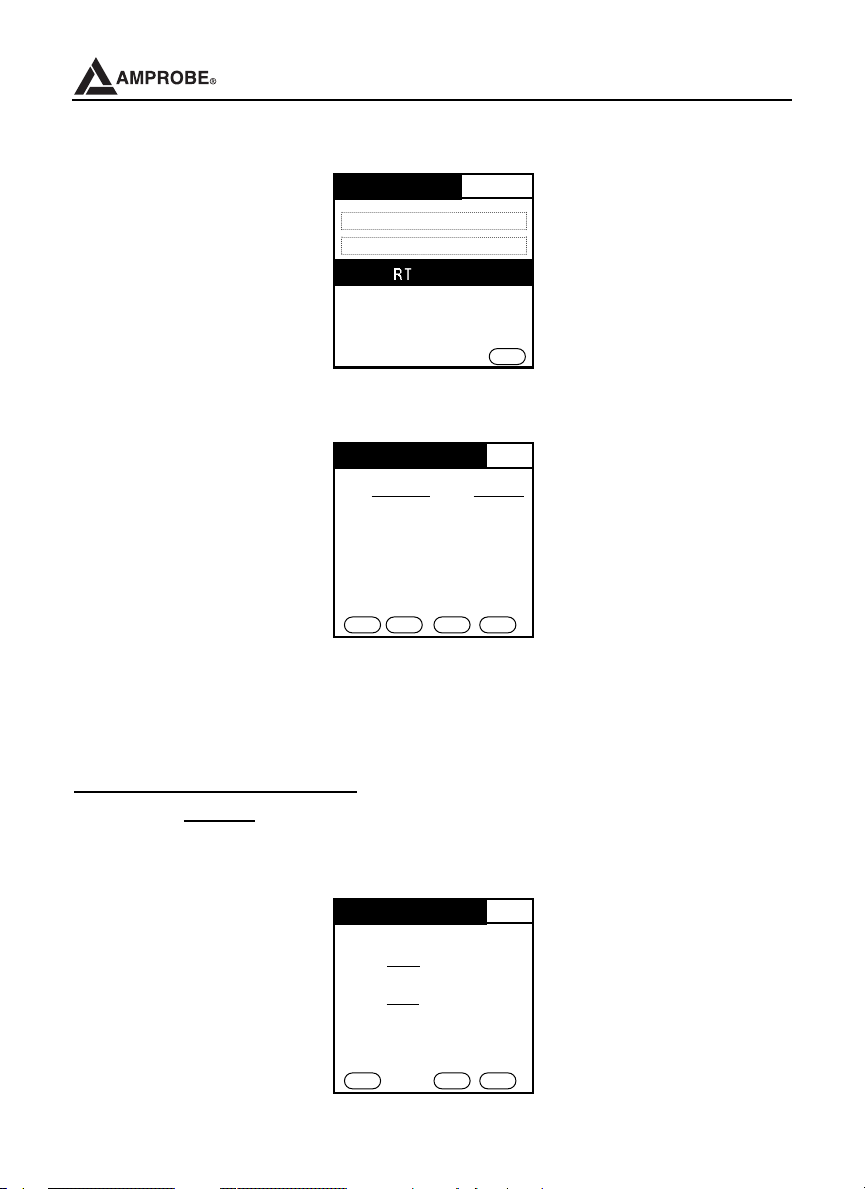
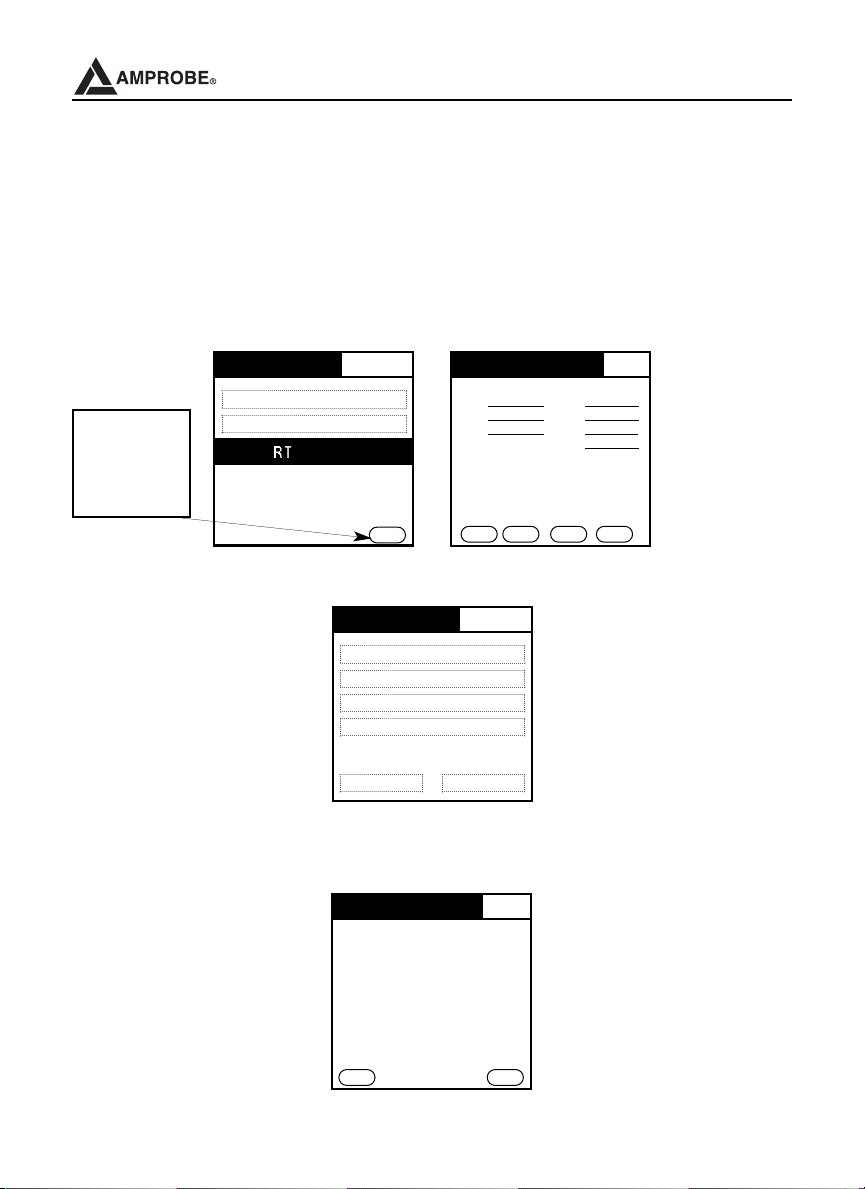
• From the MDL Main Menu screen, click on View Real Time Data. The following
screen will appear.
MDL-Main Menu
View Real Time Data
Setup a New Recording Session
R
TM Setup
Phase Selection: P 3 Ø 4 W (Y)
Fund. Frequency:
Clamp Type:
P 60 Hz
P 1000 Amps
OK
• Select the desired electrical system configuration you want to monitor.
• Select the fundamental frequency of the system
• Select the type of clamp you are using with the DM-4 to monitor the
electrical system.
• Click OK to accept the system setup.
9
Page 11
DM-4 Power Quality Recorder
• 1-Phase 2-wire, 60Hz System using 1000A clamp
MDL-Main Menu
View Real Time Data
Setup a New Recording Session
R
TM Setup
Phase Selection: P 1 Ø 2 W (Y)
Fund. Frequency:
Clamp Type:
P 60 Hz
P 1000 Amps
OK
• Select 1Ø2W, 60Hz, 1000A and then click OK. The following screen will appear:
Voltage & Current
V1: 116.13V __ l1: 3.96A
Back Voltage Current Power
• Once you get into this screen, you can get real time readings for voltage and
current and their associated waveforms and harmonics. You can also get
readings for power.
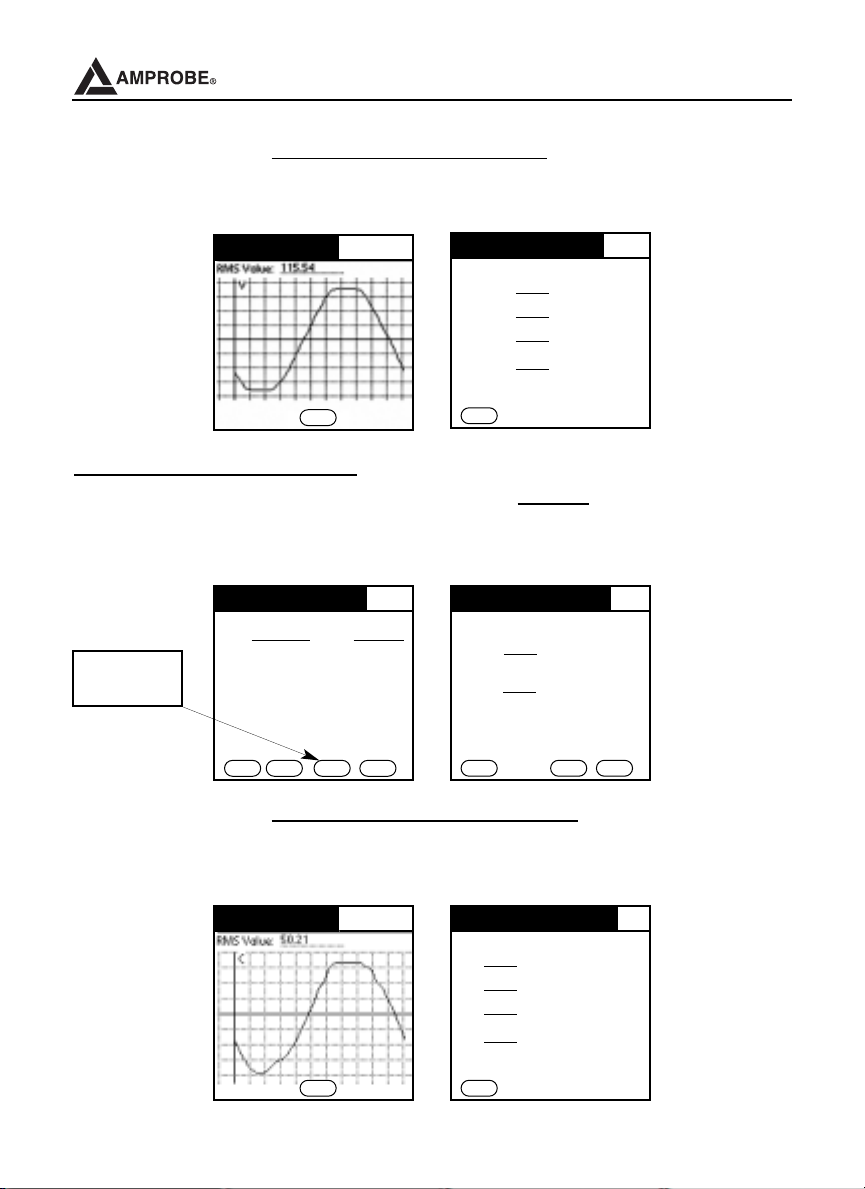
How to Monitor Voltage Only?
Click on the Voltage button located at the bottom of the screen. The voltage
reading for the monitoring phase will be displayed with its respective frequency.
Real Time Voltage
V1
Volt
(V) 0.00
Freq
(Hz) 0.00
Back Harm Scope
10
Page 12
DM-4 Power Quality Recorder
In order to display the voltage waveform or harmonics for the monitored phase,
click on Scope or Harm buttons. The waveform or the harmonics table for the
monitored voltage phase will be displayed.
oltage 1
Real Time Mode
P V
Real Time Voltage
V1
Harm 1 0.00
Harm 3 0.00
Harm 5 0.00
Harm 7 0.00
Close
Back
How to Monitor Current Only?
From the Voltage and Current screen, click on the Current button. You will be
prompted to the current only real time display. The RMS value for the monitored
phase will be reported with its respective frequency.
Voltage & Current
V1: 116.13V __ l1: 3.96A
Click
Current
Back Voltage Current Power
In order to display the current waveform or the harmonics
Real Time (Current)
Ø1
Cur
(A) 0.00
Freq
(Hz) 0.00
Back Harm Scope
for the monitored
phase, click on Scope or Harm buttons. The waveform graph or the harmonics
table for the monitored Current phase will be displayed.
Real Time Mode
P Current 1
Real Time Harmonics
Ø1
1 0.00
3 0.00
0.00
5
7 0.00
Close
Back
11
Page 13

DM-4 Power Quality Recorder
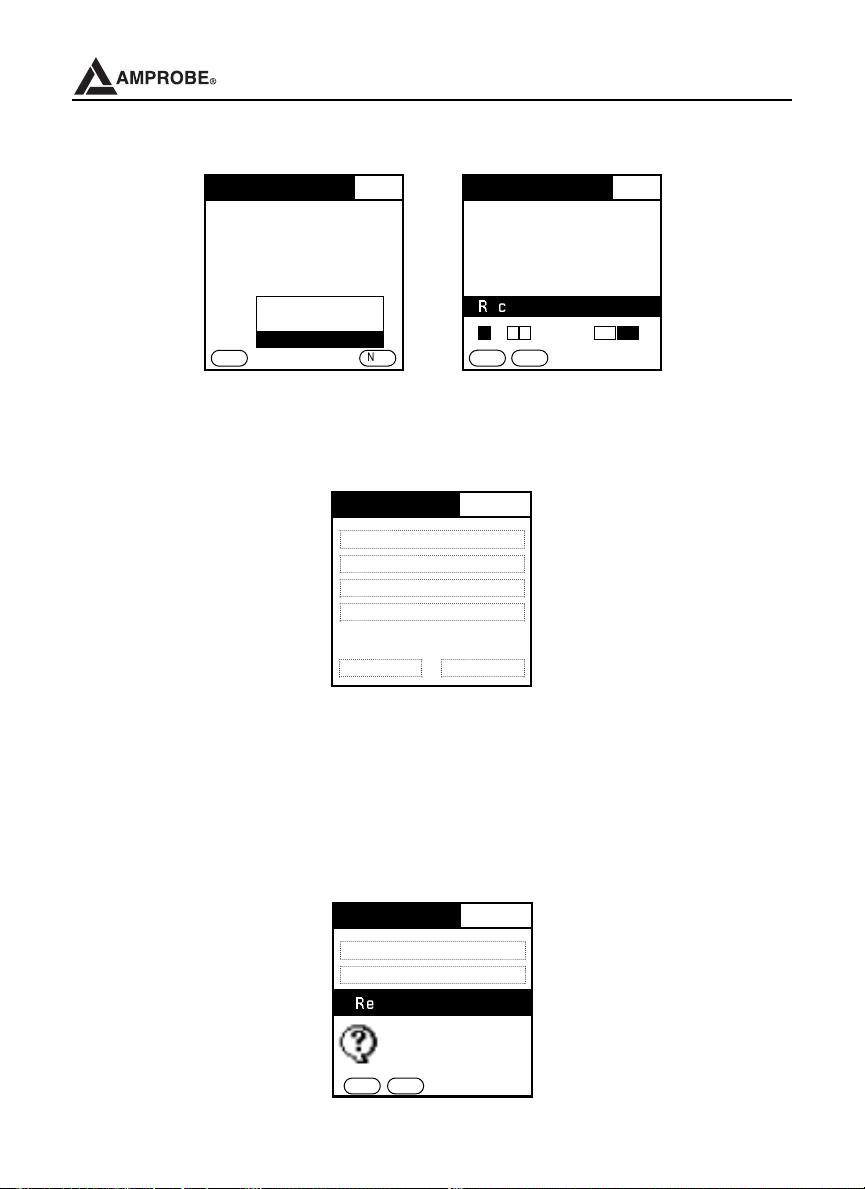
How to Monitor Power Only?
From the Voltage and Current screen menu, click on the Power button located at
the bottom of the screen.The Real Time Power screen will appear as shown
below with the following information: Real Power: P (kW); Reactive Power: Q
(kVAR); Apparent Power: S (kVA); True Power Factor: pF; and the displacement
power factor: dPf. To return to the previous screen, click on the Back button.
Real Time (Power)
Ø1 Ø2 Ø3 Total
P(kW) 0.00 0.00 0.00 0.00
Q(kVAR) 0.00 0.00 0.00 0.00
Click
Back
S(kVA) 0.00 0.00 0.00 0.00
PF 0.00 0.00 0.00 0.00
dPF 0.00 0.00 0.00 0.00
Back
3- Phase 4-wire, 60Hz System Using 1000A Clamp
• Once you have the DM-4 connected with your electrical system, you can follow
the same steps from paragraph 4.3 to paragraph 4.4.1.
• Select 3Ø4W, 60Hz, 1000A and then click OK.
Voltage & Current
V1: 0.000V _ _ l1: 0.00A
V2: 0.000V _ _ l2: 0.00A
V3: 0.000V __
Back Voltage Current Power
l3: 0.00A
ln: 0.00A
_
Click OK
to accept
the System
Setup
MDL-Main Menu
View Real Time Data
Setup a New Recording Session
R
TM Setup
Phase Selection: P 3 Ø 4 W (Y)
Fund. Frequency:
Clamp Type:
P 60 Hz
P 1000 Amps
OK
• The Voltage and Current screen should display the readings for all three phases
as shown above.
• You can access the readings for voltage, current and power with their respective
waveforms and harmonics tables as described on “How to monitor voltage only?”,
“How to monitor current only?”, and “How to monitor power only?” in paragraph
4.4.1 for the 1Ø2W system.
12
Page 14
DM-4 Power Quality Recorder
3-Phase 3-wire, 60HZ system with 1000A Clamp
Because the 3Ø3W system doesn’t have a neutral wire, you need to follow the
proper direction given in this manual to connect the DM-4 with the 3Ø3W
electrical system you want to monitor. Refer to paragraph 11.3
• Follow the same procedures as for 1Ø2W and 3Ø4W systems. The following
screen should appear when accepting the system configuration setup for 3Ø3W.
Voltage & Current
V1: 0.000V _ _ l1: 0.00A
V2: 0.000V _ _ l2: 0.00A
V3: 0.000V __ l3: 0.00A _
Back Voltage Current Power
ln: 0.00A
Click OK
to accept
the System
Setup
MDL-Main Menu
View Real Time Data
Setup a New Recording Session
R
TM Setup
Phase Selection: P 3 Ø 4 W (Y)
Fund. Frequency:
Clamp Type:
P 60 Hz
P 1000 Amps
OK
4.4.2 Setup A New Recording Session
MDL-Main Menu
View Real Time Data
Setup a New Recording Session
Download Data
View Downloaded Data
Delete Session Device Status
From the main menu, click on “Setup A New Recording Session”. The MDL
system Setup menu will be displayed.
MDL System Setup
Phase Selection: P 3 Ø 4 W (Y)
Fund. Frequency:
Clamp Type:
START:
P 60 Hz
P 1000 Amps
P Manual
ST
Back
OP:
P Manual
Next
13
Page 15

DM-4 Power Quality Recorder
The MDL System setup allows you to configure the data logger device for the type
of power system you want to perform the recording.
• Phase Selection: 1Ø2W; 1Ø3W; 3Ø3W (Delta configuration); 3Ø4W (Wye configuration).
• Fund. Frequency: 50-Hz; 60-Hz
• Clamp Type: 100 Amps; 1000 Amps; 3000 Amps
• Integration Period: 5s, 15s, 30s, 1min, 5min, 15min, 30min, 1 hr
• Start: Manual or Automatic
- Manual: Recording session starts when you click on the “Record Now”
button in later screen
- Automatic: Recording session will start at the preset time.
• Stop: Manual or Automatic
- Manual: Recording session stops when you click on “stop recording”
- Automatic: Recording session stops at the preset time.
4.4.3 Set Date and Time For Automatic Recording Session
To set the date and time for an Automatic Recording session, follow the
steps below as shown on the screens on the previous page:
• Click on the drop down box of “START” and select “Set Time”
• Click on the drop down box of “Set Time” and select “Choose date”
• Select a date between the actual date of the year and 2031. (
NOTE: You cannot
choose a date in the past, for example 2001 is not a valid date).
• Repeat Step.2 to choose the time and click OK after a selection is made.
• Once you click on the RECORD button, the preset recording is stored in
memory. You can disconnect the Remote User Interface (PDA) at this point.
MDL System Setup
Phase Selection: P 3 Ø 4 W (Y)
Fund. Frequency:
T
Clamp
Integration Period:
:
T
AR
ST
OP:
ST
Back
P 60 Hz
ype:
P 1000
P 5 sec
ime
T
P Set
ue 3/15/05 3:08 pm
P T
ime
T
P Set
ue 3/15/05 3:08 pm
P T
Amps
Next
MDL System Setup
Phase Selection: P 3 Ø 4 W (Y)
Fund. Frequency:
T
Clamp
Integration Period:
START:
STOP:
Back
P 60 Hz
ype:
P Set Time
Now
P Tue 3/15/05 3:08 pm
Choose Date
Choose Date
P Set Time
Choose Time
P Tue 3/15/05 3:08m
P 1000
P 5 sec
Amps
14
Next
Recording Start Date
Q 2005 R
Jan Feb Mar Apr May Jun
Jul Aug Sep Oct Nov Dec
S M T W T F S
1 2 3 4 5
6 7 8 9 10 11 12
13 14
20 21 22 23 24 25 26
27 28 29 30 31
Cancel
(15)
Today
16 17 18 19
Page 16
DM-4 Power Quality Recorder
MDL System Setup
Phase Selection: P 3 Ø 4 W (Y)
Fund. Frequency:
Type:
Clamp
Integration Period:
START:
STOP:
Back
P 60 Hz
Amps
P 1000
P 5 sec
P Set Time
Now
P Tue 3/15/05 3:08 pm
Choose Date
P Set Time
Choose Time
Choose Time
P Tue 3/15/05 3:08m
Next
MDL System Setup
Phase Selection: P 3 Ø 4 W (Y)
Fund. Frequency:
Clamp Type:
Integration Period:
START:
R
ecording Start Time
3 : 0 8 AM PM
OK
P Set Time
H
P
Cancel
P 60 Hz
P 1000 Amps
P 5 sec
5. MAIN MENU
MDL-Main Menu
View Real Time Data
Setup a New Recording Session
Download Data
View Downloaded Data
Delete Session Device Status
5.1 INITIAL SETTINGS
Initial settings are the last settings the user configured the unit at the time of the
last use. Each time you access the device with the Remote User Interface (PDA) ,
you will be asked if you would like to retrieve the device existing settings. Click YES
to retrieve the existing settings and NO to reset the device with the Remote User
Interface (PDA) settings.
MDL-Main Menu
View Real Time Data
Setup a New Recording Session
R
etrieve Settings?
Do you want to retreive
current settings from the
device?
No
Yes
15
Page 17
DM-4 Power Quality Recorder
5.1.1 How to Set the Date and Time?
When connecting to the data logger, if the date and time of the device are different
from the Remote User Interface (PDA), the program will ask you if you would like
to synchronize the data logger with the Remote User Interface (PDA). Click on YES
to set the date and time manually or automatically. Click on NO to continue to use
the device. Important!!! (If you do not set the device time correctly, the auto-
matic recording will not take place.)
Connecting
If you are using serial port, make sure
that the device is connecting using
appropriate cable.
Wrong Settings
The data logger’s date and
v
time are not in sync with the
Palm. Do you want to
change the settings
No
Yes
Click Yes
to change
the settings
Set Time
Synchronize time with Palm’s clock
Y
Palm Time: 10/3/05 2:27pm
Set time manually
Set Date: 10/3/05
Set Time: 2:27pm
Click Done
to accept
the change
Done
Device Status
Record @ undefined
Device time 10/3/05 2:29 pm
Battery 100%
Memory 0%
F/W ver 1.0b3
Back
Set
NOTE. You can also use the Download Suite program to set the date and time in
the device.
5.2 DEFAULT SETTINGS: ANALYZER CONFIG
The basic setting allows you to quickly set the device for a recording session with
all the 456 parameters selected.
16
Page 18
DM-4 Power Quality Recorder
5.2.1 How to Set the Type of Electrical System Under Test
• Phase Selection
This parameter permits you to select the type of electrical system under test among
the following configurations:
1Ø2W: Single phase system
1Ø3W: Single phase system
3Ø3W: 3 wires system (three-phase system without neutral)
3Ø4W: 4 wires system (three-phase system with neutral)
MDL System Setup
Phase Selection: P 3 Ø 4 W (Y)
Fund. Frequency:
Clamp Type:
Integration Period:
Comment: Recording 1
START: P Manual
STOP:
Back
P Manual
1Ø2W
1Ø3W
P 60 Hz
3Ø3W (Delta)
3Ø4W (Y)
Next
• Clamp Type
The value of this parameter must always be equal to the clamp type you are
using. Three types of clamps are available:
1000A: For Standard clamps of 1000 Amps
3000A: For Flexible clamps of 3000 Amps.
100A: For miniature clamps of 100 Amps.
Set the desired value by selecting the clamp type using the drop-down box.
MDL System Setup
Phase Selection: P 3 Ø 4 W (Y)
Fund. Frequency:
Clamp Type:
Integration Period:
START:
STOP:
Back
Comment:
P Manual
P Manual
17
P 60 Hz
100
1000 AMPS
3000 AMPS
AMPS
Next
Page 19

DM-4 Power Quality Recorder
5.3 BASIC SETTING: RECORDER CONFIG
This option allows you to check and eventually modify the recording parameters
and the selected parameters (up to a maximum of 456).
5.3.1 MDL Parameter Setup
This option allows you to setup the parameters for a recording session. When using
the Remote User Interface (PDA) in basic setting, selecting any block will enable
all the parameters under this block.
MDL Parameter Setup
Y
RMS Voltage (all phases)
Y
RMS Current (all phases)
Y
Voltage Harmonics
Y
Current Harmonics
Voltage Frequency & Phase Shift
Y
Y
Current Frequency & Phase Shift
Power/Energy/PF(all phases)
Y
Demand
Y
Waveform
Y
Back
Next
To select/deselect a function block, just click on the checked box. The check mark
(√) indicates that the function block has been selected.
5.3.2 MDL Voltage Anomalies
This option allows you to setup the parameters for all the anomalies (Sag, Surge,
and Spike).
MDL Voltage Anomolies
Voltage Anomalies
Back
Next
To select the voltage anomalies function block, just click on the checked box.
A check mark (√) indicates that the function block is enabled.
18
Page 20

DM-4 Power Quality Recorder
5.4 Advanced Setting: Recorder Configuration
The advanced setting option allows you to setup the desired parameters you want
for a recording session.
To enter the advanced setting mode:
1) From the MDL main menu screen, click on
MDL Main Menu and select Options
MDL-Main Menu
Click
MDL-Main
Menu
View Real Time Data
Setup a New Recording Session
Download Data
View Downloaded Data
Delete Session Device Status
2) From Options down drop list, choose MDL Preferences
Control Optons
View Real Time Data
Setup a New Recording Session
Download Data
View Downloaded Data
Delete Session Device Status
Preferences
MDL
Beam MDL
About MDL
3) From MDL Preferences menu, select Advanced Mode by clicking on the
checked box. A check mark (√) indicates a selection. Press Ok to complete the
selection. You should return to the main menu.
MDL-Main Menu
View Real Time Data
MDL-Main Menu
MDL Preferencesu
Advance Mode:
Setup a New Recording Session
Comm Port:
Download Data
iew Downloaded Data
V
P Serial
MDL-Main Menu
View Real Time Data
Setup a New Recording Session
Download Data
View Downloaded Data
Delete Session Device Status
19
Page 21

DM-4 Power Quality Recorder
5.4.1 Setting the Parameters Individually
To set-up the parameters individually for a recording session, select “Setup a New
recording Session
” from the MDL Main Menu. The MDL System Setup will
appear. Click on Next to enter the MDL Parameter Setup screen.
MDL-Main Menu
View Real Time Data
Setup a New Recording Session
Download Data
View Downloaded Data
Delete Session Device Status
MDL System Setup
Phase Selection: P 3 Ø 4 W (Y)
Fund. Frequency:
Clamp Type:
Integration Period:
START: P Manual
STOP:
Back
P 60 Hz
P 1000 Amps
P 5 sec
Comment: Recording 1
P Manual
Next
MDL Parameter Setup
Voltage Current Power
Variable Ø1 Ø2 Ø3 N
Voltage NA
Harmonics NA
Frequency NA
Phase Shift NA
Waveform
Back
Y
Y Y
A
A
A
Y
Y Y
Y
Y Y
Next
5.4.2 Advanced MDL Parameter Setup
The advanced MDL parameter setup option allows you to select one or all the
parameters for one or all the phases for Voltage, Current, and Power.
5.4.3 Set up the Parameters for Voltage
1Ø2W Single Phase 1Ø3W Single Phase
MDL Parameter Setup
Voltage Current Power
Variable Ø1
Voltage
Harmonics
Frequency
Phase Shift
Waveform
Back
A
Next
MDL Parameter Setup
Voltage Current Power
Variable Ø1 Ø2 Ø12
Voltage
Harmonics
Frequency
Phase Shift
Waveform
Back
Y
Y Y
A
A
Y
Y
Y
Y
Next
3Ø3W Delta Configuration 3-phase 3Ø4W Wye Configuration 3-phase
MDL Parameter Setup
Voltage Current Power
Variable Ø1 Ø2 Ø3 N
Voltage NA
Harmonics NA
Frequency
Phase Shift NA
Y
Back
W
aveform
Y
Y Y
A
A
A
NA
Next
MDL Parameter Setup
Voltage Current Power
Variable Ø1 Ø2 Ø3 N
Voltage NA
Harmonics NA
Frequency
Phase Shift NA
Y
Back
aveform
W
Y
A
20
Y Y
A
A
NA
Next
Page 22

5.4.4 Setup the Parameters for Current
1Ø2W Single Phase 1Ø3W Single Phase
DM-4 Power Quality Recorder
MDL Parameter Setup
oltage Current Power
V
Variable Ø1
Current
Harmonics
Frequency
Phase Shift
Waveform
Back
A
Next
MDL Parameter Setup
oltage Current Power
V
Variable Ø1 Ø2
Current
Harmonics
Frequency
Phase Shift
W
Back
aveform
Y
Y
A
A
Y
Y
Y
Y
Next
3Ø3W Delta Configuration 3-phase 3Ø4W Wye Configuration 3-phase
MDL Parameter Setup
Voltage Current Power
Variable Ø1 Ø2 Ø3 N
Voltage
Harmonics
Frequency NA
Phase Shift NA
Y
Back
Waveform
Y
Y Y
A
A
A
Y
Y
A
Y Y
Y Y
Y
Next
MDL Parameter Setup
Voltage Current Power
Variable Ø1 Ø2 Ø3 N
Voltage
Harmonics
Frequency NA
Phase Shift NA
Y
Waveform
Back
Y
Y Y
A
A
A
Y
Y Y
Y
Y Y
Y
A
Next
5.4.5 Setup the Parameters for Power
1Ø2W Single Phase 1Ø3W Single Phase
MDL Parameter Setup
Voltage Current Power
Variable Ø1 Ø2 Ø3 TOT
P (KWh)
Q (kVARh)
S(kVAh)
PF
dPF
PF true/displ
Back
Y
Y
Y
Y
Y
Y
Y
Y
Y
Y
Y
Y
Next
MDL Parameter Setup
Voltage Current Power
Variable Ø1 Ø2 Ø3 TOT
P (KWh)
Q (kVARh)
S(kVAh)
PF
dPF
PF true/displ
Back
Y
Y
Y
Y
Y
Y
Y
Y
Y
Y
Y
Y
Y
Y
Y
Y
Y
Y
Next
21
Page 23

DM-4 Power Quality Recorder
3Ø3W Delta Configuration 3-phase 3Ø4W Wye Configuration 3-phase
MDL Parameter Setup
Voltage Current Power
Variable Ø1 Ø2
P (KWh)
Q (kVARh)
S(kVAh)
PF
dPF
PF true/displ
Back
Ø3 TOT
Y
Y Y
Y
Y
Y
Y
Y Y
Y
Y Y
Y
Y Y
Y
Y Y
Y
Y
Y
Y
Y
Y
Next
MDL Parameter Setup
Voltage Current Power
Variable Ø1 Ø2
P (KWh)
Q (kVARh)
S(kVAh)
PF
dPF
PF true/displ
Back
Ø3 TOT
Y
Y Y
Y
Y
Y
Y
Y Y
Y
Y Y
Y
Y Y
Y
Y Y
Y
Y
Y
Y
Y
Y
Next
5.4.6 Setup the Parameters for Voltage Harmonics
To setup the parameters for voltage harmonics, you must be in the advanced
mode
when programming with the Remote User Interface (PDA).
1) From the main menu, select
start a new recording session. The MDL System
Setup screen appears. If you have already setup the device for the system you
want to monitor, click on NEXT and the MDL parameter setup screen should
appear. If you haven’t done so, refer to section 5.2.1
MDL-Main Menu
View Real Time Data
Setup a New Recording Session
Download Data
View Downloaded Data
Delete Session Device Status
MDL System Setup
Phase Selection: P 3 Ø 4 W (Y)
Fund. Frequency:
Clamp Type:
Integration Period:
START: P Manual
STOP:
Back
P 60 Hz
P 1000 Amps
P 5 sec
Comment: Recording 1
P Manual
Next
22
Page 24

DM-4 Power Quality Recorder
2) From the MDL parameter setup screen, select voltage and choose “A”
(harmonic) under the phase you want to monitor. You need to setup each phase
separately when monitoring more than one phase.
MDL Parameter Setup
Voltage Current Power
Variable Ø1 Ø2 Ø3 N
Voltage NA
Harmonics NA
Frequency NA
Phase Shift NA
Waveform
Back
Y
Y Y
A
A
A
Y
Y Y
Y
Y Y
Y
Y Y
Next
Harmonics Phase-1
Harmonics Phase-2
Harmonics Phase-3
3) From the Harmonics setup screen, you can select the harmonics you want to
enable by clicking on the numbers. To unselect a number, just click on it another
time. Click on
done to confirm the selections.
Recording Start Date
Harmonics
1 2 3 4 5 6 7 8 9 10
11 12 13 14 15 16 17 18 19 20
21 22 23 24 25 26 27 28 29 30
31 32 33 34 35 36 37 38 39 40
41 42 43 44 45 46 47 48 49 50
51
Select All
Clear All
Done
Recording Start Date
1 2 3 4 5 6 7 8 9 10
11 12 13 14 15 16 17 18 19 20
21 22 23 24 25 26 27 28 29 30
31 32 33 34 35 36 37 38 39 40
41 42 43 44 45 46 47 48 49 50
51
Select All
Harmonics
Clear All
Harmonics #’s
1, 3, 7, 15 and
49 are selected
Done
5.4.7 Setup the Parameters for Current Harmonics
To setup the parameters for current harmonics, repeat step 5.4.5 and select
Current in step.2
MDL Parameter Setup
Voltage Current Power
Variable Ø1 Ø2 Ø3 N
Voltage
Harmonics
Frequency NA
Phase Shift
Back
Waveform
Y
A
Y
Y
Y Y
A
Y Y
Y Y
Y
A
A
NA
Next
23
Page 25

DM-4 Power Quality Recorder
5.5 Download Data
After a recording session, you can retrieve your data by downloading the file from
the device to your PC, using the Download Suite, or from the device to your
Remote User Interface (PDA).
5.5.1 Download Data with the Remote User Interface (PDA)
To retrieve a file from the device with your Remote User Interface (PDA), click on
Download Data from the MDL main menu. On the
Remote Recordings screen,
select the file you want to download and click on Download. Once Downloading
recording is complete, you will be redirected back to the Remote Recordings
screen. If you don’t have any more recording files to download, click on the back
button to return to the main menu.
Click
Download
Data
MDL-Main Menu
View Real Time Data
Setup a New Recording Session
Download Data
View Downloaded Data
Delete Session Device Status
Remote Recordings
1/1/70 12:46 am
Downloading Recording...
Remote Recordings
1/1/70 12:46 am
Back
Mobile Datalogger
45%
Cancel
24
Delete
Download
Click
Download
Page 26

DM-4 Power Quality Recorder
5.5.2 View Downloaded Data
This option allows you to view all downloaded files in the Remote User Interface
(PDA). Once a file is downloaded, you can select it to be viewed. To view a downloaded file, click on
View Downloaded Data from the MDL main menu. The pro-
gram will prompt you to the Saved Recordings screen. Select the file you want to
view by clicking on it once.
Saved Recordings
Recordings Date Time
2760 1/1/70 12:46am
1111069687 3/17/05 2:28pm
Click
Click View
Downloaded
Data
MDL-Main Menu
View Real Time Data
Setup a New Recording Session
Download Data
View Downloaded Data
Recorded
Delete Session Device Status
From This screen,
you can select the
recorded information
you want to view by
clicking on any item
on the list.
Back
Recording Parameters
Recording Information
- V Voltage RMS
- V Harmonics
- V Frequency
- V Phase Shift
- Voltage Anomalities (Spikes)
- Power (P,Q,S,PF,dPF)
- Energy (Ep, Eq, Es)
- Demand
Back
- I Current RMS
- I Harmonics
- I Frequency
- I Phase Shift
Next
Data
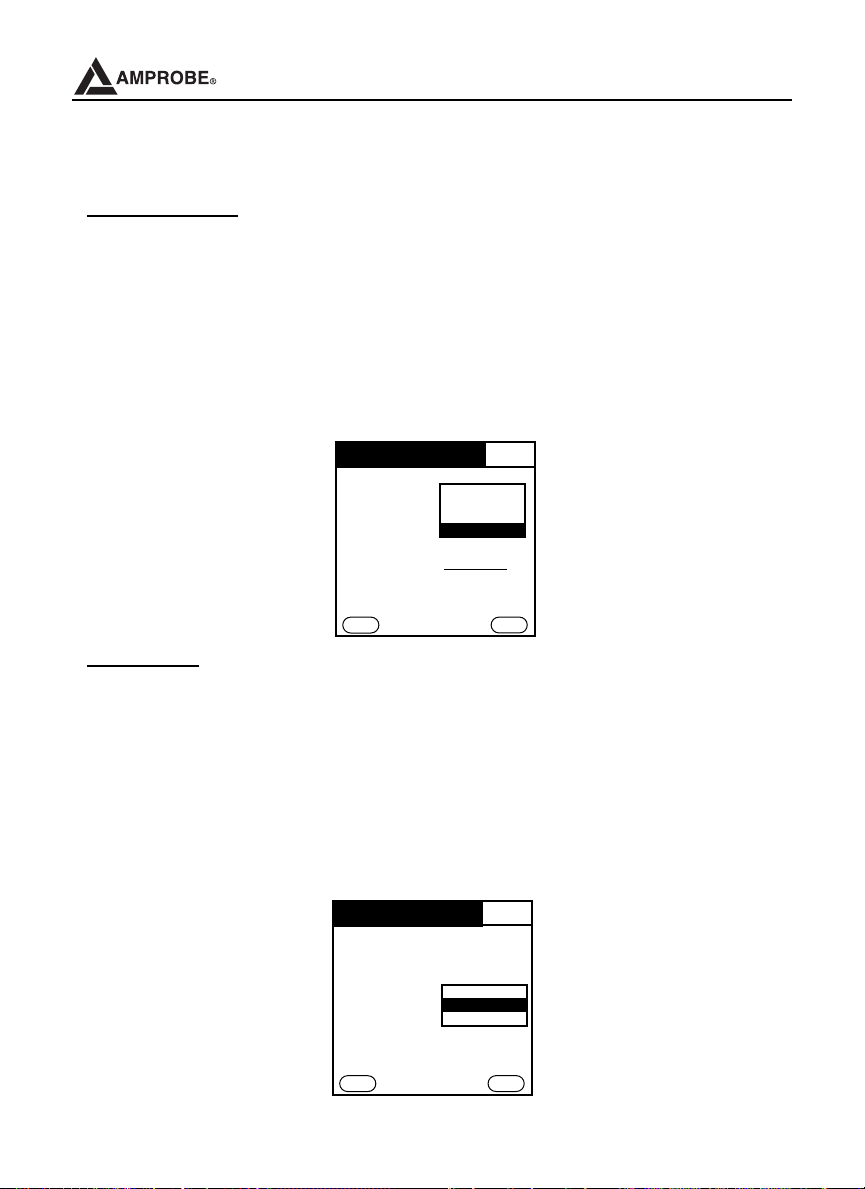
5.5.3 Recording Information
The recording information dialog box allows you to view the settings that have been
used in this recording session. Click on “OK” to return to the recording
parameters
screen.
Recording Information
Fund Freq: 60
System: 3
Int. Period: 5
Clamp: 1000
Start: 3/17/05 2:28pm
Stop: 3/17/05 3:12pm
Comment:
Monday031405
Click OK
25
OK
Page 27

DM-4 Power Quality Recorder
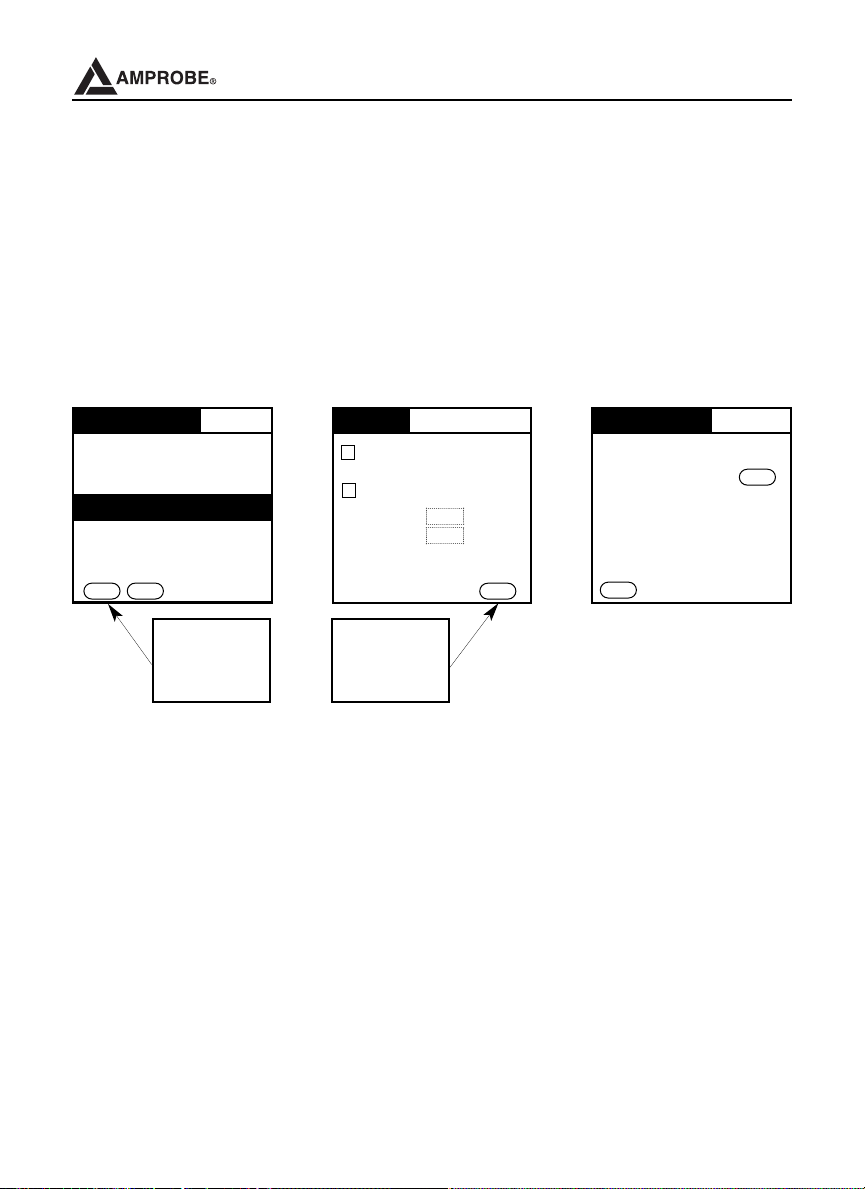
5.5.4 Delete Session
To delete a recording session from the device, choose Delete Session from the
main menu. The device will prompt you to the remote recording files. From the
remote recording files screen, select a file or the files you want to delete and then
click on Delete.
MDL-Main Menu
View Real Time Data
Setup a New Recording Session
Download Data
View Downloaded Data
Remote Recordings
4/20/05 2:00pm
4/25/05 10:55 am
4/25/05 1:45 pm
4/25/05 1:45 pm
Select the
recording
session you
want to delete
and click on
Delete Session Device Status
Back
Delete
Download
Delete
Symbols Description Advised Settings
START:MAN The recording of all the selected parameters will start at
00 seconds after pressing RECORD
STOP:MAN The recording of all the selected parameters will be
interrupted manually by pressing RECORD.
START:AUTO
STOP:AUTO
The recording of all the selected values will be started /
interrupted at the set dates and times. In order to start
☺☺
☺☺
the recording the user will have to select RECORD to
set the instrument in Stand-by mode until the start date
and time previously set.
INT. PERIOD The value of this parameter determines how many sec-
onds the values of all the selected parameters will be
15min
stored. Available choices:
5sec, 15sec, 30sec, 1min, 5min, 15min, 30min, 1hr.
☺☺
HARM REC. Enable = the instrument will record the values of the
selected voltage and current harmonics
corresponding to the voltages and currents selected in
the corresponding pages “Voltage” and “Current”.
Example: If the following Parameters are selected:
a) Phase Voltage 1 and 2, Thd, Harmonics 1, 3, 5.
b) Phase Current 2 and 3, Thd, Harmonics 3, 5, 7.
The instrument will record:
a) The Phase Voltage 1 and 2, Thd and Harmonics 1,3,5 of the Phase
Voltage 1 and 2 while it will not record anything about Phase Voltage 3
b) The Phase Current 2 and 3, Thd and Harmonics 3,5,7 of the Phase
Current 2 and 3 while it will not record nothing about Phase Current 1
☺☺
Disable = the instrument will not record any voltage or
current harmonic selected
26
Page 28

DM-4 Power Quality Recorder
Symbols Description Advised Settings
ANOM REC. Enable = the Instrument will record Voltage Sag, Surge,
and voltage spike
Disable = the instrument will not record any voltage
Sag, Surge, and voltage spike.
V1, V2, V3
V12, V23 or
V32, V31
Thd, DC, 01...51 Voltage Total Harmonic Distortion, DC Component,
Vref (Only if
ANOM. REC flag
has been enable)
LIM+, LIM(Only if ANOM.
REC flag has
been set ON)
I1, I2, I3, IN RMS value of the current of phase 1, phase 2, phase 3
Thd, DC, 01..51 Current Total Harmonic Distortion, DC Component,
Pt, P1, P2, P3,
P12, P32, P31
RMS value of the voltage of phase 1, phase 2, phase 3
respectively, values of the phase-to-phase voltages 1-2,
2-3 or 3-2 and 3-1.
01..51 Harmonics respectively
RMS reference value for Voltage used in Voltage
Anomalies detection (Voltage Sag and Surge).
The Reference is:
a) Voltage Phase to Neutral for Single Phase and 4
wires three phase system
b) Voltage Phase to Phase for 3 wires three phase system
High and Low Voltage Percent threshold used in
Voltage Anomalies detection (Voltage Sag and Surge).
Example: Three Phase System 4 wires.
Vref = 120, LIM+= 10%, LIM-=10% =>
High Lim = 132V, Low Lim = 108.0V
The Instrument will detect a voltage Anomalies if the
RMS Voltage Values (calculated every 14ms) beyond
the above calculated thresholds
and of the neutral respectively.
01..51 Harmonics respectively
Values of the active power (total, of phase 1, phase 2
and phase 3) (only for 3 wires measurement)
value of the power measured by the W
3-2 respectively.
attmeter 1-2 and
3 wires V12V32V
4 wires V1, V2, V
Thd,01,03,05,07
4 wires Pt, P1, P2, P3
☺☺
☺☺
Single phase: V1
3
☺☺
Thd,01,03,05,07
☺☺
Single phase: 230V
3 wires: 400V
4 wires: 230V
☺☺
Single phase: 120V
3 wires: 480V
4 wires 277V
☺☺
Single phase: I1
3 wires: I1, I2, I3
4 wires I1, I2, I3, IN
☺☺
Single phase: P1
3 wires: Pt
31
27
Page 29

DM-4 Power Quality Recorder
Symbols Description Advised Settings
Qt, Q1, Q2, Q3,
Q12, Q32, Q31
-Qt, -Q1, -Q2, -Q3,
-Q12, -Q32, -Q31
St, S1, S2, S3,
S12, S32, S31
Values of the inductive reactive power (total, of phase 1,
phase 2, phase 3) (only for 3 wires measurement) value
of the reactive inductive power measured by the VAR
meters 1-2 and 3-2 respectively
Values of the capacitive reactive power (total, of phase
1, phase 2, phase 3) (only for 3 wires measurement)
value of the reactive capacitive power measured by the
VA meters 1-2 and 3-2 respectively
Values of the apparent power (total, of phase 1, phase 2,
phase 3) (only for 3 wires measurement) value of the power
measured by the VAmeters 1-2 and 3-2 respectively
☺☺
Single phase: Q1
3 wires: Qt
4 wires Qt, Q1, Q2, Q3
☺☺
Single phase: S1
3 wires: St
4 wires St, S1, S2, S3
Pft, Pf1, Pf2, Pf3 Values of the power factors (total, of phase 1, phase 2
and phase 3 respectively)
dpft, dpf1, dpf2,
dpf3
Eat, Ea1, Ea2,
Ea3
Ert, Er1, Er2, Er3 Values of the inductive reactive energy (total, of phase
-Ert, -Er1, -Er2, Er3
Est, Es1, Es2, Es3 Values of the Apparent Energy (total, of phase 1,
Selecting a power factor (Pf) or a cosΘ (dPf) for the recording automatically their inductive value
and their capacitive value will be recorded separately.
Values of the cosΘ (total, of phase 1, phase 2 and
phase 3 respectively)
Values of the active energy (total, of phase 1, phase 2,
phase 3)
1, phase 2 and phase 3)
Values of the capacitive reactive energy (total, of phase
1, phase 2, phase 3)
phase 2, phase 3)
Single phase: Pf1 dPf1
☺☺
3 wires: Pft dPft
4 wires Pft Pf1 Pf2
Pf3dPft dPf1 dPf2
dPf3
☺☺
Single phase: Ea1
3 wires: Eat
4 wires Eat Ea1 Ea2
Ea3
☺☺
Single phase: Er1
3 wires: Ert
4 wires Ert Er1 Er2
Er3
☺☺
Single phase: Es1
3 wires: Est
4 wires Est
Es3
Es1
Es2
28
Page 30

DM-4 Power Quality Recorder
5.5.5 RESET (PRESS AND HOLD RESET KEY WHILE PRESSING ON RECORD)
This option re-establishes the default settings of the instrument.
The default settings of the instrument consist of:
ANALYZER CONFIG:
Frequency: 60Hz
Full scale of the clamps: 1000A
Type of electrical system: 4 wires
RECORDER CONFIG:
Start: Manual (the recording is started at 00 sec mark on clock after pressing the RECORD key)
Stop: Manual
Integration period: 5S
Recording of harmonics: ON
Recording of Sag and Surge: OFF
Voltage Reference for Sag and Surge detection: 480V
Upper Limit for Sag and Surge detection: 10%
Lower Limit for Sag and Surge detection: 10%
Selected voltages: V1, V2, V3
Selected voltage harmonics:
Selected currents: I1, I2, I3, IN
Selected current harmonics:
Powers, Pf and cosΘΘselected:
Pt, P1, P2, P3
Qt, Q1, Q2, Q3
Qt, Q1, Q2, Q3
St, S1, S2, S3
Pft, Pf1, Pf2, Pf3
dpft, dpf1, dpf2, dpf3
Energies:
Eat, Ea1, Ea2, Ea3
Erit, Eri1, Eri2, Eri3
Erct, Erc1, Erc2, Erc3
Est, Es1, Es2, Es3
Note: The RESET command will not erase the instrument’s memory.
29
Page 31

DM-4 Power Quality Recorder
6. RECORDING CONFIGURATION
More practically, we may schematize the right procedure of use as follows:
1) Connect the External Power Supply
2) Check and eventually modify the basic settings of the instrument.
3) Select the parameters to be recorded.
4) Connect the DM-4 to the electrical system to be tested and push the
ON/OFF button
5) Evaluate the values of the parameters under test
6) If you want to record:
A) Decide what to record
B) Select MDL Setup Parameter and check if the existing parameters meet
your requirements
7) Start the recording by pressing RECORD.
7. STARTING A RECORDING
You can start a recording manually or automatically. Therefore, after setting all the
parameters and click on RECORD, the instrument will start recording:
MANUALLY: The recording will start when Instrument’s time reaches the “00” seconds value after pressing RECORD.
AUTOMATICALLY: If the operator has clicked on RECORD the instrument will
remain in stand-by until the date and time previously set, then the recording will start.
If the operator has not clicked on RECORD, the recording will never start.
m
For recordings ALWAYS use the external power supply even though the
instrument allows the operator to perform a recording using internal batteries.
CAUTION
30
Page 32

DM-4 Power Quality Recorder
If during a recording the external power supply is de-energized, the instrument will
continue the recording using the internal battery power until the batteries are
exhausted (the data stored until the definitive turning off won’t get lost). For this
reason we recommend that you
ALWAYS insert a new set of batteries before a
long recording.
• If the instrument is recording or is measuring energy (and the external
power supply is not connected), the recording will continue until the batteries
are exhausted.
Before starting a recording the operator should first evaluate the state of the
equipment, decide what to record and set the instrument accordingly.
In order to facilitate this task the instrument has been factory pre-set with a
general configuration which should fit most cases. Using the RESET option
(See paragraph 5.6).
By pressing
RECORD the recording of the selected parameters is started
according to the settings made in the MENU (see paragraphs 5.2 and 5.3).
As the default value of the integration periods is set at 5 seconds the instrument will
store data in the temporary memory every 5 seconds. Afterwards the instrument will
explain the results saved in the temporary memory and will save the first series of
values in the permanent memory. Therefore, if an integration period of 5 seconds has
been set, the recording will continue for about 5 seconds before producing a set of
recorded values. If the recording is interrupted before the selected integration period
has completely elapsed, the data stored in the temporary memory (SRAM) will not be
elaborated and the corresponding series of values won’t be transferred to the
permanent memory (FLASH).
31
Page 33

DM-4 Power Quality Recorder
8. RECORDING IN PROCESS
If during a recording the external power supply is de-energized, the instrument will
continue the recording using the internal battery power until the batteries are
exhausted (the data stored up to the point the instrument shuts down won’t get
lost). For this we recommend you
a long recording. You may not be able to download this file with the Remote User
Interface (PDA) device. We recommend that you use the Download Suite to open
this file.
During a recording the following commands are disabled:
• AUTOPOWER OFF function
• ON/OFF key
• RESET key
Click “DEVICE STATUS” on the main menu and the following screen will appear:
ALWAYS insert a new set of batteries before
This page includes:
1) Recording information
2) Device Date and Time
3) Battery condition
4) Memory size available
5) Firmware version
Device Status
Recording @ 0 (undefined)
Device Time 1/1/70 12:06 am
Battery 100%
Memory 99%
F/W ver 1.2
Back
32
Set
Page 34

DM-4 Power Quality Recorder
9. STOPPING A RECORDING
The instrument uses a protective routine to avoid the risk of being disturbed or
interrupted during a recording or an energy measurement. Once a recording has
been started using automatic record mode, it won’t be sufficient to press the
RECORD key on the device to stop the recording. You need to use the Remote
User Interface (PDA) or the download suite to stop the recording.
9.1 Stop a Recording with the REMOTE USER INTERFACE (PDA)
To stop a recording with the Remote User Interface (PDA) , click on the MDL Main
Menu screen and then select STOP RECORDING.
MDL-Main Menu
View Real Time Data
Setup a New Recording Session
Download Data
View Downloaded Data
Delete Session Device Status
Control Optons
Start Recording
View Real Time Data
Stop Recording
Setup a New Recording Session
Download Data
View Downloaded Data
Delete Session Device Status
9.2 Stop a Recording with the Download Suite
To stop a recording with the download suite, go to control panel screen window and
then click on stop recording.
33
Page 35

DM-4 Power Quality Recorder
10. CONNECTING THE INSTRUMENT TO A PC
In order to connect the instrument to a PC you must connect the serial cable
shipped with the instrument to the serial output of the PC.
The DM-IV serial cable has the following inner connections:
2
Male connector 9 pins 3
on the instrument side 5
2
3 Female connector 9 pins
5 on the PC side
The available transmission speeds are the following:
4800, 9600, 19200, 57600(default value)
The value of the transmission speed (Baud Rate) must be selected on the Remote User
Interface (PDA) or the Download Suite in order to have proper communication. The download suite will always look for COM1 first if the setting is set to
AUTOMATICALLY.
For download suite instructions please refer to software help file.
In order to transfer the recorded data from the instrument to the PC the following
procedure must be followed:
1) Switch ON the instrument
2) Connect the serial output of the instrument to the serial output of the
PC through the serial cable
34
Page 36

DM-4 Power Quality Recorder
3) Install the software and start it – Close the introduction window
4) Press F2 and follow the commands.
5) Refer to software help file for further instructions.
11. MEASURING PROCEDURES
11.1 USING THE INSTRUMENT IN A SINGLE PHASE SYSTEM
CAUTION
The maximum voltage between L1 and COM inputs is CATIII 635V~
m
phase-phase and 370V~ phase – earth. Do not measure voltages
exceeding the limits prescribed by this manual. Should you exceed the
voltage limits you could damage the instrument and/or its components
or endanger your safety.
Phase 1
Phase 2
Neutral
Phase 3
Black
Yellow
Instrument connection in a single-phase system
CAUTION
m
1) Check the cables connection.
2) Connect the phase and neutral voltage wires according to the connections
shown in the above picture.
If possible, before connecting the instrument to the electrical system,
remove the power off the electrical system.
35
Page 37

DM-4 Power Quality Recorder
3) Turn ON the unit by pressing the ON/OFF push button
4) If you want to measure current and power, connect the clamp meter to the phase
conductor respecting the specifications shown on the clamp and the connections
shown in the picture.
5) Apply voltage to the electrical equipment under test (if previously shut off for the
instrument connection).
6)The values of the available electrical parameters will be displayed on the Remote
User Interface (PDA) display or the PC screen. For further details see the Remote
User Interface (PDA) settings.
7) If you want to record, simply press the RECORD push button on the device.
11.2 USING THE INSTRUMENT IN A THREE PHASE 4- WIRE SYSTEM (WYE)
CAUTION
The maximum voltage between L1, L2, L3 & COM inputs is CAT III 635
m
V~ phase – phase 370 V~ phase to earth. Do not measure voltages
exceeding the limits prescribed by this manual. Should you exceed the
voltage limits you could damage the instrument and/or its components
or endanger your safety.
Phase 1
Phase 2
Neautral
Phase 3
Black
Red
Yellow
Blue
Instrument connection in a three-phase 4 wire system
36
Page 38

DM-4 Power Quality Recorder
CAUTION
m
1) Check the cables connection.
2) Connect the phase and neutral voltage wires respecting the connections shown
in the picture.
3) If you want to measure current and power, connect the clamp meter to the phase
conductor respecting the specifications shown on the clamp and the connections
shown in the picture. In case of doubts select the position
connecting one clamp at a time, check if:
a) The phase sequence is correct
b) The active power P of each phase is positive.
c) The value of the Pf of each phase is not excessively low (typically it’s not lower
4) Apply voltage to the electrical equipment under test (if previously shut off for the
instrument connection).
5) The values of the available electrical parameters will be displayed.
6) If you want to record:
a) Check and, if needed, modify the values of the basic parameters (see
b) Check and, if needed, modify the recording parameters.
c) To start the recording press
If possible, before connecting the instrument to the electrical equipment
to be tested take the power supply off the electrical equipment.
POWER and,
than 0.4). In case the Pf is lower than 0.4, check if the phase voltage is
associated to the right clamp meter (for example the voltage of phase 1 must
be associated to the clamp meter no. 1).
paragraphs 5.2 and 5.3).
RECORD.
37
Page 39

DM-4 Power Quality Recorder
11.3 USING THE INSTRUMENT IN A THREE PHASE 3- WIRE SYSTEM (DELTA)
CAUTION
m
The maximum voltage between V1, V2, V3 and COM (L2) inputs is
CATIII 600V~ phase-phase. Do not measure voltages exceeding the
limits prescribed by this manual. Should you exceed the voltage limits
you could damage the instrument and/or its components or endanger
your safety.
m
m
Phase 1
Phase 2
Phase 3
Instrument connection in a 3 wires three-phase system (DELTA)
Black
Red
Blue
CAUTION
Please note that in this case the yellow cable (neutral) is connected with
the red cable on phase 2. You can use any phase you want as reference.
CAUTION
If possible, before connecting the instrument to the electrical equipment
to be tested take the power supply off the electrical equipment.
38
Page 40

DM-4 Power Quality Recorder
1) Check, and if needed modify, the basic settings of the instrument (see
paragraphs 5.2 and 5.3). Particularly, the 3 wires mode must be set.
2) Connect the phase and neutral voltage wires respecting the connections shown
in the picture.
3) If you want to measure current and power, connect the clamp meter to the phase
conductor respecting the specifications shown on the clamp and the connections
shown in the picture. Check if:
a) The phase sequence is correct
b) The active power P of each phase is positive.
c) The value of the Pf of each phase is not excessively low (typically it’s not lower
than 0.4). In case the Pf is lower than 0.4, check if the phase voltage is
associated to the right clamp meter (for example the voltage of phase 1 must
be associated to the clamp meter no. 1).
d) After checking, and if needed modifying, the connection of the instrument to
the equipment re-set the
3 wires mode and the connections shown in the
picture (yellow and red wire together).
4) Apply voltage to the electrical equipment under test (if previously shut off for the
instrument connection).
5) The values of the available electrical parameters will be displayed of the instrument.
6) If you want to record:
a) Check and eventually modify the values of the basic parameters (see
paragraphs 5.2-5.3).
b) Check and eventually modify the recording parameters (see How to set the
parameters using Remote User Interface (PDA).
c) To start the recording press
RECORD
39
Page 41

DM-4 Power Quality Recorder
12. MAINTENANCE
12.1 GENERAL
The DM-4 is a precision instrument. For its’ use and storage, follow the recommendations
and instructions contained in this manual in order to avoid possible damages. Never use
the instrument in environments with a high humidity or temperature. Always turn off the
instrument if it is not in use.
12.2 BATTERY REPLACEMENT
When the battery indicator indicates less than 50% ( q ), the batteries must
be replaced.
CAUTION
Only qualified technicians should operate the instrument. Before
m
1) Disconnect cables and clamps from the circuit under test.
2) Turn the instrument off by pressing ON/OFF push button.
3) Remove the cables from the input terminals.
4) Unscrew the screw of the battery cover and remove the cover.
5) Replace the batteries with 8 new 1.5 V - AA.
6) Reposition the cover and fasten it with the proper screw.
replacing the batteries, disconnect the test leads from circuit under
voltage in order to avoid electrical shocks.
(Alkaline LR6 is strongly recommended.)
12.3 CLEANING
Use a soft dry cloth to clean the instrument. Do not use wet clothes, solvents,
water and so on.
40
Page 42

DM-4 Power Quality Recorder
13. TECHNICAL SPECIFICATIONS
13.1 FEATURES
The accuracy is stated as [1% of the reading ± number of 2 digits]. It refers to the
following atmospheric conditions: temperature 73°F± 2°F (23°C ± 1°C) with relative humidity < 75%.
13.1.1 Voltage Measurement
Range Accuracy Resolution Input Impedance
20-370V ±(3%+2digit) 0.1V 300kΩ (phase-neutral)
310-635V 0.1V 600kΩ (phase-phase)
13.1.2 Voltage Anomalies Detection (Manual Selection of Range) Voltage
Range Accuracy Resolution Input Impedance
20-370V ±(3%+2digit) 0.1V 300kΩ (phase-neutral)
310-635V 0.1V 600kΩ (phase-phase)
Time
Accuracy (ref. to 60Hz) Resolution
±8.33ms (1/2 period of fundamental) 8.33ms (1/2 period of fundamental)
13.1.3 Current Measurement (Using external transducer)
Range Accuracy Resolution Input
Impedance
Protection against
overloads
0.005-0.26V ±(2%+2digit) 100kΩ 5V
0.26-1V
Minimal Current measurable is equal to 0.5% of Clamp Full Scale
41
Page 43

13.1.4 Power Measurement (cosΘΘ: 0.5c – 0.5i)
Value Ranges Accuracy Resolution
0 – 999.9W
Active Power
1KW – 999.9KW
1MW – 999.9MW
0 – 999.9VAR
Reactive Power
1KVAR – 999.9KVAR
1MVAR – 999.9MVAR
0 – 999.9VA
Apparent Power
1KVA – 999.9KVA
±(3%+2digit)
1MVA – 999.9MVA
0 – 999.9Wh
Active Energy
1KWh – 999.9KWh
1MWh – 999.9MWh
0 – 999.9VARh
Reactive Energy
1KVARh – 999.9KVARh
1MVARh–999.9MVARh
DM-4 Power Quality Recorder
13.1.5 CosΘΘMeasurement
CosΘ Resolution Accuracy (expressed
0.20
0.50 4˚
0.80 5˚
in degrees)
3˚
0.01
42
Page 44

13.1.6 Measurement of Harmonics
Voltage
Range Accuracy Resolution
DC – 25h
26h – 33h
34h – 51h
The voltage harmonics will be null under the following threshold:
- DC: if <1V or <2% of 1stharmonic
- 1stharmonic: if <2V
- 2nd- 51st: if <1V or <2% 1stharmonic
±(5.0%+2digit)
±(10.0%+2digit)
±(15.0%+2digit)
Current
Range Accuracy Resolution
DC – 25h
26h – 33h
34h – 51h
The voltage harmonics will be null under the following threshold:
- DC: if <2% of 1stharmonic or < 0,2% of clamp full scale
- 1stharmonic: if < 0,2% of clamp full scale
- 2nd- 51st: if<2% 1stharmonic or < 0,2% of clamp full scale
Setting the FLEX option 3000A CT the DC component will be ignored.
±(5.0%+2digit)
±(10.0%+2digit)
±(15.0%+2digit)
DM-4 Power Quality Recorder
0.1V
0.1A
13.1.7 Temperature Drift
Temperature drift: 0.1 x accuracy/K
13.1.8 Safety
Insulation: Class 2
Pollution: 2
Over-voltage category: CAT III 600V~ (Phase-phase)
CAT II 1000V~ (Phase-Phase)
43
Page 45

DM-4 Power Quality Recorder
13.1.9 General Characteristics
Mechanical Features
Dimensions: 8.9” (L) x 4.1” (La) x 2.1” (H)
225(L) x 104(La) x 54(H) mm
Weight: 3.3 Lb (1.5kg)
Internal Power Supply: 8 batteries 1.5V series AA
Battery Life: 3-hours
External Power Supply: Use only Amprobe power supply Adapter code DM4EXTPS
Display: LED
Sampling Speed: 83.33 usec at 60Hz.
No. of Samples Per Period: 128
Clamp
Opening: 2.15” (53 mm)
Maximum Diameter of The Cable: 2.00” (50 mm)
13.2 ENVIRONMENT
13.2.1 Operating conditions
Reference Temperature:
73°F ± 2°F (23°C ± 1°C)
Operating Temperature: 32°F to 122°F (0°C to 50 °C)
Relative Humidity: <70%
Storage Temperature: 14°F to 140°F (-10°C to 60 °C)
Storage Humidity: <80%
44
Page 46

13.3 ACCESSORIES
13.3.1 Standard Accessories
The package contains:
Replacement Parts Part Number
DM-4 Power Quality Recorder
Remote user interface (PDA) with
connection cable
Instrument
Carrying case
External power supply 12VDC
1000A Clamp
Test Leads & Alligator Clips
(Set of 4)
PDA/DM-4 Interface Cable
RS-232 Computer Cable
Remote User Interface
Protective Case
RS-232 To USB Converter Cable
1 User Manual
Download Suite
Palm OS software
Recommended Tungsten E2 Ordered
through PALM retailers, visit www.palm.com
DM-4
HW1254A
DM-4EXTPS
DM-CT-BKCE
DVL-2
RS-PDA
C232NG1
DM-4CASE
RS-USB
www.amprobe.com
www.amprobe.com
www.amprobe.com
45
Page 47

DM-4 Power Quality Recorder
14. APPENDIX 1 – RECORDABLE PARAMETERS: SYMBOLS
Symbol Description
V1, V2, V3 RMS value of the voltage of phase 1, phase 2, phase 3 respectively
V12, V23 V31 Value of phase to phase voltages
I1, I2, I3 RMS value of the current of phase 1, phase 2, phase 3 respectively
IN RMS value of the current of the neutral
DC Continuous component of voltage or current
h01 ∏ h51 Harmonic 01 ∏ Harmonic 51 of voltage or current
ThdV Factor of total harmonic distortion of the voltage (see paragraph 14.2)
ThdI Factor of total harmonic distortion of the current (see paragraph 14.2)
Pt, P1, P2, P3 Values of the total active power, of phase 1, phase 2, phase 3 respectively
P12, P32, P13 (only for 3 wires measurement) Value of the power measured by the
Wattmeter. 1-2 and 3-2 respectively (see paragraph 14.3.2)
Qt, Q1, Q2, Q3 Values of the total reactive power, of phase 1, phase 2, phase 3 respectively
Q12, Q32, Q13 (only for 3 wires measurement) Value of the power measured by the
VARmeter 1-2 and 3-2 respectively (see paragraph 14.3.2)
St, S1, S2, S3 Values of the total apparent power, of phase 1, phase 2, phase 3 respectively
S12, S32, S13 (only for 3 wires measurement) Value of the power measured by the
VAmeter 1-2 and 3-2 respectively (see paragraph 14.3.2)
Pft, pf1, pf2, pf3 Value of the total power factors, power factors of phase 1, phase 2, phase 3
respectively
dPft, dpf1, dpf2, dpf3 Values of the total cosΘ, of phase 1, phase 2, phase 3 respectively
Eat, Ea1, Ea2, Ea3 Values of the total active energy, of phase 1, phase 2, phase 3 respectively
Ert, Er1, Er2, Er3 Values of the total inductive reactive Energy, of phase 1, phase 2, phase 3
respectively
-Ert, -Er1, -Er2, -Er3 Values of the total capacitive reactive Energy, of phase 1, phase 2, phase
3 respectively
Est, Es1, Es2, Es3 Values of the total
Apparent Energy, of phase 1, phase 2, phase 3 respectively
Negative Q (reactive power) indicates capacitive phase shift. Negative P
cates generation not load and the CTs should be reversed, rotated 180º.
46
(real or active power) indi
-
Page 48

DM-4 Power Quality Recorder
15. APPENDIX 2 – THEORETICAL OUTLINES
15.1 VOLTAGE ANOMALIES (VOLTAGE SAG AND SURGE; SPIKE)
The instrument records as voltage anomalies all those rms values, calculated every
11ms, beyond the percent thresholds of Voltage Reference (Vref) set during the programming. The maximum upper limit percent is reduced as Vref approaches 1000V.
THE REFERENCE MUST BE SET TO
Nominal Voltage Phase to Neutral: for Single Phase and 4 wires three phase system
Nominal Voltage Phase to Phase: for 3 wires three phase system
Example1: Three Phase System 3 wires
Vref = 400V, LIM+= 10%, LIM-=10% =>
High Lim = 480 x (1+10/100) = 528V
Low Lim = 480 x (1-10/100) = 452V
Example2: Three Phase System 4 wires
Vref = 277V, LIM+= 5%, LIM-=5% =>
High Lim = 277 x (1+5/100) = 290.85V
Low Lim = 277 x (1-5/100) = 263.15V
The Instrument will detect Voltage Anomalies if the RMS Voltage Values (calculated every 11ms) beyond the above calculated thresholds. These limits remain
unchanged throughout the recording period.
When a Voltage Anomaly Occurs the Instrument Records:
• The number corresponding to the phase where the anomaly occurred.
• The “direction” of the anomaly: “UP” and “DN” identify respectively voltage drops
(sag) and peaks (Surge).
• The date and time of the beginning of the event in the form day, month, year, hour,
minutes, seconds, hundredths of second.
• The duration of the event, in seconds with a resolution of 11ms.
• The minimum (or maximum) value of voltage during the event.
47
Page 49

DM-4 Power Quality Recorder
15.2 VOLTAGE AND CURRENT HARMONICS
15.2.1 THEORY
Any periodical non-sine wave can be represented as a sum of sinusoidal waves
having each a frequency that corresponds to an entire multiple of the fundamental,
according to the relation:
v(t) = V0+ ∑ Vk sin (wk t + Øk ) (1)
∞
k=1
Where:
V0 = Average value of v (t)
V1 = Amplitude of the fundamental of v (t)
Vk = Amplitude of the kthharmonic of v (t)
LEGEND:
1. Fundamental
2. Third Harmonic
3. Distorted Waveform
Effect of the sum of 2 multiple frequencies.
In the main voltage, the fundamental has a frequency of 60 Hz, the second harmonic
has a frequency of 120 Hz, the third harmonic has a frequency of 180 Hz and so on.
Harmonic distortion is a constant problem and should not be confused with short
events such as sags, surges or fluctuations. It can be noted that in (1) the index of the
sigma is from 1 to the infinite. What happens in reality is that a signal does not have
an unlimited number of harmonics: a number always exists after which the harmonics
value is negligible. The EN 50160 standard recommends to stop the index in the
th
expression (1) in correspondence of the 40
harmonic.
48
Page 50

DM-4 Power Quality Recorder
A fundamental element to detect the presence of harmonics is Thd defined as:
This index takes all the harmonics into account. The higher it is, the more
distorted the waveform gets.
15.2.2 Limit Values for Harmonics
EN-50160 fixes the limits for the harmonic voltages, which can be introduced into
the network by the power supplier. In normal conditions, during whatever period of
a week, 95% if the RMS value of each harmonic voltage, mediated on 10 minutes,
will have to be less than or equal to the values stated in the following table. The
total harmonic distortion (Thd) of the supply voltage (including all the harmonics up
to 40th order) must be less than or equal to 8%.
Odd Harmonics Even Harmonics
Not multiple of 3 Multiple of 3 Order h Relative voltage
Order h Relative voltage
% Max
5 6 3 5 2 2
7 5 9 1,5 4 1
11 3,5 15 0,5 6.24 0,5
13 3 21 0,5
17 2
19 1,5
23 1,5
25 1,5
Order h Relative voltage
% Max
% Max
These limits, theoretically applicable only for the supplier of electric energy, provide
however a series of reference values within which the harmonics introduced into
the network by the users must be contained.
49
Page 51

DM-4 Power Quality Recorder
15.2.3 Presence of Harmonics: Causes
Any apparatus that alters the sine wave or uses only a part of such a wave causes distortions to the sine wave and therefore harmonics. All current signals are in
some way distorted. The most common situation is the harmonic distortion caused
by non-linear loads such as household appliances, personal computers or speed
control units for motors. Harmonic distortion causes significant currents at frequencies that are odd multiples of the fundamental frequency. Harmonic currents affect
considerably the neutral wire of electric installations. In most countries, the main
power is three-phase 50/60Hz with delta primary and star secondary transformers.
The secondary generally provides 230V AC from phase to neutral and 400V AC
from phase to phase. Balancing the loads on each phase has always represented
a headache for electric systems designers. Until some ten years ago, in a well-balanced system, the vectorial sum of the currents in the neutral was zero or quite low
(given the difficulty of obtaining a perfect balance). The devices were incandescent
lights, small motors and other devices that presented linear loads. The result was
an essentially sinusoidal current in each phase and a low current on the neutral at
a frequency of 50/60Hz. “Modern” devices such as TV sets, fluorescent lights,
video machines and microwave ovens normally draw current for only a fraction of
each cycle thus causing non-linear loads and subsequent non-linear currents. All
this generates odd harmonics of the 50/60Hz line frequency. For this reason, the
current in the transformers of the distribution boxes contains only a 50Hz (or 60Hz)
component but also a 150Hz (or 180Hz) component, a 300Hz (or 360Hz) component and other significant components of harmonic up to 750Hz (or 900Hz) and
higher. The vectorial sum of the currents in a well-balanced system that feeds nonlinear loads may still be quite low. However, the sum does not eliminate all current
harmonics. The odd multiples of the third harmonic (called “TRIPLENS”) are added
together in the neutral and can cause overheating even with balanced loads.
15.2.4 Presence of Harmonics: Consequences
In general, even harmonics, i.e. the 2nd, 4thetc., do not cause problems. Triple
harmonics, odd multiples of three, are added on the neutral (instead of canceling each
other) thus creating a condition of overheating of the wire which is extremely
50
Page 52

DM-4 Power Quality Recorder
dangerous. Designers should take into consideration the three issues given below
when designing a power distribution system that will contain harmonic current:
• The neutral wire must be of sufficient gauge.
• The distribution transformer must have an additional cooling system to continue
operating at its rated capacity when not suited to the harmonics. This is
necessary because the harmonic current in the neutral wire of the secondary
circuit circulates in the delta-connected primary circuit. The circulating harmonic
current heats up the transformer.
• Phase harmonic currents are reflected on the primary circuit and continue back
to the power source. This can cause distortion of the voltage wave so that any
power factor correction capacitors on the line can be easily overloaded.
th
The 5
and the 11thharmonics contrast the current flow through the motors making its’ operation harder and shortens their average life.
In general, the higher the ordinal harmonic number, the smaller its energy is and
therefore the impact it will have on the devices (except for transformers).
15.3 POWER AND POWER FACTOR: DEFINITIONS
In a standard electric installation powered by three sine voltages the following is defined:
Phase Active Power:
(n=1,2,3)
Phase Apparent Power:
(n=1,2,3)
Phase Reactive Power:
(n=1,2,3)
Phase Power Factor:
(n=1,2,3)
Total Active Power:
Total Reactive Power:
Total Apparent Power:
otal Power Factor:
T
Pn = Vn • In • cos(
Sn = Vn• I
Qn = Sn - P
P
F n
P
TOT
Q
OT
T
S
TOT
P
F TOT
n
2
2
√
n
P
n
=
S
n
= P1 + P2 + P
= Q1 + Q2 + Q
2
= P
+ Q
√
TOT
P
OT
T
=
S
TOT
51
ΘΘ
3
TOT
)
n
Where:
V
n
= RMS value of voltage
between phase n and Neutral.
I
n
= RMS value of n phase
3
2
current.
f
n
= Phase displacement
angle between voltage and
current of n phase.
Page 53

DM-4 Power Quality Recorder
In presence of distorted voltages and currents the previous relations vary as follows:
Phase Active Power:
(n=1,2,3)
Phase Apparent Power:
(n=1,2,3)
Phase Reactive Power:
(n=1,2,3)
Phase Power Factor:
(n=1,2,3)
Distorted Power Factor:
(n=1,2,3)
Total Active Power:
Total Reactive Power:
Total Apparent Power:
Total Power Factor:
∞
Pn = V
∑
kn Ikn
k=1
Sn = VnN• I
F n
2
√
P
n
=
S
n
Qn = Sn - P
P
dPFn =cosf
displacement between the
fundamentals of voltage and current
P
= P1 + P2 + P
TOT
Q
= Q1 + Q2 + Q
TOT
S
= P
√
P
TOT
F TOT
TOT
P
OT
T
=
S
TOT
1n
n
2
n
=
2
+ Q
cos(
phase
3
TOT
ΘΘ
)
kn
3
2
Where:
V
kn
= RMS value of kth
voltage harmonic between n
phase and Neutral.
I
kn
= RMS value of kth current
harmonic of n phase.
f
kn
= Phase displacement
angle between kth voltage
harmonic and kth current
harmonic of n phase.
Note:
It is to be noted that the expression of the phase Reactive Power with non sine waveforms, would be wrong. To understand this, it may be useful to consider that both the
presence of harmonics and the presence of reactive power produce, among other
effects, an increase of line power losses due to the increased current RMS value.
With the above given relation the increasing of power losses due to harmonics is
added to that introduced by the presence of reactive power. In effect, even if the two
phenomena together contribute to the increase of power losses in line, it is not true in
general that these causes of the power losses are in phase between each other and
therefore can be added one to the other mathematically.The above given relation is
justified by the relative simplicity of calculation of the same and by the relative discrepancy between the values obtained using this relation and the true value.
It is to be noted moreover, how in case of an electric installation with harmonics,
another parameter called distorted Power Factor (dPF) is defined. In practice, this
parameter represents the theoretical limit value that can be reached for Power
Factor if all the harmonics could be eliminated from the electric installation.
52
Page 54

DM-4 Power Quality Recorder
15.3.1 Conventions on Powers and Power Factors
As for the recognition of the type of reactive power, of the type of power factor and
of the direction of the active power, the below conventions must be applied. The
stated angles are those of phase-displacement of the current compared to the voltage (for example, in the first panel the current is in advance from 0° to 90° compared to the voltage):
^
Equipment under test = Inductive Generator
Equipment under test = Capacitive Generator
`` ^
90˚
-P
Pf
-Q
-P
Pf
-Q
270˚
`` ^
Equipment under test = Capacitive Load
+P
Pf
-Q
+P
Pf
-Q
^
Equipment under test = Inductive Load
Where:
Symbol Significance Remarks
P+ Value of the active power +
-Pf Capacitive power factor +
Pf+ Inductive power factor +
-Q Value of the capacitive reactive power +
Q+ Value of the inductive reactive power +
P- Value of the active power -
-Pf Capacitive power factor -
+Pf Inductive power factor -
-Q Value of the capacitive reactive power -
+Q V
alue of the inductive reactive power -
Positive parameter
(load)
Negative parameter
(generator)
53
Page 55

DM-4 Power Quality Recorder
Value Significance
P The active power (positive or negative) is defined in the panel and therefore acquires the
value of the active power in that moment.
Q The reactive power (inductive or capacitive, positive or negative) is defined in the panel and
therefore acquires the value of the reactive power in that moment.
Pf The power factor (inductive or capacitive, positive or negative) is defined in the panel and
therefore acquires the value of the power factor in that moment.
0 The active power (positive or negative) or the reactive power (inductive or capacitive,
positive or negative) is NOT defined in the panel and therefore acquires a null value.
-1 The power factor (inductive or capacitive, positive or negative) is NOT defined in the panel.
15.3.2 3 Phase 3 Wire System
In the electrical systems distributed without neutral, the phase voltages and the
power factors and phase cosj lose importance. Only the phase to phase voltages,
the phase currents and the total powers remain defined.
Phase 1
W 1-2
VAR1-2
Three-phase
Phase 2
equipment
Phase 3
W 3-2
VAR3-2
In this case the potential of one of the three phases (for example, phase 2) is taken
on as reference potential. The total values of the active, reactive and apparent
power are expressed as sum of the indications of the couples of Wattmeters,
VARmeters and VAmeters.
P
= W
1-2
= VAR
= (W
√
+ W
1-2
+ W
1-2
3-2
+ VAR
3-2
3-2
)2+ (VAR
54
+ VAR
1-2
2
)
3-2
TOT
Q
TOT
S
TOT
Page 56

DM-4 Power Quality Recorder
15.4 MEASURING METHOD: OUTLINES
The instrument is able to measure: voltages, currents, active powers, inductive and
capacitive reactive powers, apparent powers, inductive and capacitive power factors, analog or impulse parameters. All these parameters are analyzed in a digital
way: for each phase (voltage and current), 6 x 128 samples are acquired on a module of 16 x 20ms, repeated for the three phases.
15.4.1 Integration Periods
The storage of all the data would require a huge amount of memory. Therefore,
we’ve tried to find out a storage method that compresses the information to be
memorized, while still providing a significant amount of data. The chosen method
is that of integration. After a certain period called the “integration period”, which can
be set from 5 seconds to 60 minutes, the instrument extracts from the sampled values the following:
• Minimum value of the parameter during the integration period (harmonics excluded)
• Medium value of the parameter (intended as arithmetic average of all the values
registered during the integration period)
• Maximum value of the parameter during the integration period (harmonics excluded)
Only this information (repeated for each parameter to be memorized) is saved in the
memory along with starting time and date of the integration period. Once these data
are memorized, the instrument restarts to take measurements for a new period.
15.4.2 Power Factor Calculations
According to the standards in force, the medium power factor can’t be calculated as
average of the instantaneous power factors. It must be obtained from the medium values of active and reactive power. Each single medium power factor (of phase or total)
is therefore calculated, at the end of each integration period, on the medium value of
the corresponding powers independently on the fact that they must be registered or
not. Besides, for a better analysis of the type of load present on the line and in order
to have terms of comparison when studying the invoicing of the low cosj, the values
of inductive and capacitive cosj are treated as independent parameters.
55
Page 57

DM-4 Power Quality Recorder
16. AFTER-SALE SERVICE
16.1 WARRANTY
Congratulations! Your new instrument has been quality crafted according to quality standards and contains quality components and workmanship. It has been
inspected for proper operation of all of its functions and tested by qualified factory
technicians according to the long-established standards of our company.
Your instrument has a limited warranty against defective materials and/or workmanship for one year from the date of purchase provided that, in the opinion of the
factory, the instrument has not been tampered with or taken apart.
Should your instrument fail due to defective materials, and/or workmanship during this one-year period, a no charge repair or replacement will be made to the
original purchaser. Please have your dated bill of sale, which must identify the
instrument model number and serial number and call the number listed below:
AMPROBE / Repair Department
Phone: 954-499-5400 • Toll Free: 800-327-5060 • Fax: 866-287-7222
Website: www.Amprobe.com
Please obtain an RMA number before returning product for repair.
Outside the U.S.A. the local representative will assist you. Above limited warranty
covers repair and replacement of instrument only and no other obligation is stated
or implied.
16.2 SERVICE
If the instrument fails to operate, check battery, test leads, etc and replace as necessary. If the instrument still malfunctions, please call the phone number listed below:
AMPROBE / Repair Department
Phone: 954-499-5400 • Toll Free: 800-327-5060 • Fax: 866-287-7222
Website: www.Amprobe.com
Outside the U.S.A. the local Amprobe representative will assist you.
56
Page 58

100795 Rev.B
 Loading...