

Page 1

Errata
8590 E-series and L-series
Programmer's Guide
08590-90235
June 1995
Title & Document Type:
Manual Part Number:
Revision Date:
HP References in this Manual
This manual may contain references to HP or Hewlett-Packard. Please note that HewlettPackard's former test and measurement, semiconductor products and chemical analysis
businesses are now part of Agilent Technologies. We have made no changes to this
manual copy. The HP XXXX referred to in this document is now the Agilent XXXX.
For example, model number HP8648A is now model number Agilent 8648A.
About this Manual
We’ve added this manual to the Agilent website in an effort to help you support your
product. This manual provides the best information we could find. It may be incomplete
or contain dated information, and the scan quality may not be idea l. If we find a better
copy in the future, we will add it to the Agilent website.
Support for Your Product
Agilent no longer sells or supports this product. You will find any other available
product information on the Agilent Test & Measurement website:
www.tm.agilent.com
Search for the model number of this product, and the resulting product page will guide
you to any available information. Our service centers may be able to perform calibration
if no repair parts are needed, but no other support from Agilent is available.
Page 2

Programmer’s Guide
HP 8590 E-Series and L-Series
Spectrum
Analyzers
HP 8591C Cable
and
TV Analyzer
HEWLETT
Did
HP Part No. 08590-90235 Supersedes: 5962-5023
Printed in USA June 1995
PACKARD
Page 3

Notice.
The information contained in this document is subject to change without notice.
Hewlett-Packard makes no warranty of any kind with regard to this material, including
but not limited to, the implied warranties of merchantability and fitness for a particular
purpose. Hewlett-Packard shall not be liable for errors contained herein or for incidental or
consequential damages in connection with the furnishing, performance, or use of this material.
@
Copyright Hewlett-Packard Company 1992, 1993, 1994, 1995
All Rights Reserved. Reproduction, adaptation, or translation without prior written permission
is prohibited, except as allowed under the copyright laws.
1400 Fountaingrove Parkway, Santa Rosa CA, 95403-1799, USA
Page 4

Certification
Hewlett-Packard Company certifies that this product met its published specifications at the
time of shipment from the factory. Hewlett-Packard further certifies that its calibration
measurements are traceable to the United States National Institute of Standards and
Technology, to the extent allowed by the Institute’s calibration facility, and to the calibration
facilities of other International Standards Organization members.
Regulatory Information
The Calibration Guide shipped with your instrument contains the regulatory information.
Warranty
This Hewlett-Packard instrument product is warranted against defects in material and
workmanship for a period of one year from date of shipment. During the warranty period,
Hewlett-Packard Company will, at its option, either repair or replace products which prove to
be defective.
For warranty service or repair, this product must be returned to a service facility designated by
Hewlett-Packard. Buyer shall prepay shipping charges to Hewlett-Packard and Hewlett-Packard
shall pay shipping charges to return the product to Buyer. However, Buyer shall pay all
shipping charges, duties, and taxes for products returned to Hewlett-Packard from another
country.
Hewlett-Packard warrants that its software and firmware designated by Hewlett-Packard for
use with an instrument will execute its programming instructions when properly installed on
that instrument. Hewlett-Packard does not warrant that the operation of the instrument, or
software, or firmware will be uninterrupted or error-free.
LIMITATION OF WARRANTY
The foregoing warranty shall not apply to defects resulting from improper or inadequate
maintenance by Buyer, Buyer-supplied software or interfacing, unauthorized modification or
misuse, operation outside of the environmental specifications for the product, or improper
site preparation or maintenance.
NO OTHER WARRANTY IS EXPRESSED OR IMPLIED. HEWLETT-PACKARD SPECIFICALLY
DISCLAIMS THE IMPLIED WARRANTIES OF MERCHANTABILITY AND FITNESS FOR A
PARTICULAR PURPOSE.
EXCLUSIVE REMEDIES
THE REMEDIES PROVIDED HEREIN ARE BUYER’S SOLE AND EXCLUSIVE REMEDIES.
HEWLETT-PACKARD SHALL NOT BE LIABLE FOR ANY DIRECT, INDIRECT, SPECIAL,
INCIDENTAL, OR CONSEQUENTIAL DAMAGES, WHETHER BASED ON CONTRACT, TORT,
OR ANY OTHER LEGAL THEORY.
. . .
III
Page 5

Assistance
Product maintenance agreements and other customer assistance
Hewlett-Rzckard products.
Service
Office.
For
any assistance, contact your nearest Hewlett-Rzckard Sales and
agreements
are available for
Safety Notes
The following safety notes are used throughout this manual. Familiarize yourself with each of
the notes and its meaning before operating this instrument.
Caution
Warning
Instruction
Manual
Caution denotes a hazard. It calls attention to a procedure that, if not
correctly performed or adhered to, would result in damage to or destruction
of the instrument. Do not proceed beyond a caution sign until the indicated
conditions are fully understood and met.
Warning denotes a hazard. It calls attention to a procedure which, if not
correctly performed or adhered to, could result in injury or loss of life.
Do not proceed beyond a warning note until the indicated conditions are
fully understood and met.
The instruction documentation symbol. The product is marked with this
symbol when it is necessary for the user to refer to the instruction in the
manual.
iv
Page 6

General Safety Considerations
Caution
Warning
Warning
Warning
Warning
Before switching on this instrument, make sure that the line voltage selector
switch is set to the voltage of the power supply and the correct fuse is
installed.
This is a Safety Class I product (provided with a protective earthing
ground incorporated in the power cord). The mains plug shall only be
inserted in a socket outlet provided with a protective earth contact. Any
interruption of the protective conductor, inside or outside the instrument,
is likely to make the instrument dangerous. Intentional interruption is
prohibited.
The opening of covers or removal of parts is likely to expose dangerous
voltages. Disconnect the instrument from all voltage sources while it is
being opened.
The power cord is connected to internal capacitors that may remain live
for 10 seconds after disconnecting the plug from its power supply.
These servicing instructions are for use by qualified personnel only.
To
avoid electrical shock, do not perform any servicing unless you are
qualified to do so.
V
Page 7

How to Use This Guide
This guide uses the following conventions:
Front-Panel
Sof
Key] This represents a key physically located on the instrument.
tkq”
This indicates a “softkey,” a key whose label is determined by the instrument’s
firmware.
Screen Text This indicates text displayed on the instrument’s screen.
vi
Page 8

HP 8590 D-Series and E-Series Spectrum Analyzer Documentation Description
In addition to the programmer’s guide, the following guides are shipped with your spectrum
analyzer:
The Calibration Guide for your Spectrum Analyzer
w
Tells you how to test your spectrum analyzer to determine if the spectrum analyzer meets
its specifications.
HP 8590 E-Series and
n
Tells you how to make measurements with your spectrum analyzer.
n
Describes the spectrum analyzer features.
n
Tells you what to do in case of a failure.
HP 8590 E-Series and L.-Series Spectrum Analyzer Quick
w
Describes how to make a simple measurement with your spectrum analyzer.
n
Briefly describes the spectrum analyzer functions.
w
Lists all the programming commands.
L-Series
Spectrum Analyzer User’s Guide
Reference
Guide
HP 8591C Cable TV Analyzer Documentation Description
In addition to the programmer’s guide, the following guides are shipped with your cable TV
analyzer:
HP 8590 E-Series Spectrum Analyzers and HP 8591 C Cable TV Analyzer Calibration
w
Tells you how to test your spectrum analyzer to determine if the spectrum analyzer meets
its specifications.
HP 8591C Cable TV Analyzer User’s Guides
Cable TV Measurements
w
Tells you how to make cable TV measurements with your analyzer.
w
Describes the cable TV analyzer mode features.
Guide
Spectrum Analyzer
w
Tells you how to make measurements using the spectrum analyzer mode.
w
Describes the spectrum analyzer mode features.
n
Tells you what to do in case of a failure.
HP 8591C Cable TV Analyzer Getting Started and Quick
w
Describes how to make a simple measurement with your spectrum analyzer.
w
Briefly describes the cable TV and spectrum analyzer functions.
w
Provides a quick reference for cable TV and spectrum analyzer softkeys.
Reference
Reference
Guide
vii
Page 9

Contents
1. Preparing for Use
What You’ll Learn in This Chapter
Connecting Your Spectrum Analyzer to a Computer
Configuring Your Computer System
Connecting the Computer to the Spectrum Analyzer
For
the
HP-IB Interface
For the RS-232 Interface
The Test Program
HP-IB Connections for the HP 9000 Series 200 Technical Computers
Equipment
Interconnection Instructions
Test Program
HP-IB Connections for the HP 9000 Series 300 Technical Computers
Equipment
Interconnection Instructions
Test Program
HP-IB Connections for the HP Vectra Personal Computer
Equipment
Interconnection Instructions
Test Program
RS-232 Connections for the HP Vectra or IBM PC/AT Personal Computer
Equipment
Interconnection Instructions
Test Program
Printing or Plotting .............................
Printing Using an HP-IB Interface
Equipment
Interconnection and Printing Instructions
Plotting Using an HP-IB Interface
Equipment
Interconnection and Plotting Instructions
Printing Using an RS-232 Interface
Equipment
Interconnection and Printing Instructions
Plotting Using an RS-232 Interface
Equipment
Interconnection and Plotting Instructions
Printing after Plotting or Plotting after Printing
Printing Using a Parallel Interface
Equipment
Interconnection and Printing Instructions
Plotting to an HP LaserJet Printer
Equipment
Interconnection and Plotting Instructions
Printing after Plotting or Plotting after Printing
If There Is a Problem ............................
................................
................................
................................
................................
.............................
...............................
...............................
...............................
...............................
...............................
...............................
...............................
...............................
...............................
...............................
......................
.............
.....................
.............
.........................
.........................
.......
........................
.......
........................
............
........................
........................
......................
..................
......................
..................
.....................
..................
.....................
..................
...............
.....................
..................
.....................
..................
...............
....
l-l
l-l
l-l
l-2
l-2
l-2
l-2
l-3
l-3
l-3
l-4
1-5
1-5
1-5
l-6
l-7
l-7
l-7
1-8
l-9
l-9
l-9
l-10
l-11
l-11
l-11
l-11
1-14
1-14
1-14
1-16
1-16
1-16
1-18
1-18
1-18
1-19
l-20
l-20
l-20
l-22
l-22
l-22
l-23
l-24
Contents-l
Page 10

2. Writing a Program
What You’ll Learn in This Chapter
Writing Your First Program
Composing the Program
..........................
..........................
Program Example for the HP-IB Interface
Program Example for the RS-232 Interface
Modifying the Program
............................
Program Example for the HP-IB Interface
Program Example for the RS-232 Interface
Enhancing the Program with Variables
Program Example for the HP-IB Interface
Program Example for the RS-232 Interface
Getting Information from the Spectrum Analyzer
Program Example for the HP-IB Interface
Program Example for the RS-232 Interface
Programming Guidelines
3. Programming Topics
...........................
What You’ll Learn in This Chapter
Controlling Trace Data with a Computer
Reading Trace Data
............................
......................
..................
.................
..................
.................
....................
..................
.................
...............
..................
.................
......................
...................
Program Example for the HP-IB Interface..................
Program Example for the RS-232 Interface .................
Saving Trace Data
..............................
Program Example for the RS-232 Interface .................
Reading Trace Data from a Computer Disk
..................
Program Example for the HP-IB Interface..................
Program Example for the RS-232 Interface .................
Saving and Recalling Instrument States
....................
Saving the Spectrum Analyzer’s State....................
Program Example for the HP-IB Interface..................
Program Example for the RS-232 Interface .................
Returning the Spectrum Analyzer to its Former State .............
Program Example for the HP-IB Interface..................
Program Example for the RS-232 Interface .................
Measuring Harmonic Distortion
........................
Program Example for the HP-IB Interface..................
Program
Different Formats for Trace Data Transfers
P Formatt
Example of Using the P Format
Example
for the RS-232
Interface
.................
..................
.................................
......................
B Format .................................
Example of Using the B Format
A-Block Format
..............................
Example of Using the A-Block Format
I-Block Format
...............................
Example of Using the I-Block Format
M Formatt
.................................
Example of Using the M Format
......................
...................
...................
.....................
2-l
2-2
2-2
2-2
2-3
2-4
2-4
2-5
2-6
2-6
2-7
2-8
2-8
2-9
2-10
3-l
3-2
3-2
3-2
3-3
3-4
3-5
3-6
3-6
3-6
3-7
3-7
3-8
3-10
3-12
3-12
3-13
3-15
3-15
3-18
3-20
3-20
3-21
3-22
3-22
3-24
3-24
3-25
3-25
3-26
3-27
Contents-2
Page 11
4.
Creating and Using Downloadable Programs
What You’ll Learn in This Chapter . . . . . . . . . . . . . . . . . . . . . .
WhatisaDLP?
WhyUseaDLP?.
. . . . . . . . . . . . . . . . . . . . . . . . . . . . . .
. . . . . . . . . . . . . . . . . . . . . . . . . . . . .
Creating a DLP . . . . . . . . . . . . . . . . . . . . . . . . . . . . . . .
‘Ib
Use a User-Defined Function within a DLP . . . . . . . . . . . . . . . .
Example . . . . . . . . . . . . . . . . . . . . . . . . . . . . . . . .
To Use a User-Defined Variable within a DLP . . . . . . . . . . . . . . . .
Example . . . . . . . . . . . . . . . . . . . . . . . . . . . . . . . .
To Use a User-Defined Trace within a DLP . . . . . . . . . . . . . . . . . .
Example
To Enter
Values’into a*DLP 1 : 1 1 1 1 1 1 1 : 1 1 1 1 1 1 1 :
. . . . . . .
. . . . . . .
Example . . . . . . . . . . . . . . . . . . . . . . . . . . . . . . . .
To
Enter Values into a DLP by Using a Softkey
. . . . . . . . . . . . . . .
Example . . . . . . . . . . . . . . . . . . . . . . . . . . . . . . . .
To Create a Modular DLP . . . . . . . . . . . . . . . . . . . . . . . . . .
Example . . . . . . . . . . . . . . . . . . . . . . . . . . . . . . . .
Executing a DLP . . . . . . . . . . . . . . . . . . . . . . . . . . . . . . .
To Execute a DLP by Using a Softkey . . . . . . . . . . . . . . . . . . . .
Example . . . . . . . . . . . . . . . . . . . . . . . . . . . . . . . .
To Execute the DLP within a Program . . . . . . . . . . . . . . . . . . .
Example . . . . . . . . . . . . . . . . . . . . . . . . . . . . . . . .
StoringDLPsonaRAMCard
‘IbStoreDLPsonaRAMCard
. . . . . . . . . . . . . . . . . . . . . . . . .
. . . . . . . . . . . . . . . . . . . . . . .
Example . . . . . . . . . . . . . . . . . . . . . . . . . . . . . . . .
To
Load
DLPs
from a Memory Card into Analyzer Memory . . . . . . . . . .
Example . . . . . . . . . . . . . . . . . . . . . . . . . . . . . . . .
Determining the Amount of Memory Needed for a DLP . . . . . . . . . . . .
‘lb Determine Available Analyzer Memory . . . . . . . . . . . . . . . . . .
Example . . . . . . . . . . . . . . . . . . . . . . . . . . . . . . . .
To Determine the Amount of Space on a RAM Card . . . . . . . . . . . . .
Example . . . . . . . . . . . . . . . . . . . . . . . . . . . . . . . .
To Delete a DLP from Spectrum Analyzer Memory . . . . . . . . . . . . . .
Example
To Erase the
DLP’frbm
a
RAM’&rd : : : : : :
. . . . . . . . . . . . . . .
. . . . . . . . . . . . . . .
Example . . . . . . . . . . . . . . . . . . . . . . . . . . . . . . . .
Using the DLP Editor . . . . . . . . . . . . . . . . . . . . . . . . . . . .
To Connect the External Keyboard to the Spectrum Analyzer . . . . . . . . .
‘lb Access the DLP Editor . . . . . . . . . . . . . . . . . . . . . . . . . .
‘IbCreateaDLP
. . . . . . . . . . . . . . . . . . . . . . . . . . . . . .
To Modify the DLP . . . . . . . . . . . . . . . . . . . . . . . . . . . . .
To Modify a Catalog Item . . . . . . . . . . . . . . . . . . . . . . . . . .
DLP Programming Guidelines . . . . . . . . . . . . . . . . . . . . . . . . .
To Make the DLP More Readable . . . . . . . . . . . . . . . . . . . . . .
ToFindProblemsinaDLP
. . . . . . . . . . . . . . . . . . . . . . . . .
4-l
4-l
4-l
4-2
4-3
4-3
4-4
4-4
4-5
4-5
4-6
4-6
4-6
4-6
4-7
4-7
4-9
4-9
4-9
4-9
4-9
4-10
4-10
4-10
4-11
4-11
4-12
4-12
4-12
4-12
4-13
4-14
4-14
4-14
4-14
4-15
4-15
4-16
4-17
4-18
4-19
4-20
4-20
4-20
Page 12

5. Programming Commands
What You’ll Learn in This Chapter
Syntax Conventions
ABORT Abort
ABS Absolute
.............................
...............................
...............................
ACP Adjacent Channel Power
ACPBW Channel Bandwidth
......................
........................
........................
ACPCONTM Continuous Sweep Measurement
ACPE Adjacent Channel Power Extended
..................
ACPGR Adjacent Channel Power Graph On or Off
ACPGRAPH Compute the Adjacent Channel Power Graph
ACPMK Adjacent Channel Power Marker On or Off.
ACPPAR ACP Manual or Auto
ACPSNGLM Single Sweep Measurement
ACPSP Channel Spacing
..........................
ACTDEF Active Function Definition
ACTVF Active Function
ADD Add
.................................
..........................
AMB Trace A Minus Trace B
.......................
...................
.....................
........................
AMBPL Trace A Minus Trace B Plus Display Line
AMPCOR Amplitude Correction
AMPLEN
Amplitude Correction Length
ANLGPLUS Analog Plus
ANNOT
Annotation
............................
APB Trace A Plus Trace B
AT Attenuation
AUNITS
Amplitude Units
AUTO Auto Couple
AVG Average
..............................
..........................
.............................
...............................
AXB Exchange Trace A and Trace B
BAUDRATE
BITBit
BITF Bit Flag
BLANK Blank Trace
Baud Rate of Spectrum Analyzer
..................................
...............................
............................
BML Trace B Minus Display Line
BTC Transfer Trace B to Trace C
BXC Trace B Exchange Trace C
CAL Calibration
CAT Catalog
CF Center Frequency
CHP Channel Power
..............................
................................
...........................
............................
CHPGR Channel Power Graph On or Off
CLRAVG Clear Average
CLRBOX Clear Box
CLRDSP Clear Display
CLRW Clear Write
CLS Clear Status Byte
...........................
............................
...........................
.............................
...........................
CMDERRQ Command Error Query
CNF Confidence Test
............................
CNTLA Auxiliary Interface Control Line A
CNTLB Auxiliary Interface Control Line B
CNTLC Auxiliary Interface Control Line C
CNTLD Auxiliary Interface Control Line D
.......................
...................
..........................
.........................
....................
......................
......................
.......................
...................
.....................
.................
..................
..................
.................
CNTLI Auxiliary Interface Control Line Input
COMBComb
................................
................
..............
..........
.............
..............
................
................
5-l
5-2
5-29
5-31
5-33
5-35
5-37
5-38
5-40
5-42
5-43
5-44
5-46
5-47
5-49
5-54
5-55
5-57
5-60
5-62
5-64
5-65
5-67
5-68
5-69
5-71
5-72
5-73
5-75
5-76
5-78
5-80
5-82
5-83
5-84
5-85
5-86
5-89
5-93
5-95
5-97
5-98
5-99
5-101
5-102
5-103
5-104
5-105
5-106
5-107
5-108
5-109
5-110
5-111
Contents-4
Page 13
COMPRESS Compress Trace
CONCAT
Concatenate
...........................
CONTS Continuous Sweep
CORREK Correction Factors On
COUPLE Couple
..............................
CRTHPOS Horizontal Position of CRT Display
CRTVPOS Vertical Position of CRT Display
CTA Convert to Absolute Units
CTM Convert to Measurement Units
DA Display Address
DATEMODE
Date Mode
DEMOD Demodulation
DET Detection Mode
DISPOSE Dispose
DIV Divide
................................
DL Display Line
DN Down
DONE Done
DOTDENS
DRAWBOX
DSPLY Display
.................................
................................
Dot Density
Draw Box
...............................
DT Define Terminator
EE Enable Entry
EK Enable Knob
............................
...........................
............................
.............................
..............................
...........................
...........................
...........................
.............................
..............................
ENTER Enter From HP-IB
EP Enter Parameter Function
ERASE Erase
EXP Exponent.
FA Start Frequency
FB Stop Frequency
...............................
..............................
............................
............................
FFT Fast Fourier Transform
FFTAUTO Marker to Auto FFT
FFTCLIP FFl’
Signal Clipped
FFTCONTS FFT Continuous Sweep
FFTMKR
FFT Markers
...........................
FFTMM FFT Marker to Midscreen
FFTMS
FFTOFFFFTOff
FFTPCTAM
FFTPCTAMR FFT
FFT Marker to
..............................
FFT
Percent Amplitude Modulation
Percent Amplitude Modulation Readout
FFT
FFTSNGLS FFT Single Sweep
FFTSTAT FFT Status
FFTSTOP FFT
Stop Frequency
FMGAIN FM Gain
............................
.............................
FOFFSET Frequency Offset
FORMAT Format Card
FS Full Span.
...............................
...........................
FUNCDEF Define Function
GATEGate
GATECTL Gate Control
GC Gate Preset
GD Gate Delay.
................................
...........................
..............................
..............................
GDRVCLPAR Clear Pulse Parameters
GDRVGDEL Gate Delay for the Frequency Window
........................
.........................
.......................
................
..................
.......................
....................
..........................
.........................
.......................
........................
.......................
........................
.....................
......................
Stop Frequency
.................
...............
..........
........................
.......................
.........................
.........................
....................
.............
GDRVGLEN Gate Length for the Frequency and Time Windows
.......
5-112
5-114
5-116
5-117
5-118
5-119
5-120
5-121
5-123
5-124
5-127
5-128
5-129
5-131
5-133
5-135
5-137
5-138
5-140
5-141
5-143
5-145
5-146
5-148
5-149
5-151
5-152
5-153
5-156
5-158
5-160
5-164
5-166
5-167
5-168
5-169
5-170
5-171
5-172
5-173
5-174
5-176
5-177
5-179
5-180
5-182
5-183
5-184
5-186
5-187
5-188
5-189
5-190
5-191
5-193
Contents-5
Page 14

GDRVGT Window Gate Control
.......................
GDRVGTIM Gate Trigger to Marker Position for the Time Window
GDRVPRI Pulse Repetition Interval
GDRVPWID Pulse Width
..........................
GDRVRBW Couple Resolution Bandwidth to Pulse Width
GDRVREFE Enter Reference Edge
GDRVST Couple Sweep Time to Pulse Repetition Interval
GDRVSWAP Update the Time or Frequency Window
GDRVSWDE Delay Sweep for Time Window
GDRVSWP Sweep Time for the Time Window
GDRVUTIL Gate Utility
..........................
GDRVVBW Couple Video Bandwidth to Gate Length
GETPLOT
Get Plot
GETPRNT Get Print
GL Gate Length
GP Gate Polarity
GRGraph
.................................
GRAT Graticule
HAVE Have
HD Hold Data Entry
HN Harmonic Number
.............................
............................
..............................
..............................
..............................
................................
............................
...........................
HNLOCK Harmonic Number Lock
HNUNLK Unlock Harmonic Number
IBInputB.
ID Identify
IF THEN ELSE
INT Integer
INZ Input Impedance
IP Instrument Preset
KEYCLR Key Clear.
KEYCMD Key Command
................................
................................
ENDIF
If Then Else Endif
................................
...........................
............................
............................
..........................
KEYDEF User-Defined Key Definition
KEYENH Key Enhance.
KEYEXC Key Execute
KEYLBL Key Label
LBLabel
.................................
..........................
...........................
............................
LF Base Band Instrument Preset
LG Logarithmic Scale
LIMIDEL Delete Limit-Line
...........................
‘lhble
LIMIDISP Limit Line Display
LIMIFAIL Limits Failed
...........................
LIMIFT Select Frequency or Time Limit Line
LIMIHI Upper Limit
LIMILINE Limit Lines
LIMILO Lower Limit
............................
...........................
............................
LIMIMIRROR Mirror Limit Line
LIMIMODE Limit-Line Entry Mode
LIMIREL Relative Limit Lines
LIMISEG Enter Limit-Line Segment for Frequency
LIMISEGT Enter Limit-Line Segment for Sweep Time
LIMITEST Enable Limit Line Testing
LINFILL Line Fill
LN Linear Scale
LOAD Load
................................
LOG Logarithm
.............................
..............................
..............................
.....................
...........
.....................
..........
.............
.................
................
.............
......................
....................
..................
....................
......................
......................
.........................
................
.......................
.....................
.......................
..............
............
....................
......
5-194
5-196
5-198
5-200
5-202
5-204
5-206
5-208
5-209
5-211
5-213
5-215
5-217
5-219
5-221
5-222
5-223
5-224
5-225
5-228
5-229
5-230
5-233
5-234
5-235
5-236
5-239
5-241
5-242
5-246
5-247
5-251
5-255
5-260
5-261
5-263
5-267
5-268
5-269
5-270
5-272
5-274
5-275
5-276
5-279
5-280
5-281
5-283
5-285
5-288
5-291
5-293
5-295
5-296
5-298
Contents.6
Page 15

LSPAN Last Span
MDS Measurement Data Size
MDU Measurement Data Units
MEAN Trace Mean
MEANTH Trace Mean Above Threshold
MEASOFF Measurement Off
MEASURE Measure Mode
MEM Memory Available
MENU Menu
MERGE Merge Two Traces
MF Marker Frequency Output
MIN Minimum
MINH Minimum Hold
MINPOS Minimum Position
MIRROR Mirror Image
MKA Marker Amplitude
MKACT Activate Marker
MKACTV Marker As the Active Function
MKBW Marker Bandwidth
MKCF Marker to Center Frequency
MKCONT Marker Continue
MKD Marker Delta.
MKDLMODE Marker Delta Display Line Mode
MKF Marker Frequency
MKFC Marker Counter
MKFCR Marker Counter Resolution
MKMIN Marker Minimum
MKN Marker Normal
MKNOISE Marker Noise
MKOFF Marker Off
MKP Marker Position
MKPAUSE Marker Pause
MKPK Marker Peak
MKPX Marker Peak Excursion
MKREAD Marker Readout
MKRL Marker to Reference Level
MKSP Marker to Span
MKSS Marker to Step Size
MKSTOP Marker Stop
MKTBL Marker %ble
MKTRACE Marker Trace
MKTRACK Marker Track
MKTYPE Marker Type
ML Mixer Level
MOD Modulo
MODE Mode
MOV Move
................................
................................
MPY Multiply
MS1
Mass Storage Is
MXM Maximum
MXMH Maximum Hold
M4 Marker Zoom.
NDB Number of
.............................
........................
.......................
.............................
...................
........................
.........................
..........................
...............................
.........................
.......................
...............................
............................
.........................
...........................
..........................
..........................
..................
.........................
.....................
.........................
............................
................
..........................
...........................
.....................
..........................
............................
..........................
............................
............................
..........................
............................
.......................
.........................
......................
...........................
.........................
...........................
...........................
..........................
..........................
...........................
..............................
...............................
...............................
............................
..............................
...........................
.............................
............................
dB
NDBPNT N dB Points
NDBPNTR N dB Points Bandwidth’ : : : 1 : : : : : : : : : : : : : : : :
:
5-301
5-302
5-304
5-306
5-307
5-309
5-310
5-312
5-313
5-315
5-317
5-319
5-32 1
5-322
5-323
5-325
5-327
5-328
5-329
5-330
5-331
5-332
5-334
5-336
5-338
5-339
5-341
5-342
5-344
5-346
5-347
5-349
5-351
5-352
5-354
5-356
5-357
5-358
5-359
5-360
5-362
5-363
5-364
5-365
5-367
5-369
5-370
5-372
5-374
5-375
5-377
5-378
5-380
5-381
5-383
Contents-7
Page 16

NRL Normalized Reference Level
OA Output Active Function Value
OBW Occupied Bandwidth
.........................
OBWPCT Occupied Bandwidth Percent
OL Output Learn String
ONCYCLE
ONDELAY
On Cycle
On Delay
ONEOS On End of Sweep
ONMKR On Marker
..........................
............................
............................
.........................
............................
ONMKRU On Marker Update
ONPWRUP On Power Up
..........................
ONSRQ On Service Request
ONSWP On Sweep
ONTIME
On Time
OP Output Parameter
.............................
.............................
...........................
......................
......................
...................
........................
.........................
OUTPUT Output to Remote Port or Parallel Port
PA Plot Absolute
PARSTAT
Parallel Status
PCTAM Percent AM
PCTAMR Percent AM Response
PDPenDown..
PDA Probability Distribution of Amplitude
PDF Probability Distribution of Frequency
PEAKS Peaks
PKDLMODE Peak
PKPOS Peak Position
PKRES Peak Result
PKSORT Peak Sort
PKTBL Peak
‘Iable
PKZMOK Peak Zoom Okay
PKZOOM Peak Zoom
PLOT Plot
.................................
PLTPRT Plot Port
POWERON
Power-On State
PP Preselector Peak
PR Plot Relative
PREAMPG External Preamplifier Gain
PREFX Prefix
PRINT Print
PRNTADRS Print Address
PRNPRT Print Port
PSTATE Protect State
PUPenUp
PURGE Purge File
PWRBW Power Bandwidth
PWRUPTIME Power Up Time
RB Resolution Bandwidth
RCLS Recall State
RCLT Recall Trace
RELHPIB Release HP-IB
REPEAT UNTIL Repeat Until
RESETRL Reset Reference Level
RETURN Return
REV Revision
RL Reference Level
.............................
..........................
............................
.......................
.............................
.................
.................
...............................
Table
Delta Display Line Mode
............................
............................
.............................
.............................
.........................
............................
.............................
.........................
............................
..............................
...................
...............................
................................
.........................
.............................
...........................
................................
.............................
.........................
........................
.........................
.............................
.............................
..........................
........................
......................
..............................
...............................
............................
...............
..............
5-384
5-386
5-387
5-389
5-390
5-391
5-393
5-395
5-397
5-399
5-401
5-402
5-404
5-406
5-408
5-409
5-412
5-414
5-416
5-418
5-419
5-420
5-422
5-424
5-428
5-430
5-43 1
5-433
5-434
5-436
5-437
5-439
5-441
5-442
5-443
5-444
5-445
5-446
5-447
5-449
5-450
5-451
5-452
5-453
5-454
5-456
5-457
5-459
5-460
5-462
5-463
5-465
5-466
5-467
5-468
Contents.8
Page 17

RLPOS Reference-Level Position
RMS Root Mean Square Value
ROFFSET Reference Level Offset
RQS Service Request Mask
SAVEMENU
SAVES Save State
SAVET Save Trace
Save Menu
.............................
.............................
.........................
..........................
SAVRCLF Save or Recall Flag
SAVRCLN Save or Recall Number
SAVRCLW Save or Recall Data
SEGDEL Segment Delete
..........................
SENTER Segment Entry for Frequency Limit Lines
SENTERT Segment Entry for Sweep Time Limit Lines
SER Serial Number
SETDATE
SETTIME
Set Date
Set Time
SMOOTH Smooth Trace
SNGLS Single Sweep
............................
.............................
.............................
..........................
............................
......................
........................
......................
........................
......................
.......................
.............
............
SPSpan ..................................
SPEAKER Speaker
SPZOOM Span Zoom
SQLCH Squelch
SQR Square Root.
SRCALC Source Leveling Control
SRCAT Source Attenuator
SRCNORM Source Normalization
SRCPOFS Source Power Offset
SRCPSTP Source Power-Level Step Size
SRCPSWP Source Power Sweep
SRCPWR Source Power
SRCTK Source Tracking
SRCTKPK Source Tracking Peak
SRQ Force Service Request
SS Center Frequency Step Size
ST Sweep Time
STB Status Byte Query
STDEV Standard Deviation of Trace Amplitudes
STOR Store
................................
SUB Subtract
SUM Sum of Trace Amplitudes
SUMSQR Sum of Squared Trace Amplitudes
SWPCPL Sweep Couple
SYNCMODE
Synchronize Mode
TA Transfer A
TB Transfer B
TDF Trace Data Format
TEXT Text
TH Threshold
TIMEDATE
Time Date
TIMEDSP Time Display
TITLE Title
................................
TM Trigger Mode
TO1 Third-Order Intermodulation Measurement
TOIR Third-Order Intermodulation Response
TRA/TRB/TRC
.............................
............................
..............................
.............................
......................
.........................
......................
..............
........
:
...................
.......................
...........................
..........................
......................
.........................
.......................
..............................
...........................
...............
...............................
.......................
.................
..........................
.......................
...............................
...............................
..........................
...............................
...............................
...........................
...........................
.............................
...............
.................
Trace Data Input and Output
.................
5-470
5-471
5-472
5-473
5-475
5-476
5-477
5-479
5-480
5-482
5-483
5-485
5-488
5-491
5-492
5-493
5-494
5-496
5-497
5-499
5-500
5-501
5-502
5-504
5-506
5-508
5-510
5-511
5-513
5-515
5-517
5-519
5-520
5-524
5-526
5-528
5-529
5-531
5-534
5-536
5-537
5-538
5-540
5-542
5-543
5-544
5-549
5-550
5-551
5-552
5-553
5-554
5-556
5-558
5-559
Contents-9
Page 18

Figures
l-l. Connecting the HP 9000 Series 200 Computer to the Spectrum Analyzer
l-2. Connecting the HP 9000 Series 300 Computer to the Spectrum Analyzer
l-3. Connecting the HP Vectra Personal Computer to the Spectrum Analyzer
l-4. Connecting the Personal Computer to the Spectrum Analyzer
3-l. Measurement Unit Range and Trace Amplitudes
4-l. Determining
4-2. Connecting the External Keyboard to the Spectrum Analyzer
4-3. Accessing the DLP Editor
4-4. Entering a DLP
4-5. Selecting a Catalog Item
5-l. Command Syntax Figure
5-2. Using the CLRBOX Command
5-3. Using the
5-4. Harming Filter Window
5-5. Uniform Filter Window
5-6. Flat
5-7. Using the MENU Command
5-8. Display Units
5-9. Frequency and Amplitude of the Peaks
B-l. HP-IB Connector ..............................
C-l. RS-232 Connector
C-2. HP 245426 25-pin to
C-3. HP 24542U
C-4. 25-pin to
C-5.
C-6. 25-pin to
C-7. HP
C-8. 25-pin to
C-9. HP-GL Plotter Connection
Top
g-pin
to
C2932A g-pin
the
Number of Records
..............................
DRAWBOX
Filter Window
g-pin
g-pin
g-pin
3-Wire Connection
g-pin
g-pin
Command
...............................
.............................
to
3-Wire Connection
ThinkJet Printer Connection
to
g-pin
Modem Connection
.........................
..........................
..........................
........................
.......................
..........................
..........................
...........................
.........................
g-pin
Full Handshaking Connection
g-pin
Full Handshaking Connection
LaserJet Printer Connection
.........................
....................
...................
.....................
......................
.....................
...............
.................
.........
.........
...........
...........
............
...
...
...
l-3
l-5
l-7
l-9
3-26
4-13
4-15
4-16
4-17
4-19
5-2
5-99
5-141
5-162
5-163
5-163
5-314
5-413
5-426
B-l
C-l
c-3
c-3
c-3
c-4
c-4
c-5
C-6
C-6
Contents-l 1
Page 19

Xhbles
l-l. Setting of HP
3-l. Measurement Units
3-2. Summary of the Trace Data Formats
4-l. Cataloging a RAM Card
5-l. Syntax Elements
5-2. Characters and Secondary Keywords (Reserved Words)
5-3. Summary of Compatible Commands
5-4. Functional Index
5-5. Spectrum,AnaIyzer Settings, ACPPAR is Set to Automatic
5-6. Character Set
5-7. Label Functions
5-9. Spectrum Analyzer Status Byte (Option 024)
5-9. Spectrum Analyzer Status Byte (Option 041, 043)
5-9. Spectrum Analyzer Status Byte
5-10. Status Byte Definition
5-l 1. Programming Commands That Exit The Windows Display Mode
C-l. Setting of
C-2. Setting of RS-232 Switches
C-3. Setting the Baud Rate
ThinkJet
...............................
Thinkjet
Printer Mode Switches
............................
....................
...........................
..............................
.....................
.............................
..............................
.......................
...........................
Printer Mode Switches
.........................
...........................
................
............
...........
.................
..............
........
..................
l-11
3-27
3-28
4-13
5-3
5-5
5-9
5-11
5-45
5-265
5-266
5-414
5-415
5-52 1
5-522
5-595
c-4
c-5
c-5
Contents-l 2
Page 20

1
Preparing for Use
What You’ll Learn in This Chapter
This chapter tells you how to connect a computer to your spectrum analyzer via the
Hewlett-Packard Interface Bus (HP-IB) or the RS-232 Interface and how to connect a printer
or a plotter. The remainder of the chapter covers procedures to follow if a problem is
encountered.
Connecting Your Spectrum Analyzer to a Computer
The spectrum analyzer works with many popular computers. However, the steps required to
connect your spectrum analyzer to a specific computer depend on the computer you are using.
Before turning to the interconnection instructions for your computer, please read the following
general information.
Configuring Your Computer System
Every computer system has a specific configuration. Your system configuration might include
a printer, external disk drive, or plotter. Whenever you add another piece of equipment (for
example, your spectrum analyzer), you may need to reconfigure your computer system so that
the computer knows where and how to send information to the newly added device.
Some computers do not require configuring when a spectrum analyzer is connected; others
require a simple modification. The most common modification is changing the configuration
information stored on the computer’s operating system disk. A few computers require the
insertion of an add-on board, or “card.” Refer to your computer documentation if your system
needs these modifications.
All of the test programs for HP-IB and RS-232 interfaces are written using
of the computer under consideration. If you have never entered or run a BASIC program, refer
to your computer documentation.
the
BASIC language
Preparing for Use
l-1
Page 21

Connecting the Computer to the Spectrum Analyzer
For the HP-IB Interface
Refer to Appendix B for a detailed description of the HP-IB interface.
Appendix B contains instructions for connecting the spectrum analyzer’s HP-IB interface to
either an HP 9000 Series 200, or a Series 300 computer, or to an HP Vectra PC equipped with
an HP 82300B BASIC Language Processor. If your computer is not listed, but it supports an
HP-IB interface, there is a good possibility that it can be connected to the spectrum analyzer.
Consult your computer documentation to determine how to connect external devices on the
bus.
For the BS-232 Interface
Refer to Appendix C for a detailed description of the RS-232 interface.
Appendix C contains instructions for connecting the spectrum analyzer’s RS-232 interface to
an HP Vectra PC or IBM PC/AT or compatible computers. If your computer is not listed, but it
supports a standard RS-232 interface, there is a good possibility that the spectrum analyzer may
be connected to the computer. Consult your computer documentation to determine how to
connect external devices to your computer’s RS-232 connector.
There are two types of RS-232 devices: data terminal equipment (DTE) and data
communication equipment (DCE). Types of DTE devices include display terminals. DCE
equipment includes modems and, generally, other computer RS-232 devices. The spectrum
analyzer RS-232 port is the DTE-type. Connections from the computer (DCE) to the spectrum
analyzer (DTE) are shown in Appendix C.
The
Test
Program
To test the system configuration, a simple test program is provided for each computer listed.
After you have connected your computer and spectrum analyzer, you should enter and run
the test program on your computer to make sure the computer is sending instructions to the
spectrum analyzer through the interface cable. If the interface is working and the program is
entered correctly, a statement is displayed on the computer screen.
Note
Note
Pressing
control.
f-1
The listed computer and spectrum analyzer equipment includes the minimum
components necessary to establish communication between your spectrum
analyzer and computer. If you are using application software, check with your
software supplier for specific computer hardware and memory requirements.
Using an interface cable other than the one listed with your computer’s
interconnection instructions may prevent proper communication between the
spectrum analyzer and computer.
removes the spectrum analyzer from remote mode and enables front-panel
l-2
Preparing for Use
Page 22
HP-IB Connections for the HP 9000 Series 200
Technical
Computers
Equipment
n
HP 9816, 9826, or 9836 Series 200 technical computer
w
HP 8590 Series spectrum analyzer with Option 041
n
HP 10833 (or equivalent) HP-IB cable
Interconnection Instructions
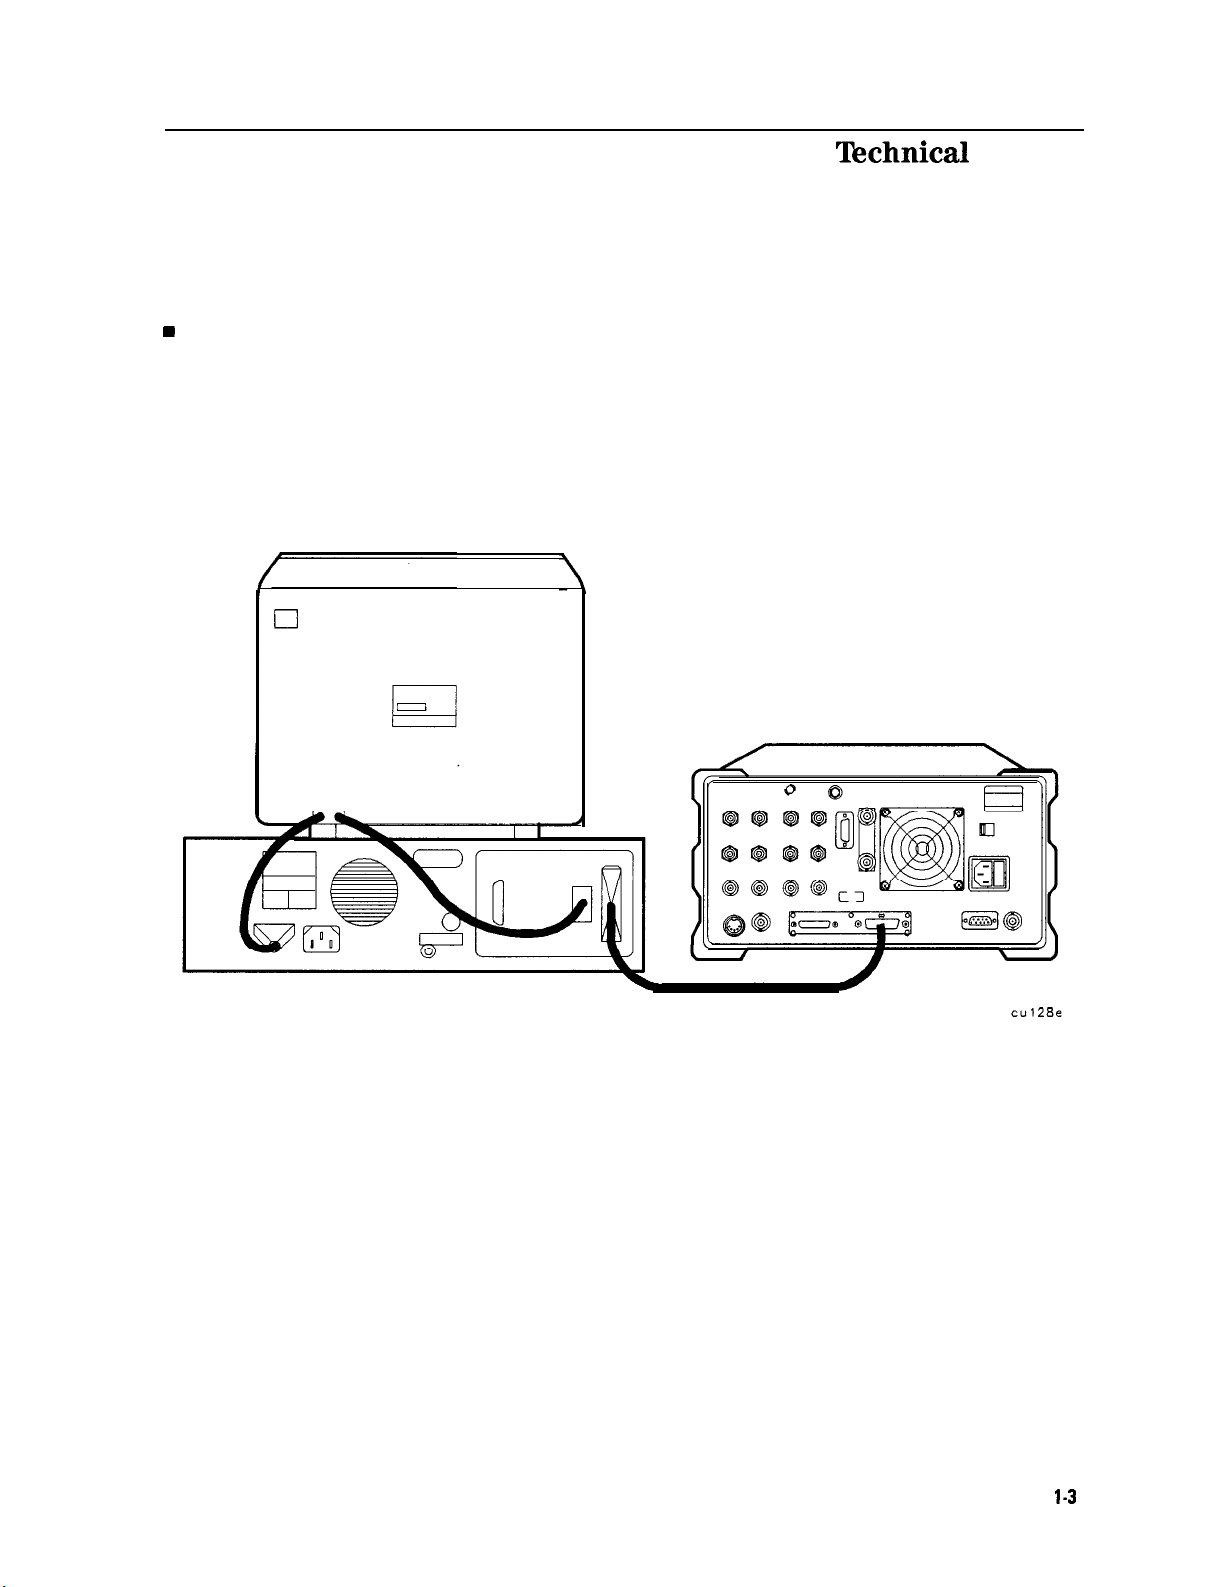
Connect the spectrum analyzer to the computer using the HP-IB cable. Figure l-l shows an
HP 9836 computer connected to the spectrum analyzer.
Figure l-l. Connecting the HP 9000 Series 200 Computer to the Spectrum Analyzer
Preparing for Use
l-3
Page 23
Test
Program
To test the connection between the computer and the spectrum analyzer, turn on your
spectrum analyzer and follow the instructions below.
1. Your HP 9000 Series 200 computer may have either a soft-loaded or built-in language
system. If your language system is built-in, remove any disks from the drives and turn on
the computer.
2. If your language is soft-loaded, install the BASIC language disk into the proper drive. Turn
the computer power on. After a few seconds, the
computer is now ready for use.
For further information on loading BASIC on your system, consult your BASIC manual.
8.
Check the HP-IB address of the spectrum analyzer: press
ANALYZER
the address of the spectrum analyzer: press
18, (Hz) (or enter the appropriate address).
ADDRESS . The usual address for the spectrum analyzer is 18. If necessary, reset
BASIC READY
L-1,
Mare 2 of 3 ,
@ZiZ],
message appears; the
More 1 of 3 ,
A??ALYZElt
ADDRESS ,
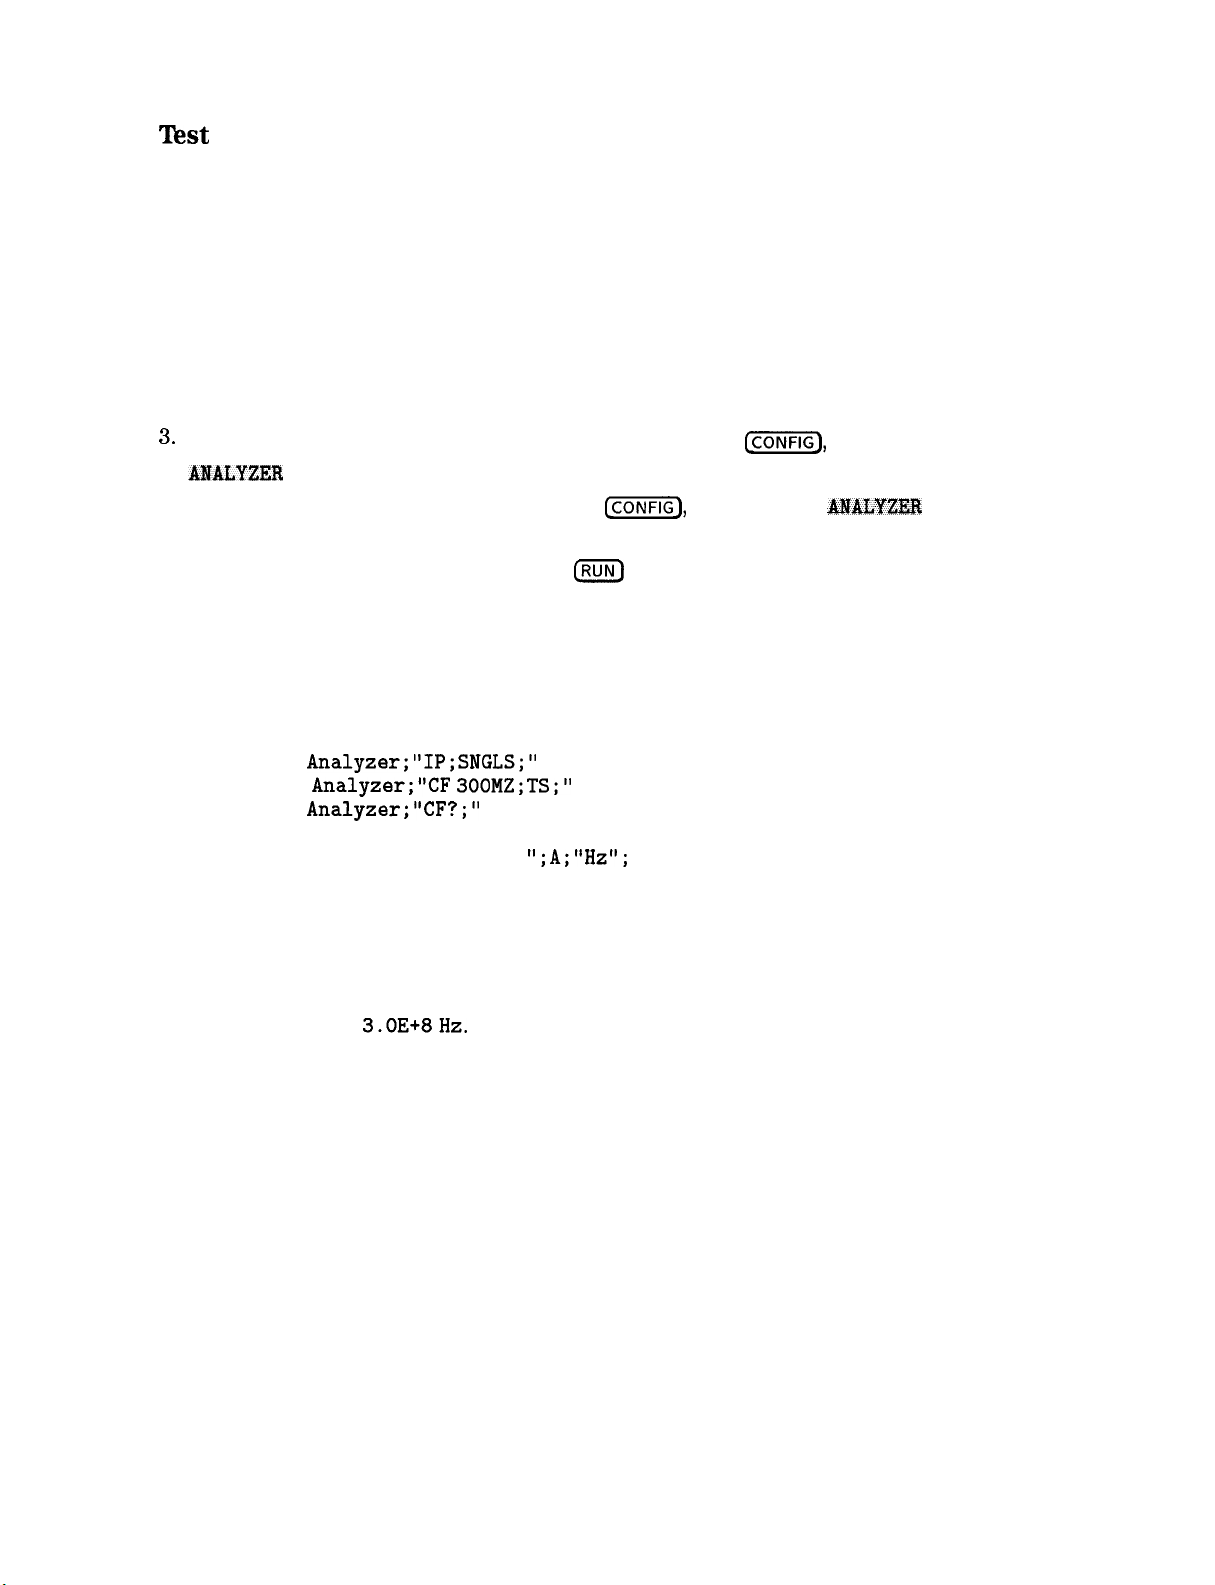
4. Enter the following program, then press
and running the program, refer to your computer and software documentation.
The program shows that the computer is able to send instructions to, and read information
from, the spectrum analyzer.
10 PRINTER IS 1
20 Analyzer=718
30 CLEAR Analyzer
40 OUTPUT
50 OUTPUT
60 OUTPUT
70 ENTER Analyzer;A
80 PRINT "CENTER FREQUENCY =
90 END
The program tells the spectrum analyzer to perform an instrument preset and enter
single-sweep mode. Next, the program sets the center frequency to 300 MHz and takes a
sweep.
The program then queries the center frequency value and tells the computer to display
CENTERFREQUENCY=
If the computer does not display the center frequency, refer to “If There is a Problem” at the
end of this chapter.
Analyzer;"IP;SNGLS;"
Analyzer;"CF 300MZ;TS;"
Analyzer;"CF?;"
3.OE+8Hz.
IRUN)
on the computer. If you need help entering
";A;"Hz";
1-4 Preparing for Use
Page 24
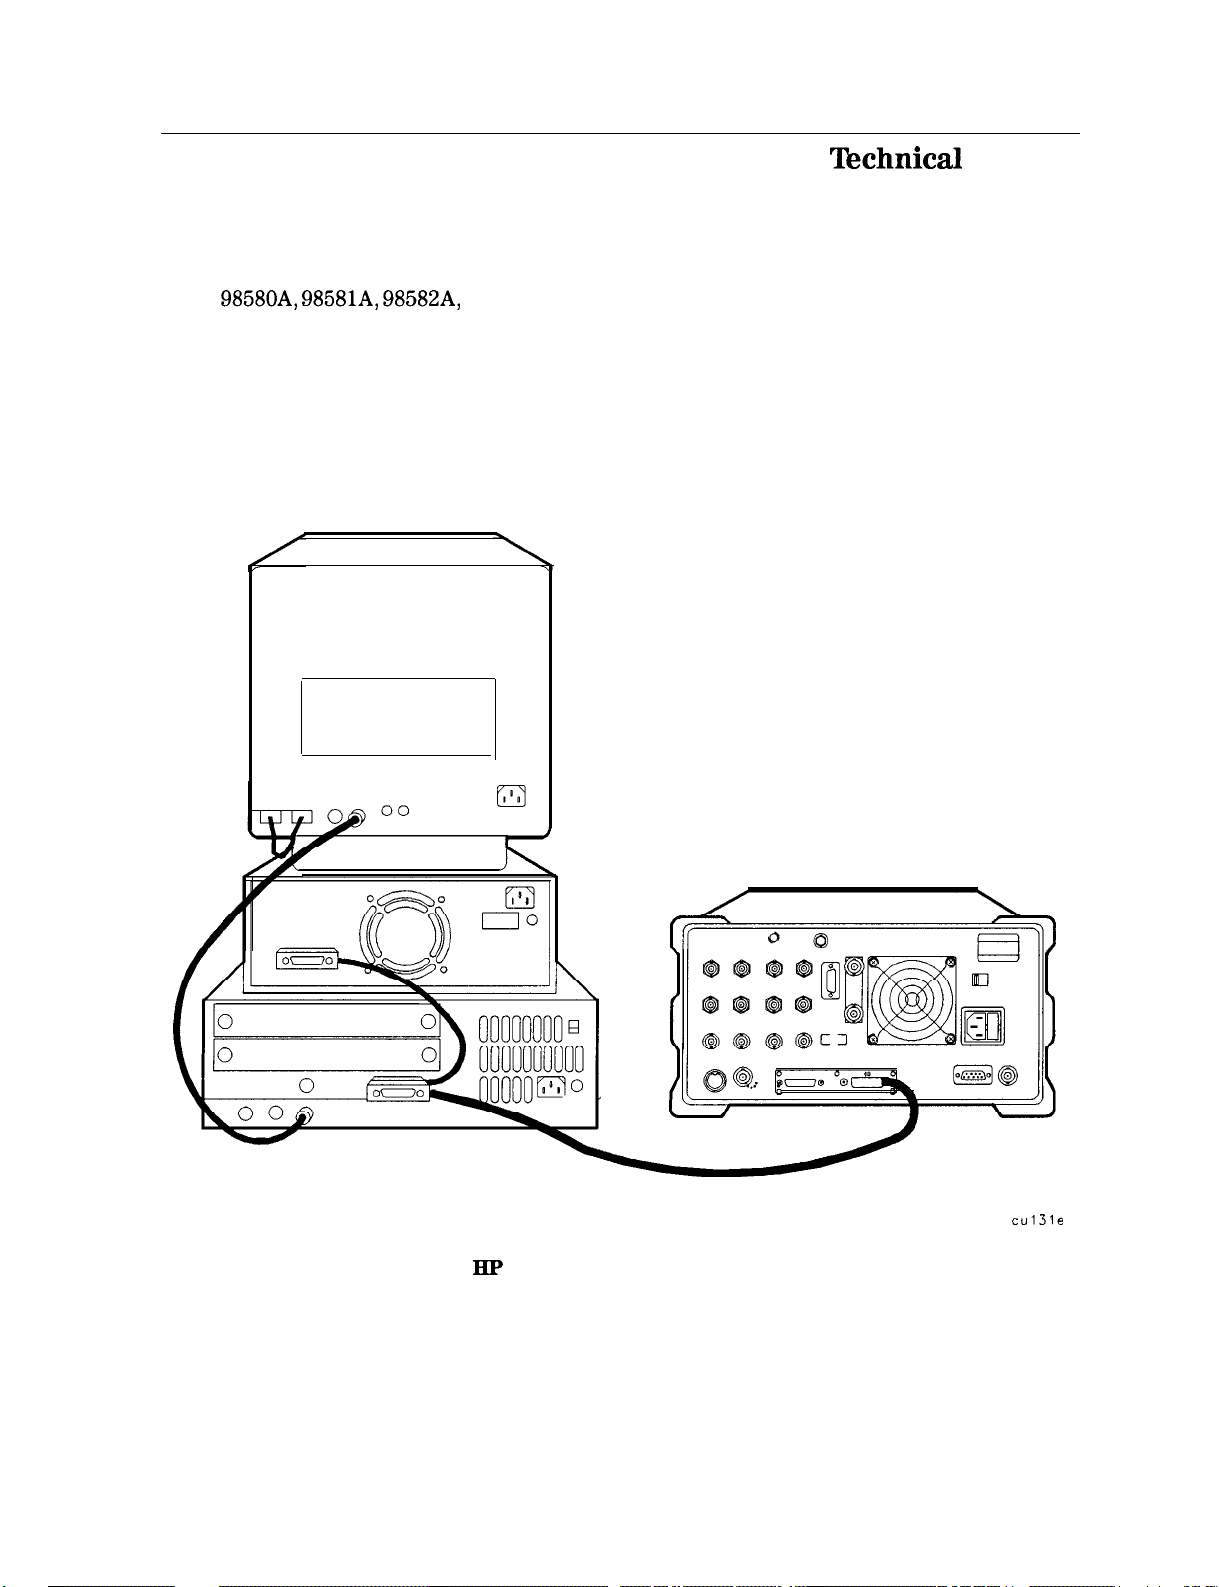
HP-IB Connections for the HP 9000 Series 300
Technical
Computers
Equipment
n HP
98580A, 98581A, 98582A,
n
HP 8590 Series spectrum analyzer with Option 041
n
HP 10833 (or equivalent) HP-IB cable
Interconnection Instructions
Connect the spectrum analyzer to the computer using the HP-IB cable as shown in Figure l-2.
or 98583A Series 300 technical computer
cul3le
Figure 1-2. Connecting the HP 9000 Series 300 Computer to the Spectrum Analyzer
Preparing for Use
1-5
Page 25
Test Program
To test the connection between the computer and the spectrum analyzer, turn on your
spectrum analyzer and follow the instructions below.
1. Your HP 9000 Series 300 computer may have either a soft-loaded or built-in language
system. If your language system is built-in, remove any disks from the drives and turn on
the computer.
2. If your language is soft-loaded, install the BASIC language disk into the proper drive. Turn
the computer power on. After a few seconds, the BASIC READY message appears; the
computer is now ready for use.
For further information on loading BASIC on your system, consult your BASIC manual.
Check the HP-IB address of the spectrum analyzer: press
@K@,
More 1 of 3 ,
ANALYZER ADDRESS . The usual address for the spectrum analyzer is 18. If necessary, reset
the address of the spectrum analyzer: press
1Hz)
(or enter the appropriate address).
4. Enter the following program, then press
(ml,
IRUN)
More 1 of 3 , ANALYZER ADDRESS ,
on the computer. If you need help entering
and running the program, refer to your computer and software documentation.
The program shows that the computer is able to send instructions to, and read information
from, the spectrum analyzer.
10 PRINTER IS 1
20 Analyzer=718
30 CLEAR Analyzer
40 OUTPUT Analyzer ; ; SNGLS ;
50 OUTPUT Analyzer ;
60 OUTPUT Analyzer ;
70 ENTER
Analyzer;A
“CF
300MZ ; TS ;
“CF? ; I’
80 PRINT “CENTER FREQUENCY = ;A; “Hz”
”
”
;
90 END
The program tells the spectrum analyzer to perform an instrument preset and enter
single-sweep mode. Next, the program sets the center frequency to 300 MHz
and takes a
sweep.
CENTERFREQUENCY=
3.OE+8Hz.
If the computer does not display the center frequency, refer to “If There is a Problem” at the
end of this chapter.
1-6
Preparing for Use
Page 26
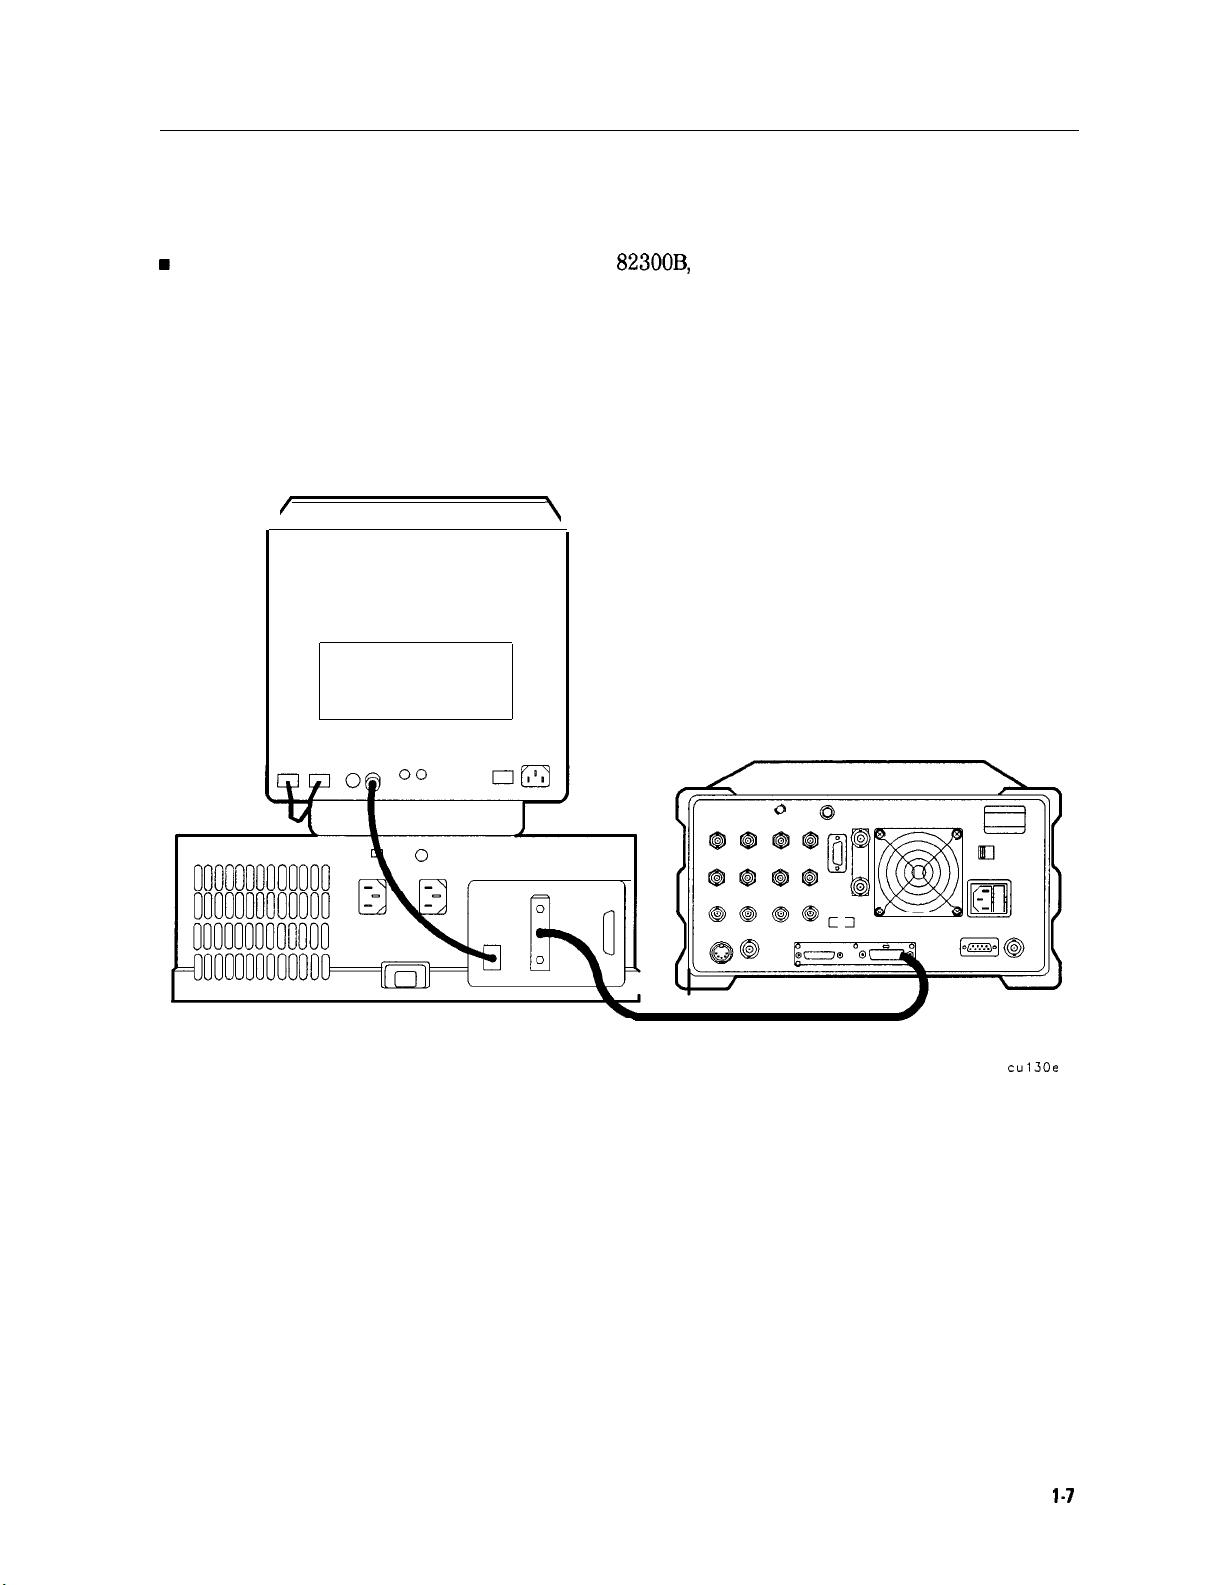
HP-IB Connections for the HP Vectra Personal Computer
Equipment
w
HP Vectra personal computer, with option HP
n
HP 8590 Series spectrum analyzer with Option 041
n
HP 10833 (or equivalent) HP-IB cable
Interconnection Instructions
82300B,
the HP BASIC Language Processor
Connect the spectrum analyzer to the computer using
/
\
the
HP-IB cable as shown in Figure l-3.
cul30e
Figure 1-3. Connecting the HP Vectra Personal Computer to the Spectrum Analyzer
Preparing for Use
l-7
Page 27
Test Program
To test the connection between the computer and the spectrum analyzer, turn on your
spectrum analyzer and follow the instructions below.
1. Refer to the HP 82300 Language Processor documentation to install the language processor
board in your computer and load the BASIC programming language into your computer.
2. Check the HP-IB address of the spectrum analyzer: press
Cm],
More I of 3 ,
ANALYZER ADDRESS . The usual address for the spectrum analyzer is 18. If necessary, reset
the address of the spectrum analyzer: press
18
IHz)
(or enter the appropriate address).
[CONFIG),
Mare 1 of 3 , ANALYZER ADDRESS ,
3. Enter the following program, then press (KjJ on the computer. If you need help entering
and running the program, refer to your computer and software documentation.
The program shows that the computer is able to send instructions to, and read information
from, the spectrum analyzer.
10 PRINTER IS 1
20 Analyzer=718
30 CLEAR Analyzer
40
OUTPUT Analyzer ;
50 OUTPUT
60 OUTPUT
Analyzer;"CF 3OOMZ;TS;"
Analyzer;"CF?;"
“IP ;
SNGLS ;
”
70 ENTER Analyzer;A
80 PRINT "CENTER FREQUENCY =
";A;"Hz";
90 END
The program tells the spectrum analyzer to perform an instrument preset and enter
single-sweep mode. Next, the program sets the center frequency to 300 MHz and takes a
sweep. The program then queries the center frequency value and tells the computer to display
CENTERFREQUENCY=
3.OE+8
Hz.
If the computer does not display the center frequency, refer to “If There is a Problem” at the
end of this chapter.
l-8
Preparing for Use
Page 28
RS-232 Connections for the HP Vectra or IBM PC/AT Personal Computer
Equipment
n
HP Vectra or IBM PC/AT personal computer
n
HP 8590 Series spectrum analyzer with Option 043
w
n
HP 24542U
g-pin
to
g-pin
RS-232 cable for computers with a
g-pin
female RS-232 port
Note
Refer to Appendix C for information on wiring cables.
Interconnection Instructions
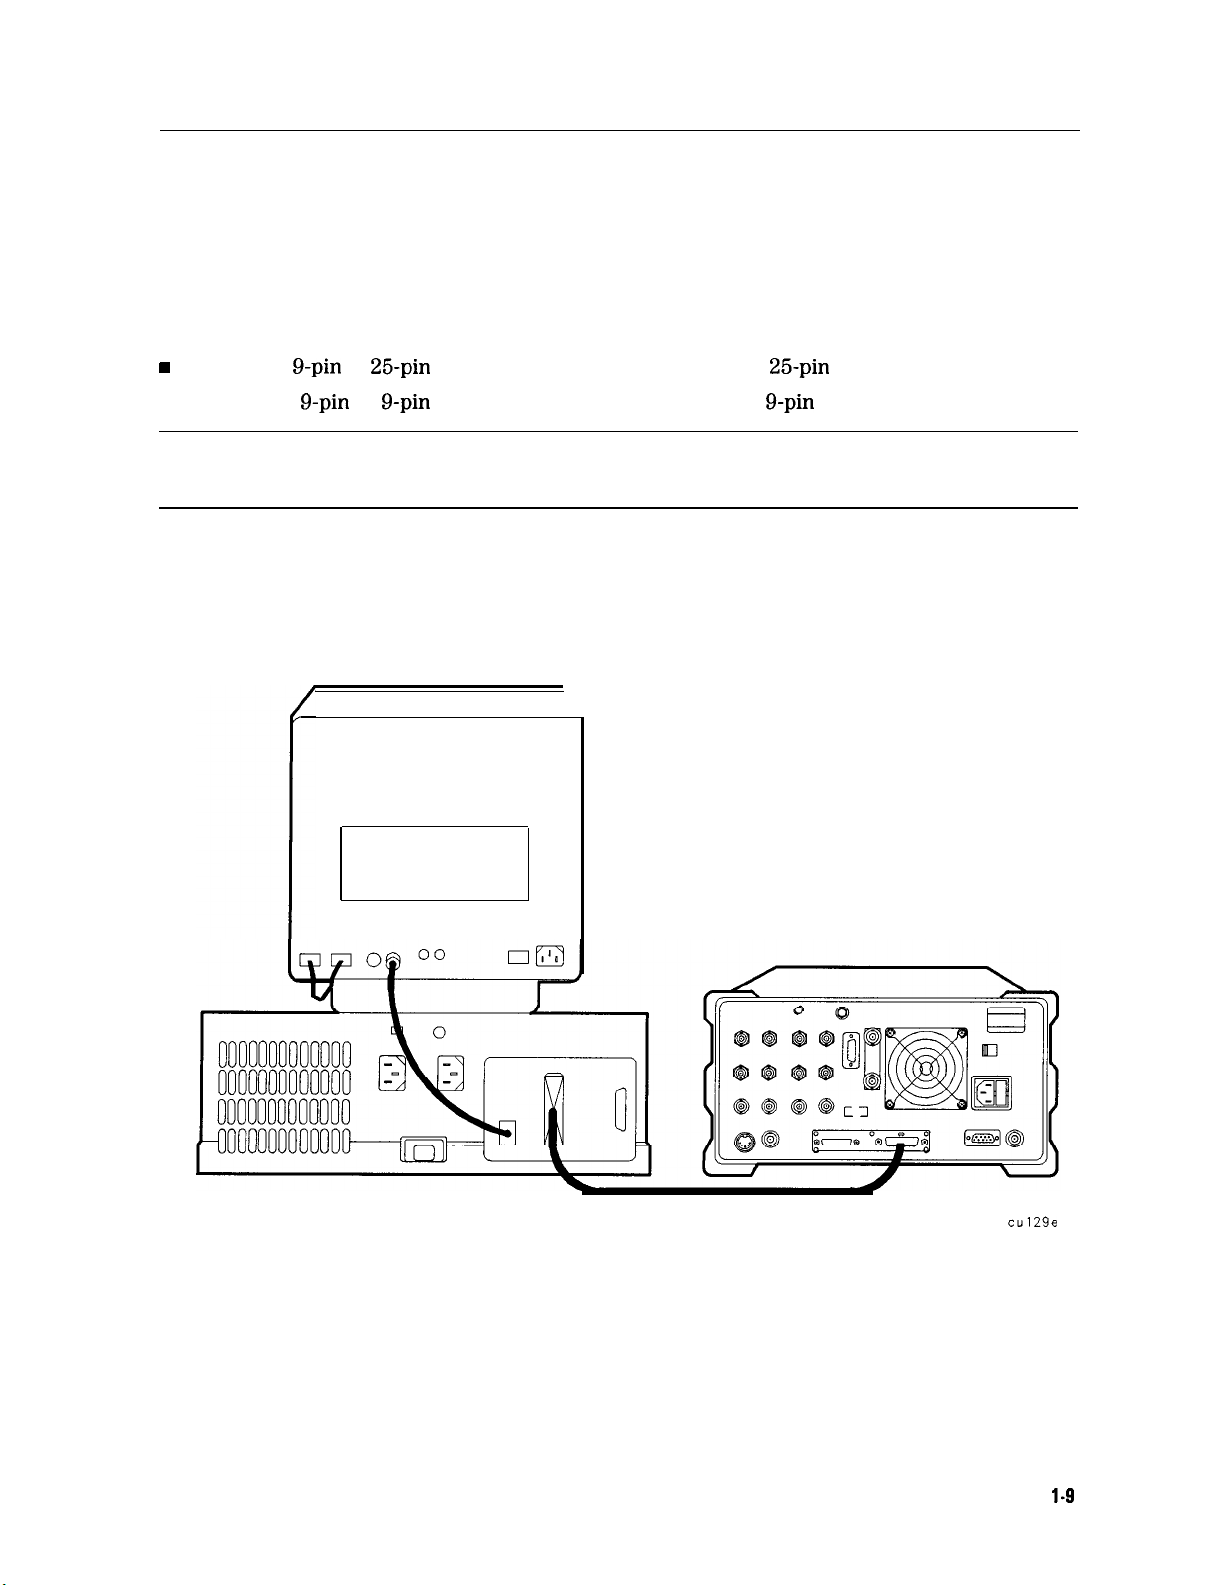
1. Connect the spectrum analyzer to the computer using the RS-232 cable as shown in
Figure l-4.
\
Figure 1-4. Connecting the Personal Computer to the Spectrum Analyzer
2. Turn on the spectrum analyzer and the computer.
cu129e
Preparing for Use
1.9
Page 29
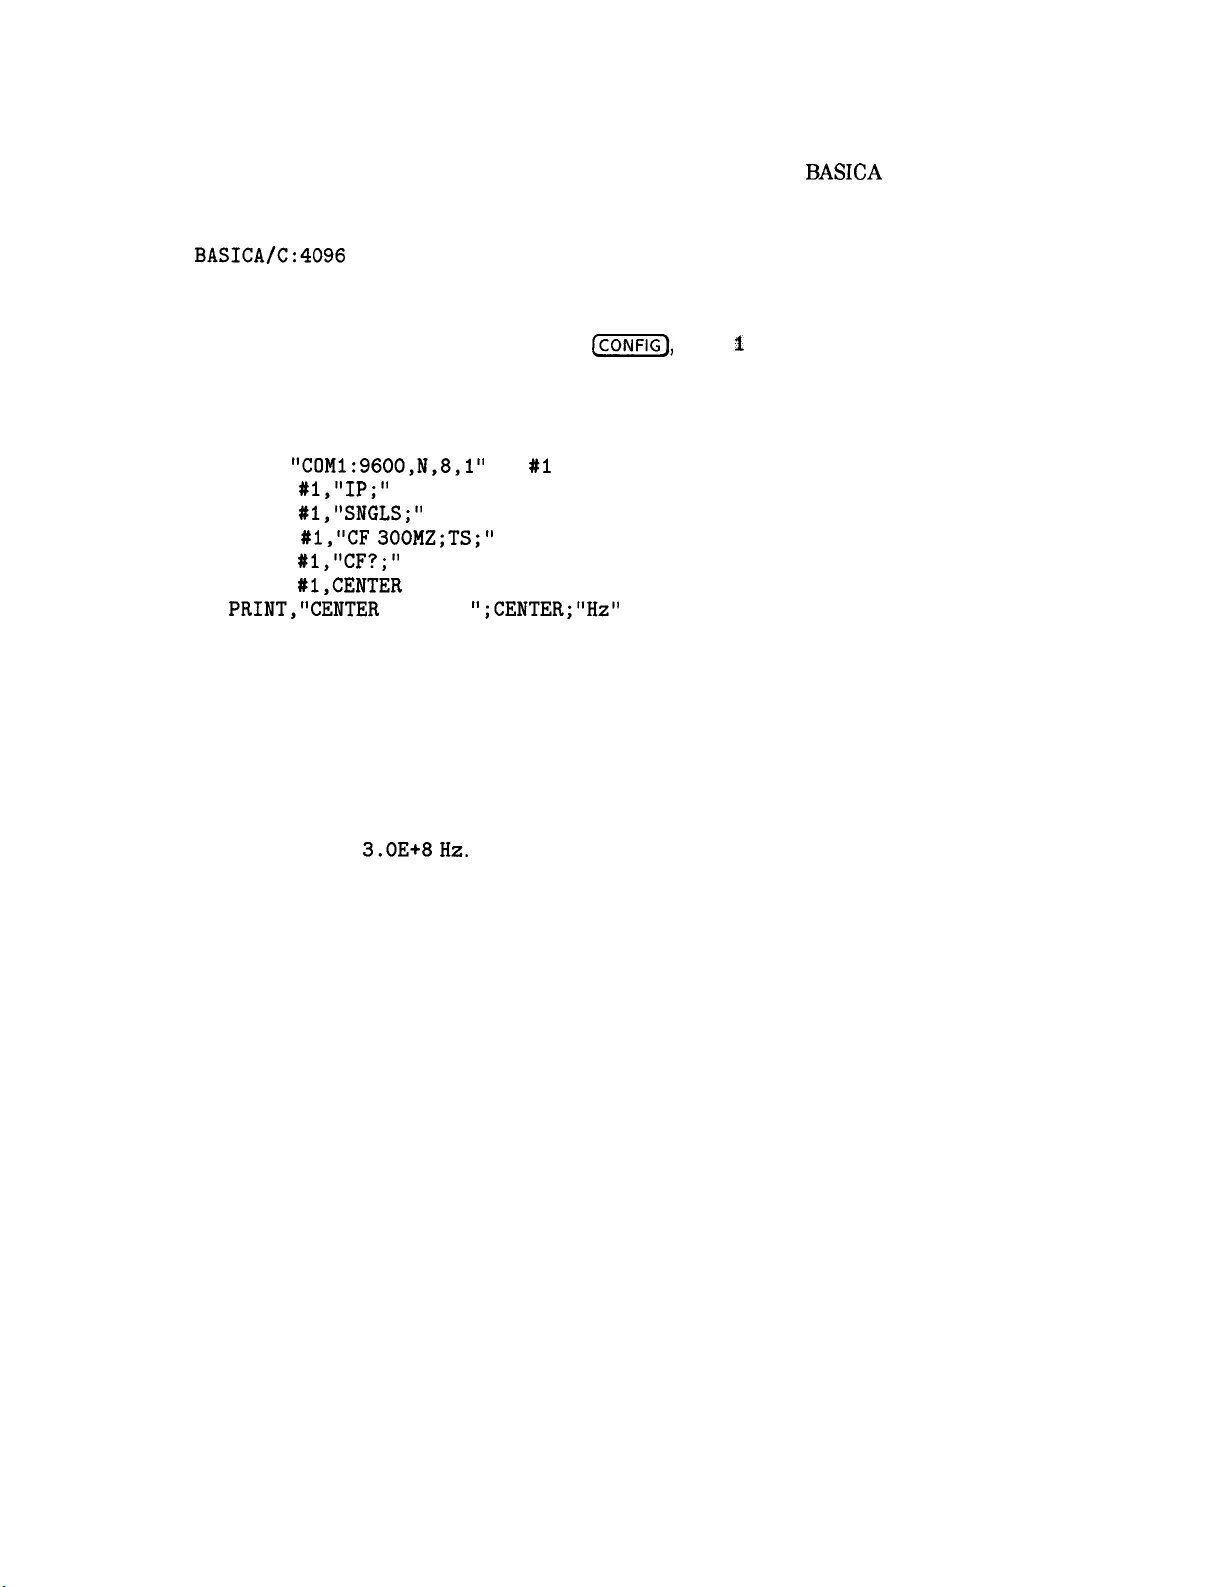
Test Program
The program shown below is written to work with computers using
BASICA
(version 2.0
or later) or GW BASIC. To test the interconnection, first load the BASIC language for your
computer and specify a communications buffer of 4096 bytes. Use the following command:
BASICA/C:4096
Set the spectrum analyzer baud rate to 9600, to match the baud rate set up for the computer
port in the test program. In line 20, the “9600” indicates 9600 baud for the computer port.
Press the following keys to set the baud rate:
c-1,
More 1 of 3 , BAUD RATE , 9600, (Hz).
Enter the following test program. The program shows that the computer is able to send
instructions to, and read information from, the spectrum analyzer.
10 'File
20 OPEN
30 PRINT
40 PRINT
50 PRINT
60 PRINT
70 INPUT
80
PRINT,"CENTER
= TESTPGM
"COMl:9600,N,8,1"
AS
#l,"IP;"
#l,"SNGLS;"
#l,"CF 300MZ;TS;"
#l,"CF?;"
#l,CENTER
FREQ =
";CENTER;"Hz"
#l
90 END
When you have entered the program, type:
SAVE "TESTPGM"
When you are ready to run the program, turn on the spectrum analyzer and run your program.
The program tells the spectrum analyzer to perform an instrument preset and enter single
sweep mode. Next, the program sets the center frequency to 300 MHz and takes a sweep.
The program then queries the center frequency value and tells the computer to display
CENTERFREQUENCY=
3.OE+8Hz.
If the computer does not display the center frequency, refer to “If There is a Problem” at the
end of this chapter.
l-10 Preparing for Use
Page 30
Printing or Plotting
You may wish to obtain a permanent record of data displayed on the spectrum analyzer screen.
This can be done using the lcopvl key of the spectrum analyzer, and a printer or plotter.
Note
The HP 7470A plotter does not support 2 plots per page. If you use an
HP 7470A plotter with an HP 8590 Series spectrum analyzer, you can select one
plot per page or four plots per page, but not 2 plots per page.
Printing Using an HP-IB Interface
Equipment
w
HP 8590 Series spectrum analyzer equipped with Option 041
n
HP 10833 (or equivalent) HP-IB cable
w
Printer with HP-IB Interface, choose one of the following:
•I HP 2225
q
HP 3630A
q
HP 500 Series* DeskJet
q
HP
q
HP LaserJet
q
MX-80 Epson
q
LQ-570 Epson
* Some models support color printing
ThinkJet
PaintJet
310*
Portable DeskJet
Interconnection and Printing Instructions
1. Turn off the printer and the spectrum analyzer.
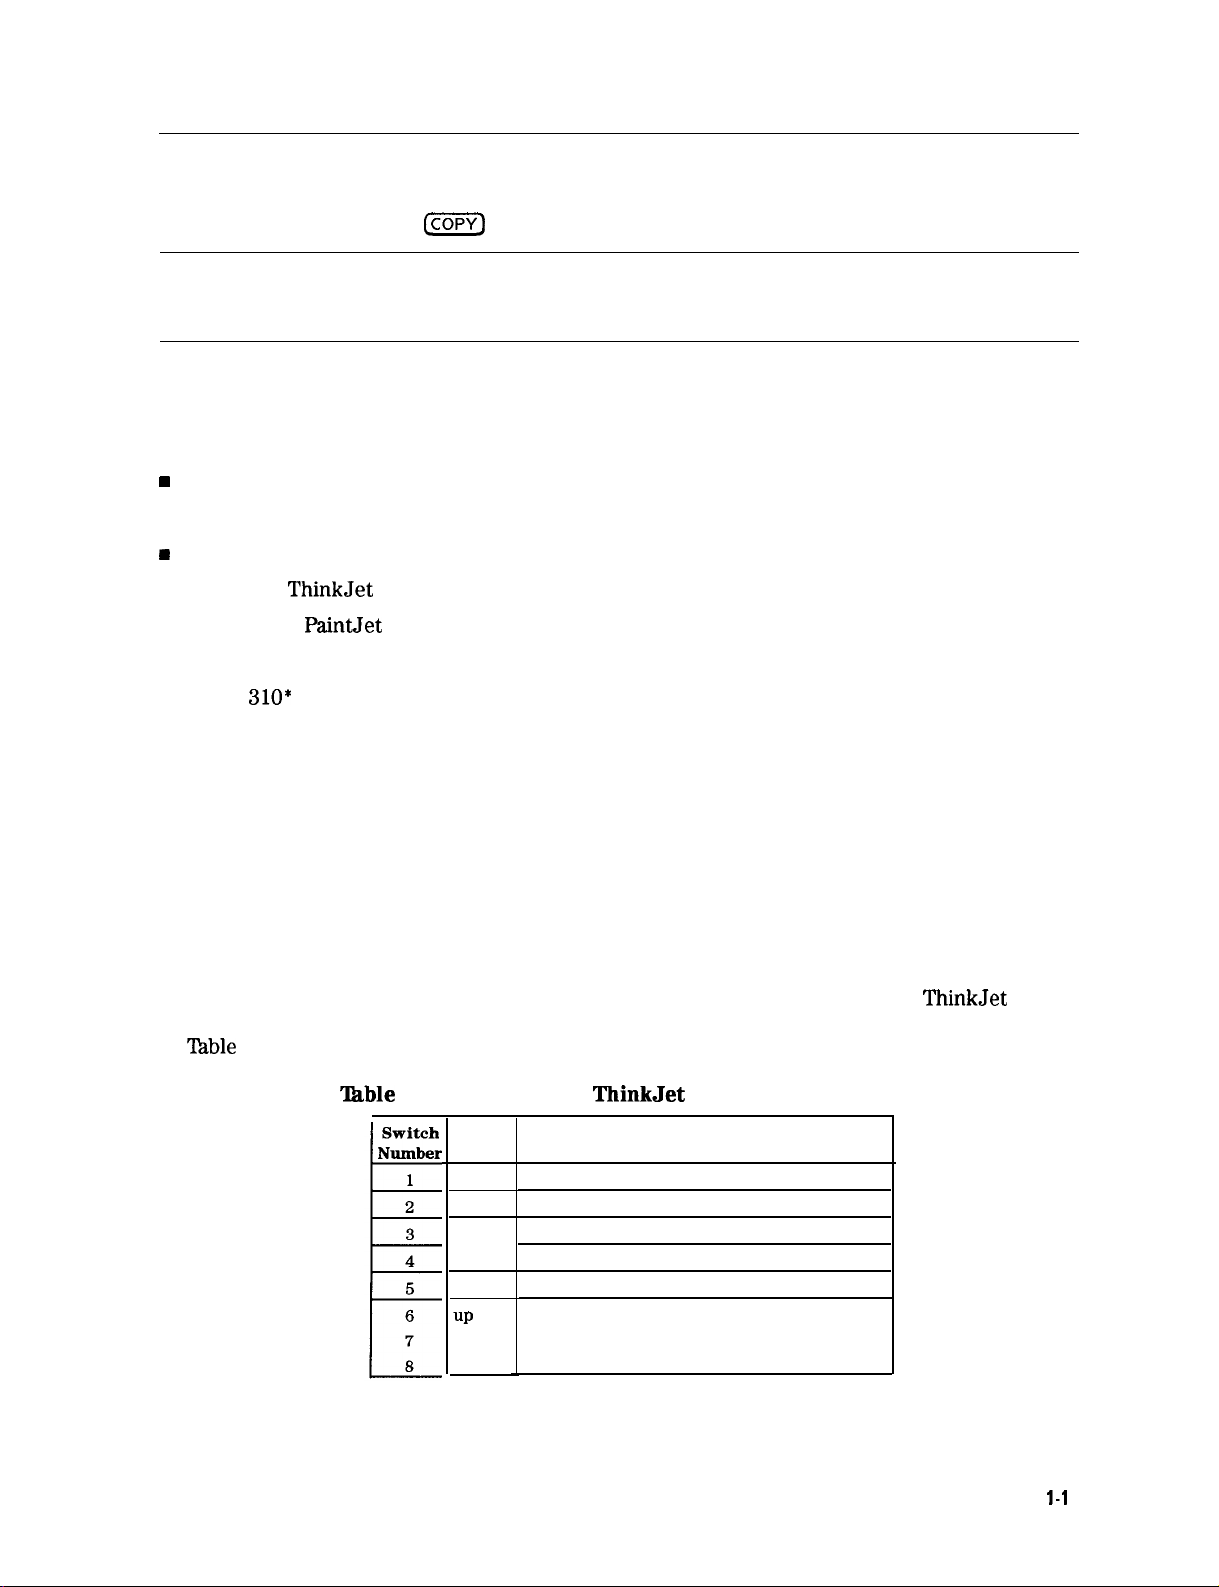
2. Connect the printer to the spectrum analyzer using the HP-IB cable. The HP ThinkJet
printer’s mode switches must be set correctly for use with the spectrum analyzer. Refer to
‘Iable
l-l for the correct settings.
able
l-l. Setting of HP ThinkJet Printer Mode Switches
Setting
down
down
up
down
down
UP
down
down
Printer performs a carriage return only.
Printer performs a line feed only.
Sets the printer to skip paper perforations
Sets the printer for a paper length of 11 inches.
Sets the printer to HP MODE.
Sets the printer to USASCII.
Comments
Preparing for Use
l-1
1
Page 31

Note
Because HP-IB cables can be connected together, more than one instrument can
communicate on the HP-IB. This means that both a printer and a plotter can
be connected to the spectrum analyzer (using two HP-IB cables). Each device
must have its own HP-IB address.
Note
Because the spectrum analyzer cannot print with two controllers (the computer
and the spectrum analyzer) connected, the computer must be disconnected
from the HP-IB. In most cases, it is sufficient to simply turn the computer OFF.
3.
Turn on the spectrum analyzer and printer.
4.
On the spectrum analyzer, press
PRlrl
PORT
5.
The printer usually resides at the first device address. To enter address 1 for the printer,
press
PRIlVTER
6.
Select the configuration for your printer by pressing the appropriate key. Note that the
HP13
PAR (so that HPIB is underlined).
ADDRESS ,
1,1Hz).
@Gi?Q
Print Conf fg ,
<Pm
Port
Cmfig
,
softkey is activated when the key title is underlined.
Set
Colr
Printer
Press this key to print in color if the spectrum analyzer is connected
to a Hewlett-Packard color printer, then select the appropriate
printer.
Selecting any Hewlett-Packard printer results in three printouts per
page prior to formfeeding the page.
One printout per page can be achieved by manually formfeeding
each printout.
Set 3&W
Printer
Press this key to print in black and white, then press one of the
following keys to select the appropriate printer mode.
. Press HP
B&W
PRINTER if the spectrum analyzer is connected to a
Hewlett-Packard printer.
Selecting any Hewlett-Packard printer results in three printouts
per page prior to formfeeding the page.
One printout per page can be achieved by manually formfeeding
each printout.
. Press BP
B&W
DJ540
if the spectrum analyzer is connected to a
Hewlett-Packard DeskJet 540 printer.
l-12
Preparing for Use
Page 32

. Press RF
a MX-80 Epson or other compatible
MX80
SML
LAG
if the spectrum analyzer is connected to
g-pin
print-head printer.
Pressing this key to underline SML will print two printouts to a
labels if desired. See step 7
Pressing this key to underline LRG will print only one printout to a
softkey
softkey labels to be printed with the spectrum analyzer display printout,
press PRT
when EF
8.
Press Previous Menu,
MEW
ON OFF so that ON is underlined. Note that this function does not work
MX80 SML LRG
. Press RF
LfJ57G
SML
LRG
if the spectrum analyzer is connected to
a LQ-570 Epson or other compatible 24-pin print-head printer.
Pressing this key to underline SML will print two printouts to a
page and will print softkey labels if desired. See step 7
Pressing this key to underline LRG will print only one printout to a
page and will not print the softkey labels.
or El?
CDPY
Lq570
SML
LRG
are pressed to underline LRG.
DEV PRMT PLT (PRNT should be underlined), then
IcoPv].
Preparing for Use
l-13
Page 33

Plotting Using an HP-IB Interface
Note
The HP 7470A plotter does not support 2 plots per page. If you use an
HP 7470A plotter with an HP 8590 Series spectrum analyzer, you can select
plot per page or four plots per page, but not 2 plots per page.
Equipment
w
HP 8590 Series spectrum analyzer with Option 041.
w
HP 10833 (or equivalent) HP-IB cable.
n
Any of the following plotters:
q
HP 7440A
q
HP 7445A plotter with HP-IB
q
HP
7550A/B
ColorPro
plotter with HP-IB
plotter with HP-IB
Interconnection and Plotting Instructions
1. Turn off the plotter and the spectrum analyzer.
2. Connect the plotter to the spectrum analyzer using the HP-IB cable.
Note
Because HP-IB cables can be connected together, more than one instrument can
communicate on the HP-IB. This means that both a printer and a plotter can
be connected to the spectrum analyzer (using two HP-IB cables). Each device
must have its own HP-IB address.
one
Note
Because the spectrum analyzer cannot plot with two controllers (the computer
and the spectrum analyzer) connected, the computer must be disconnected
from the HP-IB.
3. Turn on the spectrum analyzer and the plotter.
4. On the spectrum analyzer, press
PLT
PDRT HPIB
PAR (so that HPIB is underlined).
@%FiZj,
Plot
Canf
ig , Plt Port
GonSig
,
5. The plotter usually resides at the fifth device address. To set the plotter address, press
PLUTTRR
ADDRESS , 5, (Hz), to enter the address 5 for the plotter.
1-14 Preparing for Use
Page 34

6.
With
PLTS/PG
PLTS/PC
1 2 4 , you can choose a full-page, half-page, or quarter-page plot. Press
1 2 4 to underline the number of plots per page desired.
7. If two or four plots per page are chosen, a function is displayed that allows you to select
the location on the paper for the plotter output. If two plots per page are selected, then
PLT Cl
Lac _
function is displayed. If four plots per page are selected, then
_
PLT [I _
LOC _ _
is
displayed. Press the softkey until the rectangular marker is in the desired section of the
softkey label. The upper and lower sections of the softkey label graphically represent where
on the page the plotter output will be located.
Note
For a multi-pen plotter, the pens of the plotter draw the different components
of the screen as follows:
Pen
Number
1
Draws the annotation and graticule.
2
Draws trace A.
3
Draws trace B.
4
Draws trace C and the display line.
5
Draws user-generated graphics and the lower-limit line.
Draws the upper-limit line.
6
8. Press Previous Menu, COPY
Note
Once the address of the printer and plotter have been entered, the spectrum
There is no need to reenter them when the spectrum analyzer is turned off and
on.
Description
PINT
PLT (PLT should be underlined), then
Icopvl.
Preparing for Use l-15
Page 35

Printing Using an RS-232 Interface
Equipment
w
HP 8590 Series spectrum analyzer with Option 043.
w
One of the following cables:
q
HP 245426
q
HP 24542U
g-pin
g-pin
to
25-pin
(f) to
RS-232 cable
g-pin
(f) RS-232 cable
•I HP
n
C2932A g-pin
(f) to
g-pin
(m) RS-232 cable (for use with LaserJet 4P and
Printer with RS-232 Interface, choose one of the following:
•I HP 500 Series* DeskJet
q
HP 2225 ThinkJet
q
HP 3630A
q
MX-80 Epson
q
LQ-570 Epson
q
HP LaserJet
PaintJet
* Some models support color printing
Interconnection and Printing Instructions
1. Turn off the spectrum analyzer and the printer.
Note
2. Connect the printer using an RS-232 cable.
3. Turn on the spectrum analyzer and printer.
The RS-232 interface allows only one device (either the printer or the plotter)
to be connected to the spectrum analyzer. Refer to the Appendix C for more
information on RS-232 protocol and cable wiring.
4Plus)
4.
Press
(j-1,
Print
Cunfig
, Pm
Pdrt
Gunfig
,
PRI?
PORT
SER
PAR (so that SER is
underlined).
5.
To set the baud rate to 9600 baud, press BAUD RATE, 9600, (Hz). lb set the baud rate to
1200 baud, press: BAUD RATE, 1200,
Note
Some of the programs in this manual utilize 1200 baud. If your system uses the
@.
RS-232 handshake lines, you can use 9600 baud for all of the programs.
6. Press
1-16 Preparing for Use
(ZF@,
Print
Config.
Page 36

7. Select the configuration for your printer by pressing the appropriate key. Note that the
softkey is activated when the key title is underlined.
Set
Set
Colr
3tW
Printer
Printer
Press this key to print in color if the spectrum analyzer is connected
to a Hewlett-Packard color printer, then select the appropriate
printer.
Selecting any Hewlett-Packard printer results in three printouts per
page prior to formfeeding the page.
One printout per page can be achieved by manually formfeeding
each printout.
Press this key to print in black and white, then press one of the
following keys to select the appropriate printer mode.
. Press HP
B%W PRINTER
if the spectrum analyzer is connected to a
Hewlett-Packard printer.
Selecting any Hewlett-Packard printer results in three printouts
per page prior to formfeeding the page.
One printout per page can be achieved by manually formfeeding
each printout.
. Press RP
R%W DJ540
if the spectrum analyzer is connected to a
Hewlett-Packard DeskJet 540 printer.
. Press EP
a MX-80 Epson or other compatible
MX80
SML LRG if the spectrum analyzer is connected to
g-pin
print-head printer.
Pressing this key to underline SML will print two printouts to a
page and will print softkey labels if desired. See step 8.
Pressing this key to underline LRG will print only one printout to a
page and will not print the softkey labels.
. Press EP
Lq570
SML LRG if the spectrum analyzer is connected to
a LQ-570 Epson or other compatible 24-pin print-head printer.
Pressing this key to underline SML will print two printouts to a
page and will print softkey labels if desired. See step 8.
Pressing this key to underline LRG will print only one printout to a
page and will not print
the
softkey
labels.
8. If you want the softkey labels to be printed with the spectrum analyzer display printout,
press PRT
when KP
g.
Press Previous Menu, COPY DEV
MEMU GM
MX80 LRG
OFF so that ON is underlined. Note that this function does not work
or EP
Lq570
LRG is pressed.
PRMT
PLT (PRNT should be underlined), then
m.
Preparing for Use
l-1 7
Page 37

Plotting Using an RS-232 Interface
Equipment
n
HP 8590 Series spectrum analyzer with Option 043.
n
HP 245426 9-25 pin RS-232 cable
n
HP
C2932A
n
Any of the following Plotters:
q
HP 7440A
q
HP 7445A plotter with an RS-232 interface.
q
HP
9-9 pin RS-232 cable (for use with LaserJet 4P and
ColorPro
7550A/E?
plotter with an RS-232 interface.
plotter with an RS-232 interface.
Interconnection and Plotting Instructions
1. Turn off the spectrum analyzer.
4Plus)
Note
The RS-232 interface allows only one device (either the printer or the plotter)
to be connected to the spectrum analyzer. Refer to the Programmer’s Guide for
more information on RS-232 protocol and cable wiring.
2. Connect the plotter using an RS-232 cable.
3. Turn on the spectrum analyzer and the plotter.
4.
Press
(j-J,
Plot
&dig, Pit
Port
Config,
PLT PORT
SER
PAR
(so that
SER is
underlined).
5.
lb set the baud rate to 1200 baud, press:
&
Press
with the
CCONFIG],
Plot
PLTSIPC
&&kg.
1 2 4
You can choose a full-page, half-page, or quarter-page plot
softkey.
Press
BAUD
RATE, 1200, [Hz).
PLTS/PG
1 2 4 to underline the number of plots
per page desired.
7. If two or four plots per page are chosen, a function is displayed that allows you to select
the location on the paper of the plotter output. If two plots per page are selected, then
PLT Cl
LOC - -
function is displayed. If four plots per page are selected, then
PLT U _
LOC _ _
is
displayed. Press the softkey until the rectangular marker is in the desired section of the
softkey label. The upper and lower sections of the softkey label graphically represent where
on the page the plotter output will be located.
l-18
Preparing for Use
Page 38

Note
For a multi-pen plotter, the pens of the plotter draw the different components
of the screen as follows:
Description
Draws the annotation and graticule.
Draws trace A.
Draws trace B.
Draws trace C and the display line.
Draws user-generated graphics and the lower-limit line.
Draws the upper-limit line.
8. Press Previous
Menu,
COPY DEV
PRMT
PLT (so that PLT is underlined), then
Printing after Plotting or Plotting after Printing
Pressing lcopvl without changing COPY
print or a plot).
. To print after doing a plot, press
then
[copvl.
. To plot after printing, press
@5iKJ,
@GiKJ COPY
[copvl.
PRNT
PLT produces the function last entered (a
COPY DEV
DEV
PRNT
PRRT
PLT (so that PLT is underlined), and
Icopvl.
PLT (so that PRNT is underlined),
Preparing for Use 1-19
Page 39

Printing Using a Parallel Interface
Equipment
w
HP 8590 Series spectrum analyzer equipped with Option 041 or 043.
n
HP
C295OA
n Printer with parallel interface, choose one of the following:
parallel printer cable.
q HP
q
II
310*
Portable DeskJet
HP 3630A
PaintJet
HP 500 Series* DeskJet
•1 HP LaserJet
q
LQ-570 Epson
q
MX-80 Epson
* Some models support color printing
Interconnection and Printing Instructions
1.
Turn off the printer and the spectrum analyzer.
2.
Connect the printer to the spectrum analyzer using
3.
Turn on the spectrum analyzer and printer.
4.
On the spectrum analyzer, press
PRN PORT
HPfB
PAR (for Option 041, so that PAR is underlined) or PRN PORT
@GFiFJ,
Print
Option 043, so that PAR is underlined).
5.
Select the configuration for your printer by pressing the appropriate key. Note that the
softkey is activated when the key title is underlined.
the
parallel printer cable.
Cmfig,
Pm Port
&Wig
,
SER
PAR (for
Set
Colr Prirrter
l-20 Preparing for Use
Press this key to print in color if the spectrum analyzer is connected
to a Hewlett-Packard color printer, then select the appropriate
printer.
Selecting any Hewlett-Packard printer results in three printouts per
page prior to formfeeding the page.
One printout per page can be achieved by manually formfeeding
each printout.
Page 40

Set
B%W
Printer
Press this key to print in black and white, then press one of the
following keys to select the appropriate printer mode.
. Press HP
B%W
PRINTER if the spectrum analyzer is connected to a
Hewlett-Packard printer.
Selecting any Hewlett-Packard printer results in three printouts
per page prior to formfeeding the page.
One printout per page can be achieved by manually formfeeding
each printout.
n Press
I@ B%W DJS40
if the spectrum analyzer is connected to a
Hewlett-Packard DeskJet 540 printer.
. Press EP
a MX-80 Epson or other compatible
MX8D
SML LRG if the spectrum analyzer is connected to
g-pin
print-head printer.
Pressing this key to underline SML will print two printouts to a
page and will print softkey labels if desired. See step 7
Pressing this key to underline LRG will print only one printout to a
page and will not print the softkey labels.
n Press
RF LQ570
SML LRG if the spectrum analyzer is connected to
a LQ-570 Epson or other compatible 24-pin print-head printer.
Pressing this key to underline SML will print two printouts to a
page and will print softkey labels if desired. See step 7
Pressing this key to underline LRG will print only one printout to a
page and will not print the softkey labels.
6. If you want the softkey labels to be printed with the spectrum analyzer display printout,
press PRT
when EP
7.
Press Previous
MEMU
ON OFF so that ON is underlined. Note that this function does not work
MX8G
SML LRG or EF
Menu,
LQ570
SML LRG are pressed to underline LRG.
CDPY
DEV PRNT PLT (PRNT should be underlined), then
IcoPv].
Preparing for Use
1-21
Page 41

Plotting to an HP LaserJet Printer
Equipment
w
HP 8590 Series spectrum analyzer with RS-232 or Parallel Interface
w
HP 245426
g-pin
to
25-pin
RS-232 cable
n HP
n HP
w
C2932A g-pin
C2950A
(f) to
g-pin
(m) RS-232 cable (for use with LaserJet 4P and
parallel printer cable
Any of the following HP LaserJets:
q
HP LaserJet III
q
HP LaserJet IIIP
•I HP LaserJet 4
q
HP LaserJet 4L
q
HP LaserJet 4P
q
HP LaserJet 4Plus
Interconnection and Plotting Instructions
1. Turn off the spectrum analyzer.
Note
2. Connect the HP LaserJet to the analyzer.
3. Turn on the analyzer and the HP LaserJet printer.
The RS-232 or parallel interface allow only
plotter) to be connected to the spectrum analyzer. Refer to the Programmer’s
Guide for more information on protocol and cable wiring.
4Plus)
one
device (either the printer or the
4.
Press
[ZKZ].
5.
Press
6.
Press
CDPY
(-1,
with the
DEV
PlXNT
Plot
PLTSjPG
PLT so that PLT is underlined.
Config
1 2 4
. You can choose a full-page, half-page, or quarter-page plot
softkey.
Press
PLTS/PG 1
2 4 to underline the number of plots
per page desired.
7. If two or four plots per page are chosen, a function is displayed that allows you to select
the location on the paper of the plotter output. If two plots per page are selected, then
PLT Cl
LOC - -
function is displayed. If four plots per page are selected, then
PLT c3 _
LOC I I
is
displayed. Press the softkey until the rectangular marker is in the desired section of the
softkey label. The upper and lower sections of the softkey label graphically represent where
on the page the plotter output will be located.
8. Press
9. Then press
l-22
PLT->L.JT
ON OFF so that ON is underlined.
Icopv).
Preparing for Use
Page 42

Printing after Plotting or Plotting after Printing
Pressing [copvl without changing COPY DEV PRNT PLT produces the function last entered (a
print or a plot).
w
To print after doing a plot, press
then
IcoPv].
n
To plot after printing, press
IcoPv].
(CONFIG),
(W),
COPY DEV PRNT PLT (so that PRNT is underlined),
COPY DEV PRNT PLT (so that PLT is underlined), and
Preparing for Use
1-23
Page 43

If There Is a Problem
This section offers suggestions to help get your computer and spectrum analyzer working as a
system. The test programs provided in this chapter let you know if the connection between the
computer and the spectrum analyzer interconnection is working properly.
If the test program does not run, try the following suggestions:
1. You may need to modify the program syntax to work with your computer. Refer to your
BASIC manual for correct syntax.
2. The program must be executed correctly. Refer to your computer manual for information
about program execution.
3. Check your program for errors.
If the test program runs on the computer, but the spectrum analyzer does not respond, try the
following suggestions:
1.
Make sure the spectrum analyzer is turned on. If the spectrum analyzer has power, the
green indicator light above the line switch is on.
2.
Make sure the interface cable is connected securely. Check the interface cable for defects.
Make sure the correct cable is used.
3.
If you are using an HP-IB interface, the spectrum analyzer must be set to the correct address
setting. Press
4.
If you are using the RS-232 interface, check the spectrum analyzer baud rate. Refer to
Appendix C for information about setting the baud rate on the spectrum analyzer.
(??%KJ
More 1 of 3 , ANALYZER
ADDRESS
.
5.
If a program in user memory is suspected of causing problems, use
Dispose User
double key press.) ERASE DLP
Mem
, ERASE DLP MEM , ERASE DLP MEM . (ERASE DLP
MEM
erases all user programs, variables, personalities (which
(ZZiZ],
MEM
More 1 of 3 ,
requires a
are usually in the form of downloadable programs), and user-defined traces that are in
spectrum analyzer memory.
6.
If you wish to reset the spectrum analyzer configuration to the state it was in when it was
originally shipped from the factory, use DEFAULT
press
C-1,
More 1 of 3, DEFAULT
GOEFIG
COfFfG
. To access
, DEFAULT
CONFIG
I&FAULT CONFfG
. (DEFAULT
,
CONFIG
requires a double key press.)
If you suspect your computer is causing the problems, check it by running a program that you
know works. If your system still has problems, contact the sales and service office
nearest you.
Your salesperson will either be able to help solve the problem or refer you to someone who can.
l-24
Preparing for Use
Page 44

2
Writing a Program
What You’ll Learn in This Chapter
This chapter introduces spectrum analyzer programming. The first section of this chapter,
“Writing Your First Program,
introduces programming fundamentals. The second section,
Spectrum Analyzer, n shows how to get data out of the spectrum analyzer. A summary at the
end of this chapter reviews the programming guidelines introduced.
If the computer is not connected to the spectrum analyzer, follow the instructions in Chapter 1,
“Preparing for Use.
A general knowledge of the BASIC programming language and the spectrum analyzer is
recommended before reading this chapter. Refer to your software documentation manuals for
more information about BASIC. For reference, Chapter 5 of this manual provides spectrum
analyzer commands in alphabetical order.
”
n
helps you write your first spectrum analyzer program and
“Getting Information from the
Note
All programming examples in this chapter for the HP-IB interface are written
in HP BASIC 4.0, using an HP 9000 Series 200 computer. For the RS-232
interface, examples are written in GW BASIC, using an HP Vectra personal
computer or compatible controller.
Writing a Program
2-l
Page 45

Writing Your First Program
When the spectrum analyzer has been connected to a computer via HP-IB or RS-232 interface,
the computer can be used to send instructions to the spectrum analyzer. These instructions tell
the spectrum analyzer such things as frequency span, resolution bandwidth, and sweep mode.
If a properly selected sequence of instructions is sent to the spectrum analyzer, a measurement
is made. Sequences of coded instructions are called programs.
Composing the. Program
Most spectrum analyzer programs contain several common statements, or “commands,” that
address the spectrum analyzer, preset it, and select its sweep mode. As an example, we will
write a short program that executes only these common commands.
The following programs are for the HP-IB and the RS-232 interfaces. Note the quotation marks
that contain spectrum analyzer commands in each line. Also note the semicolons at the end of
each line, inserted at the end of each set of spectrum analyzer commands within the quotation
marks. Using semicolons makes programs easier to read, prevents command misinterpretation,
and is recommended by IEEE Standard 728.
Note
In commands where quotation marks occur, the computer recognizes data as
character data and not BASIC programming language commands.
Program Example for the HP-IB Interface
05
!File:
20 CLEAR Analyzer
30 OUTPUT
40 OUTPUT
50 LOCAL 7
60 END
Line 10 of our program assigns a variable called “Analyzer” to our spectrum analyzer at address
718. This instruction is followed by the HP BASIC CLEAR command, which resets the spectrum
analyzer on the HP-IB. With these two program lines, we have set up a clear communication
path between the computer and the spectrum analyzer.
Line 30 introduces the instrument preset (IP) command, which corresponds to the key
on the spectrum analyzer. The IP command sets all of the analog parameters of the spectrum
Note
"IBPROGl"
Analyzer;"IP;"
Analyzer;"SNGLS;TS;"
All softkey functions on the spectrum analyzer have corresponding
programming commands. As you continue programming, you will learn the
command names that correspond to the front-panel keys and softkeys.
Line 40 activates the single-sweep mode. Most remotely controlled measurements require
control of the sweep. Once SNGLS has activated the single-sweep mode, take sweep (TS)
starts and completes one full sweep. TS maintains absolute control over the sweep, which is
necessary for accurate computer data transfer and reduced program execution time.
Before we end the program, we return the spectrum analyzer to front-panel control with line
50, LOCAL 7. The LOCAL command corresponds to the (LOCAL) key on the front panel
of the spectrum analyzer. (LOCAL 7 commands everything on the bus to go to local mode.)
2-2
Writing a Program
Page 46

Finally, in line 60, we end the program with the END command. (If you forget to include the
END command, the computer will give an error message.)
Enter the program lines, press (RUN) on the computer, and watch the spectrum analyzer display
as it completes each instruction.
Program Example for the RS-232 Interface
10 'File = 232PROGl
20
OPEN
30 PRINT #1
40 PRINT
50
END
"COMl: 9600,N,8,1"
AS #1
"IP*"
#l:"SNkLS;TS;"
Line 20 of the program opens the RS-232
COMl:
line, identifies it as
#l,
and sets the RS-232
parameters as follows:
9600 baud
no parity
8 bits/character
1 stop bit
Line 30 of the program introduces the instrument preset (IP) command, which corresponds to
the
[PRESET)
key on the spectrum analyzer. The IP command sets all of the analog parameters
of the spectrum analyzer to known values and provides a good starting point for every
measurement.
Note
All softkey functions on the spectrum analyzer have corresponding
programming commands. As you continue programming, you will learn the
command names that correspond to the front-panel keys and softkeys.
Line 40 activates the single-sweep mode. Most remotely controlled measurements require
control of the sweep. Once SNGLS has activated the single-sweep mode, take sweep (TS) starts
and completes one full sweep. The TS command maintains absolute control over the sweep,
which is necessary for accurate computer data transfer and reduced program execution time.
Finally, in line 50, end the program with the END command.
Make sure that the spectrum analyzer baud rate is 9600 via the
BAUII
RATE
softkey.
Enter the
program lines, then press (RUN) on the computer. Watch the spectrum analyzer display as it
completes each instruction.
Note
When using an HP 9000 Series 200 or 300 computer, END commands are
necessary. Refer to your BASIC manual to determine END statement
requirements for your specific computer.
Writing a Program
2-3
Page 47

Modifying the Program
Remote operation of the spectrum analyzer is similar to manual operation. Remote
measurements are executed by commands that correspond to front-panel keys and softkeys.
The first chapter in the spectrum analyzer operating manual shows you how to make a simple
measurement using the calibration signal. We can add instructions to our program so that it
will make the same measurement. (Because the manual process closely resembles that of
the program, you may want to review the chapter entitled “Making a Measurement” in the
HP 8590 E-Series and L.-S&es Spectrum Analyzers User’s Guide.)
By inserting a few lines into the initial program, we can set functions such as the center
frequency and span, and we can activate a marker to find a signal’s frequency and amplitude.
Program Example for the HP-IB Interface
First, we set the center frequency to 300 MHz. The CF command corresponds to the center
frequency function,
described in Chapter 5.)
Insert the following program line between lines 40 and 50:
CEnTER
FREQ . (All spectrum analyzer commands, such as CF, are
41 OUTPUT
Analyzer;"CF 300MZ;"
Next, we set the span to 200 MHz with the SP command. Add the following program line:
42 OUTPUT.
Analyzer;"SP 200MZ;"
Because we are controlling the sweep, we must update the spectrum analyzer display screen
with the following program line:
43 OUTPUT
Ana1yzer;"T.S;"
When the program is executed, the spectrum analyzer takes one full sweep before executing
line 41. Line 41 changes the center frequency to 300 MHz, and line 42 changes the span to
200
MHz.
Enter the following program line to place a marker at the highest peak on the trace with a
MKPK HI command:
44 OUTPUT
Analyzer:"MKPK
HI;"
The completed program is shown below:
05
!File:
10
Analyzer=718
20
CLEAR Analyzer
30
OUTPUT
40
OUTPUT
41
OUTPUT
42
OUTPUT
43
OUTPUT
44
OUTPUT
50
LOCAL 7
60
END
"IBPROG2"
Analyzer;"IP;"
Analyzer;"SNGLS;TS;"
Analyzer;"CF
Analyzer;"SP
300MZ;”
200MZ;"
Analyzer;"TS;"
Analyzer;"MKPK HI;"
Run the program to make the measurement. Watch the spectrum analyzer display as it
completes each instruction. Notice that the program executes the instructions faster than is
possible from the front panel.
2-4 Writing a Program
Page 48

When a certain measurement is repeated often, a computer program can save time. In
addition, the computer is less likely to make an error than an operator manually entering the
same instructions from the front panel.
Program Example for the RS-232 Interface
First, we set the center frequency to 300 MHz. The CF command corresponds to the center
frequency function,
described in Chapter 5.)
Insert the following program lines between lines 40 and 50 of the previous program.
Cm
FREQ
. (All spectrum analyzer commands, such as CF, are
41 PRINT
#l,"CF 300MZ;"
Next, set the span to 200 MHz with the SP command. Add the following program line:
42 PRINT
#l,"SP 200MZ;"
Because we are controlling the sweep, we must update the spectrum analyzer display with the
following program line:
43 PRINT
#l,"TS;"
When the program is executed, the spectrum analyzer takes one full sweep before executing
line 41. Line 41 changes the center frequency to 300 MHz. Line 42 changes the span to
200
MHz.
Enter the following program line to place a marker at the highest peak on the trace:
44 PRINT
#l,"MKPK
HI;"
The completed program is shown below:
10 'File
20 OPEN
30 PRINT
40 PRINT
41 PRINT
42 PRINT
43 PRINT
44 PRINT
=
232PROG2
"COMl:9600,N,8,1"
AS #1
#l,"IP;"
#l,"SNGLS;TS;"
#l,"CF 300MZ;"
#l,"SP 200MZ;"
#l,"TS;"
Xl,"MKPK
HI;"
50 END
Run the program to make the measurement. Watch the spectrum analyzer display as it
completes each instruction. When a certain measurement is repeated often, a computer
program can save time. Also, the computer is much less likely to make an error than an
operator manually entering the same instructions from the front panel.
Writing a Program
2-5
Page 49

Enhancing the Program with Variables
In the last program, specific center frequency and span values were set. By modifying the
program, we can cause different values to be set each time the program is run.
Program Example for the HP-IB Interface
In the following program, the exclamation point
(!)
allows the words that follow to be ignored
by the computer. Thus, they serve as comments in the program.
10
!FILE:
20 REAL
“VARIO”
C,freq,S-pan !define
the variables
30 Analyzer=718
40 CLEAR Analyzer
50 OUTPUT
60
!ask
70 INPUT “CENTER FREQUENCY (MHz)
80
!ask for the desired span:
90 INPUT
100
!send
110
!analyzer
120
!analyzer
130 OUTPUT Analyzer;
140 OUTPUT Analyzer ;
150 OUTPUT Analyzer ;
160
!find
170 OUTPUT Analyzer ;
Analyzer;“IP;SNGLS;TS;”
for the desired center frequency:
?I’,
C-f req
“SPAN(MHz)?” ,S,pan
the center frequency and span to the
and take a sweep to update the
screen:
“CF “;C-freq; “MZ; ‘I
“SP I’ ; S-pan;
“MZ
; ‘I
“TS ; ‘I
the signal peak with peak search:
“MKPK
HI ;
I’
180 LOCAL 7
190 END
Three modifications are made to the previous program so it includes center frequency and span
variables. First, using the HP BASIC REAL command, we define two variables, C-freq and
S-pan. The frequency and span parameters are stored in these variables. (Refer to line 20.)
Second, using the HP BASIC INPUT command, we prompt the user to enter the desired center
frequency and span. The center frequency and span values are entered on the computer;
because the measurement units will be entered by the program, the user does not enter them.
(See lines 70 to 140.)
Third, we modify the output parameter statements so that the values stored in C-freq and
S-pan are sent to the spectrum analyzer. (See lines 130 to 140.)
A sweep is taken after the parameters are sent to the spectrum analyzer, to ensure that the
spectrum analyzer screen is updated before the marker is placed on the highest signal peak.
2-6
Writing a Program
Page 50

Program Example for the RS-232 Interface
In the following program, the apostrophe
(‘)
allows the words that follow to be ignored by the
computer. Thus, they serve as comments in the program.
=
10 ‘File
20 OPEN
30 PRINT
40 PRINT
232PROG3
"COMl:9600,N,8,1"
AS #1
#l,"IP;"
#l,"SNGLS;TS;"
50 'Ask for the center frequency and span
60 PRINT "INPUT THE CENTER FREQUENCY
(MZ) ";
70 INPUT CENTER
80 PRINT "INPUT THE SPAN
(MZ) 'I;
90 INPUT SPAN
100 'Send center freq and span to spectrum analyzer
110 'take a sweep to update screen
120 PRINT
130 PRINT
140 PRINT
#l,"CF ";CENTER;"MZ;"
#l,"SP ";SPAN;"MZ;"
#l,"TS;"
150 'find the signal peak with peak search
160 PRINT
#l,"MKPK
HI;"
170 END
Three modifications are made to the previous program in order to include center frequency and
span variables. First, we use two variables, CENTER and SPAN, to store the frequency and
span parameters.
Second, using the BASIC INPUT command, we ask the computer operator to enter the desired
center frequency and span. (See lines 70 and 90 in previous program example). Next, we
modify the output parameter statements so that the values stored in the CENTER and SPAN
variables are sent to the spectrum analyzer. (See lines 120 and 130.) A sweep is taken after the
parameters are sent to the spectrum analyzer, to ensure that the spectrum analyzer screen is
updated before the marker is placed on the highest signal peak.
Writing a Program
2-7
Page 51

Getting Information from the Spectrum Analyzer
The first part of this chapter demonstrated techniques for setting spectrum analyzer
parameters. This section demonstrates a technique for getting information out of the spectrum
analyzer.
For example, in the second program of this chapter, we placed a marker at the highest peak
of a trace and the value of the marker could be read in the upper right-hand corner of the
spectrum analyzer display. In the following program, we will add some commands that will
read the marker’s frequency and amplitude value and return those values to the computer.
Program Example for the HP-IB Interface
10
! FILE :
20 REAL
30 Analyzer=718
40 OUTPUT Analyzer ;
50
!set
60
!real
70 OUTPUT Analyzer ;
80
! set the spectrum
90 OUTPUT Analyzer ;
100 OUTPUT Analyzer ;
110 OUTPUT Analyzer ;
120 OUTPUT Analyzer ;
130 OUTPUT Analyzer ;
140 !ask
150
!amplitude
160 OUTPUT Analyzer ;
170
!send the amplitude value to the computer:
180
ENTER
190
!ask the spectrum analyzer for the marker's
200 !frequency
210
OUTPUT Analyzer;
220
230 ENTER
240
250 PRINT “THE SIGNAL PEAK IS ” ;A,mpmarker ;
260 PRINT ”
270 !set the spectrum analyzer to continuous sweep mode:
280 OUTPUT Analyzer;
290 LOCAL 7
300
!send
!print
END
“MKR”
A-mpmarker,F,reqmarker !define
“IP ; ‘I
the
output
format of the spectrum analyzer for
numbers:
“TDF
P ;
‘I
analyzer parameters:
“SNGLS ; ‘I
“CF
300MZ ;
“SP
200MZ ;
“TS ; I’
“MKPK
HI ;
the spectrum analyzer for the marker's
value:
“MKA?
;
Analyzer;A-mpmarker
value:
“MKF? ; ‘I
the frequency value to the computer:
Analyzer;F,reqmarker
the amplitude and frequency:
dBm
AT ” ;
F-reqmarker/l .E+6; ”
“CONTS; ‘I
”
‘I
‘I
I’
variables
MHz”
First, using the HP BASIC REAL command, we define two variables,
F-reqmarker. The amplitude and frequency values of the marker are stored in these variables.
(See line 20.)
Second, we set the output format of the spectrum analyzer for real numbers with the spectrum
analyzer’s trace data format (TDF) command. (See line 70.) As in our original program, we set
the center frequency and span values. A sweep is taken and the marker is placed on the trace.
Next, we ask the spectrum analyzer for the amplitude value of the marker. We have the
spectrum analyzer send the marker amplitude value to the computer. Note that there can be
only one spectrum analyzer query per programming line. We also ask the spectrum analyzer
for the frequency value of the marker, and we have the spectrum analyzer send the marker
frequency value to the computer. (See lines 100 through 230.)
2-8
Writing a Program
A-mpmarker
and
Page 52

Finally, we print the values on the computer screen:
"THE SIGNAL PEAK IS . . .
dBm
AT . . . MHz"
Before we end the program, we return the spectrum analyzer to continuous-sweep mode and
local control.
Program Example for the RS-232 Interface
10 'File= 232PROG4
20 OPEN
30 PRINT
40 'Set the output format of the spectrum analyzer for
50 'real numbers
60 PRINT
70 'set the spectrum analyzer's parameters
80 PRINT
90 PRINT
100 PRINT
110 PRINT
120 PRINT
130 'ask the spectrum analyzer for the marker's
140 'amplitude value
150 PRINT #l
160 'get
170 INPUT #l,AMPMARKER
180 'ask the spectrum analyzer for the marker's frequency value
190 PRINT #1
200 'get
210 INPUT #l,FREQMARKER
220 'print the amplitude and frequency
230 PRINT "THE SIGNAL PEAK IS
240 PRINT " dbm AT
250 'set the spectrum analyzer to continuous sweep mode
260 PRINT
270 END
"COMl:9600,N,8,1"
AS
#l,"IP;"
#l,"TDF P;"
#l,"SNGLS;"
#l,"CF 300MZ;"
#l,"SP
200MZ;"
#l,"TS;"
#l,"MKPK
HI;"
"MKA'."
the'ampli&rde
from the spectrum analyzer
"MKF'."
the'freq&cy
value from the spectrum analyzer
";FREQMARKER/lOOOOOO!;"
#l,"CONTS;"
#l
";AMPMARKER;
MZ"
First, set the output format of the spectrum analyzer to real numbers with the spectrum
analyzer’s trace data format (TDF) command (line 60).
As in the original program, the center frequency and span values are set and a sweep is taken.
Next, the marker is placed on the trace.
Two additional variables are used for AMPMARKER and FREQMARKER. The amplitude and
frequency values of the marker are stored in these variables (lines 170 and 210). The program
requests the amplitude and frequency values of the marker (lines 150 and 190). Note that
there can be only one spectrum analyzer query per programming line.
Finally, the amplitude and frequency values are displayed on the computer screen:
"THE SIGNAL PEAK IS . . .
dBM
AT . . . MZ"
Writing a Program
2-9
Page 53

Programming Guidelines
1. Perform the measurement manually, keeping track of the sequence of functions used.
2. In the written program, execute an instrument preset (IP) and set single-sweep mode
(SNGLS) before setting other spectrum analyzer functions.
3. Use variables for function values. List variables at the beginning of the program,
4. Activate spectrum analyzer functions in logical order. Place quotation marks around
spectrum analyzer commands. Separate commands with semicolons.
5. After setting spectrum analyzer functions, execute a take sweep (TS) command before
reading data or activating markers.
6. The spectrum analyzer can return only one value per programming line. Do not have more
than one query per programming line.
7. Use the exclamation point (!) to include comment lines when using HP BASIC. Use the
apostrophe or REM to create comment lines when using GW BASIC. (The use of the
exclamation point and the apostrophe to create comment lines are dependent on the
your system.)
2-l 0 Writing a Program
Page 54

3
Programming
Xbpics
What You’ll Learn in This Chapter
This chapter contains the following advanced programming techniques and topics.
n An example of moving and saving trace data from the spectrum analyzer into the computer.
n An example of how spectrum analyzer states are saved with the computer, then returned to
the spectrum analyzer.
n An example of reading trace data from a computer disk.
n An example of saving and recalling instrument states.
n An example of returning the spectrum analyzer to its former state.
n
An example of remotely measuring harmonic distortion.
n A summary of using different formats for trace data transfers.
Many of the programming suggestions discussed in Chapter 2, “Writing a Program,” have been
incorporated into the programs in this chapter.
Note
Ail programming examples for the HP-IB interface in this chapter are written
in HP BASIC 4.0. For the RS-232 interface, examples are written in GW BASIC.
A general knowledge of the BASIC programming language is recommended before reading
this chapter. (Refer to your software documentation manuals.) Chapter 5 of this manual,
“Programming Commands,” defines spectrum analyzer commands alphabetically.
Programming Topics
3-l
Page 55

Controlling Trace Data with a Computer
Using sample programs, this section shows you how to read trace data and store the data with
your computer.
Reading Trace Data
The following program, which has been annotated with comments, reads a trace from the
spectrum analyzer and stores the trace data in a variable.
Program Example for the HP-IB Interface
10
!FILE:
20
!create
30 REAL
40 Analyzer=718
50 OUTPUT
60
!set the output format of the spectrum analyzer for
70
!real
80 OUTPUT Analyzer ;
90
!set
100 OUTPUT Analyzer;
110
OUTPUT Analyzer ;
120 OUTPUT Analyzer ;
130 OUTPUT Analyzer ;
140 OUTPUT Analyzer;
150
160
OUTPUT Analyzer ;
170 OUTPUT Analyzer ;
180
190 OUTPUT Analyzer ;
200
210
ENTER
220 OUTPUT Analyzer ;
230 LOCAL 7
240 END
“IBPROG5”
a 401 point trace array:
Trace,a(l:401)
Analyzer;“IP; ‘I
numbers:
“TDF
P ;
I’
the spectrum analyzer parameters:
“SNGLS; ‘I
“CF
300MZ ;
“SP
200MZ ;
“TS ; ‘I
“MKPK
HI ;
!move
peak to center of spectrum analyzer screen:
“MKCF ; I’
“TS ; ‘I
!ask the spectrum analyzer for trace data:
“TRA? ; ‘I
!send
the trace data to the computer:
Analyzer;Trace-a(*)
“CONTS; I’
‘I
‘I
‘I
Trace data can be read with the computer by making three changes to the program created in
Chapter 2. First, we modify the program to create a 401-point trace array, called Trace-a, in
which the trace data will be stored. Second, the program uses the TRA command to request
trace A data. (The MKA and MKF commands from the previous program have been deleted.)
Third, the spectrum analyzer sends trace A data to the variable, Trace-a.
3-2 Programming Topics
Page 56

Program Example for the RS-232 Interface
10 'File= 232PROG5
20 OPEN
30 'create a
40 DIM
50 PRINT #1
60 'set
70 PRINT
80 ‘set spectrum analyzer parameters
90 PRINT
100 PRINT
110 PRINT
120 PRINT
130 PRINT tl
140 'move
150 PRINT #l
160 PRINT #1
170 'ask
180 PRINT
190 'retrieve trace data from spectrum analyzer
200
210 INPUT
220
230 'set continuous-sweep mode
240 PRINT
250
"COMl:9600,N,8,1"
401-point trace array
TRCA(401)
"IP."
outiut iormat
#l,"TDF P;"
#l,"SNGLS;"
#l,"CF 300MZ;"
#l,"SP
200MZ;”
#l,"TS;"
"MKPK."
peik
to
"MKCF."
3
"TS."
spe&r&
#l,"TRA?;"
FOR
I=1
TO 401
#l,TRCA(I)
NEXT I
#l,"CONTS;"
END
AS
#l
of spectrum analyzer for real numbers
lenter
of spectrum
analyzer screen
,
analyzer for trace data
Trace data can be read with the computer by making three changes to the program created
in Chapter 2. First, we modify the program to create a 401-point trace array, called TRCA
in which trace data will be stored (line 40). Second, the program uses the TRA command to
request trace A data (line 180). (The MKA and MKF commands in the original program have
been deleted.) Third, we will have the spectrum analyzer send the trace A data into the TRCA
variable (line 210).
Programming Topics 3-3
Page 57

Saving Trace Data
The trace data in the previous program can be stored on a computer disk by making three
program modifications.
10
!FILE:
20
!create
30 REAL
40 Analyzer=718
50 OUTPUT
60
!set the output format of the spectrum analyzer for
70
!real
80 OUTPUT
90
!set the spectrum analyzer parameters:
100 OUTPUT
110 OUTPUT
120 OUTPUT
130 OUTPUT
140 OUTPUT
150
!move
160 OUTPUT
170 OUTPUT
180
!ask the spectrum analyzer for trace data:
190 OUTPUT
200
210 ENTER
220
230
240 CREATE BDAT
250
260 ASSIGN @File TO "DATA-A"
270
280 OUTPUT
290 OUTPUT
300 LOCAL 7
310
320 ASSIGN
330 END
!send
!create
!file
!assign
!send
!close
"IBPROGG"
a 401 point trace array:
Trace,a(l:401)
Analyzer;"IP;"
numbers:
Analyzer;"TDF P;"
Analyzer;"SNGLS;"
Analyzer;"CF 300MZ;"
Analyzer;"SP 200MZ;"
Analyzer;"TS;"
Analyzer;"MKPK HI;"
peak to center of spectrum analyzer screen:
Analyzer;"MKCF;"
Analyzer;"TS;"
Analyzer;"TRA?;"
the trace data to the computer:
Analyzer;Trace-a(*)
file to store trace
is 13 records long:
"DATA-A",13
path for the file:
trace data to the file:
OFile;Trace,a(*)
Analyzer;"CONTS;"
file:
@File
TO
*
First, using the CREATE command, we create an empty file on the disk for storing the trace.
The file is 13 records long. (To determine the number of records, the 401-point trace is
multiplied by 8 bytes per point, the storage required for real numbers, then divided by 256
bytes per record. The result is rounded to the next largest integer.)
Next, we assign an input and an output path to the file DATA-A. Then, we send the trace data
to the file. (See lines 260 through 280.) Finally, in line 320, we close the file.
Note
3-4 Programming Topics
If a program containing the CREATE command is run twice, the computer will
report an error the second time because the file already exists. To prevent this
error, place an exclamation mark before the CREATE command to “comment
out” the line after the first run. (See line 240.)
Page 58

Program Example for the RS-232 Interface
10 'File= 232PROG6
20 OPEN
30 'create a
40 DIM
50 PRINT
60 'set output format of spectrum analyzer for real numbers
70 PRINT
80 'set spectrum analyzer parameters
90 PRINT #l
100 PRINT
110 PRINT
120 PRINT #1
130 PRINT
140 'move peak to center of spectrum analyzer screen
150 PRINT #1
160 PRINT
170 'ask spectrum analyzer for trace data
180 PRINT #1
190 'input the
200
210 INPUT
220
230 'create file to store trace on disk
240 OPEN
250 'print the trace data to the disk
260
270 PRINT
280
290 'put spectrum analyzer into continuous-sweep mode
300 PRINT tl
310 END
"COMl:9600,N,8,1"
401-point
TRCA(401)
#l,"IP;"
#l,"TDF P;"
"SNGLS."
#;,"CF 3;OMZ;"
tl,"SP
200MZ;"
"TS."
#l:"MKPK;"
"MKCF."
#l:"TS;"'
"TRA'."
t&e
FOR
I=1
TO 401
#l,TRCA(I)
NEXT I
FOR
"TRACEA"
I=1
TO 401
FOR OUTPUT AS
#2,TRCA(I)
NEXT I
"CONTS."
,
AS
#l
trace array
data to the BASIC program
'data input in
dBm
#2
,
Using the OPEN command, we create an empty file on the disk for storing the trace and assign
an input and an output path to the file
TRACEA.
Then we send the trace data to the file. (See
lines 260 through 280.)
Lines 20 through 220 of
232PROG6
are identical to the previous program,
232PROG5.
Programming Topics 3-5
Page 59

Reading Trace Data from a Computer Disk
If we want to return trace data to the spectrum analyzer for later viewing, we must work
the “saving” process in reverse. The following program reads a trace previously stored on a
computer disk and stores the trace in an array variable.
Program Example for the HP-IB Interface
10
!FILE:
20
!create
30 REAL
40
!assign
50
!trace
60 ASSIGN @File TO "DATA-A"
70
!enter
80 ENTER
90
!close
100 ASSIGN
110 END
First, in line 30, the program creates a 401-point trace array. Then, in line 60, the program
assigns a path to the trace file. Finally, in line 80, the program sends the trace data to the
variable
Trace-N *).
Program Example for the RS-232 Interface
"IBPROG7"
a
401-point
Trace-a(l:401)
path to the file with the
in it:
trace into variable Trace-a:
QFile;Trace-a(*)
file:
OFile
TO
trace array:
*
10 'File =
20 OPEN
30 'create a
40 DIM
50 'assign number to file with trace data in it
60 OPEN
70 'enter the trace into the array
80 FOR
90 INPUT
100 NEXT I
110 CLOSE
120 END
First, in line 40, the program creates a 401-point trace array. Then, in lines 60 through 100, the
program reads the disk file
232PROG7
"COMl:9600,N,8,1"
401-point
TRCA(401)
"TRACEA"
I=1
TO 401
#2,TRCA(I)
FOR INPUT AS
trace array
TRACEA
AS
#l
#2
and stores data in the array variable TRCA.
3-6 Programming Topics
Page 60

Saving and Recalling Instrument States
The spectrum analyzer’s control settings (or its “state”) can be saved with a computer and
retrieved later to streamline test sequences or repeat manual measurements. Control settings
can be stored in one of eight state registers in the spectrum analyzer, in computer memory, or
on a computer disk.
The first program in this section demonstrates techniques for saving an instrument state, along
with its current trace A data. The second program demonstrates how the state information and
the trace data is read from the computer and returned to the spectrum analyzer.
If you wish to save states in the spectrum analyzer, see the descriptions of the save state
(SAVES) and recall state (RCLS) commands in Chapter 5.
Saving the Spectrum Analyzer’s State
The following two programs read and store a trace from the spectrum analyzer.
Programming Topics 3-7
Page 61

Program Example for the HP-IB Interface
10
!FILE:
20
!define
30 DIM
40 !create
50 INTEGER
"IBPROG8"
202 character string:
Learn_string$[202]
401-point array to store trace:
Trace,a(l:401)
60 Analyzer=718
70
!set output format for two byte integers:
80 OUTPUT
90
!ask spectrum analyzer for trace data:
100 OUTPUT
110
120 ENTER Analyzer USING
130
140 OUTPUT
150 ENTER Analyzer USING
160
Analyzer;"TDF B;"
Analyzer;"TRA?;"
!send
trace to the computer:
"t,W";Trace,a(*)
!get learnstring from spectrum analyzer:
Analyzer;"OL;"
"#,202A";Learn_string$
!create
file to store trace:
170 CREATE BDAT "STATE",4
180
!assign
190 ASSIGN
200
!send
210 OUTPUT
220 !return
230 OUTPUT
240
!close
250 ASSIGN @File TO
path to the file:
@File
TO "STATE"
trace to the file:
QFile;Learn,string$,Trace_a(*)
output format to default mode:
Analyzer;"TDF P;"
file:
*
260 END
3-g Programming Topics
Page 62

The HP-IB version stores the trace in the variable called Trace-a(*). The state of the spectrum
analyzer is stored in the variable Learn-string& These two variables are then saved in a file
called STATE. Finally, the file is stored on a disk.
Using the data stored in STATE, the spectrum analyzer settings can be reset according to the
saved state. Then, using the stored trace data, trace data can be viewed on the spectrum
analyzer display.
Line 30 gives the dimensions of the learn string using the HP BASIC DIM command. Learn
strings for the spectrum analyzer require 202 bytes of storage space. Also see the output learn
string (OL) command.
Line 70 uses TDF B to format the output in binary. Binary provides the fastest data transfer
and requires the least amount of memory to store data. Each data point is transferred in
binary as two 8-bit bytes. The data points are in the internal representation of measurement
data. (See “Different Formats for Trace Data Transfers” at the end of this chapter for more
information about trace data formats.)
When the trace and state data are sent from the spectrum analyzer to the computer, they
must be formatted. Lines 120 and 150 format trace data with the HP BASIC USING command.
In the formatting statement,
I‘#”
indicates that the statement is terminated when the last
ENTER item is terminated. EOI (end-or-identify) and LF (line feed) are item terminators, and
early termination will result in an inaccurate learn string. “W” specifies word format. “202A”
indicates the size of the learn string.
Line 170 creates a file called STATE that is 4 records long. (lb determine the number of records
for the computer in our example, the 401-point trace is multiplied by 2 bytes per point and the
202-byte learn string is added to give 1004 bytes total. This total is divided by 256 bytes per
record, resulting in 4 records.)
Note
If the program containing the CREATE command is run twice, the computer
will report an error the second time because the file already exists. lb prevent
this, place an exclamation mark before the CREATE command to “comment
out” line 170 after the program has been executed.
Programming Topics
3-9
Page 63

Program Example for the RS-232 Interface
=
10 'File
20 OPEN
30 'Define 202-character string
40 DIM
50 'Create 802-character string to store trace data
60 DIM
70 DIM
80 'ask spectrum analyzer for trace data in binary format
90 PRINT
100 'enter trace data from spectrum analyzer
110
TRl$=INPUT(200,#1)
120
TR2$=INPUT(200,#1)
130
TR3$=INPUT(200,#1)
140
TR4$=INPUT(200,#1)
150
TR5$=INPUT(2,#1)
160 'ask for learn string from spectrum analyzer
170 PRINT
180 'get learn string from spectrum analyzer
190
LEARN$=INPUT$(202,#1>
200 'create file to store trace on disk
210 OPEN
220 'change ASCII data to integers for disk storage
230 'because ASCII 26 will put EOF on disk
240 DEFINT X,Y,I 'integer variables
250 DIM
260 'first format the learn string
270 FOR I= 1 TO 202
280 'get ASCII character from string
290
L2$=MID$(LEARN$,I,l)
300 'make integer of ASCII value O-255
310
Xl(I)=ASC(L2$)
320 NEXT I
330 'format the data strings
340
T5=1
350
TRG$=TRl$
360
GOSUB
370
T5=201
380
TR6$=TR2$
390
GOSUB
400
T5=401
410
TR6$=TR3$
420
GOSUB
232PROG8
"COMl:9600,N,8,1"
AS
#I
LEARN$(202)
TR1$(200>,TR2$(200>,TR3$(200)
TR4$(2OO>,TR5$(2>,TR6$(200)
#l,"TDF
B;
TRA?;"
'first 200 characters
'second 200 characters
'third 200 characters
'fourth 200 characters
'last two characters
#l,"OL;"
"TRACEA"
Xl(202),Yl(802)
FOR OUTPUT AS
#2
'arrays for the data
'set counter
'set string to be converted
620 'do the conversion
'set counter
'set string to be converted
620 'do conversion
620
3-l 0
Programming Topics
Page 64

430
T5=601
440
TR6$=TR4$
450
GOSUB
620
460 'convert last two characters
470
L2$=MID$(TRS$,l,l)
480
Yl(80l)=ASC(L2$)
490
L2$=MID$(TR5$,2,1)
500
Y(802)=ASC(L2$)
510 'data is now formatted, write to disk
520 FOR
530 PRINT
I=1
TO 202
#2,X1(1)
540 NEXT I
550 FOR
560 PRINT
I=1
TO 802
#2,Yl(I)
570 NEXT I
580 'close the data file
590 CLOSE
600 GOT0 680
610 'subroutine for converting data:
620 FOR
630
640
650
I=1
TO 200
L2$=MID$(TRG$,I,l)
'get ASCII character
Yl(T5)=ASC(L2$) 'set value in array
T5=T5+1
660 NEXT I
670 RETURN
'done with conversion
680 END
The previous program reads a trace from the spectrum analyzer, then stores it in the variable
called TRCA. The state of the spectrum analyzer is stored in the variable
variables are then saved in a file called
TRACEA.
Finally, the file is stored on a disk.
LEARNS.
These two
Using the data stored in TRCA, the spectrum analyzer settings can be reset according to the
saved state. Then, using the stored trace data, trace data can be viewed on the spectrum
analyzer display.
Line 40 gives the dimensions of the learn string using the GW BASIC DIM command. Learn
strings for the spectrum analyzer require 202 bytes of storage space. Refer to the output learn
string (OL) command description in Chapter 5 for more information.
Line 90 uses TDF B to format the output in binary. Binary provides the fastest data transfer
and requires the least amount of memory to store data. Each data point is transferred in
binary as two 8-bit bytes. The data points are in the internal representation of measurement
data. (See “Different Formats for Trace Data Transfers” at the end of this chapter for more
information about trace data formats.)
When the trace and state data is sent from the spectrum analyzer to the computer, it must be
formatted. Lines 270 through 320 format the trace data.
Programming Topics
3-l
1
Page 65

Returning the Spectrum Analyzer to its Former State
The following programs read a trace stored in a file and load it into a variable.
Program Example for the HP-IB Interface
10
!FILE:
20
!define
30 DIM
40 !create
50 INTEGER
60 Analyzer=718
70
!assign
80 ASSIGN @File TO "STATE"
90
!get values for Learn-string$
100
!and Trace-a(*) from disk:
110 ENTER
120
!send
130 OUTPUT
140 ENTER Analyzer
150 OUTPUT
160
!set single sweep mode:
170 OUTPUT
180
!prepare
190
!the computer:
200 OUTPUT
210 !send
220 OUTPUT Analyzer USING
230 !view
240 OUTPUT
250 !close
260 ASSIGN
270 END
"IBPROGS"
202 character string:
Learn,string$[202]
401 point array to store trace:
Trace,a(l:401)
path to the file:
OFile;Learn-string$,Trace,a(*)
learnstring to spectrum analyzer:
Analyzer;"IP
Analyzer;Learn-string$
Analyzer;"SNGLS;"
spectrum analyzer for a trace from
Analyzer;"TRA #A";
trace to the spectrum analyzer
trace to see it was sent:
Analyzer;"VIEW TRA;"
file:
@File
TO
DONE;"
"#,W";802,Trace-a(*)
*
The HP-IB program reads a trace stored in the file STATE, then loads it into the variable
Trace-$ *).
First, the settings of the spectrum analyzer that were stored in the variable
recalled. The spectrum analyzer state is changed to the same state as when the trace was
stored. Then previously stored trace data is returned to the spectrum analyzer and the trace is
viewed on the spectrum analyzer screen. Finally, line 220 uses the HP BASIC USING command
to format the trace data.
3-l
2 Programming Topics
LEARN$
are
Page 66

Program Example for the RS-232 Interface
10 'File= 232PROG9
20 OPEN
30 DEFINT
40 'define 202-character string
50 DIM
60 'create an 802-character string to store disk data
70 DIM
80 DIM
90 'open disk file
100 OPEN
110 'enter learn array from disk
120 FOR
130 INPUT
140 NEXT I
150 'enter trace data from disk
160 FOR
170 INPUT
180 NEXT I
190 'close the disk file
200 CLOSE
210 'format the integer data into strings
220 'for the spectrum analyzer.
230
240 FOR
250
260 NEXT I
270 'format the trace data
280
290
300
310
320
330
340
"COMl:9600,N,8,1"
X,Y,I
'integer variable
AS
#I
LEARN$(202),Xl(202)
TR1$(200>,TR2$(200>,TR3$(200),TR4$(200)
TR5$(2>,TR6$(2OO>,Yl(802)
"TRACEA"
"TRACEA"
I=1
TO 202
#2,X1(1)
I=1
TO 802
FOR INPUT AS
#2
'get integer variable from disk
#2,Yl(I)
#2
See
232PROG8
for explanation
LEARN$="" 'null out the learn string
I=1
TO 202
'format learn string first
LEARN$=LEARN$+CHR$(Xl(I))
12=1
GOSUB
TRl$=TRG$
'set the counter
500 'do the conversion
'set the string
12=201
GOSUB
500
'do the conversion
TR2$=TR6$
12=401
Programming Topics
3-13
Page 67

350
GOSUB
500
360
TR3$=TR6$
370
12=601
380
GOSUB
500
390
TR4$=TR6$
400 'format last two characters
410
TR5$=""
420
TR5$=TR5$+CHR$(Yl(80l))+CHR$(Y1(802))
430 'write to spectrum analyzer
440 PRINT #l,LEARN$
450 'output trace data
460 PRINT
470 PRINT
#l,"IB";TRl$;TR2$;TR3$;TR4$;TR5$;
#l,"VIEW TRB;"
480 GOT0 560 'end program
490 'subroutine for converting integer data to ASCII
500
TR6$=""
510 FOR
520
530
I=1
TRS$=TRS$+CHR$(Yl(IZ>)
12=12+1
'set the string to a null value
TO 200
540 NEXT I
550 RETURN 'done with conversion
560 END
The RS-232 program,
232PROG9,
reads a trace stored in the file
TRACEA
and loads it into the
variable TRCA. This program assumes that trace data is stored on the disk from the previous
program example,
First, the settings of the spectrum analyzer that were stored in the variable
232PROG8.
LEARN$
are
recalled. The spectrum analyzer state is changed to the same state as when the trace was
stored. Then previously stored trace data is returned to the spectrum analyzer and the trace is
viewed on the spectrum analyzer screen.
3-14 Programming Topics
Page 68

Measuring Harmonic Distortion
The harmonic distortion program presented here illustrates how the spectrum analyzer can
be directed by a computer to make a complete measurement. Measuring the percent of total
harmonic distortion is tedious when performed manually: it involves tuning to the fundamental
and to each harmonic of interest, recording the amplitude of each signal, converting these
amplitudes to linear units (volts), and calculating the result using a formula. The following
program measures percent of total harmonic distortion automatically, quickly, and accurately.
The program operates as if we were making the measurement manually.
Note
This program is designed to measure harmonics of a signal that is greater than
20MHz.
Program Example for the HP-IB Interface
10
!FILE:
20 ASSIGN
30 Variables: ! define variables:
40 REAL Fundamental,Fund-amptd-v,Fund-amptd-dbm
50 REAL
60 INTEGER Max-harmonic,I,Number
70 !allow
80
Max-harmonic=4
90 ALLOCATE REAL
100 ALLOCATE REAL
110
GOSUB
120
!ask for the frequency of the fundamental:
130
OUTPUT CRT USING
140 OUTPUT CRT USING
150
OUTPUT CRT USING “10X ,K” ; ”ENTER FUNDAMENTAL FREQUENCY IN MHz”
160 OUTPUT CRT USING “10X
170 INPUT Fundamental
180
GOSUB
190 Fundamental: ! write message on screen:
200 DISP “MEASURING FUNDAMENTAL”
210
220 !take
230 OUTPUT
240
250 ! 20
260 OUTPUT
270 OUTPUT
280 !put a marker on signal peak, move marker to
290 !reference
300 OUTPUT
310 !find
320
!preset
!tune
!narrow
“THD-TEST”
QSa
TO 718
Prcnt,distort,Sum-sqr
user to change the number of harmonics:
Harmonic-v(2:Max-harmonic)
Harmonic-dbc(2:Max,harmonic)
Clearscreen
Clearscreen ! clear the alpha screen
the spectrum analyzer, set single sweep mode, and
sweep:
@Sa;“IP;
the spectrum analyzer to the fundamental freq and set
MHz span:
OSa- “CF ‘I ;
BISai “SP
%a; “MKPK
signal peak,
span:
SNGLS; TS;”
20MZ; TS;
level:
! assign IO
! clear the alpha screen
“4/,lOX,K,3/“;
"lOX,K";"CONNECT
,K”;
“WHEN READY, PRESS ENTER
Fundamental;
‘I
HI ; MKRL; TS;
activate signal track, and
path to spectrum analyzer
"***HARMONIC DISTORTION***"
SOURCE TO INPUT"
“MZ; ”
”
”
Programming Topics 3-15
Page 69

330 OUTPUT
340 OUTPUT
350
!turn
360 OUTPUT
370
380
!find
!of screen:
390 OUTPUT
400
!find
@Sa;"MKPK
OSa;"MKTRACK
HI;
TS;"
ON; SP IOOKZ;
TS;"
off signal track:
QSa;"MKTRACK
OFF;"
the peak of the signal; move peak to center
OSa;"AUNITS V;"!
peak of signal;
MAKE READOUT UNITS VOLTS
send amplitude value to
410 !computer
420
430 OUTPUT
440 ENTER
450
460
470 OUTPUT
480 ENTER
490
500
510 OUTPUT
!enter
the amplitude of the fundamental:
@Sa;"MKPK
HI;
MKA?;"
OSa;Fund,amptd-v
!send
marker frequency to the computer, enter
!frequency
value:
OSa;"MKF?;"
OSa;Fundamental
!make
the fundamental frequency the center freq
!step
size:
OSa;"MKSS;"
520 !set the fundamental frequency units to MHz:
530
Fundamental=Fundamental/l.E+6
540 Harmonics:
!measure
the amplitudes of the harmonics:,
550 FOR Number=2 TO Max-harmonic
560 DISP "MEASURING HARMONIC
570 OUTPUT
580 OUTPUT
590
600
610
!take
!center
!signal
620 OUTPUT
630 OUTPUT
640
!turn
650 OUTPUT
660
670
!find
!enter
680 OUTPUT
690 ENTER
@Sa;"SP 20MZ;"
@Sa;"CF
UP;
TS;" !tune
second sweep to allow spectrum analyzer to move to the
frequency;
track:
@Sa;"TS;"
@Sa;"MKPK
HI; MKTRACK ON; SP IOOKZ;
off signal track:
OSa;"MKTRACK
OFF;"
signal peak;
the amplitude of the harmonic:
OSa;"MKPK
HI;
QSa;Harmonic-v(Number)
#";Number
!set span to 20 MHz
to next harmonic
find the signal peak; activate
TS;"
send amplitude value to computer
MKA?;"
700 NEXT Number
710
720 OUTPUT
730
!set amplitude units to
dBm:
OSa;"AUNITS DBM;"
!calculate
the fundamental amplitude in
dBm
because
740 !it was measured in volts:
750
Fund,amptd_dbm=lO*LGT(Fund_amptd_v^2/.05)
760 !calculate
770
780
!of the harmonics;
!harmonics (dBm):
the sum of the squares of the amplitudes
calculate amplitudes of
790 Sum-sqr=O
800 FOR
810
820
I=2
TO Max-harmonic
Sum,sqr=Sum,sqr+Harmonic,v(I)^2
Harmonic-dbc(I)=20*LGT(Fund-amptd-v/Harmonic-v(1))
830 NEXT I
3-l 6Programming Topics
Page 70

840
850
860
870
880
890 OUTPUT CRT USING
900 OUTPUT CRT USING
910 OUTPUT CRT USING
920 OUTPUT CRT USING
930 OUTPUT CRT USING
940 FOR
950 OUTPUT CRT USING
!calculate
the percent distortion:
Prcnt,distort=SQR(Summ,sqr)/Fund~amptd,v*lOO
GOSUB
Clearscreen
!clear
the alpha screen:
!Output,data:
!send
data to the screen of the computer:
"7/,lX,K"; "HARMONIC DISTORTION RESULTS"
"llX,K,DDDD.D,K";"FREQ
"llX,K,DDDD.D,K";"AMP
"llX,K,DDD.D,K";"2nd
',llX,K,DDD.D,K";"3rd
I=4
TO Max-harmonic
"lOX,DD,K,DDD.D,K";I;"th
=
";Fundamental;" MHz"
=
";Fund-amptd-dbm;" dBm"
HARMONIC =
HARMONIC =
HARMONIC =
960 NEXT I
970 OUTPUT CRT USING
"llX,K,DDD.D,K";"TOTAL
DISTORTION =
980 !
990 LOCAL 7
1000 STOP
1010 !
1020 Clearscreen:
1030 !the statement below presses the
!alpha
clear subroutine
"CLR SCR"
key on
1040 !the keyboard:
1050 OUTPUT KBD USING "#
B"*255
3"
75
1060 RETURN
1070 END
-";Harmonic_dbc(2);"
-";Harmonic,dbc(3);"
dBc"
dBc"
-";Harmonic,dbc(I) dBc"
";Prcnt,distort;" %"
The program
prompts the user to connect a source to the spectrum analyzer
INPUT
and enter
the source frequency. It sets the spectrum analyzer center frequency to the value of the
source, or fundamental, frequency. It measures and records the frequency and amplitude of
the fundamental, then measures and records the amplitude of the second, third, and fourth
harmonics. These values are used to compute percent of harmonic distortion. The result of the
harmonic distortion percentage computation, plus harmonic amplitudes in
dBc
(decibels relative
to the carrier), are displayed on the computer display. Extensive annotation has been added
(after the exclamation points) to help clarify the program.
If necessary, change the number of harmonics in line 80.
Programming Topics 3-17
Page 71

Program Example for the RS-232 Interface
IO 'File = THDTEST
20 OPEN
30 'allow user to change the number of harmonics
40
MAXHARMONIC=
50 DIM
60 'clear the screen
70
CLS
80 'ask for the frequency of the fundamental
90 PRINT
100 PRINT
110 PRINT "CONNECT SOURCE TO ANALYZER INPUT, THEN"
120 PRINT "ENTER FREQUENCY OF THE FUNDAMENTAL IN MHZ"
130 PRINT
140 INPUT FUNDAMENTAL
150
160 'print measuring fundamental on screen
170 PRINT "MEASURING FUNDAMENTAL"
180 'preset the spectrum analyzer, set single-sweep and
185 'take sweep
190 PRINT
200 PRINT #I "DONE."
210 INPUT
220 'tune the spectrum analyzer to the fundamental freq and set
225 '20 MHz span
230 PRINT
240 PRINT
250 PRINT
260 INPUT #l,DONE
270 'put a marker on signal peak, move marker to
275 'reference level
280 PRINT
290 'find signal peak, activate signal track, and
295 'narrow span
300 PRINT
310 PRINT
320 PRINT #I "DONE."
330 INPUT
340 'turn off signal track
350 PRINT
360 'find peak of signal,
370 'make units in volts
380 PRINT
390 'find peak of signal, send amplitude value to
395 'computer
400 PRINT
410 INPUT #l,FUNDAMPTDV
420 'send marker frequency to computer, enter frequency
425 'value
430 PRINT
440 INPUT #l,FUNDAMENTAL
450 'make the fundamental frequency the center freq
455 'step size
"COMl:9600,N,8,1"
AS
#I
HARMONICV(lO>,HARMONICDBC(lO)
"*******
HARMONIC DISTORTION
CLS
#l,"IP;SNGLS;TS;"
,
#(DONE
#l,"CF ";FUNDAMENTAL;"MHZ"
#l,"SP 20MZ;TS;"
#l,"DONE;"
#l,"MKPK HI;MKRL;TS;"
#l,"MKPK HI;TS;"
#l,"MKTRACK 0N;SP 1OOKZ;TS;"
,
#(DONE
#l,"MKTRACK
OFF;"
move peak to center of screen
#l,"AUNITS V;"
#l,"MKPK HI;MKA?;"
#l,"MKF?;"
*******"
3-16 Programming Topics
Page 72

460 PRINT
#l,"MKSS;"
470 'set the fundamental frequency units to MHZ
480 FUNDAMENTAL=FUNDAMENTAL/lOOOOOO!
490 FOR NUMBER = 2 TO MAXHARMONIC
500 PRINT "MEASURING HARMONIC
# ";NUMBER
510 'set span and tune to next harmonic
520 PRINT
530 PRINT
540 PRINT
#l,"SP 20MZ;"
#l,"CF UP;TS;"
#l,"DONE;"
550 INPUT #l,DONE
560 'take a second sweep to allow spectrum analyzer to move to
570 'the center frequency, find the signal peak,
575 'activate the signal track
580 PRINT #I
590 PRINT
600 PRINT
610 'find signal peak,
"TS."
#l:"MK;K
#l,"MKTRACK
HI;MKTRACK
OFF;"
0N;SP 100KZ;TS;"
send amplitude value to computer
620 'enter amplitude of harmonic
630 PRINT
640 INPUT
#l,"MKPK HI;MKA?;"
#l,HARMONICV(NUMBER)
650 NEXT NUMBER
660 'set amplitude units to dBm
670 PRINT #l,"AUNITS
680 'calculate the fundamental amplitude in
DBM;"
dBm
because
690 'it was measured in volts
700
FUNDAMPTDDBM=lO*(LOG(FUNDAMPTDV-2/.05)/2.3026)
710 'calculate the sum of the squares of the amplitudes
720 'of the harmonics, calculate amplitudes of
725 'harmonics
(dBm)
730 SUMSQR=O
740 FOR
I=2
TO MAXHARMONIC
750 SUMSQR=SUMSQR+HARMONICV(I)-2
760
HARMONICDBC(I>=20*(LOG(FUNDAMPTDV/HARMONICV(I))/2.3O26)
770
NEXT I
780 'calculate the percent distortion
790
PRCNTDISTORT=SQR(SUMSQR)/FUNDAMPTDV*lOO
800
CLS
810 'output the data
820 PRINT
830 PRINT "FREQUENCY =
840 PRINT “AMPLITUDE = ” ; FUNDAMPTDDBM; ”
850 FOR
860 PRINT
870
NEXT I
880 PRINT "TOTAL DISTORTION =
“*******
I=2
TO MAXHARMONIC
HARMONIC DISTORTION RESULTS
“HARMONIC #
";FUNDAMENTAL;"MHZ"
dbc”
‘I;
I; ‘I =
-‘I ; HARMONICDBC(1) ; ‘I dbm”
";PRCNTDISTORT;" %"
*******”
890 END
The RS-232 program prompts the operator to connect a source to the spectrum analyzer INPUT
and enter the source frequency. It sets the spectrum analyzer center frequency to the value of
the source, or fundamental, frequency. It measures and records the frequency and amplitude
of the fundamental, then measures and records the amplitude of the second, third, and fourth
harmonics. These values are used to compute percent of harmonic distortion. The results of
the harmonic distortion percentage computation, plus harmonic amplitude in
dBc
(decibels
relative to the carrier), are displayed on the computer display.
If necessary, change the number of harmonics in line 40.
Programming Topics 3-19
Page 73

Different Formats for Trace Data Transfers
Two different ways to format trace data using the TDF command were introduced earlier in
this chapter (TDF P and TDF B). This section describes all the available trace data formats.
The HP 8590 Series spectrum analyzer provides five formats for trace data transfers: real
number (P) format, binary (B) format, A-block format, I-block format, and measurement units
(M) format.
P Format
The P format allows you to receive or send trace data in a real-number format. This is the
default format when the instrument is powered up. Numbers are in
or watts. The
may be an advantage if you wish to use the data later in a program. However, data transfers
using P format tend to be slow and take up a lot of memory (compared to binary format, the P
format can take up to four times the amount of memory). Data is transferred as ASCII type.
Although the spectrum analyzer can send the trace data to the computer as real numbers, the
trace data cannot be sent back to the spectrum analyzer without changing the trace data to
measurement units (integers). See the following example.
AUNITS
command can be used to specify the amplitude units. Real-number data
dBm, dBmV, dBpV,
volts,
3-20
Programming Topics
Page 74

Example of Using the P Format
This example sends trace datatothe computer and backtothe spectrum analyzer using P
format.
Note
The spectrum analyzer mustbeinthelog amplitude scale to use the TDF P
format.
1 REAL
10 OUTPUT
20 OUTPUT
30 ENTER
40 OUTPUT
50 OUTPUT
Trace_data(l:401)
718;"IP;CF
300MHZ;SP
718;"TDF P;TRA?;"
718;Trace_data(*)
718;"VIEW
718*"RL'*"
'* ,
TRA;MOV
20MHZ;SNGLS;TS;"
TRA,O;"
60 DISP "PRESS CONTINUE WHEN READY"
70 PAUSE
80 ENTER 718;RefJevel
90 MAT
100 MAT
110 MAT
120 OUTPUT
130 OUTPUT
Trace-data=Trace-data-(Ref-level)
Trace,data=Trace-data*(lOO)
Trace,data=Trace_data+(8000)
718m"TRA I).
718ITrace_data(*)
140 LOCAL 718
150 END
Declare an array for trace data.
Zzke a measurement sweep.
Activate the P format, output
trace A data.
The computer receives trace A
data from the spectrum analyzer
lb v&f@ that the trace data is
transferred back to the spectrum
analyzq
set trace A to zeros.
Determine the amplitude of the
reference level. The amplitude
of the reference level is used to
change the integers sent to the
spectrum analyzer into real numbers.
Get the refsrence level.
These lines change the real trace
data (stored in Trace-data) into
integers (in measurem.ent units).
Sends the trace data back to the
spectrum analyzer in measurement units.
The trace data is sent to the computer in parameter units.
scientific unit.
units
(dBm, dBmV, dBpV,
For the TDF P format, the parameter unit depends on the current amplitude
V, W). Use the
AUNITS
command to change the units.
A
parameter unit is a standard
For more detailed information about the P format, see the description for TDF in Chapter 5.
Programming Topics
3-21
Page 75

B Format
The B format allows you to receive or send trace data in a binary format. The B format
provides the fastest data transfer and requires the least amount of memory to store data.
Each data point is transferred in binary as two 8-bit bytes. The data points are in the internal
representation of measurement units (0 to 8000). Unlike the A-block format, the B format does
not send a header. An end-or-identify (EOI) is sent with the last byte of data.
Example of Using the B Format
This example sends trace data from the spectrum analyzer in B format. The trace data format
must be changed to A-block format to return the trace data to the spectrum analyzer. See
following example.
Note
It is not possible to return data to the spectrum analyzer using binary format.
You must use either A-block or I-block format to return the trace data to the
spectrum analyzer.
10 INTEGER
20 ASSIGN
30 OUTPUT
40 OUTPUT
50 ENTER
60 OUTPUT
70 OUTPUT
Tra_binary(l:401)
QSa
TO
718;FORMAT
OSa;"IP;CF
300MZ;SP
OFF
@Sa;"MDS W;TDF B;TRA?;"
OSa;Tra,binary(*)
@Sa*"TDF A*"
,
J
6Sa;"MOV TRA,O;"
20MZ;SNGLS;TS;" T&kesameasurenwntsweep.
80 DISP "PRESS CONTINUE WHEN READY"
90 PAUSE
100 OUTPUT
110 OUTPUT
120 OUTPUT
@Sa
USING
"#,K,W";"TRA#A",802
OSa;Tra,binary(*)
OSa;"VIEW TRA;"
130 LOCAL 718
140 END
Tra3inary
stores the trace data.
Outputs trace A data.
Changes the trace
data
format to A-
block format.
lb
ve@fy
that the trace data is sent
back to the spectrum
analyq
move
all zeros into trace A.
Prepares the spectrum analyzer for
the trace
data.
Transfers the trace data back to the
spectrum
analyzevz
The result is transmitted as binary information. The MDS command can be used to change the
data format from two 8-bit bytes to one 8-bit byte. For more detailed information about the B
format and the MDS command, see the descriptions for TDF and MDS in Chapter 5.
Binary data can be converted to
change the trace data (in measurement units) to a real logarithmic number
dBm
= ((trace data - 8000) x 0.01) + reference level(in
To
change the trace data (in measurement units) to linear data (volts):
3-22 Programming Topics
dBm
volts =
or volts. For example, use the following equation to
(dBm):
dBm)
reference level
8000
x trace data
>
Page 76

The following programming converts binary data to
dBm.
10
20
30
40
50
60
70
80
90
100
110
120
130
140
150
160
170
180
190
200
210
220
! 859X binary data to real numbers
Sa=718
ASSIGN
INTEGER
OUTPUT
OUTPUT
ENTER
PRINT
OUTPUT
ENTER
(OSa,bin
TO Sa;FORMAT OFF
Trace-a(l:401)
Sa;"AUNITS DBM;"
Sa*"RL?*"
Sa;Ref-Ik
Ref-lev
Sa;"TDF B;TRA?;"
OSa-bin;Trace-a(*)
! now the spectrum analyzer has all the data
! to determine the measured trace data
REAL
Trace_a_real(l:401)
MAT Trace-a= Trace-a-(8000) ! Results in below ref
! level
MAT Trace-a-real=
Trace,a*(.Ol)!
now in hundredths of db
! below ref lev
MAT Trace-a-real=
FOR
I=1
TO 401
Trace-a-real+(Ref-lev)
PRINT Trace-a-real(I)
NEXT I
END
The following programming converts binary data to volts.
10
20
30
40
50
60
70
80
90
100
110
120
130
140
150
160
170
180
! 859X binary data to real numbers (linear)
Sa=718
ASSIGN
INTEGER
OUTPUT
OUTPUT
ENTER
(QSa-bin
TO Sa;FORMAT OFF
Trace-a(l:401)
Sa*"AUNITS V*"
SaI"RL?;" '
Sa;Ref-lev
Ref-lev-factor=Ref_lev/8000
OUTPUT
ENTER
Sa;"TDF B;TRA?;"
OSa,bin;Trace,a(*)
! now the spectrum analyzer has all the data
! to determine the measured trace data
REAL
Trace,a,real(l:401)
MAT Trace-a-real=
FOR
I=1
TO 401
Trace-a*(Ref,lev,factor)
PRINT Trace-a-real(I)
NEXT I
END
Programming Topics
3-23
Page 77

A-Block Format
The A-block format is similar to binary format in that each data point is sent as two 8-bit bytes
(this, too, is in the internal representation of measurement data). A-block format also transfers
a four-byte header before the 401 points of trace data. These bytes are the ASCII character
“A”, and two-byte number representing the length of the trace data, followed by the data
“f’,
bytes.
Example of Using the A-Block Format
This example sends trace data from the spectrum analyzer to the computer and back to the
spectrum analyzer in A-block format.
10 INTEGER
Tra_binary(l:401)
Declare an array for trace
data.
20 DIM
30 OUTPUT
40 OUTPUT
Header$[4]
718;"IP;CF
718;"MDS
300MZ;SP
W;TDF
A;TRA?;"
20MZ;SNGLS;TS;"
Declare
A,
length
llxke
a string for the
MSB
length, and LSB
heao!.ex
a
mxxzsurem.ent
sweep.
Send trace A to the com-
puter in A-block format.
50 ENTER 718 USING
"#,4A,401(W)";Header$,Tra_binary(*)
The computer receives the
header and the trace
data.
60 PRINT "PRESS CONTINUE TO RETURN DATA TO THE ANALYZER"
70 PAUSE
80 OUTPUT
90 OUTPUT
100 OUTPUT
"#,K,W,40l(W)"; "TRA#A",802,Tra_binary(*),";"
718;"IP;TS;VIEW TRA;"
718e"TDF A-"
71;
USING'
View trace A.
The spectrum
wives
the trace
anulgzer re-
data
from
the computex
110 END
The transferred trace data consists of
#A,
a two-byte number representing the most significant
byte (MSB) length and the least significant byte (LSB) length, and the data bytes. Depending on
the terminal you are using, the data bytes may appear as symbols instead of numbers. Consult
your computer documentation to determine the numeric value of the data bytes.
For more detailed information about the A-block format and the MDS command, see the
descriptions for TDF and MDS in Chapter 5.
#,
3-24
Programming Topics
Page 78

I-Block Format
Note
The I-block format is not recommended for use with the RS-232 interface
(Option 043).
The I-block format transfers data points as two 8-bit bytes in the internal representation of
measurement data. In addition to transferring trace data, I-block format also transfers the
characters
I‘#”
and “I”. These characters indicate that the trace data is in I-block format. The
I-block format allows the spectrum analyzer to accept up to 401 points of trace data when
using I-block format. Fewer than 401 points of trace data can be specified, and the spectrum
analyzer will accept data until an EOI signal is sent to it. Therefore, returning the trace data to
the spectrum analyzer requires an important instruction, END. (See following example.)
Example of Using the I-Block Format
This example sends trace data from the spectrum analyzer to the computer and back to the
spectrum analyzer in I-block format.
10 INTEGER
Tra_binary(l:401)
Dec.kzre
an array for trace
data.
20 DIM
Header$[Z]
Declare an array for #, I
header:
30 OUTPUT
40 OUTPUT
718;"IP;CF
300MZ;SP 20MZ;SNGLS;TS;"
718;"TDF I;TRA?;"
llzke a
mxxsurement
Send trace A
data
sweep.
in
block format.
50 ENTER 718 USING
"#,2A,40l(W)";Header$,Tra,binary(*)
The computer receives the
header
and trace A
data.
60 PRINT "PRESS CONTINUE TO RETURN DATA TO THE ANALYZER"
70 PAUSE
80 OUTPUT
90 OUTPUT
100 OUTPUT 718 USING
Tra-binary(*)
718;"IP;TS;VIEW TRA;"
718;"TDF
I;"
"#,K,W,401(W)";"TRA#I",
View trace A.
The trace data is returned
to the spectrum analyzer
110 END
I-
The END statement in line 100 sends the spectrum analyzer the last data byte stored in the
array and sets the HP-IB EOI line “true,”
as required by the I-block format.
The transferred trace data consists of #I, followed by data bytes until the EOI line is set true.
For more detailed information about the I-block format and the MDS command, see the
descriptions for TDF and MDS in Chapter 5.
Programming Topics 3-25
Page 79

M Format
The M format is for sending trace data only. It formats the trace data in the internal format
used by the spectrum analyzer, also known as measurement units.
Refer to Figure 3-1. The displayed amplitude of each element falls
on
one of 8000 vertical
points with 8000 equal to the reference level. For log scale data, each point is equal to 0.01
The peak of the signal in Figure 3-l is equal to -20
dBm,
or two divisions below the reference
level. In measurement units, it is equal to 6000 (8000 - 2000 = 6000). In linear mode, each
point has a resolution of [reference level in volts divided by
is -32,768 to
+32,767.
In practice however, the range limits can be reached during trace math
SOOO].
The range of internal data
operations only.
+32,767
-
7
8160-
8000
Y
-
LOG
10
DB/
J
4
dB.
-32,768-
\y
ii
O-
I
Figure 3-1. Measurement Unit Range and Trace Amplitudes
5
/
cull9e
3-26
Programming Topics
Page 80

‘Ihble
3-1. Measurement Units
Index
Number
1
A number within the range of 8161 to 32,767 measurement units is obtainable
Description
with trace math operations only.
The area from 8000 (reference level) to 8160 (1.6 dB above reference level)
represents the amount a trace element’s amplitude can exceed the top graticule
and still be valid.
The area from 0 to 8000 represents the displayed range for trace amplitude
data. The range of 0 to 8000 varies according to the amplitude scale of the
spectrum analyzer as follows:
n
In 10 dB/division, the range is from 0 to 8000.
n
In 5 dB/div, the range is from 4000 to 8000.
w
In 2 dB/div, the range is from 8000 to 6000.
n
In 1 dB/div, the range is from 8000 to 7000.
A number within the range of 0 to -32,768 measurement units is obtainable
with
trace math operations only.
Example of Using the M Format
This example sends trace data from the spectrum analyzer to the computer in M format.
10 INTEGER
30 OUTPUT
40 OUTPUT
50 ENTER
A(l:401)
718;"IP;CF
718;"TDF M;TRA?;"
718;A(*)
60 PRINT A(*)
70
END
300MZ;SP
Llimension
20MZ;SNGLS;TS;" lbkeawz.easurewwntsweep.
Send trace A
The computer receives the trace data.
Print trace data.
array A.
data
in
Mformat.
Note
All trace math functions are done using measurement units. See lkble 5-4 for a
list of all trace math functions. See the description for the AMB command in
Chapter 5 for an example of trace math subtraction in measurement units.
The result is in measurement units (-32768 to
+32767).
the M format, see the description for TDF in Chapter 5.
‘Ihble
3-2 summarizes the different trace data formats.
For more detailed information about
Programming Topics
3-27
Page 81

‘Ihble
3-2. Summary of the Trace Data Formats
Trace
Data
Format
TDF P
TDF B
TDF A
TDF I
TDF M
Description
Real Number
Format
Binary Format
A-Block Data
Format
I-Block Data
Format
Measurement
Data Format
Remarks
Spectrum analyzer must be in log scale to use TDF P. To send the
trace data back to the spectrum analyzer, the data must be
converted to measurement units.
Fastest format for trace data transfers. Use the A-block format
to
send data back to the spectrum analyzer.
n
Trace data preceded by
“A,” and a two-byte number. To use
“#,
the A-block format for sending data, you must provide the
number of data bytes.
Trace data preceded by
“#, ”
and “I. ” This format is not
recommended for use with an RS-232 interface. Unlike using the
A-block format, you do not provide the number of data bytes
when sending data.
TDF M cannot be used to send trace data back to the spectrum
analyzer.
3-26 Programming Topics
Page 82

Creating and Using Downloadable Programs
What You’ll Learn in This Chapter
4
This chapter provides fundamental information about downloadable programs
This chapter contains the following sections:
w
Creating a DLP.
n Executing a
n
Storing
n
Determining the amount of memory needed for a DLP.
n
Using the DLP editor.
n
DLP programming guidelines.
DLP
DLPs
on a RAM card.
(DLPs).
What is a DLP?
A DLP is a sequence of programming commands used to perform a specific operation. You
can define a DLP that is made up of several user-defined functions, user-defined variables,
and user-defined traces, then store the DLP in analyzer memory or on a RAM card. Some
commands used to create
DLPs
are FUNCDEF, VARDEF, ACTDEF, TRDEF, and KEYDEF.
Why Use a DLP?
A DLP provides an easy way to execute programming commands without the use of an
external controller. Almost any instruction that the analyzer can execute over the interface
bus or with front-panel operation can be executed in a DLP
capabilities. In addition,
bus.
DLPs
remain in analyzer memory even when the spectrum analyzer power is turned
off;
the
DLPs
are stored in the battery-backed RAM of the analyzer memory and can be used
repeatedly, whenever needed.
DLPs
have the ability to control other instruments over the instrument
DLPs
can have decision making
Creating and Using Downloadable Programs
4-l
Page 83

Creating a DLP
This section contains information about how to create a DLI? This section contains the
following procedures:
w
Use a user-defined function within a DLP.
w
Use a user-defined variable within a DLI?
n Use a user-defined trace within a
n Enter values into a
n
Create a modular
DLP,
DLl?
DLl?
4-2
Creating and Using Downloadable Programs
Page 84

‘lb
Use a
User-Defined
Function within a DLP
A user-defined function is created by using the FUNCDEF command.
1. Begin the user-defined function definition by using the FUNCDEF command, the label
(function name) for the function you are creating, a comma, and then a delimiter. See line
10 of the example.
Use unique names (unique from the analyzer programming commands) for the label.
lb avoid confusion with the internal variables used by the spectrum analyzer, it is
recommended that you use an underscore as the second character of the label.
2. Enter in the programming commands that you want the function to perform. See lines
20 and 30 of the example. Be sure to use semicolons to separate and terminate each
programming command.
Terminating the end of each program line with a semicolon will suppress BASIC’s carriage
return and line feed. This saves memory since the carriage returns and line feeds won’t be
stored in the FUNCDEF.
3. End the FUNCDEF definition by specifying the same delimiter that was used in step 1. See
line 40 of the example. The delimiters are used to enclose the programming commands for
the function.
To avoid problems with the FUNCDEF definition, you should remember the following:
w
A FUNCDEF does not return a value to a calling context like functions do in some languages.
n Loading functions into analyzer memory requires space in the analyzer’s memory. If you
are creating a large DLP, you should see “Determining the Amount of Memory Needed for a
DLP” in this chapter for information on how to determine the amount of available analyzer
memory and the size of the
w
Limit the number of characters between the delimiters in the FUNCDEF declaration to a
DLl?
maximum of 2047 characters. If the function is too large, you may need to segment it into
several functions. See “To Create a Modular DLP” in this chapter for more information.
n Ensure that the commands within the function are spelled correctly, that the syntax for the
command is correct, and that each command is properly terminated with a semicolon.
w
Keep the program lines short. If necessary, divide the spectrum analyzer programming
commands into several lines. See the example.
H
See the description for the FUNCDEF command in Chapter 5 for a list of programming
commands that cannot be used within a FUNCDEF definition.
Example
Executing the following programming lines creates a downloadable program called Z-OOM.
Z-OOM presets the analyzer, sets the center frequency to 300 MHz, sets the span to 10 MHz,
and places a marker on the highest signal. After executing the following lines, Z-OOM will be
in spectrum analyzer memory.
10 OUTPUT
718;"FUNCDEF Z-OOM,Q";
Begins the FUNCDEF d@nition. The
“@”
sign delimits the programming commands
that are within the FUNCDEFcalled Z-OOM.
The semicolon at the end of the line sup-
presses a carriage return and line feed.
20 OUTPUT
718;"IP;CF 300MHZ;";
Enters IP and CF 300 MH.. commands into
z-OOM.
30 OUTPUT
718;"SP
10MHZ;TS;MKPK HI;";
Enters the SP 10 MHz,
TS, MKPK
HI com-
mands into Z-OOM.
40 OUTPUT
50 LOCAL 718
60
END
718*"9*"
3
,
Ends the FUNCDEF definition.
Places the anal~.zer in local mode.
Creating and Using Downloadable Programs
4-3
Page 85

To
Use a User-Defined Variable within a DLP
User-defined variables are variables that you create with the VARDEF or ACTDEF commands.
User-defined variables remain in spectrum analyzer memory and retain their values until
redefined, disposed of, or altered by MOV or math commands. Turning the spectrum analyzer
off, then on or pressing
@iZK)
will reset the variables to values as specified in their
declarations. Note that all user-defined variables are global in scope, any function can access
any variable. All variables are of type REAL.
Variables should be declared outside of functions so the MEM? command returns the correct
value for available spectrum analyzer memory after the DLP is downloaded by an external
controller.
To
use a user-defined variable within a DLP:
1. Use the VARDEF command to declare the variable. You should declare the variable outside
of the function definition.
2. Begin the FUNCDEF definition.
3. Use the variable within the function. If YOU want to
the DSPLY command.
4. End the FUNCDEF definition.
Example
10 OUTPUT
20 OUTPUT
30 OUTPUT
40 OUTPUT
50 OUTPUT
60 OUTPUT 718;"MOV
70 OUTPUT
80 OUTPUT
90 OUTPUT
718;"VARDEF A,MP,O;";
718;"FUNCDEF
A,MPFUNC,!";
718;"IP;SNGLS;";
718;"FA
718;"TS;MKPK
275MHZ;FB
HI;";
325MHZ;";
A-MP,MKA;";
718;"PU;PA 60,180;TEXT IMARKER
AMPLITUDE IS
718;"DSPLY AwMP,3.1;TEXT %dBm%;";
718;"! ;"
100 END
disDlav
the value of the variable, use
Declares the variable called
A-MPand initializes its
value to zero.
Begins the
a function called
d@inition
AJPFUNC.
Does an instmcment pre-
set, sets it to single-sweep
mode.
Sets the start and stop
frequencies to 275 and
325
MHz,
respectively.
Puts a marker on the
highest signal.
Moves the marker amplitude value into A-MI?
I;";
Displays the message “MARKER
AMPLITUDE
Is: ”
then
displatis the marker am-
plitude and
Ends
thejimction &$nition.
dBm.
of
The programming example above alters the variable
A-MP
that was defined with the VARDEF
command. The math commands can be used to alter variable values. Examples of math
commands are the ADD, DIV, SUB, and MPY. Refer to
‘lhble
5-4 in Chapter 5 for a complete list
of the math commands.
4-4
Creating and Using Downloadable Programs
Page 86

To
Use a User-Defined Trace within a
DLP
Like variables, you should define user-defined traces outside of functions. User-defined traces
retain their values until redefined, disposed of, or altered by the MOV command or a math
command. User-defined traces are global in scope. Unlike user-defined variables, the elements
of user-defined traces are of type INTEGER.
1. Use the TRDEF command to define a trace. Define the trace outside of the any functions.
2. Initialize the elements of the trace to 0. (Optional.)
3. Use the trace (you can use the trace within a function).
4.
‘RI
display the contents of the user-defined trace, move the contents of the user-defined
trace into trace A, trace B, or trace C with the MOV command and then use the VIEW
command to display the destination trace (trace A, trace B, or trace C).
Example
The following example demonstrates how to define a trace, move a value into the trace, move
the trace to trace A, and view trace A.
10 OUTPUT
20 OUTPUT
718;"TRDEF T,RACEA,401;";
718;"MOV T,RACEA,O;";
130 OUTPUT
140 OUTPUT
150 OUTPUT
160 OUTPUT
170
END
718;"FUNCDEF D-ISPTRACE,!";
718;"MOV TRA,T-RACEA; ";
718;"VIEW TRA;";
718;"!; "
Dt@zes a 401 -point trace called
“TBACEA. ”
Initializes the trace values to zero.
Use the
Dtykes
Moves the contents of
TXACEA
for a
a function called
T-RACEA
measur-t.
DJPlXACE.
into trace
A.
Displays
Ends
trace A.
the FUNCDEF
d@nition.
Creating and Using Downloadable Programs
4-5
Page 87

To
Enter Values into a DLP
To allow the spectrum analyzer user to enter a value into a user-defined variable with the
analyzer front-panel keys use the active function definition command (ACTDEF).
Example
For example, if you want the user to enter the resolution bandwidth for use in the DLP, you
would use the following:
OUTPUT
BANDWIDTH#,SMHZ,STEP,!MOV
Notice that like moving a value into a variable or a trace,
command must be used to move the ACTDEF value into the RB command. See the command
description for ACTDEF in Chapter 5 for more information.
To Enter Values into a
Use the KEYCMD command to assign the ACTDEF command to a softkey.
Example
For example, to assign the ACTDEF to
OUTPUT
OUTPUT
718;"ACTDEF M-BW,%ENTER
RB,M-BW!;"
DIP
by Using a Softkey
softkey
718;"KEYCMD
718;"lKEYENH
2,
M-BW,";
2,
'RES BW',ACTVF
THE RESOLUTION Lets
resolution ban’dwidth with the
panel keys.
the
2, your
would use the following:
MmBW,O,%;";
theuserenter
MOV command or another MATH
the
valueofthe
front-
4-6
Creating and Using Downloadable Programs
Page 88

To
Create a Modular
DLP
A modular DLP is a DLP that is made up of several user-defined functions. Within a modular
DLP, there may be a main FUNCDEF which calls subordinate FUNCDEFs. A subordinate
FUNCDEF is a user-defined function that usually performs only one task, and is called by
another FUNCDEF.
To create a modular DLP:
1. Enter the file name that the DLP source code will be stored under, if desired.
2. Enter the date of the last revision to the DLP, if desired.
3. Enter the DLP author’s name, if desired.
4. Begin the FUNCDEF definition for the subordinate FUNCDEF
5. Enter in the programming commands that you want the FUNCDEF to perform.
6. End the FUNCDEF definition.
7. Repeat steps 4 through 6 for all the subordinate FUNCDEFs.
8. Create a main FUNCDEF that calls the subordinate FUNCDEF.
Creating a modular DLP instead of a DLP that is made up of only one FUNCDEF has the
following advantages:
n
Because the number of characters for a FUNCDEF definition is limited to a maximum of 2047
characters, you must change a large FUNCDEF into smaller FUNCDEFs if its size exceeds
2047 characters.
n Modular
DLPs
are easier to write, read, and find problems within the DLP
It is also easier to read and find problems in a program that has a comments added to it. For
example, adding the file name, the date of the last revision, and the author’s name help keep a
consistent program structure and make it easier to modify
the
DLI? The following program is
an example of a modular DLP with the recommended program structure.
Example
Notice that the program has a main FUNCDEF that calls the five subordinate
(SPANONE,
FUNCDEFs is called from the main FUNCDEF,
2, so the function can be executed by pressing
S-PANTWO,
S-PANTHREE, SPANFOUR, and C-HECK). Each of the five
E-XAMPLE.
(-1,
Line 560 assigns the DLP to
User Menus ,
FUNCDEF’s
EX&MPLE
.
softkey
The example uses descriptive labels and flows in a logical fashion, making the DLP easier to
understand. In addition, the use of subordinate FUNCDEFs makes the DLP easier to modify
because one FUNCDEF can be changed without having to modify the main FUNCDEF or other
FUNCDEFs. For example, if the application requires the stop frequency of the last span to
extend to 4
frequency of 4
GHz,
simply change the stop frequency (FB
GHz
(FB 4GHZ).
11OMHZ)
in
SPANFOUR
to a stop
Creating and Using Downloadable Programs
4-7
Page 89

File name
Date and author's
10
20
name
Program Description
30
40
50
60
70
80 !I MHz span, records the signal
90
100
Define variable
110 OUTPUT
120 !
Define
trace
130 OUTPUT
140 ! Subordinate
DefineFUNCDEF
150 OUTPUT
160 OUTPUT
170 ! frequencies.
180 OUTPUT
DefineFUNCDEF
190
200 OUTPUT
210
DeAneFUNCDEF
220
230 DUTPUT
240
DefineFUNCDEF
250 OUTPUT 7 18
260
270
DeEneFUNCEDEF
280
290 OUTPUT
295 ! highest signal.
300 OUTPUT
310 OUTPUT
320 OUTPUT
330 DUTPUT
340 OUTPUT
350 OUTPUT
360
370
380 OUTPUT
390 OUTPUT
400
Define Main
410 ! Main
FUNCDEF
420 OUTPUT
430 OUTPUT
440 !
450 OUTPUT 718;" REPEAT
460 OUTPUT 718;"
470 OUTPUT
480
490
500 OUTPUT
510 OUTPUT
520 OUTPUT
530
540 ! that
550 ! was found.
560 OUTPUT
570 END !
!File
name: EXAMPLE
!Date: 9/l/88
!Description
!signals
!spans:
!I4
to 16 MHz, and 16 to 110 MHz. If a
!signal
!level,
!signal
"P-OWER"
Author: Jane Doe
of the program: This program checks for
above -50
dEim
in the following frequency
10 to 12 MHz, 12 to 14 MHz,
is found, it autozooms to
and displays the highest frequency
found in trace B.
7lB;"VARDEF P-DWER,O;";
! Defines a variable named
and initialize it to zero.
7lB;"TRDEF S-AVE.401;";
! Defines a trace.
FDNCDEFs:
7lB;~FGNCDEF S-PANONE.0"; !Defines
7lB;"FA 1OMHZ;FB 12MHZ;"; !Set
71B*~~0*1~;
Ends the function.
, ,
a function.
the start and stop
OUTPUT 718;"FIJNCDEF S-PANTWD,O;"
719;"FA 12MHZ;FB 14MHZ;";
OUTPUT 7ia-w-~~DIJTPDT 7lB;"F;NCDEF S-PANTHREE.0";
7lB;"FA
14MHZ;FB
IGMHZ;";
OUTPUT 718*"0*".
I"&CDEF S-PANFDUR,cD";
OUTPUT 718;"FA 16MHZ;FB IIOHHZ;";
OUTF'UT 718*"0~"*
OUTPUT 718 I VT&DEF c3zcK ,0” ;
7lS;"TS;MKPK HI;";
718;"IF
MKA,GT,-50 THEN
7lS;"MKTRACK ON;";
71B;1SP IMHZ;";
7lB;"MKTRACK 0FF;TS;";
718;"'MKPK HI;MKCF;TS;";
718;"RKRL;TS;";
DIJTPUT 718;"MOV P-OWER,MKA;";
OUTPUT 718;"MOV S-AVE,TRA;";
7lS;"SAVES I;";
7lB;"ENDIF-I'*
OUTPUT 7ia-“o.fl-
,I End the definition of C-HECK."
! Places a marker on
'I;
! than
! If the signal is higher
-5OdBm,
zoom to 1 MHz
! span, center it and bring it
! to the reference level.
! Store it in a
4Ol-point
! trace previously defined as
! having the label,
"S-AVE".
! Save the control settings
! in register 1.
! End the IF statement.
FDNCDEF
718;"FUNCDEF E-XAMPLE,O";
7lS;"IP;SNGLS;MOV S-AVE,O;";
! Begins the main program.
! Places the analyzer in
single-sweep mode and set all values in "S-AVE" to zero.
";
S-PANONE;C-HECK;";
718;t' S-PANTWD;C-HECK;";
OUTPUT 7ia;”
S-PANTHREE;C-HECK;";
OUTPUT 718;" S-PANFOUR;C-HECK;";
718;"UNTIL S-AVE[O],NE,O;";
718;"MDV TRB,S-AVE;";
718;"RCLS 1;BLANK TRA;VIEW TRB;";
OUTPUT 7ia.l~0.lfl-
exiited
! and
6hen the signal
E-XAMPLE
recalls
is assigned
7lS;"KEYDEF 2,E_XAMPLE,%EXAMPLE%;";
! Checks each span or a
! signal greater than -50
! Repeat sequence until a
! non-zero value is found in
!
S-AVE.
It then displays the located
! signal in trace B,
the analyzer settings
! to
softkey
2 so the
program may be executed from the front panel.
dBm.
4-8
Creating and Using Downloadable Programs
Page 90

Executing a DLP
This section contains information about how to execute a
following procedures:
n Execute the DLP by using a
H
Execute the DLP within a program.
To
Execute a
There are two ways to execute a DLP. You can execute the DLP by pressing a softkey that has
been assigned a function as shown in this procedure, or execute the DLP within a program
(shown in the following procedure).
1. Use the KEYDEF command to assign the function that you created with the FUNCDEF
command to a
2.
Press
(j-J,
DIP
by Using a Softkey
softkey.
User Menus to access the
softkey.
softkey.
DLP
This section contains the
Example
The following example uses the KEYDEF command to assigns the ZBOM function to
10 OUTPUT
20 LOCAL 718
30
END
718;"KEYDEF
1,
Z-OOM,%CAL SIGIZOOM%;"; Assigns thefunction Z-OOMto
soflkey 1 and assigns sofikey 1
the label “CAL SIG ZOOM.
softkey
”
1.
You can access CAL SIG
2DOM
by pressing
(-1,
lb Execute the DLP within a Program
You can also execute the DLP within a program.
w
Use the name of the DLP within a program.
Example
The following programming line executes the
OUTPUT
718;"Z-0OM;"
Z-OOM
User
Menus .
function from an external controller.
Creating and Using Downloadable Programs
4-9
Page 91

Storing
If the spectrum analyzer has a memory card reader installed in it, you can store the DLP on a
RAM card, and, at a later time, load the DLP into analyzer memory from the RAM card. This
section contains the procedures for storing a DLP on a RAM card remotely, and loading the
DLP from the RAM card into analyzer memory remotely.
DLPs
on a RAM Card
These procedures are all for remote operation; see the HP 8590 E-Series and
Analyzers User’s
front-panel keys of the spectrum analyzer.
To
Store
Storing the DLP on the RAM card is a convenient way of backing-up the FUNCDEFs, VARDEFs,
ACTDEFs, TRDEF, and KEYDEFs in spectrum analyzer memory, and transferring them from
one spectrum analyzer to another.
1. Install a RAM card into the memory card reader of the analyzer. Be sure the RAM card
write-protect switch is not set to SAFE (write-protected).
2. Use the
3. Use the STOR command to copy the contents of spectrum analyzer memory onto the RAM
card.
Example
The following example sets the mass storage device to the memory card reader, and then stores
the contents of analyzer memory on the RAM card.
OUTPUT
Saving a DLP on a RAM card saves all FUNCDEFs, VARDEFs, ACTDEFs, TRDEF, and KEYDEFs
in the spectrum analyzer memory. This means a DLP cannot be saved selectively if several
DLPs
memory that you do not wish to be saved on the RAM card. See the DISPOSE command.
MS1
are present in the analyzer memory at the time. You may want to delete the items in user
Guide
for information about how to do these procedures by using the
DLFs
on a RAM Card
command to select the memory card reader as the mass storage device.
718;"MSI
CARD;STOR
d,%dZ,OOM%,*;"
Stores a copy of the contents of analyzer
memory on the RAM card under the
name
of
Z-OOM.
LSeries
Spectrum
.file
4-10 Creating and Using Oownloadable Programs
Page 92

To
Load
DLPs
from a Memory Card into Analyzer Memory
Once a DLP has been stored on a RAM card, it can be loaded back into spectrum analyzer
memory when desired.
DISPOSE command, ERASE command, or
DLPs
remain in spectrum analyzer memory until disposed of with the
ERASE DLP
MEM.
1. To load a DLP from a RAM or ROM card into analyzer memory, insert the memory card into
the memory card reader.
2. Use the
MS1
command to select the memory card reader as the mass storage device.
3. Use the LOAD command to copy the contents of the RAM card file into spectrum analyzer
memory.
Example
The following example sets the mass storage device to the memory card reader, and then copies
the contents of RAM card file called Z-OOM into spectrum analyzer memory.
OUTPUT
718;"MSI
CARD;LOAD
%dZ-OOMX;"
Loads a copy of
Z-OOM
from the RAM card
into spectrum analyzer memory.
Note that loading does not dispose of any
DLPs
which were in memory before the load was
executed.
Creating and Using Downloadable Programs
4.11
Page 93

Determining the Amount of Memory Needed for a DLP
FUNCDEFs, user-defined variables, user-defined traces, on event commands (for example,
ONSRQ, ONEOS, and TRMATH), and user-defined
spectrum analyzer memory. If you write a large DLP, or if you have a several
spectrum analyzer memory, you may run out of spectrum analyzer memory that is available
for storing the
DLPs,
you may need to determine the amount of spectrum analyze memory the DLP requires
DLPs.
Also, the storage space on a RAM card is finite. If you are creating large
and delete unused items from spectrum analyzer memory. This section contains the procedures
for the following:
n
Determining the available amount of spectrum analyzer memory or RAM card space.
w
Delete a DLP from spectrum analyzer memory or a RAM card.
To
Determine Available Analyzer Memory
Because the amount of analyzer memory available for user-defined functions is limited, it may
sometimes be necessary to determine the amount of analyzer memory available.
w
Use the MEM command to determine the available analyzer memory remotely.
Example
softkeys
all consume some amount of
DLPs
stored in
10 OUTPUT
20 ENTER
718*"MEM'-"-
718;iemor;'
8
Lleternaines
Stores the available analyzer
the available
analyzer
menzory
memory.
value in the vari-
able memory.
30 PRINT "MEMORY =Mm,Memory
40
END
Prints the amount of analyzer
memory.
If you are sure that the amount of memory that a DLP requires will not exceed the amount
of spectrum analyzer memory available, you can download the DLP into analyzer memory
and then execute the previous program again. The amount of analyzer memory that the DLP
requires is the difference between the value that MEM? returned before the DLP was loaded
into analyzer memory and the value MEM? returned after the DLP was loaded into analyzer
memory.
If the amount of memory that a DLP requires could exceed the amount of spectrum analyzer
memory available, you should delete any unnecessary variables, traces, or FUNCDEFs or on
event
commands from spectrum analyzer memory. See “To Delete a DLP from Spectrum
Analyzer Memory” for more information.
To
Determine the Amount of Space on a RAM Card
‘lb save a DLP on a RAM card, it may be necessary to determine the amount of space available
on the RAM card. To determine the amount of space on a RAM card, you must do the
following:
1. Catalog the memory card.
2. Determine the total number of records for the RAM card. The total number of records on
the RAM card is displayed when cataloging the card (see Figure 4-l). The number of records
on the RAM card is determined by dividing the memory capacity of the RAM card by 256
(because the records are 256 bytes long). For example, if the RAM card has a capacity of
32K bytes (which is equal to 32 x
1024),
the total number of records on the RAM card is 128
(32,768 divided by 256).
4-12 Creating and Using Downloadable Programs
Page 94

3. Determine the number of records on the RAM card that are in use. The number of records
stored on the RAM card can be determined by cataloging the card, finding the starting
record address for the last catalog entry, adding the number of records used for the last
catalog entry to the starting record address, and then subtracting one.
4. Subtract the number of records stored (determined in step 3) from the total number of
records available (determined in step 2) to determine the number of unused records on the
RAM card.
Example
Figure 4-l shows that the number of records on the RAM card that are in use is 53 (35 + 19
1 =
53),
and the total number of records available are 128. The number of unused records on
the
RAM
is 75 (128 - 53
card
0
1
REF\. 0 d0m
47
PEAK
dB/
SA
SC FC
SB
CORR
HP859X
tTRANSD-3
tTRANSD-4
t-1
= 75).
ATTEN
128
TRACE 10
TRACE 15
TRACE 20
TRACE 25
TRACE 30
DSPLY 35
10 dB
/
i
UBW
14:11:28
E.
14:14:07
E
14:16:03
14:17:23
09:38:44
12:54:56
19
17:00:18
1 MHz
OCT 15, 1991
OCT
15,
OCT 15, 1991
OCT 15, 1991
OCT 17, 1991
OCT
FEB
SPAN 6.500
SWP 130
1991
17,
1991
28, 1992
8Hz
msec
LOhD
FILE
DELETE
FILE
Exit
Catalog
Previous
Menu
RT
-
Index
1
2
3
4
Figure 4-1. Determining the Number of Records
Table
4-1. Cataloging a RAM Card
Description
Total number of records.
Number of records for the last catalog item.
Starting record address for the last catalog entry.
The
last
cataloa
entrv.
Creating and Using Downloadable Programs
4-13
Page 95

‘lb Delete a
w
Use the DISPOSE command to delete the DLP item from spectrum analyzer memory.
A FUNCDEF can be deleted from analyzer memory remotely by using the DISPOSE command.
The DISPOSE command can also be used to remove
and user-defined traces. (See the description for the DISPOSE command in Chapter 5 for more
information.)
DIP
from Spectrum Analyzer Memory
softkey
functions, user-defined variables,
Example
To remove the FUNCDEF called
following command:
OUTPUT
Use DISPOSE ALL to remove all
variables from analyzer memory. For example,
is equivalent to DISPOSE ALL.)
718;"DISPOSE Z,OOM;";
Z-OOM
from analyzer memory, you would execute the
FUNCDEFs,
OUTPUT 718 ; "DISPOSE ALL ; I' ; (ERASE DLP
user-defined traces, limit-lines, and user-defined
lb Erase the DLP from a RAM Card
H
Select the memory card as the mass storage device by using the
the PURGE command to delete a specific file from the RAM card.
Example
‘Ib
delete the file called
command:
OUTPUT
718;"MSI CARD;PURGE %dZ-OOMX;"
Z-OOM
from the RAM card, you would execute the following
MS1
command, and then use
MEM
4-14 Creating and Using Downloadable Programs
Page 96

Using the DLP Editor
The DLP editor functions allow you to create or modify a DLP with only an external keyboard
connected to the spectrum analyzer (an external controller is not required). This section
contains the following procedures:
n Connect the external keyboard to the spectrum analyzer.
n
Access the DLP editor functions.
n
n
Use the DLP editor functions to modify a DLP
w
Use the DLP editor functions to modify a catalog item.
The external keyboard can also be used to enter screen titles and remote programming
commands; see the HP 8590 E-Series and
information.
lb
Connect the External Keyboard to the Spectrum Analyzer
L&&es
Spectrum
Anulgwrs
User’s Guide for more
Caution
The analyzer must be turned off before connecting an external keyboard to
the spectrum analyzer. Failure to do so may result in loss of factory-installed
correction constants.
1.
Turn off the spectrum analyzer.
2.
Connect an HP Cl405 Option 002 (or Option 003) cable from the spectrum-analyzer
rear-panel connector EXT KEYBOARD to the HP
3.
Press
m
to turn the spectrum analyzer on.
4.
Place the template for the external keyboard on the external keyboard.
SPECTRUM ANALYZER
C1405A
Option ABA keyboard.
Figure 4-2. Connecting the External Keyboard to the Spectrum Analyzer
You can now use the external keyboard to enter or modify a DLP with the DLP editor, enter a
screen title, enter programming commands, or enter a prefix.
Creating and Using Downloadable Programs
4-l
5
Page 97

‘Ib
Access the DLP Editor
. Press (SAVE) or
Catalog
Press
IPause)
Editor or
and
m
IPause)
however. Editor allows you to access all the DLP editor softkeys (EDIT LAST,
EDIT CAT ITEM ,
(RECALL),
then INTERNAL CARD (so that INTERNAL is underlined),
Internal , CATALOG ALL, and then Editor.
on the external keyboard.
accesses the DLP editor. There are some differences between using Editor
APXD
CAT ITEM ,
SAVE
EDIT, and NEW EDIT ). With (Pause), you can only
access EDIT LAST, SAVE EDIT , and NEW EDIT . m allows you to change between the DLP
editor functions and the “keyboard entry” functions such as entering programming commands,
screen title, and prefix.
With the external keyboard connected to the spectrum analyzer, you can use the function keys
(Fl through F6) of the external keyboard to accesses the softkeys of the spectrum analyzer. For
example, you could press Fl to access the first
softkey,
F2 to access the second
softkey,
and so
forth.
/ie7
REF . 0
PEAK
LOG
%
dBm
S-PANONE
S-PANFOUR
E-XAMPLE
S-PANTWO
S-PANTHREE
A-MPFUNC
ATTEN 10
240 6
t9
182
40
dB
EDIT
APND
CAT
EDIT
LAST
CFIT
ITEM
ITEM
KEYI
SA s
SC F
CENTER 3.250
KEY#l
B A-MP
C
T-RACEA
COR
R S-AVE
P-OWER
RES BW 3.0 MHz
GHz
VBW 1 MHz
SPAN 6.500
Figure 4-3. Accessing the DLP Editor
SWP 130 mseo
GHz
SAVE
EDIT
NEW
EDIT
Previous
Menu
RT
4-16 Creating and Using Downloadable Programs
Page 98

To
Create a DLP
1*
Press
HEW
EDIT, NEW EDIT to enter an individual DLP item (FUNCDEF, VARDEF, or
TRDEF) into the buffer of the DLP editor.
2. Use the external keyboard keys to enter the DLP item. Because you are not using an
external computer, the spectrum analyzer commands are entered without an OUTPUT or
PRINT statement preceding them.
While using the DLP editor, you may want to use the “typing keys.” The typing keys are the
function keys F7 through F12. The typing keys automatically place the command mnemonic
at the position of the cursor on the spectrum analyzer display. The commands accessed by
the typing keys are shown at the bottom of the spectrum analyzer display; you can use
the
(Page]
and
(Page]
keys of the external keyboard to access different command
mnemonics.
3. When the DLP item has been entered and you want it executed, press SAVE EDIT.
SAVE EDIT executes the contents of the DLP editor buffer as remote commands, and when
executing a FUNCDEF, will result in the FUNCDEF present in spectrum analyzer memory
under the name given for the user-defined function. If you do not want to save the DLP,
press
WEW
EDIT,
WEW
EDIT to clear the screen.
The buffer for the DLP editor is limited to 2500 characters, however, DLP items are limited to a
maximum of 2047 characters.
For example, if you use the DLP editor to enter the
display would look as follows:
Edit item memory size = 50 Total memory
FUNCDEF
I FU
DEF nl‘JARDEF
‘7 F8 F9
Z-OOM>CIP:CF 300MHZ:SP 10MHZ:TS:MKPK
I KEYDEF I
Figure 4-4. Entering a
Z-OOM
::0 Fll
function, the spectrum analyzer
I
ELSE I E
DLP
=
2500
HI:
)IF:
I
‘12
EDIT
LAST
SAVE
EDIT
NEW
EDIT
Exit
Edit
L
Creating and Using Downloadable Programs
4-17
Page 99

lb
Modify the
DLP
1. If necessary, press
2.
If the DLP is not displayed, press EDIT LAST to display the previous contents of the DLP
editor.
3. Use the external keyboard keys to edit the DLP. Because you are not using an external
computer, the spectrum analyzer commands are entered without an OUTPUT or PRINT
statement preceding them.
4.
When the DLP has been entered, press SAVE EDIT . SAVE EDIT executes the DLP in
spectrum analyzer memory. If you do not want to execute the
MEI4 EDIT
to clear the screen.
m
to reenter the DLP editor.
DLP,
press NEW EDIT ,
’
4-l 8Creating and Using Downloadable Programs
Page 100

‘lb
Modify a Catalog Item
1.
Press
(‘1
2.
Press Catalog Internal , CATALOG ALL , and then Editor. (You can use one of the other
catalog
softkeys
you wanted only the
3.
Use the large knob on the spectrum analyzer’s front panel to highlight the item that you
or
m,
then INTERNAL CARD (so that INTERNAL is underlined).
instead of CATALOG ALL . For example, you could press CATALOG DLP if
DLPs
cataloged.)
want to edit. The user-defined functions, user-defined traces, and user-defined variable are
listed by their label, and user-defined softkeys are listed by “KEY” followed by the key
number.
4.
Press EDIT CAT ITEM . If there is already some text in the DLP editor, you need to press
EDIT CAT ITEM again to clear the text from the DLP editor’s buffer.
5.
Use the external keyboard keys to edit the cataloged item. Because you are not using an
external computer, the spectrum analyzer commands are entered without an OUTPUT or
PRINT statement preceding them.
6.
When the catalog item
has
been edited, press SAVE EDIT. SAVE EDIT executes the DLP
in spectrum analyzer memory, and will replace the catalog item. If you do not want to the
changes to the catalog item, press
HEW
EDIT , NEW EDIT to clear
the
screen.
You may find it useful to use
APND
CAT ITEM .
the text that is already in the DLP editor.
sfl
s
SC F
COR
CENTER 3.250
RES BW 3.0 MHz
GHz
Figure 4-5. Selecting a Catalog Item
UBW
APED
1 MHz
GAT ITEM appends the catalog item to
Editor
DELETE
FILE
SELECT
PREFIX
Exit
Catal
Previous
SPAN 6.500
SWP 130
GHz
msec
Menu
RL
4-l
Creating and Using Downloadable Programs
8
 Loading...