

Page 1

Instrument Messages and
Functional Tests
Agilent Technologies
EMC Series Analyzers
This manual documents firmware revision A.08.xx
This manual provides documentation for the following instruments:
E7401A (9 kHz- 1.5 GHz)
E7402A (9 kHz - 3.0 GHz)
E7403A (9 kHz - 6.7 GHz)
E7404A (9 kHz - 13.2 GHz)
E7405A (9 kHz - 26.5 GHz)
Manufa cturing Part Number: E7401-90047
Printed in USA
December 2001
© Copy rig ht 2001 Ag ilent Technologies
Page 2

Notice
The information contai ned in this document is subject to change
without notice.
Agilent Technologies makes no warranty of any kind with regard to this
material, including but not limited to, the implied w a rranties of
merchantability and fitness for a particular purpose. Agilent
Techn o logies shall not be liable for e rro rs containe d herein or fo r
incidental or consequential damages in connecti on with the furnis hing,
performance, or use of this material.
Microsoft is a U.S. registered trademark of Microsoft Corp.
Where to Find the Latest Information
Documentation is updated periodically . For the latest information about
Agilent Technologies EMC Series Analyzers, including firmware
upgrad es and application information, please visit the following
Internet URL:
http://www.agilent.com/find/emc
2
Page 3

Contents
1. Instrument Messages
Instrument Messages Introduction . . . . . . . . . . . . . . . . . . . . . . . . . . . . . . . . . . . . . . . . . . . . . . . . . . . 14
Error Message Format . . . . . . . . . . . . . . . . . . . . . . . . . . . . . . . . . . . . . . . . . . . . . . . . . . . . . . . . . . 15
Error Message Types . . . . . . . . . . . . . . . . . . . . . . . . . . . . . . . . . . . . . . . . . . . . . . . . . . . . . . . . . . . 16
Instrument Messages . . . . . . . . . . . . . . . . . . . . . . . . . . . . . . . . . . . . . . . . . . . . . . . . . . . . . . . . . . . . . 18
Error Messages . . . . . . . . . . . . . . . . . . . . . . . . . . . . . . . . . . . . . . . . . . . . . . . . . . . . . . . . . . . . . . . 18
Instrument Messages without Numbers . . . . . . . . . . . . . . . . . . . . . . . . . . . . . . . . . . . . . . . . . . . . 35
2. Functional Testing
What You Will Find in This Chapter . . . . . . . . . . . . . . . . . . . . . . . . . . . . . . . . . . . . . . . . . . . . . . . . . 52
What Are the Functional Tests? . . . . . . . . . . . . . . . . . . . . . . . . . . . . . . . . . . . . . . . . . . . . . . . . . . 52
Functional Test Versus Performance Verification . . . . . . . . . . . . . . . . . . . . . . . . . . . . . . . . . . . . 52
Test Descriptions . . . . . . . . . . . . . . . . . . . . . . . . . . . . . . . . . . . . . . . . . . . . . . . . . . . . . . . . . . . . . . . . 53
Displayed Average Noise Level . . . . . . . . . . . . . . . . . . . . . . . . . . . . . . . . . . . . . . . . . . . . . . . . . . . . 56
Test Limits . . . . . . . . . . . . . . . . . . . . . . . . . . . . . . . . . . . . . . . . . . . . . . . . . . . . . . . . . . . . . . . . . . . 56
Test Description . . . . . . . . . . . . . . . . . . . . . . . . . . . . . . . . . . . . . . . . . . . . . . . . . . . . . . . . . . . . . . . 5 6
Required Equipment . . . . . . . . . . . . . . . . . . . . . . . . . . . . . . . . . . . . . . . . . . . . . . . . . . . . . . . . . . . 57
Procedure (10 MHz to 500 MHz) E7401A . . . . . . . . . . . . . . . . . . . . . . . . . . . . . . . . . . . . . . . . . . 57
Procedure (501 MHz to 1.0 GHz) E7401A . . . . . . . . . . . . . . . . . . . . . . . . . . . . . . . . . . . . . . . . . . 58
Procedure (1.01 GHz to 1.5 GHz) E7401A . . . . . . . . . . . . . . . . . . . . . . . . . . . . . . . . . . . . . . . . . . 60
Procedure (10 MHz to 1 GHz) E7402A, E7403A, E7404A, and E7405A . . . . . . . . . . . . . . . . . . 61
Procedure (1.01 GHz to 2 GHz) E7402A, E7403A, E7404A, and E7405A . . . . . . . . . . . . . . . . . 62
Procedure (2.01 GHz to 3.0 GHz) E7402A, E7403A, E7404A, and E7405A . . . . . . . . . . . . . . . 63
Procedure (3.01 GHz to 6.0 GHz) E7403A, E7404A, and E7405A . . . . . . . . . . . . . . . . . . . . . . . 65
Procedure (6.01 GHz to 6.7 GHz) E7403A . . . . . . . . . . . . . . . . . . . . . . . . . . . . . . . . . . . . . . . . . . 66
Procedure (6.01 GHz to 12.0 GHz) E7404A and E7405A . . . . . . . . . . . . . . . . . . . . . . . . . . . . . . 67
Procedure (12.01 GHz to 13.2 GHz) E7404A . . . . . . . . . . . . . . . . . . . . . . . . . . . . . . . . . . . . . . . . 68
Procedure (12.01 GHz to 22 GHz) E7405A . . . . . . . . . . . . . . . . . . . . . . . . . . . . . . . . . . . . . . . . . 70
Procedure (22.01 GHz to 26.5 GHz) E7405A . . . . . . . . . . . . . . . . . . . . . . . . . . . . . . . . . . . . . . . . 71
EMI Detector . . . . . . . . . . . . . . . . . . . . . . . . . . . . . . . . . . . . . . . . . . . . . . . . . . . . . . . . . . . . . . . . . . . 74
Test Limits . . . . . . . . . . . . . . . . . . . . . . . . . . . . . . . . . . . . . . . . . . . . . . . . . . . . . . . . . . . . . . . . . . . 74
Test Description . . . . . . . . . . . . . . . . . . . . . . . . . . . . . . . . . . . . . . . . . . . . . . . . . . . . . . . . . . . . . . . 7 4
Required Equipment . . . . . . . . . . . . . . . . . . . . . . . . . . . . . . . . . . . . . . . . . . . . . . . . . . . . . . . . . . . 74
200 Hz Procedure . . . . . . . . . . . . . . . . . . . . . . . . . . . . . . . . . . . . . . . . . . . . . . . . . . . . . . . . . . . . . 75
9 kHz Procedure . . . . . . . . . . . . . . . . . . . . . . . . . . . . . . . . . . . . . . . . . . . . . . . . . . . . . . . . . . . . . . 75
120 kHz Procedure . . . . . . . . . . . . . . . . . . . . . . . . . . . . . . . . . . . . . . . . . . . . . . . . . . . . . . . . . . . . 76
Frequency Readout Accuracy . . . . . . . . . . . . . . . . . . . . . . . . . . . . . . . . . . . . . . . . . . . . . . . . . . . . . . 78
Test Limits . . . . . . . . . . . . . . . . . . . . . . . . . . . . . . . . . . . . . . . . . . . . . . . . . . . . . . . . . . . . . . . . . . . 78
Test Description . . . . . . . . . . . . . . . . . . . . . . . . . . . . . . . . . . . . . . . . . . . . . . . . . . . . . . . . . . . . . . . 7 8
Required Equipment . . . . . . . . . . . . . . . . . . . . . . . . . . . . . . . . . . . . . . . . . . . . . . . . . . . . . . . . . . . 78
Procedure . . . . . . . . . . . . . . . . . . . . . . . . . . . . . . . . . . . . . . . . . . . . . . . . . . . . . . . . . . . . . . . . . . . . 79
Marker Count Accuracy . . . . . . . . . . . . . . . . . . . . . . . . . . . . . . . . . . . . . . . . . . . . . . . . . . . . . . . . . . . 80
Procedure . . . . . . . . . . . . . . . . . . . . . . . . . . . . . . . . . . . . . . . . . . . . . . . . . . . . . . . . . . . . . . . . . . . . 80
Frequency Response . . . . . . . . . . . . . . . . . . . . . . . . . . . . . . . . . . . . . . . . . . . . . . . . . . . . . . . . . . . . . 8 1
Test Limits . . . . . . . . . . . . . . . . . . . . . . . . . . . . . . . . . . . . . . . . . . . . . . . . . . . . . . . . . . . . . . . . . . . 81
3
Page 4

Contents
Test Description . . . . . . . . . . . . . . . . . . . . . . . . . . . . . . . . . . . . . . . . . . . . . . . . . . . . . . . . . . . . . . . 8 1
Required Equipment . . . . . . . . . . . . . . . . . . . . . . . . . . . . . . . . . . . . . . . . . . . . . . . . . . . . . . . . . . . 81
Procedure . . . . . . . . . . . . . . . . . . . . . . . . . . . . . . . . . . . . . . . . . . . . . . . . . . . . . . . . . . . . . . . . . . . . 82
Reference Level Accuracy . . . . . . . . . . . . . . . . . . . . . . . . . . . . . . . . . . . . . . . . . . . . . . . . . . . . . . . . . 85
Test Limits . . . . . . . . . . . . . . . . . . . . . . . . . . . . . . . . . . . . . . . . . . . . . . . . . . . . . . . . . . . . . . . . . . . 85
Test Description . . . . . . . . . . . . . . . . . . . . . . . . . . . . . . . . . . . . . . . . . . . . . . . . . . . . . . . . . . . . . . . 8 5
Required Equipment . . . . . . . . . . . . . . . . . . . . . . . . . . . . . . . . . . . . . . . . . . . . . . . . . . . . . . . . . . . 85
Log Mode Procedure . . . . . . . . . . . . . . . . . . . . . . . . . . . . . . . . . . . . . . . . . . . . . . . . . . . . . . . . . . . 86
Linear Mode Procedure . . . . . . . . . . . . . . . . . . . . . . . . . . . . . . . . . . . . . . . . . . . . . . . . . . . . . . . . . 88
Resolution Bandwidth Switching Uncertainty . . . . . . . . . . . . . . . . . . . . . . . . . . . . . . . . . . . . . . . . . . 90
Test Limits . . . . . . . . . . . . . . . . . . . . . . . . . . . . . . . . . . . . . . . . . . . . . . . . . . . . . . . . . . . . . . . . . . . 90
Test Description . . . . . . . . . . . . . . . . . . . . . . . . . . . . . . . . . . . . . . . . . . . . . . . . . . . . . . . . . . . . . . . 9 0
Required Equipment . . . . . . . . . . . . . . . . . . . . . . . . . . . . . . . . . . . . . . . . . . . . . . . . . . . . . . . . . . . 90
Procedure . . . . . . . . . . . . . . . . . . . . . . . . . . . . . . . . . . . . . . . . . . . . . . . . . . . . . . . . . . . . . . . . . . . . 91
Scale Fidelity . . . . . . . . . . . . . . . . . . . . . . . . . . . . . . . . . . . . . . . . . . . . . . . . . . . . . . . . . . . . . . . . . . . 93
Test Limits . . . . . . . . . . . . . . . . . . . . . . . . . . . . . . . . . . . . . . . . . . . . . . . . . . . . . . . . . . . . . . . . . . . 93
Test Description . . . . . . . . . . . . . . . . . . . . . . . . . . . . . . . . . . . . . . . . . . . . . . . . . . . . . . . . . . . . . . . 9 3
Required Equipment . . . . . . . . . . . . . . . . . . . . . . . . . . . . . . . . . . . . . . . . . . . . . . . . . . . . . . . . . . . 93
Procedure . . . . . . . . . . . . . . . . . . . . . . . . . . . . . . . . . . . . . . . . . . . . . . . . . . . . . . . . . . . . . . . . . . . . 94
Second Harmonic Spurious Responses . . . . . . . . . . . . . . . . . . . . . . . . . . . . . . . . . . . . . . . . . . . . . . . 96
Test Limits . . . . . . . . . . . . . . . . . . . . . . . . . . . . . . . . . . . . . . . . . . . . . . . . . . . . . . . . . . . . . . . . . . . 96
Test Description . . . . . . . . . . . . . . . . . . . . . . . . . . . . . . . . . . . . . . . . . . . . . . . . . . . . . . . . . . . . . . . 9 6
Required Equipment . . . . . . . . . . . . . . . . . . . . . . . . . . . . . . . . . . . . . . . . . . . . . . . . . . . . . . . . . . . 96
Procedure . . . . . . . . . . . . . . . . . . . . . . . . . . . . . . . . . . . . . . . . . . . . . . . . . . . . . . . . . . . . . . . . . . . . 97
Tracking Generator Level Flat ness: Model E7401A, Option 1DN . . . . . . . . . . . . . . . . . . . . . . . . . . 99
Test Limits . . . . . . . . . . . . . . . . . . . . . . . . . . . . . . . . . . . . . . . . . . . . . . . . . . . . . . . . . . . . . . . . . . 99
Test Description . . . . . . . . . . . . . . . . . . . . . . . . . . . . . . . . . . . . . . . . . . . . . . . . . . . . . . . . . . . . . . . 9 9
Required Equipment . . . . . . . . . . . . . . . . . . . . . . . . . . . . . . . . . . . . . . . . . . . . . . . . . . . . . . . . . . . 99
Procedure . . . . . . . . . . . . . . . . . . . . . . . . . . . . . . . . . . . . . . . . . . . . . . . . . . . . . . . . . . . . . . . . . . . 100
Tracking Generator Level Flat ness:
E7402A, E7403A, E7404A, and E7405A, Option 1DN . . . . . . . . . . . . . . . . . . . . . . . . . . . . . . . . . 102
Test Limits . . . . . . . . . . . . . . . . . . . . . . . . . . . . . . . . . . . . . . . . . . . . . . . . . . . . . . . . . . . . . . . . . . 102
Test Description . . . . . . . . . . . . . . . . . . . . . . . . . . . . . . . . . . . . . . . . . . . . . . . . . . . . . . . . . . . . . . 1 0 2
Required Equipment . . . . . . . . . . . . . . . . . . . . . . . . . . . . . . . . . . . . . . . . . . . . . . . . . . . . . . . . . . 102
Procedure . . . . . . . . . . . . . . . . . . . . . . . . . . . . . . . . . . . . . . . . . . . . . . . . . . . . . . . . . . . . . . . . . . . 103
4
Page 5

Instrument Messages
Alphabetical Listin g
(50 MHz Osc Unleveled) . . . . . . . . . . . . . . . . . . . . . . . . . . . . . . . . . . . . . . . . . . . . . . . . . . . . . . . . . . . 37
(Freq Ref Unlocked). . . . . . . . . . . . . . . . . . . . . . . . . . . . . . . . . . . . . . . . . . . . . . . . . . . . . . . . . . . . . . . 39
(IF/ADC Over Range) . . . . . . . . . . . . . . . . . . . . . . . . . . . . . . . . . . . . . . . . . . . . . . . . . . . . . . . . . . . . . 40
(LO Out Unl eveled) . . . . . . . . . . . . . . . . . . . . . . . . . . . . . . . . . . . . . . . . . . . . . . . . . . . . . . . . . . . . . . . 40
(no corresponding status bit). . . . . . . . . . . . . . . . . . . . . . . . . . . . . . . . . . . . . . . . . . . . . . . . . . . . . . . . 39
(Oversweep) . . . . . . . . . . . . . . . . . . . . . . . . . . . . . . . . . . . . . . . . . . . . . . . . . . . . . . . . . . . . . . . . . . . . . 4 1
(Source LO Unleveled). . . . . . . . . . . . . . . . . . . . . . . . . . . . . . . . . . . . . . . . . . . . . . . . . . . . . . . . . . . . . 41
(Source Unleveled). . . . . . . . . . . . . . . . . . . . . . . . . . . . . . . . . . . . . . . . . . . . . . . . . . . . . . . . . . . . . . . . 42
(Synth Unlocked) . . . . . . . . . . . . . . . . . . . . . . . . . . . . . . . . . . . . . . . . . . . . . . . . . . . . . . . . . . . . . . . . . 40
(ADC Align Failure) . . . . . . . . . . . . . . . . . . . . . . . . . . . . . . . . . . . . . . . . . . . . . . . . . . . . . . . . . . . . . . . 37
(FM Demod Align Failure) status bit only, no message . . . . . . . . . . . . . . . . . . . . . . . . . . . . . . . . . . . 39
(IF Align Failure) status bit only, no message . . . . . . . . . . . . . . . . . . . . . . . . . . . . . . . . . . . . . . . . . . 39
(LO Align Fa ilure) status bit only, no message . . . . . . . . . . . . . . . . . . . . . . . . . . . . . . . . . . . . . . . . . . 40
(RF Align Failure) status bit only, no message. . . . . . . . . . . . . . . . . . . . . . . . . . . . . . . . . . . . . . . . . . 41
(TG Align Fa ilure) status bit only, no message . . . . . . . . . . . . . . . . . . . . . . . . . . . . . . . . . . . . . . . . . . 42
* (Invalid Data). . . . . . . . . . . . . . . . . . . . . . . . . . . . . . . . . . . . . . . . . . . . . . . . . . . . . . . . . . . . . . . . . . . 37
: Reduce Sign al and press <ESC> (Input Overload Tripped). . . . . . . . . . . . . . . . . . . . . . . . . . . . . . . 41
<directoryn ame> directory deleted . . . . . . . . . . . . . . . . . . . . . . . . . . . . . . . . . . . . . . . . . . . . . . . . . . . 43
<directoryn ame1> directory renamed to <directoryname2> . . . . . . . . . . . . . . . . . . . . . . . . . . . . . . . 43
<filename> file copied. . . . . . . . . . . . . . . . . . . . . . . . . . . . . . . . . . . . . . . . . . . . . . . . . . . . . . . . . . . . . . 44
<filename> file deleted. . . . . . . . . . . . . . . . . . . . . . . . . . . . . . . . . . . . . . . . . . . . . . . . . . . . . . . . . . . . . 44
<filename> file loaded . . . . . . . . . . . . . . . . . . . . . . . . . . . . . . . . . . . . . . . . . . . . . . . . . . . . . . . . . . . . . 44
<filename> file saved . . . . . . . . . . . . . . . . . . . . . . . . . . . . . . . . . . . . . . . . . . . . . . . . . . . . . . . . . . . . . . 44
<filename> too many data entries. . . . . . . . . . . . . . . . . . . . . . . . . . . . . . . . . . . . . . . . . . . . . . . . . . . . 44
<filename1> file renamed to <filename2>. . . . . . . . . . . . . . . . . . . . . . . . . . . . . . . . . . . . . . . . . . . . . . 44
50 MHz Osc Unlevel . . . . . . . . . . . . . . . . . . . . . . . . . . . . . . . . . . . . . . . . . . . . . . . . . . . . . . . . . . . . . . . 37
Align Now All Needed (Align Needed). . . . . . . . . . . . . . . . . . . . . . . . . . . . . . . . . . . . . . . . . . . . . . . . . 37
Align Now RF Needed (Align Now RF Needed) . . . . . . . . . . . . . . . . . . . . . . . . . . . . . . . . . . . . . . . . . 38
Align RF Skipped (Align RF Skipped). . . . . . . . . . . . . . . . . . . . . . . . . . . . . . . . . . . . . . . . . . . . . . . . . 38
Atten auto set to 15 dB . . . . . . . . . . . . . . . . . . . . . . . . . . . . . . . . . . . . . . . . . . . . . . . . . . . . . . . . . . . . . 42
Auto Align not available when using Calibration Defau lts . . . . . . . . . . . . . . . . . . . . . . . . . . . . . . . . 30
Average Type incompatible for scale.. . . . . . . . . . . . . . . . . . . . . . . . . . . . . . . . . . . . . . . . . . . . . . . . . . 27
AVG 3 . . . . . . . . . . . . . . . . . . . . . . . . . . . . . . . . . . . . . . . . . . . . . . . . . . . . . . . . . . . . . . . . . . . . . . . . . . . 71
Bad or missing floppy disk. . . . . . . . . . . . . . . . . . . . . . . . . . . . . . . . . . . . . . . . . . . . . . . . . . . . . . . . . . 28
5
Page 6

Instrument Messages
Alphabetical Listing
Block data error . . . . . . . . . . . . . . . . . . . . . . . . . . . . . . . . . . . . . . . . . . . . . . . . . . . . . . . . . . . . . . . . . . .21
Block data not allowed. . . . . . . . . . . . . . . . . . . . . . . . . . . . . . . . . . . . . . . . . . . . . . . . . . . . . . . . . . . . . .20
Can’t Auto-Couple RBW in Zero Span . . . . . . . . . . . . . . . . . . . . . . . . . . . . . . . . . . . . . . . . . . . . . . . . .29
Can’t Aut o-Couple Sweep Time in Zero Span. . . . . . . . . . . . . . . . . . . . . . . . . . . . . . . . . . . . . . . . . . . .29
Cannot load a directory, please choose a file . . . . . . . . . . . . . . . . . . . . . . . . . . . . . . . . . . . . . . . . . . . .35
Character data error . . . . . . . . . . . . . . . . . . . . . . . . . . . . . . . . . . . . . . . . . . . . . . . . . . . . . . . . . . . . . . .22
Character data not allowed. . . . . . . . . . . . . . . . . . . . . . . . . . . . . . . . . . . . . . . . . . . . . . . . . . . . . . . . . .21
Character data too long. . . . . . . . . . . . . . . . . . . . . . . . . . . . . . . . . . . . . . . . . . . . . . . . . . . . . . . . . . . . .2 1
Clear all signal marks.. . . . . . . . . . . . . . . . . . . . . . . . . . . . . . . . . . . . . . . . . . . . . . . . . . . . . . . . . . . . . .43
Command error . . . . . . . . . . . . . . . . . . . . . . . . . . . . . . . . . . . . . . . . . . . . . . . . . . . . . . . . . . . . . . . . . . .25
Command header error . . . . . . . . . . . . . . . . . . . . . . . . . . . . . . . . . . . . . . . . . . . . . . . . . . . . . . . . . . . . .24
Command not recognized . . . . . . . . . . . . . . . . . . . . . . . . . . . . . . . . . . . . . . . . . . . . . . . . . . . . . . . . . . .25
Command not valid in this model. . . . . . . . . . . . . . . . . . . . . . . . . . . . . . . . . . . . . . . . . . . . . . . . . . . . .27
Complementing marked signals.. . . . . . . . . . . . . . . . . . . . . . . . . . . . . . . . . . . . . . . . . . . . . . . . . . . . . .43
Connect Amptd Ref Output to Input. . . . . . . . . . . . . . . . . . . . . . . . . . . . . . . . . . . . . . . . . . . . . . . . . . .29
Connect RF OUT to INPUT. . . . . . . . . . . . . . . . . . . . . . . . . . . . . . . . . . . . . . . . . . . . . . . . . . . . . . . . . .2 9
Corrupted file . . . . . . . . . . . . . . . . . . . . . . . . . . . . . . . . . . . . . . . . . . . . . . . . . . . . . . . . . . . . . . . . . . . . .29
Data corrupt or stale.. . . . . . . . . . . . . . . . . . . . . . . . . . . . . . . . . . . . . . . . . . . . . . . . . . . . . . . . . . . . . . . 1 9
Data type error. . . . . . . . . . . . . . . . . . . . . . . . . . . . . . . . . . . . . . . . . . . . . . . . . . . . . . . . . . . . . . . . . . . .2 4
DC Coupled. . . . . . . . . . . . . . . . . . . . . . . . . . . . . . . . . . . . . . . . . . . . . . . . . . . . . . . . . . . . . . . . . . . . . . .38
Deleted a ll signals.. . . . . . . . . . . . . . . . . . . . . . . . . . . . . . . . . . . . . . . . . . . . . . . . . . . . . . . . . . . . . . . . . 4 3
Deleted s ignal. . . . . . . . . . . . . . . . . . . . . . . . . . . . . . . . . . . . . . . . . . . . . . . . . . . . . . . . . . . . . . . . . . . . .43
Deleting marked signals. . . . . . . . . . . . . . . . . . . . . . . . . . . . . . . . . . . . . . . . . . . . . . . . . . . . . . . . . . . . .43
Demod ON: reduce span for audible detection. . . . . . . . . . . . . . . . . . . . . . . . . . . . . . . . . . . . . . . . . . .39
Device-specific error. . . . . . . . . . . . . . . . . . . . . . . . . . . . . . . . . . . . . . . . . . . . . . . . . . . . . . . . . . . . . . . .1 9
Directory already exists. . . . . . . . . . . . . . . . . . . . . . . . . . . . . . . . . . . . . . . . . . . . . . . . . . . . . . . . . . . . .44
Execution error. . . . . . . . . . . . . . . . . . . . . . . . . . . . . . . . . . . . . . . . . . . . . . . . . . . . . . . . . . . . . . . . . . . .2 0
Exponent too large 23
Exponent too large. . . . . . . . . . . . . . . . . . . . . . . . . . . . . . . . . . . . . . . . . . . . . . . . . . . . . . . . . . . . . . . . .23
Expression data error . . . . . . . . . . . . . . . . . . . . . . . . . . . . . . . . . . . . . . . . . . . . . . . . . . . . . . . . . . . . . .20
Expression data not allowed . . . . . . . . . . . . . . . . . . . . . . . . . . . . . . . . . . . . . . . . . . . . . . . . . . . . . . . . .20
Ext Ref . . . . . . . . . . . . . . . . . . . . . . . . . . . . . . . . . . . . . . . . . . . . . . . . . . . . . . . . . . . . . . . . . . . . . . . . . .39
File access is denied. . . . . . . . . . . . . . . . . . . . . . . . . . . . . . . . . . . . . . . . . . . . . . . . . . . . . . . . . . . . . . . .28
File already exists . . . . . . . . . . . . . . . . . . . . . . . . . . . . . . . . . . . . . . . . . . . . . . . . . . . . . . . . . . . . . . . . .2 8
6
Page 7

Instrument Messages
Alphabetical Listin g
File Name Error . . . . . . . . . . . . . . . . . . . . . . . . . . . . . . . . . . . . . . . . . . . . . . . . . . . . . . . . . . . . . . . . . . 28
File not found . . . . . . . . . . . . . . . . . . . . . . . . . . . . . . . . . . . . . . . . . . . . . . . . . . . . . . . . . . . . . . . . . . . . 28
Flash memory is full. . . . . . . . . . . . . . . . . . . . . . . . . . . . . . . . . . . . . . . . . . . . . . . . . . . . . . . . . . . . . . . 28
Flat corr off (no corresponding status bit). . . . . . . . . . . . . . . . . . . . . . . . . . . . . . . . . . . . . . . . . . . . . . 39
Floppy disk error. . . . . . . . . . . . . . . . . . . . . . . . . . . . . . . . . . . . . . . . . . . . . . . . . . . . . . . . . . . . . . . . . . 27
Floppy disk full . . . . . . . . . . . . . . . . . . . . . . . . . . . . . . . . . . . . . . . . . . . . . . . . . . . . . . . . . . . . . . . . . . . 27
Freq corr off (no corresponding status bit) . . . . . . . . . . . . . . . . . . . . . . . . . . . . . . . . . . . . . . . . . . . . . 39
Frequency Reference Error . . . . . . . . . . . . . . . . . . . . . . . . . . . . . . . . . . . . . . . . . . . . . . . . . . . . . . . . . 39
GET not all owed . . . . . . . . . . . . . . . . . . . . . . . . . . . . . . . . . . . . . . . . . . . . . . . . . . . . . . . . . . . . . . . . . . 24
Header separa tor error. . . . . . . . . . . . . . . . . . . . . . . . . . . . . . . . . . . . . . . . . . . . . . . . . . . . . . . . . . . . . 23
Header suffix out of range . . . . . . . . . . . . . . . . . . . . . . . . . . . . . . . . . . . . . . . . . . . . . . . . . . . . . . . . . . 23
IF Gain fixed . . . . . . . . . . . . . . . . . . . . . . . . . . . . . . . . . . . . . . . . . . . . . . . . . . . . . . . . . . . . . . . . . . . . . 4 0
IF Overload. . . . . . . . . . . . . . . . . . . . . . . . . . . . . . . . . . . . . . . . . . . . . . . . . . . . . . . . . . . . . . . . . . . . . . 40
Illegal w rite access of Flash memory. . . . . . . . . . . . . . . . . . . . . . . . . . . . . . . . . . . . . . . . . . . . . . . . . . 29
In <command>: bad data count (<numeric_value>): expected multiple of <numeric_value> . . . . . 31
In <filen ame>, line <nnn>: separator missing . . . . . . . . . . . . . . . . . . . . . . . . . . . . . . . . . . . . . . . . . . 31
In <filename>, line <numeric_value>: <xxx> is not numeric. . . . . . . . . . . . . . . . . . . . . . . . . . . . . . . 32
In <filen ame>, line <numeric_value>: error parsing tokens . . . . . . . . . . . . . . . . . . . . . . . . . . . . . . . 32
In <filename>, line <numeric_value>: line too long . . . . . . . . . . . . . . . . . . . . . . . . . . . . . . . . . . . . . . 31
In <filename>: [DATA] header missing. . . . . . . . . . . . . . . . . . . . . . . . . . . . . . . . . . . . . . . . . . . . . . . . 31
In <filename>: bad amplitude unit <unit> . . . . . . . . . . . . . . . . . . . . . . . . . . . . . . . . . . . . . . . . . . . . . 32
In <filen ame>: error reading file . . . . . . . . . . . . . . . . . . . . . . . . . . . . . . . . . . . . . . . . . . . . . . . . . . . . . 31
Incorrect filename, allowable extensions are .gif or.wmf . . . . . . . . . . . . . . . . . . . . . . . . . . . . . . . . . 34
Incorrect filename, allowable extensions are .trc or.csv . . . . . . . . . . . . . . . . . . . . . . . . . . . . . . . . . . 34
Input is internal (no corresponding status bit) . . . . . . . . . . . . . . . . . . . . . . . . . . . . . . . . . . . . . . . . . . 40
Instrument mode requested is not supported. . . . . . . . . . . . . . . . . . . . . . . . . . . . . . . . . . . . . . . . . . . 34
Instrument state may be corrupt, state has been reset to initia l values. . . . . . . . . . . . . . . . . . . . . . 33
Interpolation error: cannot compute log of <negative_frequency_value>. . . . . . . . . . . . . . . . . . . . . 32
Invalid Baud Rate. . . . . . . . . . . . . . . . . . . . . . . . . . . . . . . . . . . . . . . . . . . . . . . . . . . . . . . . . . . . . . . . . 26
Invalid block data . . . . . . . . . . . . . . . . . . . . . . . . . . . . . . . . . . . . . . . . . . . . . . . . . . . . . . . . . . . . . . . . . 21
Invalid ch aracter data . . . . . . . . . . . . . . . . . . . . . . . . . . . . . . . . . . . . . . . . . . . . . . . . . . . . . . . . . . . . . 22
Invalid ch aracter in number . . . . . . . . . . . . . . . . . . . . . . . . . . . . . . . . . . . . . . . . . . . . . . . . . . . . . . . . 23
Invalid ch aracter. . . . . . . . . . . . . . . . . . . . . . . . . . . . . . . . . . . . . . . . . . . . . . . . . . . . . . . . . . . . . . . . . . 25
Invalid expression. . . . . . . . . . . . . . . . . . . . . . . . . . . . . . . . . . . . . . . . . . . . . . . . . . . . . . . . . . . . . . . . . 20
7
Page 8

Instrument Messages
Alphabetical Listing
Invalid i ndex used to reference signal.. . . . . . . . . . . . . . . . . . . . . . . . . . . . . . . . . . . . . . . . . . . . . . . . .35
Invalid i nstrument mode. . . . . . . . . . . . . . . . . . . . . . . . . . . . . . . . . . . . . . . . . . . . . . . . . . . . . . . . . . . .34
Invalid option, unable to uninstall package. . . . . . . . . . . . . . . . . . . . . . . . . . . . . . . . . . . . . . . . . . . . .27
Invalid printer response . . . . . . . . . . . . . . . . . . . . . . . . . . . . . . . . . . . . . . . . . . . . . . . . . . . . . . . . . . . .30
Invalid separator . . . . . . . . . . . . . . . . . . . . . . . . . . . . . . . . . . . . . . . . . . . . . . . . . . . . . . . . . . . . . . . . . .24
Invalid string data. . . . . . . . . . . . . . . . . . . . . . . . . . . . . . . . . . . . . . . . . . . . . . . . . . . . . . . . . . . . . . . . .21
Invalid suffix . . . . . . . . . . . . . . . . . . . . . . . . . . . . . . . . . . . . . . . . . . . . . . . . . . . . . . . . . . . . . . . . . . . . .22
LO Out Unlevel . . . . . . . . . . . . . . . . . . . . . . . . . . . . . . . . . . . . . . . . . . . . . . . . . . . . . . . . . . . . . . . . . . . 4 0
LO Unlevel (LO Unleveled). . . . . . . . . . . . . . . . . . . . . . . . . . . . . . . . . . . . . . . . . . . . . . . . . . . . . . . . . .40
LO Unlock. . . . . . . . . . . . . . . . . . . . . . . . . . . . . . . . . . . . . . . . . . . . . . . . . . . . . . . . . . . . . . . . . . . . . . . .40
Log Corr Off (no correspon ding status bit). . . . . . . . . . . . . . . . . . . . . . . . . . . . . . . . . . . . . . . . . . . . . .41
Marker Count:Widen Res BW. . . . . . . . . . . . . . . . . . . . . . . . . . . . . . . . . . . . . . . . . . . . . . . . . . . . . . . .41
Marking all duplicate signals.. . . . . . . . . . . . . . . . . . . . . . . . . . . . . . . . . . . . . . . . . . . . . . . . . . . . . . . .44
Marking all signals.. . . . . . . . . . . . . . . . . . . . . . . . . . . . . . . . . . . . . . . . . . . . . . . . . . . . . . . . . . . . . . . .45
Marking lower duplicate sig nals. . . . . . . . . . . . . . . . . . . . . . . . . . . . . . . . . . . . . . . . . . . . . . . . . . . . . . 4 5
Marking signals to end of list.. . . . . . . . . . . . . . . . . . . . . . . . . . . . . . . . . . . . . . . . . . . . . . . . . . . . . . . .45
Meas Uncal. . . . . . . . . . . . . . . . . . . . . . . . . . . . . . . . . . . . . . . . . . . . . . . . . . . . . . . . . . . . . . . . . . . . . . .41
Measurement Aborted . . . . . . . . . . . . . . . . . . . . . . . . . . . . . . . . . . . . . . . . . . . . . . . . . . . . . . . . . . . . . .45
Measurement D one . . . . . . . . . . . . . . . . . . . . . . . . . . . . . . . . . . . . . . . . . . . . . . . . . . . . . . . . . . . . . . . .45
Measurement paused ; p ress Re sume to co ntinu e, Abor t, or Restart .. . . . . . . . . . . . . . . . . . . . . . . . .45
Measurement Resuming.... . . . . . . . . . . . . . . . . . . . . . . . . . . . . . . . . . . . . . . . . . . . . . . . . . . . . . . . . . .4 5
Measuring Signal... . . . . . . . . . . . . . . . . . . . . . . . . . . . . . . . . . . . . . . . . . . . . . . . . . . . . . . . . . . . . . . . .4 6
Measuring Signal...Done . . . . . . . . . . . . . . . . . . . . . . . . . . . . . . . . . . . . . . . . . . . . . . . . . . . . . . . . . . . .46
Media is corrupt. . . . . . . . . . . . . . . . . . . . . . . . . . . . . . . . . . . . . . . . . . . . . . . . . . . . . . . . . . . . . . . . . . .28
Media is not writable. . . . . . . . . . . . . . . . . . . . . . . . . . . . . . . . . . . . . . . . . . . . . . . . . . . . . . . . . . . . . . .28
Media is protected . . . . . . . . . . . . . . . . . . . . . . . . . . . . . . . . . . . . . . . . . . . . . . . . . . . . . . . . . . . . . . . . .2 8
Missing parameter. . . . . . . . . . . . . . . . . . . . . . . . . . . . . . . . . . . . . . . . . . . . . . . . . . . . . . . . . . . . . . . . .24
No error . . . . . . . . . . . . . . . . . . . . . . . . . . . . . . . . . . . . . . . . . . . . . . . . . . . . . . . . . . . . . . . . . . . . . . . . .18
No peak found . . . . . . . . . . . . . . . . . . . . . . . . . . . . . . . . . . . . . . . . . . . . . . . . . . . . . . . . . . . . . . . . . . . . 2 5
Numeric data error . . . . . . . . . . . . . . . . . . . . . . . . . . . . . . . . . . . . . . . . . . . . . . . . . . . . . . . . . . . . . . . .23
Numeric data not allowed . . . . . . . . . . . . . . . . . . . . . . . . . . . . . . . . . . . . . . . . . . . . . . . . . . . . . . . . . . .22
Option activated. . . . . . . . . . . . . . . . . . . . . . . . . . . . . . . . . . . . . . . . . . . . . . . . . . . . . . . . . . . . . . . . . . .46
Option not installed . . . . . . . . . . . . . . . . . . . . . . . . . . . . . . . . . . . . . . . . . . . . . . . . . . . . . . . . . . . . . . . .25
Option not licensed. . . . . . . . . . . . . . . . . . . . . . . . . . . . . . . . . . . . . . . . . . . . . . . . . . . . . . . . . . . . . . . . .27
8
Page 9

Instrument Messages
Alphabetical Listin g
Overload . . . . . . . . . . . . . . . . . . . . . . . . . . . . . . . . . . . . . . . . . . . . . . . . . . . . . . . . . . . . . . . . . . . . . . . . 41
Parameter not allowed . . . . . . . . . . . . . . . . . . . . . . . . . . . . . . . . . . . . . . . . . . . . . . . . . . . . . . . . . . . . . 24
Peaking Signal (no correspondi ng status bit). . . . . . . . . . . . . . . . . . . . . . . . . . . . . . . . . . . . . . . . . . . 41
Preselector centering failed . . . . . . . . . . . . . . . . . . . . . . . . . . . . . . . . . . . . . . . . . . . . . . . . . . . . . . . . . 26
Preselector not available . . . . . . . . . . . . . . . . . . . . . . . . . . . . . . . . . . . . . . . . . . . . . . . . . . . . . . . . . . . 35
Printer interface error . . . . . . . . . . . . . . . . . . . . . . . . . . . . . . . . . . . . . . . . . . . . . . . . . . . . . . . . . . . . . 30
Printer Type is None. . . . . . . . . . . . . . . . . . . . . . . . . . . . . . . . . . . . . . . . . . . . . . . . . . . . . . . . . . . . . . . 31
Program mnemonic too long. . . . . . . . . . . . . . . . . . . . . . . . . . . . . . . . . . . . . . . . . . . . . . . . . . . . . . . . . 23
Query DEADLOCKED. . . . . . . . . . . . . . . . . . . . . . . . . . . . . . . . . . . . . . . . . . . . . . . . . . . . . . . . . . . . . 18
Query Error. . . . . . . . . . . . . . . . . . . . . . . . . . . . . . . . . . . . . . . . . . . . . . . . . . . . . . . . . . . . . . . . . . . . . . 19
Query INTERRUPTED . . . . . . . . . . . . . . . . . . . . . . . . . . . . . . . . . . . . . . . . . . . . . . . . . . . . . . . . . . . . 18
Query UNTERMINATED after indefinite response. . . . . . . . . . . . . . . . . . . . . . . . . . . . . . . . . . . . . . 18
Query UNTERMINATED. . . . . . . . . . . . . . . . . . . . . . . . . . . . . . . . . . . . . . . . . . . . . . . . . . . . . . . . . . . 18
RBW limited to 1 kHz when Span > 5 MHz . . . . . . . . . . . . . . . . . . . . . . . . . . . . . . . . . . . . . . . . . . . . 26
Remeasuring all signals. . . . . . . . . . . . . . . . . . . . . . . . . . . . . . . . . . . . . . . . . . . . . . . . . . . . . . . . . . . . 46
Remeasuring cu rrent signal. . . . . . . . . . . . . . . . . . . . . . . . . . . . . . . . . . . . . . . . . . . . . . . . . . . . . . . . . 46
Remeasuring marked signals. . . . . . . . . . . . . . . . . . . . . . . . . . . . . . . . . . . . . . . . . . . . . . . . . . . . . . . . 46
RS-232 Interface Error. . . . . . . . . . . . . . . . . . . . . . . . . . . . . . . . . . . . . . . . . . . . . . . . . . . . . . . . . . . . . 27
Settings conflict; parameter currently disabled . . . . . . . . . . . . . . . . . . . . . . . . . . . . . . . . . . . . . . . . . 20
Shutdown in process. . . . . . . . . . . . . . . . . . . . . . . . . . . . . . . . . . . . . . . . . . . . . . . . . . . . . . . . . . . . . . . 46
Signal add failed. . . . . . . . . . . . . . . . . . . . . . . . . . . . . . . . . . . . . . . . . . . . . . . . . . . . . . . . . . . . . . . . . . 35
Signal Added To List. . . . . . . . . . . . . . . . . . . . . . . . . . . . . . . . . . . . . . . . . . . . . . . . . . . . . . . . . . . . . . . 46
Signal comment truncated to 31 characters.. . . . . . . . . . . . . . . . . . . . . . . . . . . . . . . . . . . . . . . . . . . . 47
Signal list is full. Signa l not added. . . . . . . . . . . . . . . . . . . . . . . . . . . . . . . . . . . . . . . . . . . . . . . . . . . . 35
Signal missing required frequency. Signal not added. . . . . . . . . . . . . . . . . . . . . . . . . . . . . . . . . . . . . 35
Signal no t ad d ed to list. Signal list is at ca pacit y. . . . . . . . . . . . . . . . . . . . . . . . . . . . . . . . . . . . . . . . 36
Signal not added to list. . . . . . . . . . . . . . . . . . . . . . . . . . . . . . . . . . . . . . . . . . . . . . . . . . . . . . . . . . . . . 36
Signal Search Complete, <#> Found. . . . . . . . . . . . . . . . . . . . . . . . . . . . . . . . . . . . . . . . . . . . . . . . . . 47
Signal string contains bad flag for mark. Sign al not added. . . . . . . . . . . . . . . . . . . . . . . . . . . . . . . . 36
Signal string contains detector flag. Signal n ot added. . . . . . . . . . . . . . . . . . . . . . . . . . . . . . . . . . . . 36
Signal string malformed. Signal not added. . . . . . . . . . . . . . . . . . . . . . . . . . . . . . . . . . . . . . . . . . . . . 36
Sorting by ascending average amplitude. . . . . . . . . . . . . . . . . . . . . . . . . . . . . . . . . . . . . . . . . . . . . . . 47
Sorting by ascending frequency.. . . . . . . . . . . . . . . . . . . . . . . . . . . . . . . . . . . . . . . . . . . . . . . . . . . . . . 4 7
Sorting by ascending LL1 delta. . . . . . . . . . . . . . . . . . . . . . . . . . . . . . . . . . . . . . . . . . . . . . . . . . . . . . 47
9
Page 10

Instrument Messages
Alphabetical Listing
Sorting by ascending LL2 delta. . . . . . . . . . . . . . . . . . . . . . . . . . . . . . . . . . . . . . . . . . . . . . . . . . . . . . .47
Sorting by ascending peak amplitude. . . . . . . . . . . . . . . . . . . . . . . . . . . . . . . . . . . . . . . . . . . . . . . . . .47
Sorting by ascending quasi-peak amplitude. . . . . . . . . . . . . . . . . . . . . . . . . . . . . . . . . . . . . . . . . . . . .48
Sorting by descending average amplitude.. . . . . . . . . . . . . . . . . . . . . . . . . . . . . . . . . . . . . . . . . . . . . .48
Sorting by descending freq uency. . . . . . . . . . . . . . . . . . . . . . . . . . . . . . . . . . . . . . . . . . . . . . . . . . . . . .48
Sorting by descending LL1 delta. . . . . . . . . . . . . . . . . . . . . . . . . . . . . . . . . . . . . . . . . . . . . . . . . . . . . .48
Sorting by descending LL2 delta. . . . . . . . . . . . . . . . . . . . . . . . . . . . . . . . . . . . . . . . . . . . . . . . . . . . . .48
Sorting by descending peak a mplitude. . . . . . . . . . . . . . . . . . . . . . . . . . . . . . . . . . . . . . . . . . . . . . . . .48
Sorting by descending quasi-peak amplitude. . . . . . . . . . . . . . . . . . . . . . . . . . . . . . . . . . . . . . . . . . . .48
Source LO Unlevel. . . . . . . . . . . . . . . . . . . . . . . . . . . . . . . . . . . . . . . . . . . . . . . . . . . . . . . . . . . . . . . . .41
Source LO Unlock (Source Sy nth Unlocked) . . . . . . . . . . . . . . . . . . . . . . . . . . . . . . . . . . . . . . . . . . . .42
Source Unlevel . . . . . . . . . . . . . . . . . . . . . . . . . . . . . . . . . . . . . . . . . . . . . . . . . . . . . . . . . . . . . . . . . . . .42
Span limited to 5 MHz when RBW < 1 kHz . . . . . . . . . . . . . . . . . . . . . . . . . . . . . . . . . . . . . . . . . . . . .26
Store Ref trace before turning on Normalize . . . . . . . . . . . . . . . . . . . . . . . . . . . . . . . . . . . . . . . . . . . .35
String data error . . . . . . . . . . . . . . . . . . . . . . . . . . . . . . . . . . . . . . . . . . . . . . . . . . . . . . . . . . . . . . . . . .21
String data not allowed . . . . . . . . . . . . . . . . . . . . . . . . . . . . . . . . . . . . . . . . . . . . . . . . . . . . . . . . . . . . . 2 1
Strong Adjacent Signal . . . . . . . . . . . . . . . . . . . . . . . . . . . . . . . . . . . . . . . . . . . . . . . . . . . . . . . . . . . . .36
Suffix error . . . . . . . . . . . . . . . . . . . . . . . . . . . . . . . . . . . . . . . . . . . . . . . . . . . . . . . . . . . . . . . . . . . . . . .22
Suffix not allowed. . . . . . . . . . . . . . . . . . . . . . . . . . . . . . . . . . . . . . . . . . . . . . . . . . . . . . . . . . . . . . . . . .22
Suffix too long. . . . . . . . . . . . . . . . . . . . . . . . . . . . . . . . . . . . . . . . . . . . . . . . . . . . . . . . . . . . . . . . . . . . .22
Syntax error . . . . . . . . . . . . . . . . . . . . . . . . . . . . . . . . . . . . . . . . . . . . . . . . . . . . . . . . . . . . . . . . . . . . . .24
System Alignments, Align Now, All Required . . . . . . . . . . . . . . . . . . . . . . . . . . . . . . . . . . . . . . . . . . .42
System error. . . . . . . . . . . . . . . . . . . . . . . . . . . . . . . . . . . . . . . . . . . . . . . . . . . . . . . . . . . . . . . . . . . . . .19
TG Frequency Limit. . . . . . . . . . . . . . . . . . . . . . . . . . . . . . . . . . . . . . . . . . . . . . . . . . . . . . . . . . . . . . . .25
TG start freq is less than 1/2 res bw. . . . . . . . . . . . . . . . . . . . . . . . . . . . . . . . . . . . . . . . . . . . . . . . . . .26
TG start freq is less than 9 kHz . . . . . . . . . . . . . . . . . . . . . . . . . . . . . . . . . . . . . . . . . . . . . . . . . . . . . .2 6
Too many data values at <freq_or_time_value>. . . . . . . . . . . . . . . . . . . . . . . . . . . . . . . . . . . . . . . . . .32
Too many digits . . . . . . . . . . . . . . . . . . . . . . . . . . . . . . . . . . . . . . . . . . . . . . . . . . . . . . . . . . . . . . . . . . .23
Too much data; < description of th e type of data exceeded>. . . . . . . . . . . . . . . . . . . . . . . . . . . . . . . . .19
Tracking Peak Needed. . . . . . . . . . . . . . . . . . . . . . . . . . . . . . . . . . . . . . . . . . . . . . . . . . . . . . . . . . . . . .49
Trigger Offset unavailable in swept spans . . . . . . . . . . . . . . . . . . . . . . . . . . . . . . . . . . . . . . . . . . . . . .27
Unable to initialize flatness data . . . . . . . . . . . . . . . . . . . . . . . . . . . . . . . . . . . . . . . . . . . . . . . . . . . . .26
Unable to load file . . . . . . . . . . . . . . . . . . . . . . . . . . . . . . . . . . . . . . . . . . . . . . . . . . . . . . . . . . . . . . . . . 3 4
Unable to load state from file . . . . . . . . . . . . . . . . . . . . . . . . . . . . . . . . . . . . . . . . . . . . . . . . . . . . . . . .33
10
Page 11

Instrument Messages
Alphabetical Listin g
Unable to load state from register . . . . . . . . . . . . . . . . . . . . . . . . . . . . . . . . . . . . . . . . . . . . . . . . . . . . 33
Unable to load state . . . . . . . . . . . . . . . . . . . . . . . . . . . . . . . . . . . . . . . . . . . . . . . . . . . . . . . . . . . . . . . 33
Unable to load user state, factory preset was done . . . . . . . . . . . . . . . . . . . . . . . . . . . . . . . . . . . . . . 33
Unable to qu ery state. . . . . . . . . . . . . . . . . . . . . . . . . . . . . . . . . . . . . . . . . . . . . . . . . . . . . . . . . . . . . . 33
Unable to sa ve file . . . . . . . . . . . . . . . . . . . . . . . . . . . . . . . . . . . . . . . . . . . . . . . . . . . . . . . . . . . . . . . . 34
Unable to sa ve state to file. . . . . . . . . . . . . . . . . . . . . . . . . . . . . . . . . . . . . . . . . . . . . . . . . . . . . . . . . . 33
Unable to sa ve state to register . . . . . . . . . . . . . . . . . . . . . . . . . . . . . . . . . . . . . . . . . . . . . . . . . . . . . . 33
Unable to sa ve user state. . . . . . . . . . . . . . . . . . . . . . . . . . . . . . . . . . . . . . . . . . . . . . . . . . . . . . . . . . . 33
Unable to set state . . . . . . . . . . . . . . . . . . . . . . . . . . . . . . . . . . . . . . . . . . . . . . . . . . . . . . . . . . . . . . . . 34
Unable to store flatness data. . . . . . . . . . . . . . . . . . . . . . . . . . . . . . . . . . . . . . . . . . . . . . . . . . . . . . . . 26
Unable to uninstall personality, file not deletable.. . . . . . . . . . . . . . . . . . . . . . . . . . . . . . . . . . . . . . . 37
Undefined hea der . . . . . . . . . . . . . . . . . . . . . . . . . . . . . . . . . . . . . . . . . . . . . . . . . . . . . . . . . . . . . . . . . 23
Unknown printer . . . . . . . . . . . . . . . . . . . . . . . . . . . . . . . . . . . . . . . . . . . . . . . . . . . . . . . . . . . . . . . . . 30
Unsupported pri nter. . . . . . . . . . . . . . . . . . . . . . . . . . . . . . . . . . . . . . . . . . . . . . . . . . . . . . . . . . . . . . . 30
Video shift off (no corresponding status bit) . . . . . . . . . . . . . . . . . . . . . . . . . . . . . . . . . . . . . . . . . . . . 42
Volume <name> formatted. . . . . . . . . . . . . . . . . . . . . . . . . . . . . . . . . . . . . . . . . . . . . . . . . . . . . . . . . . 4 9
WARN I N G : You are about to delete all of the contents on direc tory “x:\xxxxx\”. Press Delete Now
again to proceed or any other key to abort.. . . . . . . . . . . . . . . . . . . . . . . . . . . . . . . . . . . . . . . . . . . . . 49
Wrong density floppy inserted . . . . . . . . . . . . . . . . . . . . . . . . . . . . . . . . . . . . . . . . . . . . . . . . . . . . . . . 29
11
Page 12

Instrument Messages
Alphabetical Listing
12
Page 13

1 Instrument Messa ges
13
Page 14

Instrument Messages
Instrument Messages Introduction
Instrument Messages Introduction
The analyzer can generate various messages that appear on the displa y
during operation. There are four types of messages.
• Status Me ssages, beginning on page 37, appear on the right side of
the ana ly z er display and /o r set status bit s in t h e SC PI Status
Register syst e m . T hes e m e ssa ge s indicate a conditi on th at m ay
result in erroneous data being displayed. Most messages will only be
displayed unt il t h e error condi t ion is corre c t e d . M u lt iple messages
can be displayed and will be listed in the display area. In each case
the name of the corresponding status bit is indicated in parenthes i s .
It will be no t e d if o n ly a st at u s bi t is u se d (n o me ssage).
• Informat ional Messages, beginning on page 42, provide information
that requires inter venti on. These messages appear in the status line
at the bottom of the display. If you have a color display and are using
the default display colors, the message will appear in green. The
message will remain until you preset the analyzer, press
anothe r messa ge is displayed in th e status lin e. The info rmatio n
provided in brackets, for example <filename> or <directory>, is a
variable that represents a specific input provided previously.
ESC, or
• User Error Messages, beginning on page 18, appear when an
attempt h as been made to se t a parameter inco rre ctly or an
operation has fa iled ( s uc h a s s aving a file). These messages are often
generate d du ring remote op e rat ion when an invalid progra mm in g
command has been entered. These messa ge s a ppe ar in the status
line at the bottom of the display. If you have a color display and are
using the default d isplay colors, the message will appear in yellow.
The message will remain until you preset the analyzer, press
ESC, or
another message is displayed in the status line. A summary of the
last 30 error messages preceded by an error number may be viewed
in the Error Queue by pressing,
System then Show Errors. Refer to
Table 1-1 for more inf ormation on the characteristics of the Error
Queue. When a remote interface initiates activity that generates an
error , the messages are outp ut to the remote bus. When output to the
remote interface, they are preceded by an error number.
When a user error conditi on occurs in the analyzer as a result of
SCPI (remote interface) activi ty, it is repor ted to both the front panel
display error queue and the S CPI error queue. If i t is a res ult of front
panel activity, it reports to the front panel display err or queue, and
depen din g on the error, may also re po rt t o th e SCPI error que u e .
These two queues are viewed and managed separately.
14 Chap ter 1
Page 15

T able 1-1 Characteristics of the Error Queue
Instrument Messages
Instrument Messages Introduction
Characteristic Front Panel Display
Error Queue
Capacity (number of errors) 30 30
Overflow Handling Circular (rotating).
Drops oldest error as new
error co mes in.
Viewing Entries Press:
Clearing the Queue Press:
Clear Error Queue
System, Show Errors Use SCPI query
System, Show Errors,
SCPI Remote Interface
Error Queue
Linear, first-in/first-out.
Replaces newes t error with:
–350, Queue overflow
Power up.
Send a *CLS command.
Read last item in the queue.
Note that the error num ber is displayed under the System,
Show Errors key sequence.
• Pop-up Messages indicate a condition that may r equire interv ention.
They appear in the m iddle of the display in a framed box. The
message will remain until the appropriate intervention has taken
place or the cond ition has been corrected.
Error Message Format
SYSTem:ERRor?
The system–defined error numbers are chosen on an enumerated (“1 of
N”) basis. The error messages are listed in numerical order accor ding to
the error message number. Status and Info rmati ona l mes sages w it hout
numbe rs will be l isted in alphabetical order fo llowing t he n umeric al
listing.
NOTE To see an error number, view the error queue as described on page15.
In this ch apter, an explanation is included with each er ro r t o fur ther
clarify its meaning. The last error described in each class (for example,
–400, –300, –200, –100) is a “generic” error. There are also references to
the IEEE Standard 488.2-1992, IEEE Standard Codes, Formats,
Protocols and Common Commands for Use with ANS I/IEEE Std
488.1-1987. New York, NY, 1992.
Error messages are displ ayed at the bottom of the screen in the status
line (yel lo w on color displays). The error n u mber is available thr ough
the remote interface and the show errors screen; it is not displayed in
the status line.
Chapter 1 15
Page 16
Instrument Messages
Instrument Messages Introduction
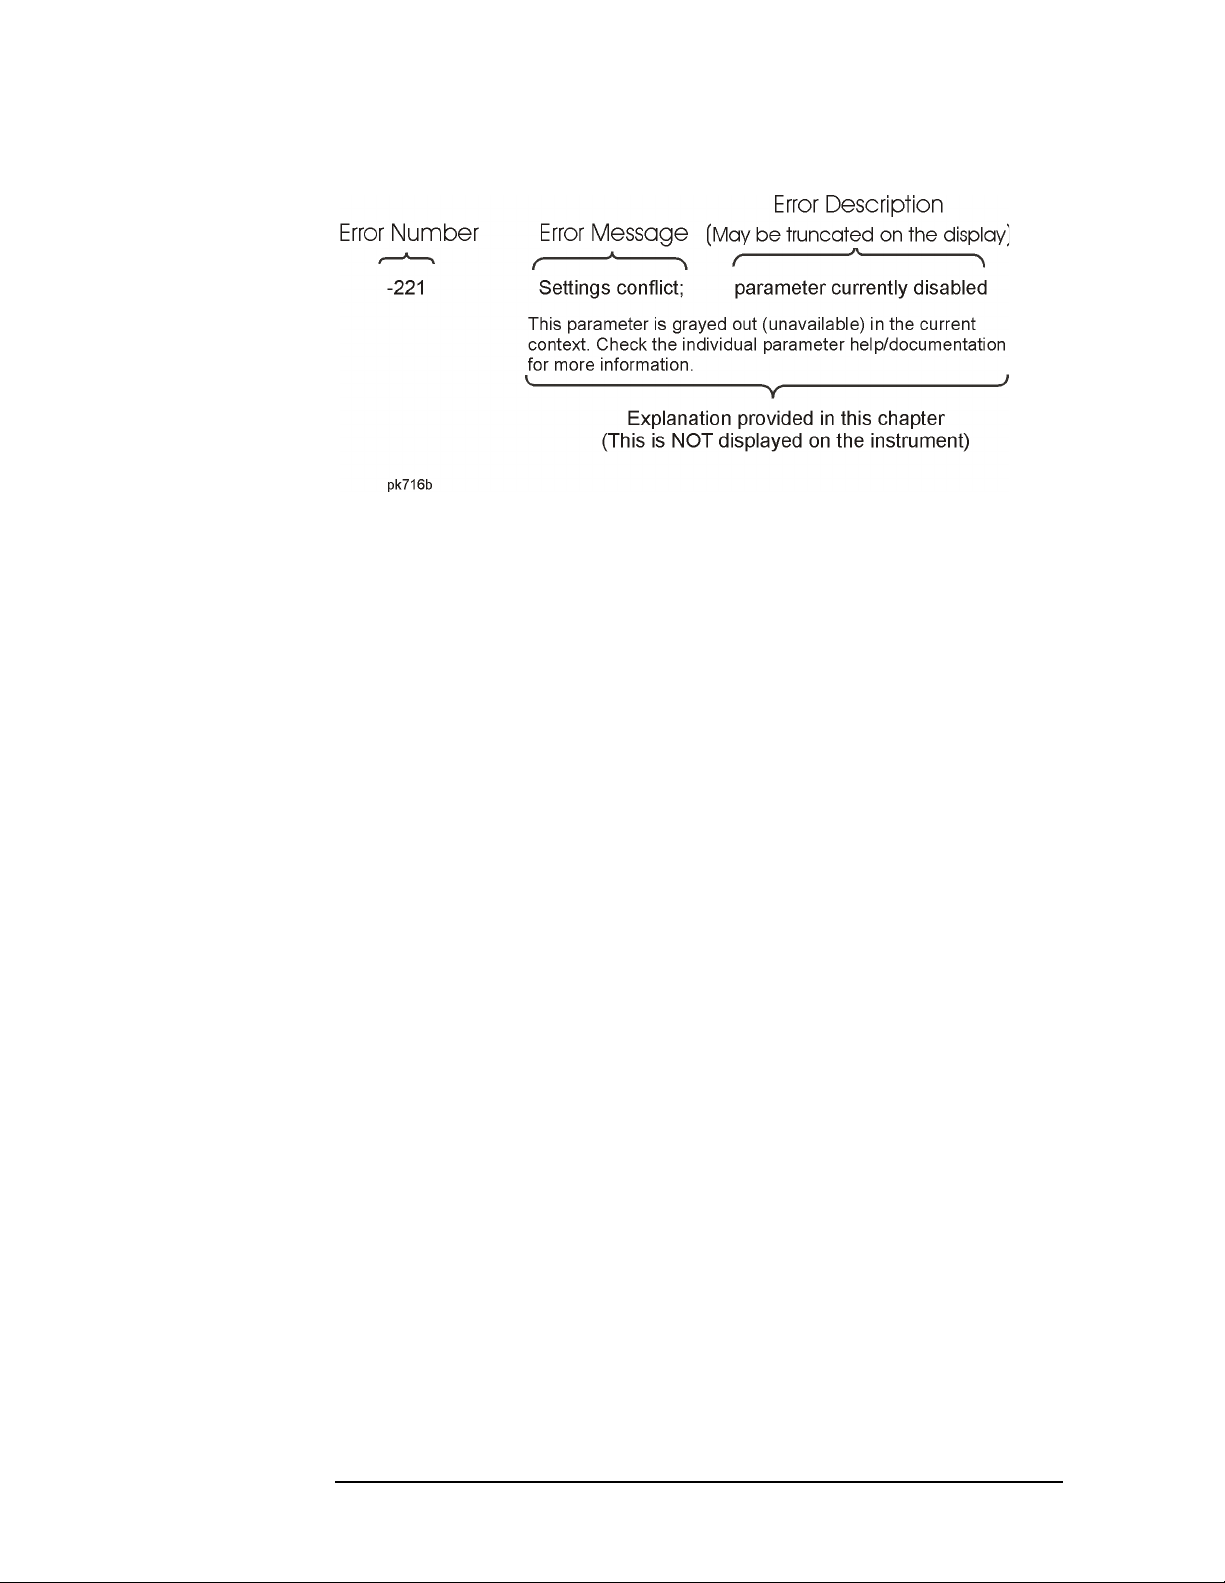
Figure 1-1 Error Message Example
Error Message Types
Events do not generate m ore than one type of error. For example, an
event that generates a query error will not generate a device-specific,
execution, or com m and error.
–499 to –400:
Query Errors
–399 to –300:
Device-Specific
Errors
–299 to –200:
Execution Errors
–199 to –100:
Command Errors
These errors indicate that the analyzer output queue control has
detected a problem with the message exchange protocol describ ed in
IEEE 488.2, Chapter 6. Errors in this class set the query error bit (bit 2)
in the event status register (IEEE 488.2, section 11.5.1 ) . These errors
correspond to message exchange protocol errors described i n IEEE
488.2, 6.5. In t his case:
• Either an attempt is being made to read data from the output queue
when no output is either present or pending, or
• data in the output queue has been lost.
An error nu mber in the ran ge –399 to –300 indicates that the analyzer
has detected an err or where some device operations did not properly
complete, possibly due to an abnormal hardware or firmware condition.
This is not a er ro r in re sponse to a S C PI query or command, or
command execution. The oc curr enc e of a ny error in this class will cause
the device-specifi c error bit (bit 3) in the event status register to be set.
These errors indicate that an error has been detected during analyzer
execution.
These errors indica te that the analyzer parser detected an IEEE 488.2
syntax error. Errors in this class set the command error bit (bit 5) in the
event status register (IEEE 488.2, section 11.5.1). In this case:
16 Chap ter 1
Page 17

Instrument Messages
Instrument Messages Introduction
• Either an IEEE 488.2 synta x error has been detected by the parser
(a control-to-dev ice message was received that is in violation of the
IEEE 488.2 standard. Possible violations include a data element
which violates dev ice listening formats or whose type is
unacceptable to the device.), or
• an unrecognized header was received. These include incorrect
device-specific headers and incorrect or unimplemented IEEE 488.2
common commands.
201 to 799:
Device-Specific
Errors
These errors indicate that a device operation did not pr op erly complete,
possibly due to an abnormal hardware or firmware condition. These
codes are al so u se d fo r se lf -t e st re spo n se e rro rs. Errors in this class set
the device-specific error bit (bit 3) in the event status register (IEEE
488.2, s e ction 11. 5.1).
The <error_message> string for a positive error is not part of the SCPI
standard. A positive error indicates that the anal yzer det ect ed an error
within the GPIB system, within the analyzer firmware or hardware,
during the transfer of block data, or during calibration.
Chapter 1 17
Page 18

Instrument Messages
Instrument Messages
Instrument Me s s ages
Error Messages
NOTE Error numbers are displ ayed in the error queue, not on the display.
To see an er ro r num ber, view the error queue as described on page 15.
0 No error
The queue is empty. Every error in the queue has been
read or the queue was purposely cleared by power-on or
*CLS.
–499 to –400: Query Errors
NOTE Error numbers are displ ayed in the error queue, not on the display.
To see an er ro r num ber, view the error queue as described on page 15.
–440 Query UNTER MINAT ED after in defini te respo nse
Indicate s t h at a qu e ry was recei ve d in the same
program message after a query requesting an indefinite
response was executed (see IEEE 488.2, 6.3.7.5).
–430 Query DE ADL OCK ED
Indicates that a condition causing a DEADLOCKED
query error occurred (see IEEE 488.2, 6.3.1.7). For
example, both the input buffer and the output buffer
are full and the analyzer cannot continue . The analyzer
automatically discards output to correct the deadlock.
–420 Query UN TER MIN AT ED
Indicate s t h at a co n d i t io n cau sing an
UNTERMINATED query err or occurred (see IEEE
488.2, 6.3.2.2). For example, the device was addressed
to talk and an incom plete program message was
received.
–410 Query IN TER RUP TE D
Indicates that a condition causing an INTERRUPTED
query error occurred (see IEEE 488.2, 6.3.2.7). For
exa mple, a query was fo llow ed by DAB o r GET before a
response was completely se n t.
18 Chap ter 1
Page 19

Instrument Messages
Instrument Messages
–400 Query Error
This is a gen er ic query error fo r de vices that ca n n o t
detect more specific errors. The code indicates only that
a query error as defined in IEEE 488.2, 11.5.1.1.7, and
6.3 has occu rred.
–399 to –300: Device-Specific Errors
NOTE Error nu mbers are displayed in the error queu e , not on the display.
To see an error number, view the error queue as described on page15.
–310 System error
Indicates that an error, termed “system error” by the
device, has occurred.
–300 Device-speci fic er ro r
This is a generic device-dependent error for devices that
cannot dete ct mo re specific e rrors. The code in di cates
only that a device-dependent error as defined in IEEE
488.2, 11.5.1.1.6 h as o ccu rred.
–299 to –200: Execution Errors
NOTE Error nu mbers are displayed in the error queu e , not on the display.
To see an error number, view the error queue as described on page15.
–230 Data corrupt or st al e.
Possibly invalid data. A new measurement was started
but not co mpleted .
–223 Too much data; <desc riptio n of the type of
data ex ce ede d>
Indicates that a legal program data element of block,
expression or string type was received that contained
more data than the d evice could handle due to memory
or relate d de vice-specific requirements.
Chapter 1 19
Page 20

Instrument Messages
Instrument Messages
–221 Settings co nfl ic t; par ame te r c urr en tly
disabled
This pa rameter is grayed ou t (unavailable) in the
current co n t ext . Che ck the indiv idu al paramete r
help/documentation for mor e information.
–200 Executio n e rro r
This is a generic execution error for devices that cannot
detect more specific errors. The code indicates only that
a execution error as defined in IEEE 488.2, 11.5.1.1.4
has occurr e d
–199 to –100: Command Errors
NOTE Error numbers are displ ayed in the error queue, not on the display.
To see an er ro r num ber, view the error queue as described on page 15.
–178 Expressi on data not allowed
A legal expression data was encountered, but was not
allowed by the device at this point in parsing.
–171 Invalid exp ressi on
The expression data el ement was invalid (see IEEE
488.2, 7. 7. 7. 2). Fo r ex amp le , un mat ch ed p are nt he se s or
an illeg al character.
–170 Expressi on data err or
This error, as well as error s –171 through –179, is
generated when parsing an expression data element.
This part icular error m e ssage is used i f the de v ice
cannot de tect a more spec ifi c e rro r.
–168 Block da ta not a llo wed
A legal block data elem ent was encountered, but not
allowed by the device a t this point in the parsing.
20 Chap ter 1
Page 21

–161 Invalid bloc k d ata
A block data element was expected, but was invalid (see
IEEE 488.2, 7.7.6.2). For example, an END message was
received b efo re the e nd le n gth was satisfie d.
–160 Block data e rro r
This error, as well as err o rs –161 through –169, is
generated when parsing a block data element. This
particul ar error mess ag e is u s e d if t h e de vice cannot
detect a mo re specif ic e rror.
–158 String data not allo wed
A string data element was encountered, but not allowed
by the device at this point in the parsing.
Instrument Messages
Instrument Messages
–151 Invalid stri ng dat a
A string data element was expected, but was invalid
(see IEEE 488.2, 7.7.5.2). For example, an EN D
message was received before the terminal quote
character.
–150 String data error
This error, as well as err o rs –151 through –159, is
generat ed wh e n parsing a stri n g da ta e le m ent . Th is
particul ar error mess ag e is u s e d if t h e de vice cannot
detect a mo re specif ic e rror.
–148 Character da ta not a llo wed
A legal character data element was encountered where
prohibited by the device.
–144 Character da ta too l ong
The character data el ement contains more than twelve
characters (see IEEE 4 88.2, 7.7.1.4).
Chapter 1 21
Page 22

Instrument Messages
Instrument Messages
–141 Invalid cha racte r data
Either the character data element contains an invalid
character or the parti cular element receiv ed is not vali d
for the header .
–140 Characte r d ata e rro r
This error, as well as error s –141 through –149, is
generated when parsi ng a char acter da ta element. This
particular error message is used if the device cannot
detect a m o re spe cific error.
–138 Suffix n ot all ow ed
A suffix was encountered after a numeric element
which does not allow suffixes.
–134 Suffix t oo lon g
The suffix contained more than twelve characters (see
IEEE 488.2, 7.7.3.4).
–131 Invalid suf fix
The suffix does not f ollow the s y ntax des cri bed i n IEEE
488.2, 7.7.3.2, or the suffix is inappropriate for this
device.
–130 Suffix e rro r
This error, as well as error s –131 through –139, is
generat e d when parsing a suffix. This part icular erro r
message is used if the device cannot detect a more
specific erro r.
–128 Numeric dat a n ot al low ed
A legal numeric data element was received, but the
device does not accept one in this position for the
header.
22 Chap ter 1
Page 23

–124 Too many digits
The mantissa of a decimal-numeric data element
contained more than 255 digits excluding leading zeros
(see I E E E 48 8.2, 7.7.2.4.1).
–123 Exponent too large
The magnitude of an exponent was greater than 32000
(see I E E E 48 8.2, 7.7.2.4.1).
–121 Invalid char act er in nu mbe r
An invalid character for the data type being parsed was
encountered. For exa m ple, an alpha in a decimal
numeric or a “9” in octal data.
Instrument Messages
Instrument Messages
–120 Numeric data er ror
This error, as well as err o rs –121 through –129, is
generated wh e n parsing a data ele ment which ap pe ar s
to be numeric, including non-decimal numeric types.
This particular error message is used if the device
cannot detect a mor e specific error.
–114 Header su ffix out of range
The value of a head er suffix attached to a program
mnemonic makes the header invalid.
–113 Undefin ed he ade r
The header is synta ctically correct, but it is undefined
for this specific device. For example, *XYZ is not defined
for any devi ce .
–112 Program m nem oni c t oo lo ng
The head er co n ta in s more than tw e lv e ch aracters (s e e
IEEE 488.2, 7.6.1.4.1).
–111 Header separ ator err or
A characte r which is not a l eg al h ea de r se parator wa s
encountered while par sing the header.
Chapter 1 23
Page 24

Instrument Messages
Instrument Messages
–11 0 Command hea der erro r
An error was detected i n the header. This message is
used when the device ca nnot detect the more specific
errors desc ribed for error s –111 through –119.
–109 Missing par amete r
Fewer parameters were received than required for the
header. For example, the *ESE common command
requires one parameter, so receiving *ESE is not
allowed.
–108 Paramete r n ot al low ed
More parameters we re re ce ived than ex pe ct e d for t h e
header. For example, the *ESE common command only
accepts one parameter, so receiving *ESE 0,1 is not
allowed.
–105 GET not all owe d
A Group E x ec u t e Trigger wa s re ce i ve d within a
program message (see IEEE 48 8.2, 7.7). Correct the
GPIB controller program so tha t the GET does not occur
within a line of GPIB program code.
–104 Data type erro r
The parser recognized a data element that is not
allowed. For example, numer ic or string data was
expected, but block data w as encountered.
–103 Invalid sep arato r
The parser was expecting a separator and encountered
an illegal character. For example, the semicolon was
omitted after a program message unit.
–102 Syntax e rro r
An unre cognized co mmand or data type was
encountered. For example, a string was received when
the device do es n ot a cce pt st ri n gs.
24 Chap ter 1
Page 25

–101 Invalid char act er
A syntactic command conta ins a character which is
invalid for that type. For example, a header containing
an ampersand, such as “SETUP&”. This error might be
used in place of error numbers –114, –121, –141, and
some others.
–100 Command erro r
This is a generic syntax error for devices that cannot
detect more specific errors. The code indicates only that
a command error as defi ned in IEEE 488.2, 11.5.1.1.4
has occurred.
201 to 799: De vice-Specific Errors
Instrument Messages
Instrument Messages
NOTE Error nu mbers are displayed in the error queu e , not on the display.
To see an error number, view the error queue as described on page15.
201 Option no t install ed
The desired o pe ration canno t be pe rformed becau se a
required option is not installed. For example, pressi ng
Source with no tracking ge nerator installed in the
analyze r will generat e t h is error.
202 No peak f oun d
No signal pe ak was found.
204 TG Freq ue ncy Li mit
The tracking generator has reached the limit of its
allowable frequency range.
205 Command n ot rec ogn iz ed
Indicates that the command sent from the remote
interface was not recognized. Check the programming
guide for co rrect syntax.
Chapter 1 25
Page 26

Instrument Messages
Instrument Messages
206 Unable t o i nit ia liz e f lat ne ss dat a
A failure occurred in setting the flatness data in the
internal EEROM. Get in touch with your local Agilent
Tech n o logies sales and serv ice office.
207 Unable t o s tor e fla tne ss da ta
A failure occurred in setting the flatness data in the
internal EEROM. Get in touch with your local Agilent
Tech n o logies sales and serv ice office.
209 Preselec tor ce nt eri ng fai le d
An attempt to center the preselector failed.
211 RBW limited to 1 kHz when S pan > 5 MHz
In spans greater than 5 MHz, n arrow (digital)
resolut io n bandwidths , be lo w 1 kHz, are n o t available.
213 Span limite d to 5 MHz when RBW < 1 kHz
In narrow (digital ) resoluti on bandwidths , below 1 kHz,
spans gre at e r t h an 5 MHz are n o t a vailable.
214 TG start freq is less than 9 kHz
Tra cking generator uncalibrated below 9 kHz.
215 TG start freq is less than 1/2 res bw
Tra cking generator uncalibrated at start freq uencies
below 1/2 the current resolution bandwidth.
216 Invalid Bau d Rate
Attempt to use invalid baud rate. Refer to the
programming language chapter of Agilent Te c hnol ogie s
EMC An aly z er Programm er’s Guid e fo r mo re
information.
26 Chap ter 1
Page 27

Instrument Messages
Instrument Messages
217 RS-232 In terfac e Error
An error occ u rre d o n the se ri al interface.
219 Command not valid in this model
Indicates that the command sent from the remote
interface does not apply to this model number. For
example, attempting to center the preselector in an
analyzer without a pr eselector will generate this error.
221 Invalid o pti on, un ab le to uni ns tal l p ack ag e
You have attempted to rem ove a personality that is not
currently installed. V erify command was entered
correctly.
223 Trigger O ffs et una va ila ble in s wep t s pan s
T rigger Offset is only available in Zero Span. Refer to
“Trig” in the Agilent EMC Analyzer User’s Guide for a
description of this function.
224 Option no t license d.
The selected option requires a license. Refer to the
installation procedur es in the us er’s guide available for
this particular op ti on.
332 Average T ype in com pa tib le for s cal e.
Amplitude Scale com m and should be sent prior to the
Average Type command.
601 Floppy di sk full
The floppy d isk is full. C lear some space b y dele t i n g
unwanted files.
602 Floppy di sk error
An unknow n e rro r has occurred wh i le accessing the
floppy disk.
Chapter 1 27
Page 28

Instrument Messages
Instrument Messages
604 File alread y exists
Attempt to save to a file that already exists. Delete or
renam e the o ld fi le an d t ry again.
605 Media is pr ote ct ed
A save was attempted to a w rite-protected device.
606 Media is co rru pt
A save was attempted to a corrupt device.
607 File Name Erro r
An inv alid file n ame has b ee n s p e cified. U se filenames
with a maximum of 8 characters (letters and digits
only) an d u s e a 3 ch aracter ext ension. No te t h at
lowercase an d uppercase are perceived as t h e same.
This error will also occur if you attempt to delete a
nonexistent file.
609 Media is no t w ri tab le
A save was attempted to a read-only device.
610 File acc ess is d eni ed
The file is protected or hidden and cannot be accessed.
612 File not found
The analyzer could not find the specified file.
613 Flash me mor y i s ful l
The internal flash memory is full. Clear some space by
deleting unwanted files.
614 Bad or m iss ing f lop py dis k
The floppy is not inserted or the directory could not be
read. Insert a known goo d di sk an d try again.
28 Chap ter 1
Page 29

Instrument Messages
Instrument Messages
615 Corrupt ed fi le
The file that you were t rying to load is corru pt .
617 Wrong d en sit y f lop py in ser ted
The floppy disk has the wrong density. It should be
1.44 MB.
618 Illegal w rit e a cce ss of Fl ash m emo ry
Attempt to write to an unavailable area of internal
flash mem ory.
619 Can’t Auto-C oup le RB W i n Z ero S pan
You sent a remote command to set the RBW into auto
while in zero span. (Remote interface only.)
620 Can’t Auto-C oup le Sw eep Ti me in Ze ro Spa n
You sent a re mot e co mmand to set the sw e e p time to
auto while in zero spa n. (Remote interface only.)
651 Connect R F O UT to IN PUT
Attempt to align the tracking generator without its
output connected. Connect the tracking generator
RF OUT to the analyzer
INPUT.
652 Connect A mpt d R ef Ou tpu t t o I np ut
For Agilent Technologies E7402A, E7403A, E7404A,
and E7405A only: you must connect the
OUTPUT
to the analyzer INPUT with the appropriate
AMPTD REF
cable.
Chapter 1 29
Page 30

Instrument Messages
Instrument Messages
653 Auto Align not availab le when usi ng
Calibrat ion De fa ult s
The Auto Alignment system c annot be used until an
Align Now All is executed by pressing System,
Alignments, Align Now, All. On all Agilent Technologies
EMC analyzer models except Agilent Technologies
E7401A, you must connect the
INPUT with the appropriate cable to perform this
AMPTD REF OUT to the
alignment. For Agilen t Technologies E 7401A only :
disconnec t a n y sign als from the
INPUT prior to
performing this proced ure.
701 Invalid pri nter res ponse
In attempting to identify the printer an invalid
response was received. C h e ck th at you are using a
supported printer. Be sure you are us ing the proper
cable and that it is securely fastene d.
702 Unsuppor ted pr in ter
A print e r which is r ecognized, but known to be
unsupported was identified. This printer cannot be
used with the analyzer. For example, a printer only
supported by Microsoft Windows will generate this
error.
703 Unknown pri nter
In attempting to identify the printer, a valid response
was received but the pr inter is not known to the
analyzer. Use the
to configure the printer.
Setup
Custom printer menu under Print
704 Printer int erfac e error
An error occurred while trying to print. Make sure the
printer is turned on and properly connected.
30 Chap ter 1
Page 31

705 Printer T ype is No ne
Instrument Messages
Instrument Messages
The current printer type is set to
None, so no print
operations are poss ible. Change the type in the
Print Setup menu and try again.
727 In <fil en ame >: [DA TA ] h ead er mi ssi ng
This mess ag e indicates that the data section of a fi le
did not begin with the token [
DATA].
728 In <filen ame>, lin e <nnn>: separat or missi ng
The [
HEADER] section of a file contains entries
requirin g an e qu al (=) sign, su ch as <keyword> =
<value>. This message app ears if the equal sign does
not appear on the line.
729 In <fil en ame >: err or re adi ng fi le
Appears when loading data from a limit line or
correction s disk file and a failure to th e file o ccu rs.
730 In <file name> , line <numer ic_va lue>: l ine to o
long
When loading data from a limit line or corrections disk
file, this message will appear if the length of any line in
the file exc e eds 255 characters.
731 In <com ma nd> : b ad da ta cou nt
(<numer ic _va lue >): e xpe cte d m ul tip le of
<numeri c_ val ue>
This message indicates th at the data sent to a
corrections or limit table via the
DATA or MERGE
commands does not have the expected length for the
table. For example, this message would appear if an
attempt were made to merge 7 numeric values into a
limit ta ble, since each log ical entry requires 3 values
(frequency, amplitude, and connected).
Chapter 1 31
Page 32

Instrument Messages
Instrument Messages
732 In <file nam e>, l ine <n ume ri c_v alu e> : e rro r
parsing tok ens
This message may appear when loading data from a
limit line o r co rre ct ions disk file. I t indi cates a problem
in the attempt to brea k a string of text into tokens.
There may be too few tokens in the string. In other
words, the file c ontent must match the expected f ormat.
This typically happens when there are too few numeric
values in the [
DATA] sec t io n of a limit or corrections file.
733 In <filen ame>, line <n umeri c_valu e>: <x xx> is
not nume ric
This message may appear when loading data from a
limit line or cor rections disk file. It indi cates that a
non-numeric token <xxx> w as found where a numeric
token was expected. In other words, the file content
must match the expected form at.
734 Interpol ati on er ror : c ann ot co mpu te lo g o f
<negativ e_f req ue ncy _va lue >
Occurs when the frequency interpolation of a limit line
is set to log and the start frequency of the instrume nt is
negative. The <negative_frequency_value> is limited to
– 80 MHz, so it may not match the frequency that
caused the error.
735 In <file nam e>: b ad amp lit ud e u nit < uni t>
This message indicates that unit <unit> is not
recogni z e d or su ppo rte d .
736 Too many da ta va lue s a t < fr eq_ or_ ti me_ val ue>
This message may appear when data is sent to a
corrections or limit table using the
DATA or MERGE
commands. These tables limit the number of
amplitudes associated with a frequency or time to 2 or
less. This message will appear if an attempt is made to
attach 3 or more values to a frequency or time.
32 Chap ter 1
Page 33

Instrument Messages
Instrument Messages
751 Instrum en t s tat e m ay be co rru pt , s tat e h as
been re se t t o i nit ia l v alu es
An error in t h e in t e rn al instrume n t sta t e has been
detected. The state has been reset to a default value.
752 Unable to load state from file
Loading of state from a file failed.
753 Unable to sa ve sta te to fi le
Saving of state to a file failed.
755 Unable to load state from regis ter
Loading a state from an internal state register fai led.
756 Unable to sa ve sta te to re gis te r
Saving of state to an internal register failed.
757 Unable t o load u ser sta te, fac tory pr eset w as
done
An attempt to perform a
Factory Preset values were used. Save a v alid state into
User Preset and tr y ag ain.
User Preset failed, so the
758 Unable to save user sta te
An attempt to save to the
User Preset state failed.
759 Unable to load state
A saved state fil e from a newer firmw are revision wa s
attempted to be loa ded into an older instrument.
760 Unable to qu ery st at e
Query of state over the remote interface was
unsuccessful.
Chapter 1 33
Page 34

Instrument Messages
Instrument Messages
761 Unable t o s et st ate
Attempt to set the state over the remote interface was
unsuccessful.
762 Incorrec t f ile na me, al low ab le ext en sio ns
are .trc or .csv
Attempt to save a trac e to a file with an incorrect
extension.
762 Unable t o l oad f ile
A failu re occurre d wh ile loadin g a file; the file was not
loaded.
763 Incorrec t f ile na me, al low ab le ext en sio ns
are .gif or .wmf
Attempt to save a screen image to a file with an
incorrect extension.
764 Unable t o s ave f ile
A failure occurred while saving a file; the file was not
saved.
769 Invalid ins trume nt mode
You have attempted to switch to an instrument mode
that is currently not installed. Confirm that the mode
name (for INST:SEL ) or number (for INST :NS EL) was
entered correctly and that the requested personality is
actually installed in th e in s t ru ment.
770 Instrume nt mode req uested is not suppo rted
Instrument mode specified with: INST command is not
valid. Refer to Cha pter 5, “Ins trument Subsys tem” of
Agilent Technologies EMC Analyzer Programmer’s
Guide for more infor mation.
34 Chap ter 1
Page 35

Instrument Messages
Instrument Messages
771 Store R ef tr ace be fo re tur nin g on Nor mal iz e
A reference trace must be available for the Normalize
function to be activated. Refer to “View/Trace” in the
Agilent EMC Analyzer User’s Guide where the
Normalize key function is explained in detail.
772 Cannot l oad a di rector y, ple ase cho ose a fi le
You have selected a directory instead of a file when
attempting to perfor m the Load function under the
File
front-p an el key.
Instrument Messages without Numbers
Error Messages
Invalid i nde x u sed t o r efe ren ce si gna l.
Index used to change a signal's comments is out of
range.
Presele ctor not availab le
Displayed if the p reselector didn't respond.
Signal ad d failed.
Displayed if the analyzer failed to add a signal to the
signal list, from a remote SCPI command, for an
unknown reason.
Signal li st is full. Signal not added.
Displayed if the signal list is full when you try to add a
signal to the signal list using the remote SCPI
command “CALC:EMI:SLISt:ADD <da ta>”, but list is
full (maximum is 2000 si gn als in list . )
Signal m issin g requ ired fr equen cy. Sig nal no t
added.
Displayed when attempting to add a signal to the signal
list from remote and the frequency value is missing
(“CALC:EMI:SLISt:ADD <data>”.)
Chapter 1 35
Page 36

Instrument Messages
Instrument Messages
Signa l n ot add ed to li st.
Displayed when
Marker to List is pressed and appe n d
fails for an unknown reason.
Signa l n ot add ed to li st. S ign al li st is at
capacity .
Displayed when
Marker to List is pressed and appe n d
fails becau se the si gnal list is full.
Signa l s tri ng co nta ins ba d fla g f or ma rk.
Signal n ot add ed .
Displayed when attempt ing to a dd a signal t o the s ignal
list from remote and the signal mark flag in <data> has
a value th at ’s not 0, 1, On, or Off
(“CALC:EMI:SLISt:ADD <data>”).
Signa l s tri ng co nta ins de te cto r f la g. Sig nal
not adde d.
Displayed when attempt ing to a dd a signal t o the s ignal
list from remote and one of the detector flags in <data>
has a valu e t h at 's n ot 0, 1, On, or O ff
(“CALC:EMI:SLISt:ADD <data>”).
Signa l s tri ng ma lfo rme d. Si gna l n ot ad ded .
Displayed when attempt ing to a dd a signal t o the s ignal
list from remote and the string argument (<data>) is
missi n g (“CALC:EMI:SLISt:ADD <data>”).
Stron g A dja cen t Sig nal
Displayed if a valid measu re ment couldn't be made
because the signal couldn't be ranged high enough on
screen fo r an accurate me asu rement.
36 Chap ter 1
Page 37

Instrument Messages
Instrument Messages
Unable to un ins tal l per son ali ty , f ile no t
deletab le .
This message occurs when you try to delete a
personality which has been marked as non-deletable.
The personality is marked non-deletable at the factory.
Get in touch with y our nearest service center for
further a ssistance.
Status Messages
Status * (Inva li d D ata )
This indicator is displayed when data on the screen
may not match the screen annotation, for example
while analyzer settings are changing or when any trace
is in view mode.
Status 50 MHz Os c U nle vel ( 50 MHz Os c Unl eve led )
The internal 50 MHz ampli tude reference source has
become unleveled. This condition must be corrected
before a valid alignment can be performed.
Status (ADC Al ig n F ail ure )
A status bit only, no message. The alignment routine
was unable to alig n the analog-to-digital converter
(ADC).
Status Align N ow Al l N eed ed (A lig n N ee ded )
The instrument requires complete alignment. Press
System, Alignments, Align Now, All. On all Agilent
Technologies EMC analyzer models except Agi lent
T echnolo gies E7401A, you must connect the AMPTD REF
to the INPUT with the appropriate cable to per fo rm
OUT
this alignment . For Agilent Technologies E7401A only:
disc onnect any signals fro m the
INPUT prior to
performing this p rocedure. If this message recurs, load
defaults (System, Alignments, Load Defaults) an d then
perform Alignment Now, All.
Chapter 1 37
Page 38

Instrument Messages
Instrument Messages
Status Align No w R F N ee ded (A lig n Now RF N eed ed)
The instrument requires RF alignment. Press
Alignments, Align Now, RF (EXT Cable). On all A gilent
Technologies EMC analyzer models excep t Agilent
T echnologies E7401A, you must connect the AMPTD REF
to the INPUT with the appropriate cable to perfor m
OUT
this alignment. For Agilen t Technologi es E7401 A o n ly :
disconnec t a n y sign als from the INPUT prior to
performing this proced ure.
Status Align RF Sk ipp ed (A lig n R F Ski ppe d)
The RF alignment has been ski pped because a 50 MHz
signal was detected at the INPUT; alignment will
resume w h en th e 50 M Hz signal is remov e d. The
alignment will not work when there is too much input
power at 50 MHz. The instrument may not c ontinue to
measure properly. To remove the message, remove the
50 MHz input signal, then perform an
Align Now, RF.
Press System, Alignments, Align Now, RF. On all Agilent
T echnol ogies EMC a nalyzer models except E7 401A, you
must co nn ect th e AMP T D R EF OU T to the INPUT with the
appropriate cable to perform this alignment. For
Agilent Technologies E7401A only: disconnect any
signals from the
INPUT prior to pe rfo rming this
procedure.
System,
If this message occurs and you are going to make a
measurement near 50 MHz, select
Auto Align, and All but RF.
System, Alignments,
Status DC Coupl ed
Indicates the input of the analyzer is DC coupled
Input/Output, Coupling (DC)). This setting is necessary
(
when measuring frequencies below 100 kHz on E7402A
with Option UKB, E7403A, and E7404A analyzers. For
E7405A analyzers with Option U KB, you must set the
coupling to DC when measuring below 10 MHz. Take
care to limit the input level to 0 Vdc and +30 dBm
whenever you are in DC coup led mode.
38 Chap ter 1
Page 39

Instrument Messages
Instrument Messages
Status Demod O N: re duc e s pa n f or aud ib le det ect io n
When the Demod function is active and the speaker is
turned on, the ratio of the resolution b andwidth to span
must be greater tha n 0 .002 to p r operl y d emodulate and
listen to the result ing audio signal. Yo u must de cr ea se
the span to continue the measurement
Status Ext Ref (no corres pondi ng statu s bit)
Indicates that the freq uency reference i s being supplied
by an extern al 10 M H z s o u rce .
Status Flat co rr of f ( no co rre spo ndi ng st atu s b it )
Indicates that the flatness corrections have been turned
off.
Status (FM Dem od Al ign Fa il ure ) s tat us bi t o nly , no
message
A failure has occurred du rin g the FM Demod
alignment. Measurement results may be invalid.
Status Freq co rr of f ( no co rre spo ndi ng st atu s b it )
Indicates that the frequency corrections have been
manually disabled. Press
Correct
, (On) to restor e.
System, Alignments, Freq
Status Frequen cy Re fer enc e Err or (Fr eq Re f U nlo ck ed)
The frequency reference has been tuned too far off of
10 MHz. This condition may be correct ed by cycl in g
power on the analyzer.
Status (IF Alig n Failure) stat us bit only, no message
A failure has oc curred during the IF alignment.
Measurement results may be invalid.
Chapter 1 39
Page 40

Instrument Messages
Instrument Messages
Status IF Gain fix ed
The autoranging function of the analyzer has been
turned off (
Amplitude, More, More, IF Gain (Fixed)). This
setting is useful when measuring signals that require
fast measurement time, narrow resolution bandwidths
(< 1 kHz), and < 7 0 dB o f dis play range. For mo re
information on this setting, refer to IF Gain key
descri p t io n in the EMC Analyzer User’s Guide.
Status IF Ov erl oad (I F/ ADC Ov er Ra nge )
The IF section has been overloaded. Measurement
results may be invalid.
Status Input is in ter na l ( no cor re spo ndi ng st atu s
bit)
This message applies to the Ag ilent Tech no logies
E7401A o n ly. Indicates the
On. With the 50 MHz amplitud e reference on, the
is
50 MHz Amptd Ref selection
input is routed through an internal signal path.
Status (LO Ali gn Failure) stat us bit only, no mes sage
A failure has occurred during the alignment of the local
oscillator (LO). Measurement results may be invalid.
Status LO Ou t U nle vel (LO Out Un le vel ed)
Indicates the output of the local oscillator (LO) has
become un leveled. Thi s co n dition must be co rrected to
make valid measurements.
Status LO Unlev el (LO Unle veled)
Indicates the inter nal circuitry of the local oscillator
(LO) has become unleveled. This condition must be
corrected to make valid measurements.
Status LO Un loc k ( Syn th Un loc ked )
Indicates the phase locked circuitry of the local
oscillator (LO) has bec ome unlocked. This condition
must be corrected to make va lid measurements.
40 Chap ter 1
Page 41

Instrument Messages
Instrument Messages
Status Log Corr Off (no corres pondin g status bit)
The log amplifier co rre ct ions have been turne d o ff.
Status Marker Co unt:Wi den Res BW
The ratio of the resolution bandwidth to span must be
greater than 0.002 for the marker count function to
work properly. Increas e the resolution bandwidth or
decrease the span to continue the measurement.
Status Meas Un ca l ( Ove rsw ee p)
The measurement is uncalib rated. Check the sweep
time, span and bandwidth sett ings, or press
Couple
and Auto All.
Auto
Status Overload: Reduce Signal and pre ss <ESC> (Input
Overloa d Trippe d)
This messag e applies to the Agilent Te ch n o lo gi es
E7401A only. A signal has been applied to the input
connector that caus ed the overload protection circuitr y
to engage. The input signal must be reduced. After the
signal is reduc e d, p ress
ESC to reset the overload
detector so that you can continue using the analyzer.
CAUTION Exposing the analyzer to high levels of input power over a prolonged
period of time can da mage the internal circuitry.
Status Peaking S ign al (no c orr esp ond in g s tat us bi t)
The instrument is exec uting a tracking generator peak.
Status (RF Alig n Failure) status bit only, no messa ge
A failure has occurr ed during the alignment of the RF
section. Measurement results may be invalid.
Status Source LO Unlevel (S ource LO Un levele d)
The internal circui try of the local oscillator (LO) in t h e
tracking generator has become unleveled. This
condition mu st be co rrected to make valid
measurements.
Chapter 1 41
Page 42

Instrument Messages
Instrument Messages
Status Sourc e L O U nlo ck (S our ce Sy nth Un lo cke d)
The phase-locked circuitry of the local oscilla tor (LO) in
the tracking generator has become unlocked. This
condition must be corrected to make valid
measurements.
Status Sourc e U nle vel (Sou rce Un le vel ed)
Indicates the source power is set higher or lower than
the analyzer can prov ide, the frequency span extends
beyond the specified frequency range of the tracking
generator , or the calibration data for the source is
incorrect.
Status Syste m Alignme nts, Ali gn Now, All Require d
Internal alignment correction data has been l ost. Press
System, Alignments, Align Now, All to clear this messag e
from the display.
Status (TG Ali gn Failure) stat us bit only, no mes sage
A failure has occurred during the tracking generator
(TG) alignment.
Status Video sh ift of f (no co rre sp ond ing s tat us bit )
Indicates t h e video shift has been ma n u al ly d isa bl e d;
this will impair readings.
Informational Messages
Informational Atten auto set t o 1 5 d B
Indicates t h at an in put signal has be en de t ect e d which
is of sufficient level to damage the input circuitry and
the input attenuator has been automatically set to
15 dB. If the signal level is red uc ed, the a ttenua tor wi ll
stay at 15 dB. This ov erload protection occurs at an
input power level of 120 dbµV ± 7 dB when the input
attenuation is auto coupled and set to <15 dB. T o return
to the original measurement setup, reduce the input
signal level and press
Attenuation (Auto).
Amplitude. Then press
42 Chap ter 1
Page 43

Overload protection is only available in the Agilent
Technologies E7401A.
Informational Clear a ll si gna l m ar ks.
Cleared all marked s ignals from signal list. Displayed
when
Clear All is pressed.
Informational Complem en tin g m ark ed si gna ls.
Marking all sign als that we re pr e viously u n marked
and removing the marks from previously marked
signals. Displayed when
Complement is pressed.
Informational Deleted a ll sig nal s.
Deleted all signals from signal list . Displayed when
Delete All is presse d.
Instrument Messages
Instrument Messages
Informational Deletin g marked signals .
Deleted mar k e d sig n al s fro m signal list. Di spl ay e d
when
Delete Mrkd is pressed.
Informational Deleted s ign al.
Deleted cu rre n t ly se lect e d signal from sig n al lis t.
Displayed wh e n
Delete Signal is pressed.
Informational <directoryname> di re cto ry del et ed
The directory indicated has been successfully deleted.
Informational <directoryname1 > d ir ect ory re na med to
<direct or yna me2 >
Directory n am e 1 h as been successfully renam e d t o
directory name2.
Chapter 1 43
Page 44

Instrument Messages
Instrument Messages
Informational Directory alread y e xis ts
Each directory and file must have a unique name. The
directory name yo u h ave entered is currentl y be ing
used on the selected drive. You may either enter a new
name or rename the director y currently existent. Refer
to “File Menu Functions” in the Agile nt EMC Analyzer
User’s Guide.
Informational <filename> file copied
The filename indicated has been successfully copied.
Informational <filename> file delete d
The filename indicated has been su ccessfully delete d.
Informational <filename> file loaded
The filename indicated has been successfully loaded.
Informational <filename1> file re nam ed to <f ile na me2 >
Filename1 has been successfully renamed to filename2.
Informational <filename> file saved
The filename indicated has been su ccessfully save d.
Informational <filename> too m any da ta en tri es
This message may appear when loading data from a
limit line or ampcor disk file. The [DATA] section of
such a file can contain at most 200 lines of data. This
message is displayed if t h at limit is exceeded .
Informational Marking all duplicate sig nals.
Marking all signals i n list that a re close to eac h other in
frequency. Displayed when
44 Chap ter 1
Mark All Dups is pre sse d.
Page 45

Informational Marking all sig nal s.
All signals in signal list a re marked. Di sp layed when
Mark All is pressed.
Informational Marking l owe r d upl ic ate si gna ls .
Markin g all sign als in list th at are lowe r in freque n cy
out of those who ar e close to each other in frequency.
Displayed wh e n
Mark Lwr Dups is pressed.
Informational Marking s ign als to e nd of lis t.
Markin g all signals in list fr o m t he current ly selec ted
signal to the last signal at the end of the list. Displayed
when
Mark To End is pressed.
Instrument Messages
Instrument Messages
Informational Measure ment Abo rted
Displayed when
AutoMeasure is stoppe d by an Abort
from Meas Control.
Informational Measure ment Don e
Displayed when
AutoMeasure is fin ished.
Informational Measure ment p aused; press Resum e to co ntinue ,
Abort, or Restart.
Displayed when
Meas Control. You must press Resume to continue, Abort
AutoMeasure is stopped by a Pause from
to cancel the measurem ent and reset the analyzer to
begin a new measure me n t , or Restart to begin a new
measurement.
Informational Measure ment Res uming ...
Displayed if AutoMeasure is stopped by a Resume from
Meas Control.
Chapter 1 45
Page 46

Instrument Messages
Instrument Messages
Informational Measuring Signal ...
Displayed while signal measurement process is
running after
Meas at Marker is pressed o r w h en Au toM easure is
Remeasure, Remeas All, Remeas Mrkd, or
running.
Informational Measuring Signal ... Don e
Displayed when the signal mea surement process is
complete.after
Meas at Marker is pressed o r w h en Au toM easure is
Remeasure, Remeas All, Remeas Mrkd, or
finished running.
Informational Option activated
This messa ge is displayed after ent e ring the selected
option’s License Key.
Informational Remeasuring curr ent si gna l.
Reme asure curre ntly sele cted signal in list . Displayed
when
Remeasure is pressed.
Informational Remeasuring all sig nal s.
Remeasu re all signals in list. Displayed when
Remeas All is pressed.
Informational Remeasuring mark ed sig nal s.
Remeasur e all marked signals in list. Dis pla yed when
Remeas Mrkd is pressed.
Informational Shutdown in proc ess .
The analyzer is responding to the
and is executing the shutdown procedure.
Standby key selecti on,
Informational Signal Added To Lis t.
Displayed every time a signal is measured and added to
the Signal List when
Marker To List or Meas To List is pressed.
46 Chap ter 1
AutoMeasure is run or
Page 47

Instrument Messages
Instrument Messages
Informational Signal co mment tru ncate d to 31 charac ters.
Displayed when attempting to add a signal to the signal
list usin g the remote SCPI com mand
“CALC:EMI:SLISt:ADD <data >” and the comment field
is longer that 31 characters. The message is not
displayed long enough for you to read because the
signal is added immediately a n d the “Signal Add ed To
List” messa ge co mes up right aw ay.
Informational Signal Se arc h C omp le te, <# > F ou nd.
Displayed when all peak s in the given trace that meet
the current user-specified peak excursion and threshold
criteria are fo u n d when
AutoMeasure is run.
Informational Sorting b y a sce ndi ng av era ge am pli tud e.
Displayed wh en se t tin g th e so rt ing in the signal list to
ascending average amplitude from the remote SCPI
command (“CALCulate:EMI:SLISt:SORT AVERage,
ASC”).
Informational Sorting b y a sce ndi ng fr equ enc y.
Displayed wh en se t tin g th e so rt ing in the signal list to
ascending frequency from remote SCPI command
(“CALCulate:EMI:SLISt:SORT FREQ, ASC”).
Informational Sorting b y a sce ndi ng LL 1 d elt a.
Displayed wh en se t tin g th e so rt ing in the signal list to
ascending LL1 delta from remote SCPI command
(“CALCulate:EMI:SLISt:SORT LLINE1, ASC”).
Informational Sorting b y a sce ndi ng LL 2 d elt a.
Displayed wh en se t tin g th e so rt ing in the signal list to
ascending LL2 delta from remote SCPI command
(“CALCulate:EMI:SLISt:SORT LLINE2, ASC”).
Informational Sorting b y a sce ndi ng pe ak amp li tud e.
Displayed wh en se t tin g th e so rt ing in the signal list to
ascending peak amplitude from remote SCPI command
(“CALCulate:EMI:SLISt:SORT PEAK, ASC”).
Chapter 1 47
Page 48

Instrument Messages
Instrument Messages
Informational Sorting by ascending quas i-pea k amplit ude.
Displayed when setting the sorting in the signal list to
ascending quasi-pe ak amplitude fr o m remote SC PI
comma n d (“CAL Culate:EMI:SLISt:SORT QPEak,
ASC”).
Informational Sorting by descending ave rage amp litud e.
Displayed when setting the sorting in the signal list to
descending average amplitude from remote SCPI
comma n d (“CAL Culate:EMI:SLISt:SORT AVERage,
DESC”).
Informational Sorting by descending fre quenc y.
Displayed when setting the sorting in the signal list to
descending frequency fr om remote SCPI command
(“CALCulate:EMI:SLISt:SORT FREQ, DESC”).
Informational Sorting by descending LL1 delta.
Displayed when setting the sorting in the signal list to
descending LL1 delta fro m remote SC PI co mmand
(“CALCulate:EMI:SLISt:SORT LLINE1, DESC”).
Informational Sorting by descending LL2 delta.
Displayed when setting the sorting in the signal list to
descending LL2 delta fro m remote SC PI co mmand
(“CALCulate:EMI:SLISt:SORT LLINE2, DESC”).
Informational Sorting by descending pea k amplit ude.
Displayed when setting the sorting in the signal list to
descending peak amplitude from remote SCPI
comma n d (“CAL Culate:EMI:SLISt:SORT PEAK,
DESC”).
Informational Sorting by descending qua si-pe ak ampli tude.
Displayed when setting the sorting in the signal list to
descending quasi- pe ak amplitude from remo te S C PI
comma n d (“CAL Culate:EMI:SLISt:SORT QPEak,
DESC”).
48 Chap ter 1
Page 49

Instrument Messages
Instrument Messages
Informational Tracking Peak Needed .
This message is dis played when there has been a
change in Resolution Bandwidth, Span, or Alignment
since the previous Tracking Peak.
The message does not ap ply to the E7401A Analyzer.
Informational WARNING: You are about to del ete all of th e
content s on direct ory “x:\xxxxx\”. Pr ess
Delete No w a gai n t o pro cee d o r any ot her k ey
to abor t.
If you select a directory or su bdirectory to del e te, t h is
popup message is displayed when you press
Delete Now.
(“x:\xxxxx\” in the message is the full path and
directory name).
Informational Volume <name> format ted
The indicat ed d isk has been successfully formatted.
Chapter 1 49
Page 50

Instrument Messages
Instrument Messages
50 Chap ter 1
Page 51

2 Functional Testing
51
Page 52

Functional Testing
What You Will Find in This Chapter
What You Will Find in This Chapter
This chapter describe s t he f unct ional tes ts and pr ovi des inf or mation on
how to perform them .
What Are the Functional Tests?
Functional tests are t e sts of var i o u s instrument parameters that give a
high degree of confidence that the analyzer is operating correctly. They
are recommended as a check of analyzer operation for incoming
inspection or after a repair. Mea surement uncertainty analysis is not
available for functional tests, and the analyzer is checked against limits
that are wider than the published specifications. The functional tests
are designed to test an analyzer operating within the temper ature
range defined by the analyzer specifications using a minimum set of
test equipment. If a test does not pass, performance tests must be run
to confirm a proble m exists .
Functional Test Versus Performance Verification
Performance verification tests check a wide range of analyzer
parameters and provide the highest level of confidence that the
analyzer is opera ting satisfactorily. They are used to verify that the
analyzer conforms to publi shed speci fications. They are tim e consuming
and require extensive test equipment. The functional tests c heck a
much smaller range of parameters and a limited number of data points
for each parameter. They require only limited test equipment.
52 Chap ter 2
Page 53

Functional Testing
Test Descriptions
Test Descript ions
Each of the following test descriptions include the tes t limits (pass/fail
criteria), a desc ription of what the test does or what it measures, a list
of equipment required for the performanc e of the tes t, a n il lustr a tion o f
the test setup used, and a step by step test procedure. The tests are
designed to be run on an analyzer operating within the operationa l
temperature range defined by the analyzer specific ations. Only perform
tests after the spe ci fi ed warm-up time.
At the end of each test is a test results worksheet. Copy a worksheet to
record your test re su lts for each proce du re y ou’ll be conducting.
Table 2-1 on page 54 includes a complete list of test equipment for all
procedures in this chapter.
The tests included in this chapter are as follows:
Displayed Average Noise Level page 56
EMI Detector T es t page 74
Freque nc y R e ad ou t A cc ur a cy page 78
Marke r C ount Accu racy page 80
Frequency Response page 81
Reference Level Accurac y page 85
Resolution Bandwidth Switching Uncertainty page 90
Scale Fidelity page 93
Second Harmonic Spurious Responses page 96
Tracking Generator Level Flatness
(E7401A)
Tracking Generator Level Flatness
(E7402A, E7403A, E7404A, E7405A)
page 99
page 102
Chapter 2 53
Page 54
Table 2-1
Functional Testing
Test Descriptio ns
Test Equipment for All
Specifications: Recomm ended Model:
Procedures in Chapter 3:
Signal Sources
Synthesized Sweeper 10 MHz-to max imum
specified frequency of
8340A/B or 836XX
series
analyzer. Ext Ref Input
Adapters
Type-N (m), to APC 3.5 (m) 1250-1743
Type-N (m) to BN C (f) 1250-0780
Type-N (f), to APC 3.5 (f) 1250-1745
Termin atio n, 50 Ω
908A
Type-N (m)
(2) Type-N (m), to APC 3.5
1250-1476
(f)
3.5 mm (m) to 3.5 mm (m) 5061-5311
SMA (f) to BNC (m) 1250-2015
Cables
(2) BNC, 122-cm (48-in) 10503A
APC 3.5 mm 11500D
Type-N, 152-cm (60-in) 11500D
BNC, 9 inch 10502A
BNC, 122-cm (48-in) 10503A
APC 3.5 mm E7405A only 11500E
Meters
Power Meter 438A or E4418A,
E4419A
RF Power Sensor 100 kHz to 3.0 GHz 8482A
Microwave Power Sensor 50 MHz to 26.5GHz 8485A
Miscellaneous
Power Splitter E7401A, E7402A,
11667A
E7403A, and E7404A
only
Power Splitter E7405A only 11667B
54 Chap ter 2
Page 55

T a b l e 2- 1
Functional Testing
Test Descriptions
50 MHz Low pass filter Rejection at 80 MHz:
>60 dB
0955-0306
Chapter 2 55
Page 56
Functional Testing
Displayed Average Noise Level
Displayed A v erage Noise Level
Test Limits
Frequency Range Model (50 Ω Input ) Maximum
(50 Ω Input)
10 MHz to 500 MHz E7401A – 119 dBm 1
501 MHz to 1.0 GHz E7401A – 117 dBm 2
1.01 GHz to 1.5 GHz E7401A – 114 dBm 3
10 MHz to 1.0 GHz E7402A – 117 dBm 4
E7403A, E7404A, E7405A – 116 dBm 5
1.01 GHz to 2.0 GHz E7402A – 116 dBm 6
E7403A, E7404A, E7405A – 116 dBm 7
2.01 GHz to 3.0 GHz E7402A – 114 dBm 8
E7403A, E7404A, E7405A – 112 dBm 9
3.01 GHz to 6.0 GHz E7403A, E7404A, E7405A – 112 dBm 10
6.01 GHz to 6.7 GHz E7403A – 111 dBm 11
6.01 GHz to 12.0 GHz
12.01 GHz to 13.2 GHz
E7404A, E7405A – 111 dBm 12
E7405A – 107 dBm 13
TR Entry
12.01 GHz to 22 GHz E7405A – 107 dBm 14
22.01 GHz to 26.5 GHz E7405A – 106 dBm 15
Test Description
The Displayed Average Noise Level is measured within the frequency
range specified. T he analyzer input is terminated in 50 Ω.
The test tune s the analyzer frequency across the b and, uses the marker
to locate the fr equency with the highest response, and then reads the
average noise in zero span.
56 Chap ter 2
Page 57
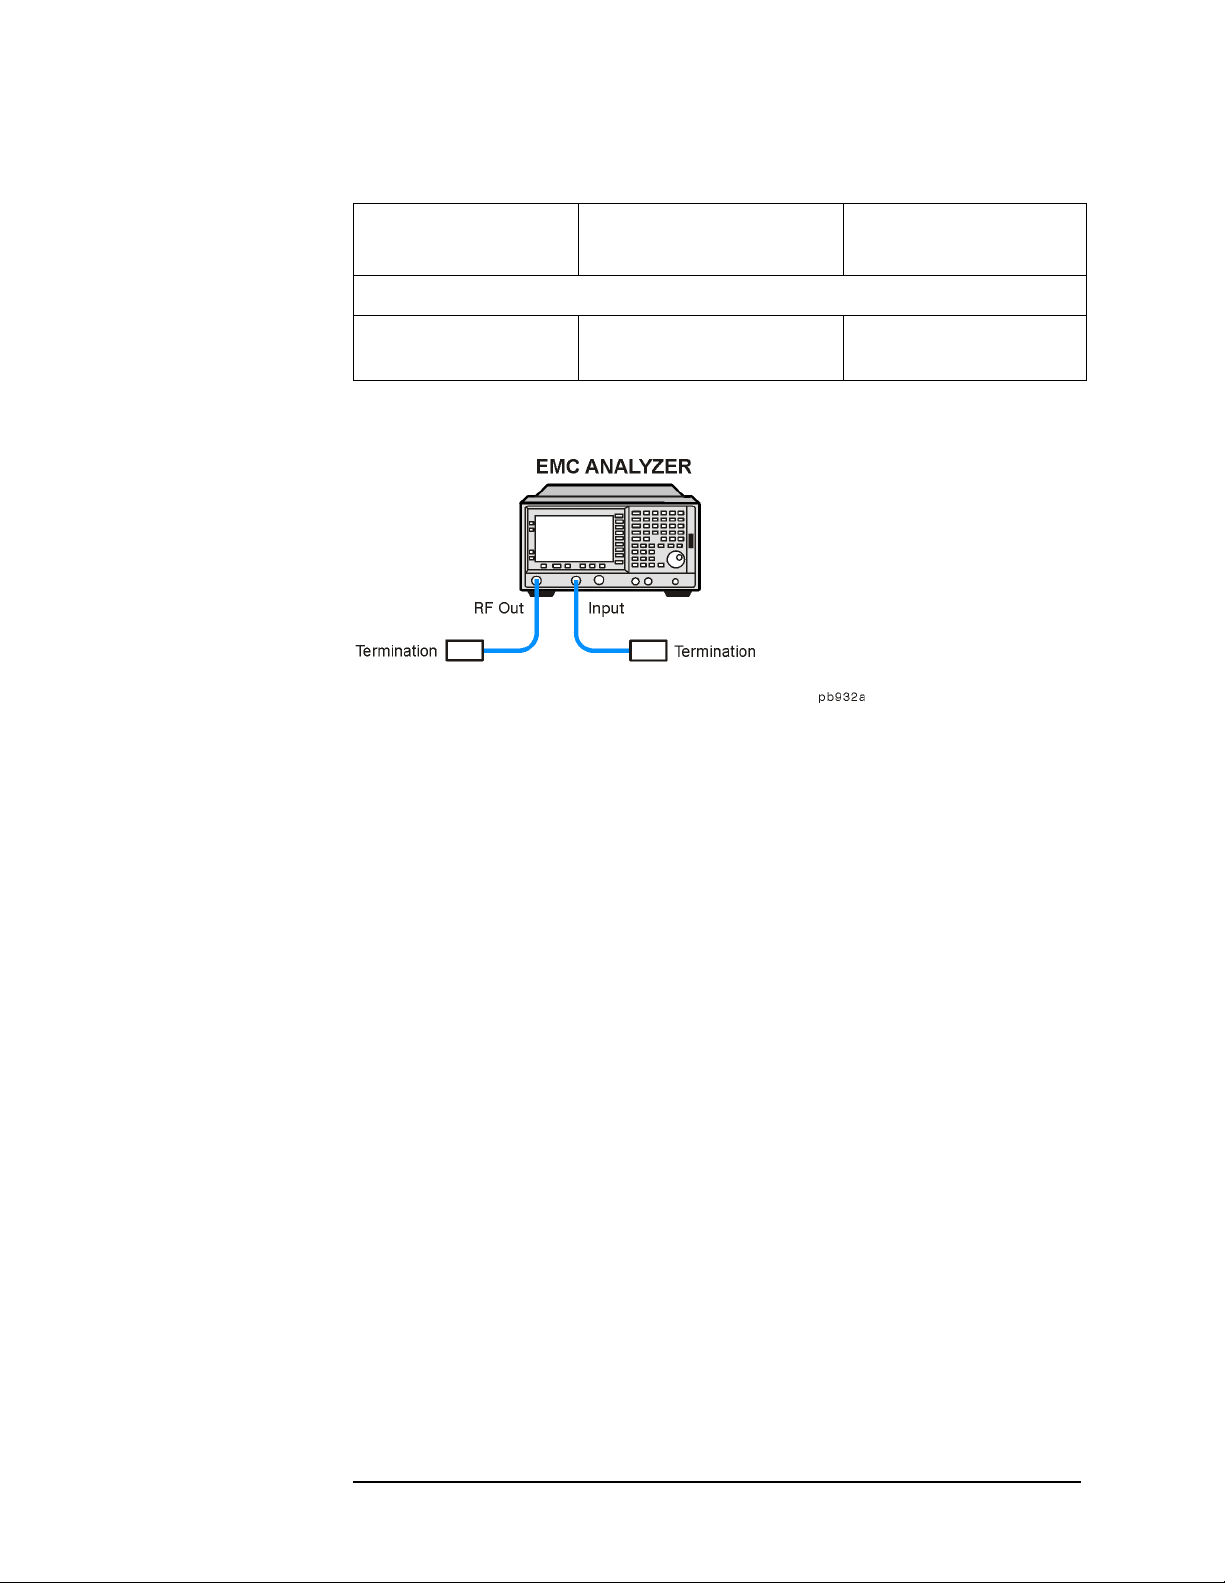
Required Equipment
Functional Testing
Displayed Average Noise Level
Instrument Critical Specifications
Adapters
Ter mination, 50 Ω
Type-N (m)
Figure 2-1 Equipment Setup
Procedure (10 MHz to 500 MHz) E7401A
(for this test)
Recommended
Agilent Model
908A
1. Connect the equipment as shown in Figure 2-1.
2. Press
System, Power On/Prese t, Preset Type (F actor y), Preset on the
analyzer. Wait for the preset routine to finish. Set the analyzer by
pressing the foll owing keys:
FREQUENCY, Start Freq, 10, MHz
Stop Freq
AMPLITUDE
AMPLITUDE
BW/Avg, Res BW, 1, MHz
Video B W
, 500, MHz
, More, Y Axis Units, dBm
, –70, dBm
, 10, kHz
3. Press the following keys on the ana lyzer:
Single
BW/Avg
Single
, Average (On), 3, Enter
W ait until AVG 3 is displayed to the left of the graticule (the analyzer
will take 3 sweeps, then stop).
Chapter 2 57
Page 58

Functional Testing
Displayed Average Noise Level
4. Press Peak Search. Record the marker frequency next to your
analyzer model in the Measur ed Frequency column as entry (a) in
Table 2-2 on page 72 for 10 MHz to 500 MHz.
5. Press the following keys on the analyzer:
Sweep, Sweep (Cont)
BW/Avg
BW/Avg
Video BW (Auto)
SPAN
FREQUENCY
, A verage (Off)
, Res BW (Auto)
, 50, kHz
6. Press Center Fre q, a nd se t the center frequency of the analyzer to the
frequency recorded in the Measured Frequency column as entry (a)
of Table 2-2 for 10 M H z to 500 MHz.
7. Press the following keys on the analyzer:
BW/Avg, Res BW, 1, kHz
Video B W
Single
, 30, Hz
Wait for the sweep to finish.
8. Press the following keys on the analyzer:
Display, Display Li ne ( On)
Adjust the display so that it is centered on the average trace noise,
ignoring a n y residual response s.
9. Record the display line amplitude setting as TR Entry 1 in Table 2-2
on page 72. The Average Noise Level should be less than the
Maximum.
Procedure (501 MHz to 1.0 GHz) E7401A
1. Press the following keys on the analyzer:
Sweep, Sweep (Cont)
FREQUENCY
Stop Freq
BW/Avg
Video B W
58 Chap ter 2
, Start Freq, 501, MHz
, 1.0, GHz
, Res BW, 1, MHz
, 10, kHz
Page 59

2. Press the following keys on the ana lyzer:
Single
Functional Testing
Displayed Average Noise Level
BW/Avg
Single
, Average (On), 3, Enter
W ait until AVG 3 is displayed to the left of the graticule (the analyzer
will take 3 sweeps, then stop).
3. Press
Peak Search, and record the marker frequency next to your
analyzer model in the Measured Frequency column as entry (b) in
Table 2-2 on pag e 72 f o r 501 MHz to 1.0 GH z .
4. Press the following keys on the ana lyzer:
Sweep, S weep (Cont)
BW/Avg
BW/Avg
Video BW (Auto)
SPAN
FREQUENCY
, Average (Off)
, Res BW (Auto)
, 50, kHz
5. Press Center Freq. Set the center frequency of the ana lyzer to the
frequency recorded in the Measured Frequency column as entry (b)
in Table 2-2 on page 72 for 501 MHz to 1. 0 GHz.
6. Press the following keys on the ana lyzer:
BW/Avg, Res BW, 1, kHz
Video B W, 30, Hz
Single
Wait for the sweep to finish.
7. Press the following keys on the ana lyzer:
Display, Display Line (On)
Adjust the displa y line so that it is centered on the average trace
noise, ignoring any residual responses.
8. Record the display line amplitude setting a s TR Entry 2 in Table 2-2
on page 72. The Average Noise Level should be less tha n the
Maximum.
Chapter 2 59
Page 60

Functional Testing
Displayed Average Noise Level
Procedure (1.01 GHz to 1.5 GHz) E7401A
1. Press the following keys on the analyzer:
Sweep, Sweep (Cont)
FREQUENCY
Stop Freq, 1.5 GHz
BW/Avg
Video B W
, Start Freq, 1.0 GHz
, Res BW, 1, MHz
, 10, kHz
2. Press the following keys on the analyzer:
Single
BW/Avg
Single
, A verage (On), 3, Enter
W ait until AVG 3 is displayed to the left of the grati cule (the anal yzer
will take 3 sweeps, then stop).
3. Press
Peak Search, and re co rd the marker frequen cy next to yo u r
analyzer model in the Measur ed Frequency column as entry (c) in
Table 2-2 for 1.01 GHz to 1.5 GHz.
4. Press the following keys on the analyzer:
Sweep, Sweep (Cont)
BW/Avg
, A verage (Off)
BW/Avg
Video BW (Auto)
SPAN
FREQUENCY
, Res BW (Auto)
, 50, kHz
5. Press Center Freq. Set the center freq uency of the analyzer to the
frequency recorded in the Measured Frequency column as entry (c)
in Table 2-2 for 1.01 GHz to 1.5 GHz.
6. Press the following keys on the analyzer:
BW/Avg, Res BW, 1, kHz
Video B W
Single
, 30, Hz
Wait for the sweep to finish.
60 Chap ter 2
Page 61

Functional Testing
Displayed Average Noise Level
7. Press the following keys on the ana lyzer:
Display, Display Line (On)
Adjust the displa y line so that it is centered on the average trace
noise, ignoring any residual responses.
8. Record the display line amplitude se tting as TR Entry 3 in Table 2-2.
The average noise level should be less than the Maximum.
Procedure (10 MHz to 1 GHz) E7402A, E7403A, E7404A, and E7405A
1. Press System, Power On/Preset, Preset Type (Factory), Preset on the
analyzer. Wait for the preset routine to finish. Set the analyzer by
pressing the foll owing keys:
FREQUENCY, Start Freq, 10, MHz
Stop Freq
AMPLITUDE
AMPLITUDE
Attenuation (Man)
BW/Avg
Video B W
, 1.0, GHz
, More, Y Axis Units, dBm
, –70, dBm
, 0, dB
, Res BW, 1, MHz
, 10, kHz
2. Press the following keys on the ana lyzer:
Single
BW/Avg
Single
, Average (On), 3, Enter
W ait until AVG 3 is displayed to the left of the graticule (the analyzer
will take three sweeps, then stop).
3. Press
Peak Search. Record the marker frequency next to your
analyzer model in the Measured F requency c olumn as entr y (d) or (e)
in Table 2-2 for 10 MHz to 1.0 GHz.
4. Press the following keys on the ana lyzer:
Sweep, S weep (Cont)
BW/Avg,
BW/Avg
Video BW (Auto)
SPAN
FREQUENCY
Chapter 2 61
Average (Off)
, Res BW (Auto)
, 50, kHz
Page 62

Functional Testing
Displayed Average Noise Level
5. Press Center Freq. Set the center freq uency of the analyzer to the
frequency recorded in the Measured Frequency column as entry (d)
or (e) in Table 2-2 for 10 MHz to 1.0 GHz.
6. Press the following keys on the analyzer:
BW/Avg, Res BW, 1, kHz
Video B W
Single
, 30, Hz
Wait for the sweep to finish.
7. Press the following keys on the analyzer:
Display, Display Li ne ( On)
Adjust the display line so that it is centered on the average trace
noise, ignoring any residu al re spo n se s.
8. If th e an alyzer is an E 7402A, recor d t h e display line amplitude
setting as TR Entry 4 i n Table 2-2. Otherwise, record the display line
amplitude setting as TR Entry 5 in Table 2-2. The average noise
level shoul d be less t h an t h e M aximum.
Procedure (1.01 GHz to 2 GHz) E7402A, E7403A, E7404A, and E7405A
1. Press System, Power On/Preset, Preset Type (Factory), Preset on the
analyzer. Wai t for the preset routine to f inish. Set the analyzer by
pressing the following keys:
FREQUENCY, Start Freq, 1.01, GHz
Stop Freq
AMPLITUDE, More, Y Axis Units, dBm
AMPLITUDE
Attenuation (Man)
BW/Avg
Video B W
, 2, GHz
, –70, dBm
, 0, dB
, Res BW, 1, MHz
, 10, kHz
2. Press the following keys on the analyzer:
Single
BW/Avg
Single
, A verage (On), 3, Enter
W ait until AVG 3 is displayed to the left of the grati cule (the anal yzer
will take 3 sweeps and then stop).
62 Chap ter 2
Page 63

Functional Testing
Displayed Average Noise Level
3. Press Peak Search. Record the marker frequency next to your
analyzer model in the Measured Frequency column as entry (f) or (g)
in Table 2-2 for 1.01 GHz to 2 GHz.
4. Press the following keys on the ana lyzer:
Sweep, S weep (Cont)
BW/Avg,
BW/Avg
Video BW (Auto)
SPAN
FREQUENCY
Average (Off)
, Res BW (Auto)
, 50, kHz
5. Press Center Freq. Set the center frequency of the ana lyzer to the
frequency recorded in the Measured Frequency column as entry (f)
or (g) in Table 2-2 for 1.01 GHz to 2 GHz.
6. Press the following keys on the ana lyzer:
BW/Avg, Res BW, 1, kHz
Video B W
Single
, 30, Hz
Wait for the sweep to finish.
7. Press the following keys on the ana lyzer:
Display, Display Line (On)
Adjust the displa y line so that it is centered on the average trace
noise, ignoring any residual responses.
8. If the analy z e r is an E7402A, record th e display lin e amplitude
setting as TR Entry 6 in Table 2-2. Otherwise, record the display line
amplitude setting as TR Entry 7 in Table 2-2. The average noise
level sh ould be le ss th an the Maximum .
Procedure (2.01 GHz to 3.0 GHz) E7402A, E7403A, E7404A, and E7405A
1. Press System, Power On/Preset, Preset Type (Factory), Preset on the
analyzer. Wait for the preset routine to finish. Set the analyzer by
pressing the foll owing keys:
FREQUENCY, Start Freq, 2.01, GHz
Stop Freq
AMPLITUDE
AMPLITUDE
Chapter 2 63
, 3.0, GHz
, More, Y Axis Units, dBm
, –70, dBm
Page 64

Functional Testing
Displayed Average Noise Level
Attenuation (Man), 0, dB
BW/Avg
Video B W
, Res BW, 1, MHz
, 10, kHz
2. Press the following keys on the analyzer:
Single
BW/Avg
Single
, A verage (On), 3, Enter
W ait until AVG 3 is displayed to the left of the grati cule (the anal yzer
will take 3 sweeps and then stop).
3. Press
Peak Search. Record the marker frequency next to your
analyzer model in the Measured Frequency column as entry (h) or ( i)
in Table 2-2 for 2.01 GHz to 3.0 GHz.
4. Press the following keys on the analyzer:
Sweep, Sweep (Cont)
BW/Avg,
BW/Avg
Video BW (Auto)
Average (Off)
, Res BW (Auto)
, 50, kHz
SPAN
FREQUENCY
5. Press Center Freq. Set the center freq uency of the analyzer to the
frequency recorded in the Measured Frequency column as entry (h)
or (i) in Table 2-2 for 2.01 GHz to 3.0 GHz.
6. Press the following keys on the analyzer:
BW/Avg, Res BW, 1, kHz
Video B W
Single
, 30, Hz
Wait for the sweep to finish.
7. Press the following keys on the analyzer:
Display, Display Li ne ( On)
Adjust the display line so that it is centered on the average trace
noise, ignoring any residu al re spo n se s.
8. If th e an alyzer is an E 7402A, recor d t h e display line amplitude
setting as TR Entry 8 i n Table 2-2. Otherwise, record the display line
amplitude setting as TR Entry 9 in Table 2-2. The A vera ge Noise
Level should be less than the maximum.
64 Chap ter 2
Page 65

Functional Testing
Displayed Average Noise Level
Procedure (3.01 GHz to 6.0 GHz) E7403A, E7404A, and E7405A
1. Press System, Power On/Preset, Preset Type (Factory), Preset on the
analyzer. Wait for the preset routine to finish. Set the analyzer by
pressing the foll owing keys:
FREQUENCY, Start Freq, 3.01, GHz
Stop Freq
AMPLITUDE, More, Y Axis Units, dBm
AMPLITUDE
Attenuation (Man)
BW/Avg
Video B W
, 6.0. GHz
, –70, dBm
, 0, dB
, Res BW, 1, MHz
, 10, kHz
2. Press the following keys on the ana lyzer:
Single
BW/Avg
Single
, Average (On), 3, Enter
W ait until AVG 3 is displayed to the left of the graticule (the analyzer
will take 3 sweeps and then stop).
3. Press
Peak Search. Record the marker frequency next to your
analyzer model in the Measured Frequency column as entry (j) in
Table 2-2 for 3.01 GHz to 6.0 GHz.
4. Press the following keys on the ana lyzer:
Sweep, S weep (Cont)
BW/Avg,
BW/Avg
Video BW (Auto)
SPAN
FREQUENCY
Average (Off)
, Res BW (Auto)
, 50, kHz
5. Press Center Freq. Set the center frequency of the ana lyzer to the
frequency recorded i n the Measured Frequency col umn as entry (j) in
Table 2-2 for 3.01 GHz to 6.0 GHz.
6. Press the following keys on the ana lyzer:
BW/Avg, Res BW, 1, kHz
Video B W
Chapter 2 65
, 30, Hz
Page 66

Functional Testing
Displayed Average Noise Level
Single
Wait for the sweep to finish.
7. Press the following keys on the analyzer:
Display, Display Li ne ( On)
Adjust the display line so that it is centered on the average trace
noise, ignoring any residu al re spo n se s.
8. Record the display line amplitude setting as TR Entry 10 in
Table 2-2. The Av erage Noise Level should be less than the
Maximum.
Procedure (6.01 GHz to 6.7 GHz) E7403A
1. Press System, Power On/Preset, Preset Type (Factory), Preset on the
analyzer. Wai t for the preset routine to f inish. Set the analyzer by
pressing the following keys:
FREQUENCY, Start Freq, 6.01, GHz
Stop Freq
AMPLITUDE
AMPLITUDE
Attenuation (Man)
BW/Avg, Res BW, 1, MHz
Video B W
, 6.7, GHz
, More, Y Axis Units, dBm
, –70, dBm
, 0, dB
, 10, kHz
2. Press the following keys on the analyzer:
Single
BW/Avg
Single
, Average (On), 3, Enter
W ait until AVG 3 is displayed to the left of the grati cule (the anal yzer
will take 3 sweeps and then stop).
3. Press
Peak Search. Record the marker frequency next to your
analyzer model in the Measur ed Frequency column as entry (k) in
Table 2-2 for 6.01 GHz to 6.7 GHz.
4. Press the following keys on the analyzer:
Sweep, Sweep (Cont)
BW/Avg,
BW/Avg
Video BW (Auto)
66 Chap ter 2
Average (Off)
, Res BW (Auto)
Page 67

Functional Testing
Displayed Average Noise Level
SPAN, 50, kHz
FREQUENCY
5. Press Center Freq. Set the center frequency of the ana lyzer to the
frequency recorded in the Measured Frequency column as entry (k)
in Table 2-2 for 6.01 GHz to 6.7 GHz.
Press the following keys on the analyzer:
BW/Avg, Res BW, 1, kHz
Video B W, 30, Hz
Single
Wait for the sweep to finish.
Press the following keys on the analyzer:
Display, Display Line (On)
Adjust the displa y line so that it is centered on the average trace
noise, ignoring any residual responses.
6. Record the display line amplitude setting as TR Entry 11 in
Table 2-2. T he Average Noise Level should b e less than the
Maximum.
Procedure (6.01 GHz to 12.0 GHz) E7404A and E7405A
1. Press System, Power On/Preset, Preset Type (Factory), Preset on the
analyzer. Wait for the preset routine to finish. Set the analyzer by
pressing the foll owing keys:
FREQUENCY, Start Freq, 6.01, GHz
Stop Freq, 12.0, GHz
AMPLITUDE
AMPLITUDE
Attenuation (Man)
BW/Avg
Video B W
2. Press the following keys on the ana lyzer:
Single
, More, Y Axis Units, dBm
, –70, dBm
, 0, dB
, Res BW, 1, MHz
, 10, kHz
BW/Avg
Single
, Average (On), 3, Enter
W ait until AVG 3 is displayed to the left of the graticule (the analyzer
will take 3 sweeps and then stop).
Chapter 2 67
Page 68

Functional Testing
Displayed Average Noise Level
3. Press Peak Search. Record the marker frequency next to your
analyzer model in the Measur ed Frequency column as entry (l) in
Table 2-2 for 6.01 GHz to 12 .0 GH z .
4. Press the following keys on the analyzer:
Sweep, Sweep (Cont)
BW/Avg,
BW/Avg
Video BW (Auto)
SPAN
FREQUENCY
Average (Off)
, Res BW (Auto)
, 50, kHz
5. Press Center Freq. Set the center freq uency of the analyzer to the
frequency recorded in the Measured Frequency column as entry (l)
in Table 2-2 for 6.01 GHz to 12.0 GHz.
6. Press the following keys on the analyzer:
BW/Avg, Res BW, 1, kHz
Video B W
Single
, 30, Hz
Wait for the sweep to finish.
7. Press the following keys on the analyzer:
Display, Display Li ne ( On)
Adjust the display line so that it is centered on the average trace
noise, ignoring any residu al re spo n se s.
8. Record the display line amplitude setting as TR Entry 12 in
Table 2-2. The average noise level should be less th an the Maxi mum.
Procedure (12.01 GHz to 13.2 GHz) E7404A
1. Press Preset System, Power On/Preset, Preset T ype (Factory), P reset, on
the analyzer. Wait for the preset routine to finish. Set the analyzer
by pressing the following keys:
FREQUENCY, Start Freq, 12.01, GHz
Stop Freq
AMPLITUDE
AMPLITUDE
Attenuation (Man)
BW/Avg
68 Chap ter 2
, 13.2, GHz
, More, Y Axis Units, dBm
, –70, dBm
, 0, dB
, Res BW, 1, MHz
Page 69

Functional Testing
Displayed Average Noise Level
Video B W, 10, kHz
2. Press the following keys on the ana lyzer:
Single
BW/Avg, Average (On), 3, Enter
Single
W ait until AVG 3 is displayed to the left of the graticule (the analyzer
will take 3 sweeps and then stop).
3. Press
Peak Search. Record the marker frequency next to your
analyzer model in the Measured Frequency column as entry (m) in
Table 2-2 for 12.01 GHz to 13.2 GHz.
4. Press the following keys on the ana lyzer:
Sweep, S weep (Cont)
BW/Avg,
BW/Avg, Res BW (Auto)
Video BW (Auto)
SPAN
FREQUENCY
Average (Off)
, 50, kHz
5. Press Center Freq. Set the center frequency of the ana lyzer to the
frequency recorded in the Measured Frequency column as entry (m)
in Table 2-2 for 12.01 GHz to 13.2 GHz.
6. Press the following keys on the ana lyzer:
BW/Avg, Res BW, 1, kHz
Video B W
, 30, Hz
Single
Wait for the sweep to finish.
7. Press the following keys on the ana lyzer:
Display, Display Line (On)
Adjust the displa y line so that it is centered on the average trace
noise, ignoring any residual responses.
8. Record the display line amplitude setting as TR Entry 13 in
Table 2-2. T he Average Noise Level should b e less than the
Maximum.
Chapter 2 69
Page 70

Functional Testing
Displayed Average Noise Level
Procedure (12.01 GHz to 22 GHz) E7405A
1. Press System, Power On/Preset, Preset Type (Factory), Preset on the
analyzer. Wai t for the preset routine to f inish. Set the analyzer by
pressing the following keys:
FREQUENCY, Start Freq, 12.01, GHz
Stop Freq, 22, GHz
AMPLITUDE
AMPLITUDE
Attenuation (Man), 0, dB
BW/Avg
Video B W
, More, Y Axis Units, dBm
, –70, dBm
, Res BW, 1, MHz
, 10, kHz
2. Press the following keys on the analyzer:
Single
BW/Avg
Single
, A verage (On), 3, Enter
W ait until AVG 3 is displayed to the left of the grati cule (the anal yzer
will take 3 sweeps and then stop).
3. Press
Peak Search. Record the marker frequency next to your
analyzer model in the Measur ed Frequency column as entry (n) in
Table 2-2 for 12.01 GHz to 22 GHz.
4. Press the following keys on the analyzer:
Sweep, Sweep (Cont)
BW/Avg,
BW/Avg
Video BW (Auto)
SPAN
FREQUENCY
Average (Off)
, Res BW (Auto)
, 50, kHz
5. Press Center Freq. Set the center freq uency of the analyzer to the
frequency recorded in the Measured Frequency column as entry (n)
in Table 2-2 for 12.01 GHz to 22 GHz.
6. Press the following keys on the analyzer:
BW/Avg, Res BW, 1, kHz
Video B W
Single
70 Chap ter 2
, 30, Hz
Page 71

Functional Testing
Displayed Average Noise Level
Wait for the sweep to finish.
7. Press the following keys on the ana lyzer:
Display, Display Line (On)
Adjust the displa y line so that it is centered on the average trace
noise, ignoring any residual responses.
8. Record the display line amplitude setting as TR Entry 14 in
Table 2-2. T he Average Noise Level should b e less than the
Maximum.
Procedure (22.01 GHz to 26.5 GHz) E7405A
1. Press System, Power On/Preset, Preset Type (Factory), Preset on the
analyzer. Wait for the preset routine to finish. Set the analyzer by
pressing the foll owing keys:
FREQUENCY, Start Freq, 22 .0 1, GHz
Stop Freq
AMPLITUDE
AMPLITUDE
Attenuation (Man)
BW/Avg
Video B W, 10, kHz
, 26 .5, GHz
, More, Y Axis Units, dBm
, –70, dBm
, 0, dB
, Res BW, 1, MHz
2. Press the following keys on the ana lyzer:
Single
BW/Avg, Average (On), 3, Enter
Single
W ait until AVG 3 is displayed to the left of the graticule (the analyzer
will take 3 sweeps and then stop).
3. Press
Peak Search. Record the marker frequency next to your
analyzer model in the Measured Frequency column as entry (o) in
Table 2-2 for 22.01 GHz to 26.5 GHz.
4. Press the following keys on the ana lyzer:
Sweep, S weep (Cont)
BW/Avg,
BW/Avg
Video BW (Auto)
SPAN
Chapter 2 71
Average (Off)
, Res BW (Auto)
, 50, kHz
Page 72
Functional Testing
Displayed Average Noise Level
FREQUENCY
5. Press Center Freq. Set the center freq uency of the analyzer to the
frequency recorded in the Measured Frequency column as entry (o)
in Table 2-2 for 22.01 GHz to 26.5 GHz.
6. Press the following keys on the analyzer:
BW/Avg, Res BW, 1, kHz
Video B W
, 30, Hz
Single
Wait for the sweep to finish.
7. Press the following keys on the analyzer:
Display, Display Li ne ( On)
Adjust the display line so that it is centered on the average trace
noise, ignoring any residu al re spo n se s.
8. Record the display line amplitude setting as TR Entry 15 in
Table 2-2. The Av erage Noise Level should be less than the
Maximum.
Table 2-2 Display Average Noise Level Worksheet
Model Number Frequency Range Measured
Frequency
E7401A 10 MHz to 500 MHz (a) _________ (1) __________ – 119 dBm N/A
Average
Noise Level
(TR Entry)
Maximum
50 Ω
Input
Input
75 Ω
E7401A 501 MHz to 1.0 GHz (b) _________ (2) __________ – 117 dBm N/A
E7401A 1.01 GHz to 1.5 GHz (c) _________ (3) __________ – 114 dBm N/A
E7402A 10 MHz to 1.0 GHz (d) _________ (4) __________ – 117 dBm N/A
E7403A E7404A,
E7405A
E7402A 1.01 GHz to 2.0 GHz (f) _________ (6) __________ – 116 dBm N/A
E7403A, E7404A,
E7405A
E7402A 2.01 GHz to 3.0 GHz (h) _________ (8) __________ – 114 dBm N/A
E7403A, E7404A,
E7405A
E7403A, E7404A,
E7405A
E7403A 6.01 GHz to 6.7 GHz (k) _________ (11) _________ – 111 d Bm N/A
10 MHz to 1.0 GHz (e) _________ (5) __________ – 116 dBm N/A
1.01 GHz to 2.0 GHz (g) _________ (7) __________ – 116 dBm N/A
2.01 GHz to 3.0 GHz (i) _________ (9) _________ – 112 dBm N/A
3.01 GHz to 6.0 GHz (j) _________ (10) _________ – 112 d Bm N/A
72 Chap ter 2
Page 73
Displayed Average Noise Level
Tab le 2-2 Display Average Noise Level Worksheet (Continued)
Functional Testing
Model Number Frequency Range Measured
Frequency
E7404A, E7405A 6.01 GHz to 12.0 GHz (l) _________ (12) _________ – 111 dBm N/A
E7405A 12.01 GHz to 13.2 GHz (m)_______ __ (13) _________ – 107 dBm N/A
E7405A 12.01 GHz to 22 GHz (n) _________ (14) _________ – 107 dBm N/A
E7405A 22.01 GHz to 26.5 GHz (o) _________ (15) _________ – 106 d Bm N/A
Average
Noise Level
(TR Entry)
Maximum
50 Ω
Input
75 Ω
Input
Chapter 2 73
Page 74
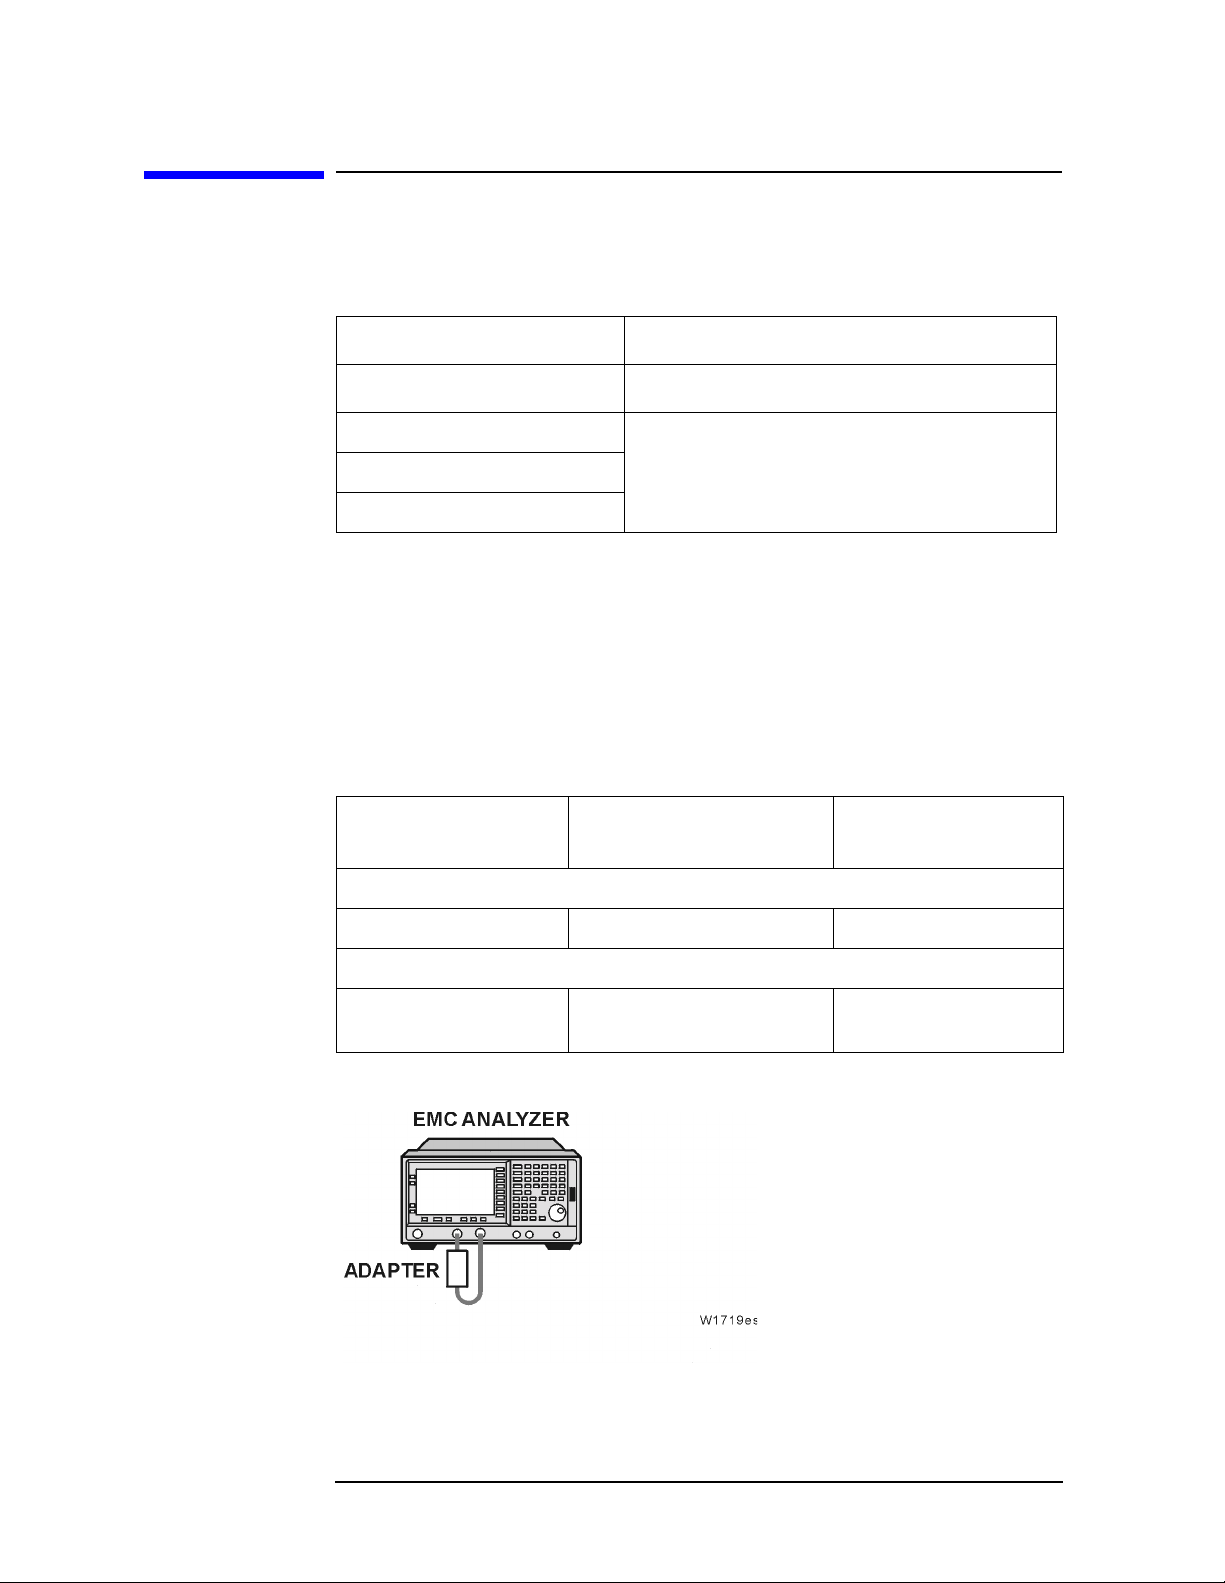
Functional Testing
EMI Detector
EMI Detector
Test Limits
Test Description Test Limits
EMI Detector Procedures Peak, Quasi- Pea k, or Average Va lu es
200 Hz Procedure +/– 2 dB
9 kHz Procedure
120 kHz Procedure
Test Description
The internal 50 MHz signal is applied to the input of the analyzer. For
each of the CISPR filters (200 Hz, 9 kHz, and 120 kHz) a peak,
quasi-peak, and avera ge measurement is made on the 50 MHz CW
signal.
Required Equipment
Instrument Critical Speci f ications
Adapters
Type-N (m) to BN C (f) 1250-0780
Cables
BNC (m) to BNC (m),
9 inches
Figure 2-2 Equipment Setup
(for t hi s t e st )
Recommended
HP/Agilent Model
HP 10502A
74 Chap ter 2
Page 75
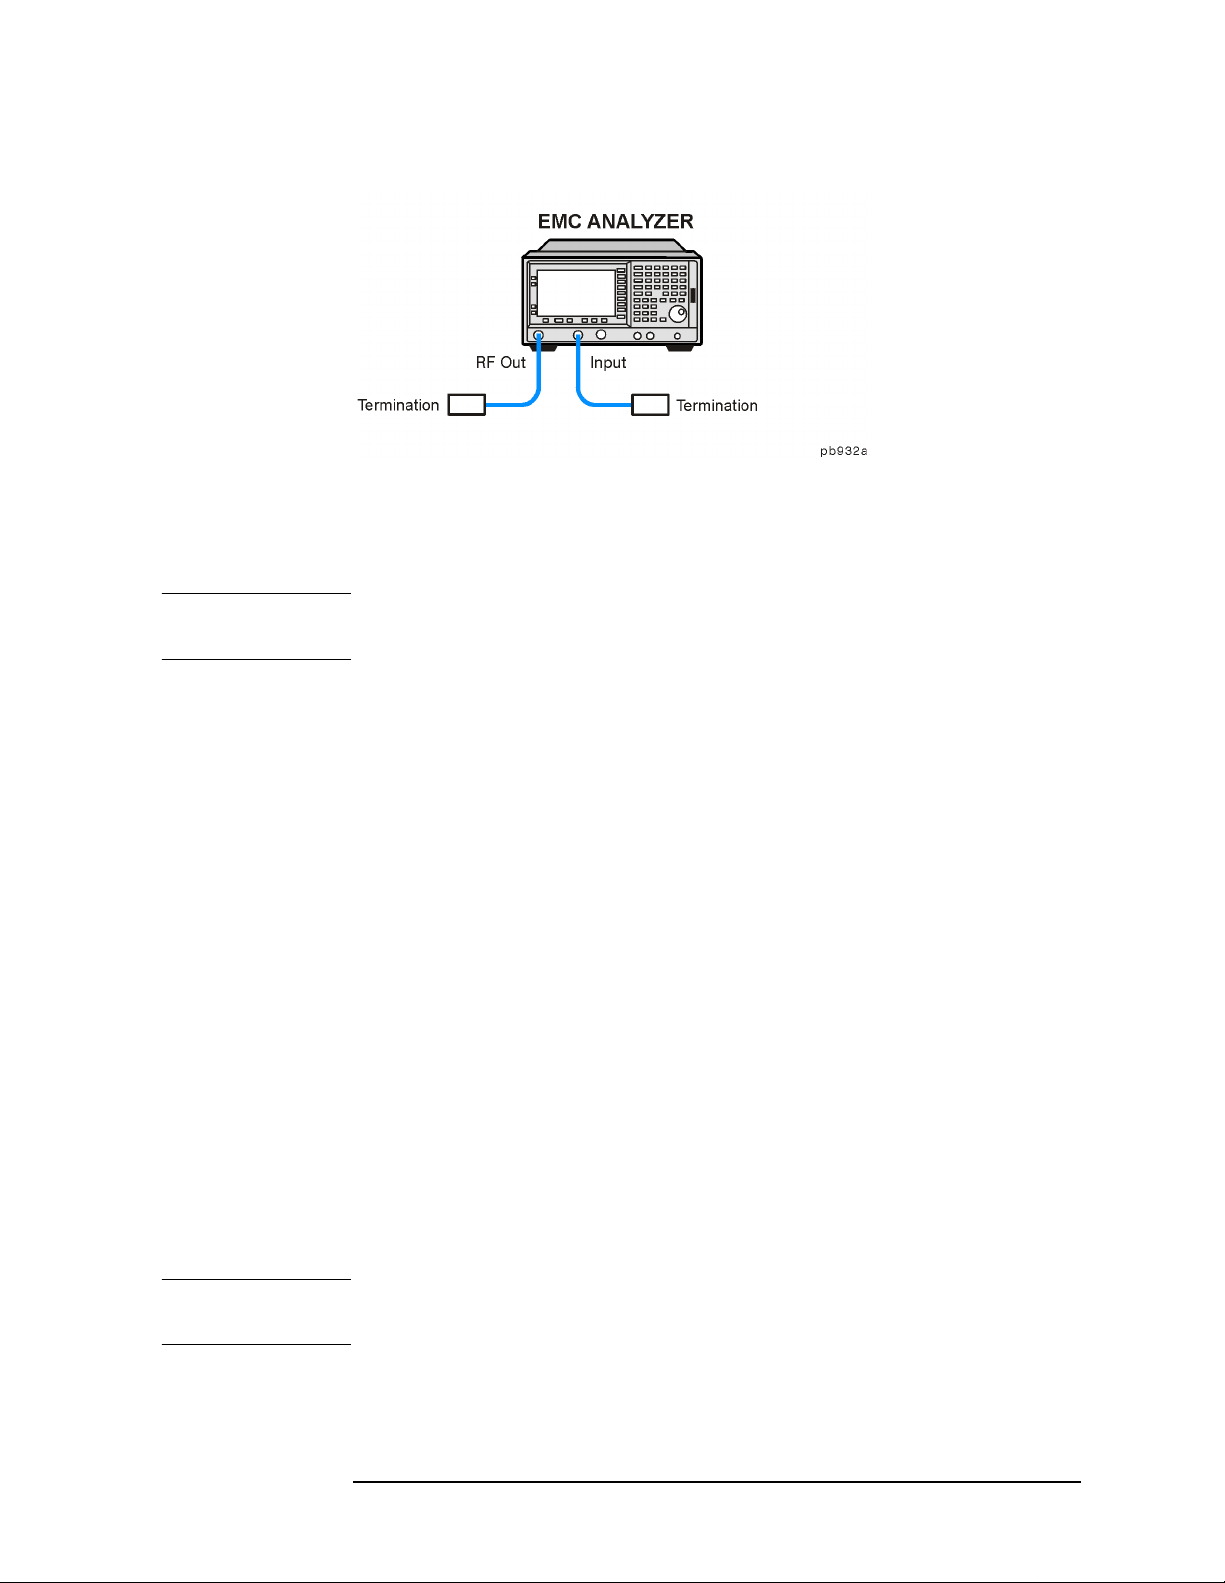
Functional Testing
EMI Detector
Figure 2-3 Equipment Setup
200 Hz Procedure
1. Connect the equipment as shown in Figure 2-2 on page 74.
NOTE For the E7401A, it is not necessary to connect the AMPTD REF OUT to
the analyzer’s 50Ω input. It switches int e rnally.
2. Press
Preset on the analyzer and wait for the preset routi ne to fin ish.
Set the analyzer up by pressing the following keys:
Input/Output, Amptd Ref Out (f=50 MHz) (On)
FREQUENCY
, 2, kHz
Span
AMPLITUDE
BW/Avg
AMPLITUDE
AMPLITUDE, 20, —dBm (E7402A, E7403A, E7404A, and E7405A
, Center Freq, 50, MHz
, Attenuation, 5, dB, More, Y A x is Units , dBm
, Res BW, 200 Hz, Video BW, 3 00, Hz
, 25, —dBm (E7401A only)
only)
Peak Search
MEASURE
, Meas at Marker
3. Wait f or the Measure at Mark er routine to fi nish and then r ecord the
peak, qua si-peak, and ave rage valu e s me asured by t he analyzer.
When the measurement is c omplete, a box will appear in the up per
left hand corner of the screen with the most recent m ea surement
information. Record these on your worksheet in 200 Hz Procedure.
9 kHz Procedure
1. Connect the equipment as shown in Figure 2-2 on page 74.
NOTE For the E7401A, it is not necessary to connect the AMPTD REF OUT to
the analyzer’s 50Ω input. It switches int e rnally.
Chapter 2 75
Page 76

Functional Testing
EMI Detector
2. Press Preset on the analyzer and wait f or the prese t routine to fini sh.
Set the analyzer up by pressing the following keys:
Input/Output, Amptd Ref Out (f=50 MHz) (On)
FREQUENCY
, 500, kHz
Span
AMPLITUDE
BW/Avg
AMPLITUDE
AMPLITUDE, 20, —dBm (E7402A, E7403A, E7404A , an d E7405A
, Center Freq, 50, MHz
, Attenuation, 5, dB, More, Y Axis Units, dBm
, Res BW, 9 kHz, Video BW, 10, Hz
, 25, —dBm (E7401A only)
only)
Peak Search
MEASURE
, Meas at Marker
3. Wait for the Measure at Marker routine to finish and then record the
peak, quasi-peak, and average values measured by the analyzer.
When t h e m e asu rement is complete, a bo x will appear in the u pper
left hand corner of the screen with the most recent measurement
information. Record these in your worksheet in 9 kHz Procedure.
120 kHz Procedure
1. Connect the equipment as shown in Figure 2-2 on page 74.
NOTE For the E7401A, it is not necessary to connect the AMPTD REF OUT to
the analyzer’s 50Ω input. It switches internally.
2. Press
Set the analyzer up by pressing the following keys:
3. Wait for the Measure at Marker routine to finish and then record the
peak, quasi-peak, and average values measured by the analyzer.
When t h e m e asu rement is complete, a bo x will appear in the u pper
left hand corner of the screen with the most recent measurement
information. Record these in your worksheet in 120 kHz Procedure.
Preset on the analyzer and wait for the pr eset routine t o finish.
Input/Output, Amptd Ref Out (f=50 MHz) (On)
FREQUENCY
, 2, MHz
Span
AMPLITUDE
BW/Avg
AMPLITUDE
AMPLITUDE, 20, —dBm (E7402A, E7403A, E7404A , an d E7405A
, Center Freq, 50, MHz
, Attenuation, 5, dB, More, Y Axis Units, dBm
, Res BW, 120 kHz, Video B W , 300, Hz
, 25, —dBm (E7401A only)
only)
Peak Search
MEASURE
, Meas at Marker
76 Chap ter 2
Page 77
Table 2-3 EMI Detector Worksheet
Test Description Detector
EMI Detector Pr ocedures Peak Quasi-peak Av erage
200 Hz Procedure
9 kHz Procedure
120 kHz Procedure
Functional Testing
EMI Detector
Chapter 2 77
Page 78
Functional Testing
Frequency Readout Accuracy
Frequency Readout Accuracy
Test Limits
Span Minimum Maximum
10 MHz 1.48988 GHz 1.49012 GHz
100 kHz 1.4899988 GHz 1.4900012 GHz
Marker C o unt Accuracy wit h
Counter Resolution at 1 Hz
1.489999999 GHz 1.490000001 GHz
Test Description
The frequency readout accuracy of the analyzer is tested w ith an input
signal of known freq uency. Frequency reference error is eliminated by
using the same freq uency standard for the analyzer and the
synthesized sweep er.
Required Equipment
Instrument Critical Specif ications
(for this test)
Signal So urces
Synthesized Sweeper 10 MHz to 1.5 GHz
External Reference Input
Adapters
Type-N (f), to APC
3.5(f)
Recommended
HP/Agilent Model
8340A/B or 836XX
Series
1250-1745
Cables
Type-N, 152-cm (60-in) 11500D
BNC, 122-cm (48-in) 10503A
78 Chap ter 2
Page 79
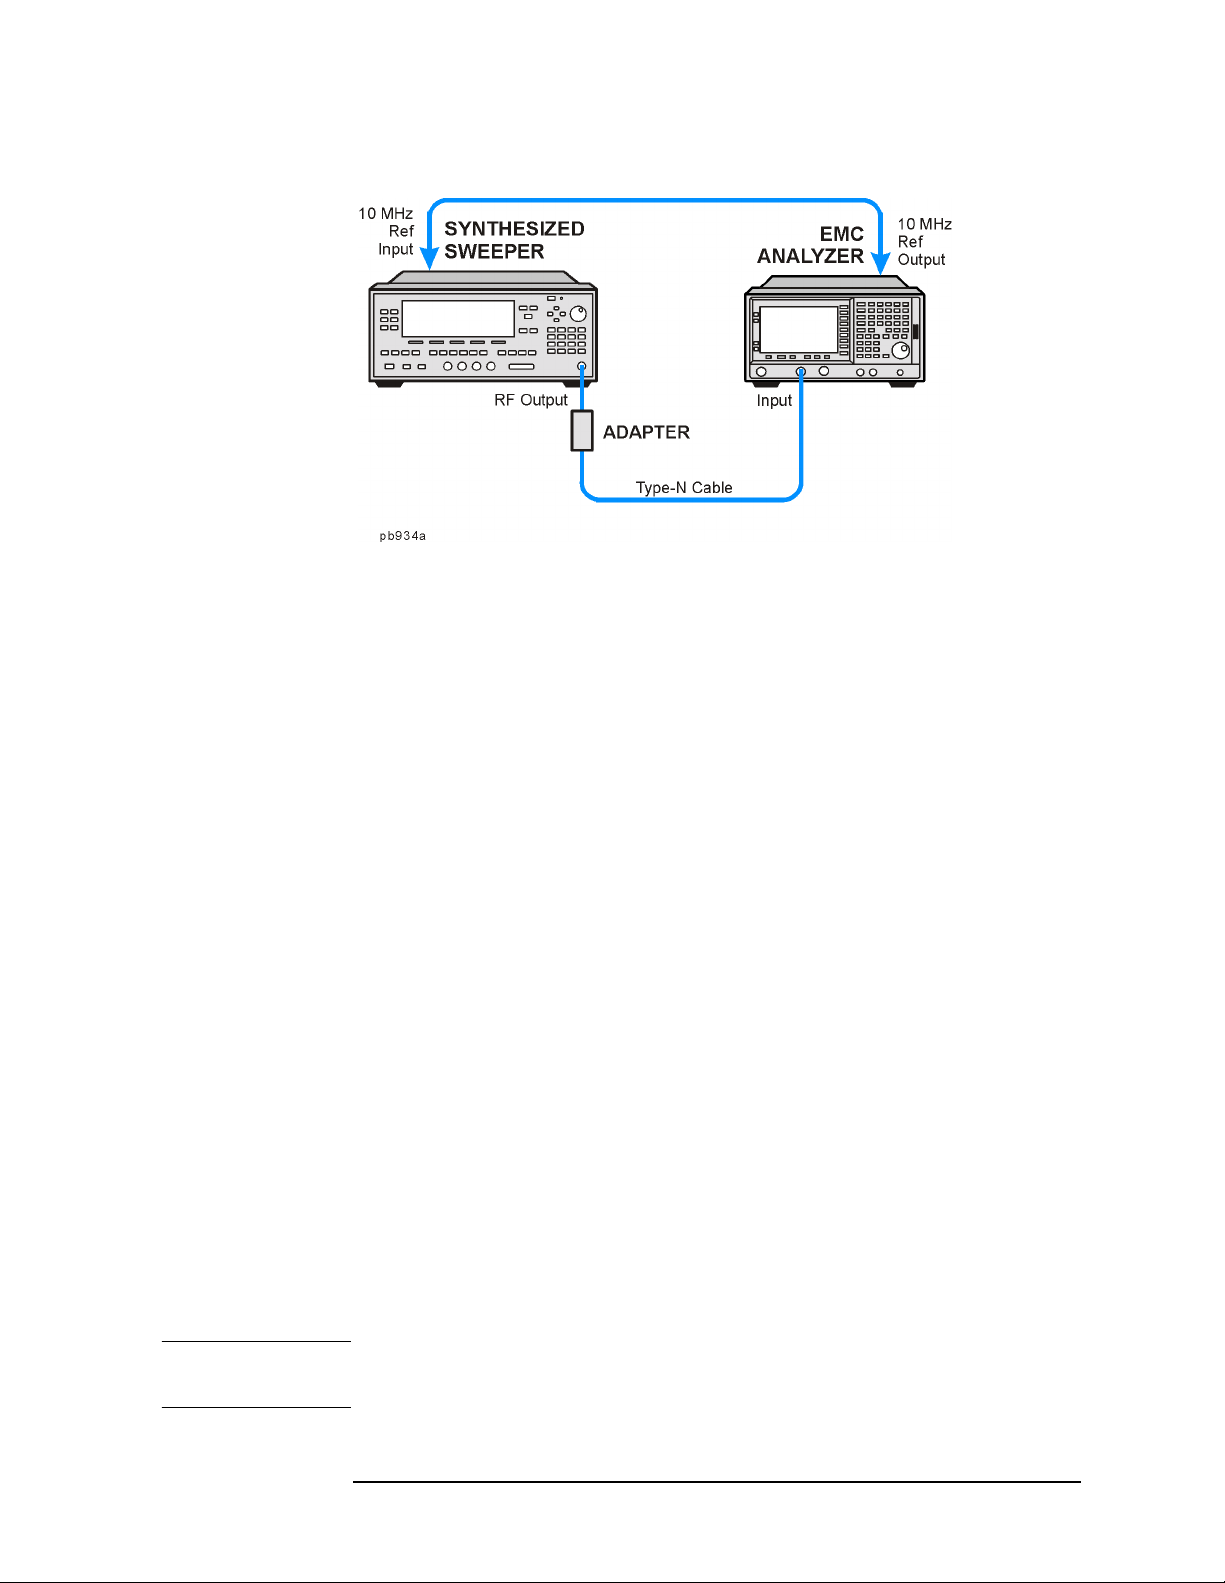
Figure 2-4 Equipment Setup
Procedure
1. Connect the equipment as shown in Figure 2-4. Remember to
connect the 10 MHz REF OUT of the analyzer to the 10 MHz REF
IN of the synthesized sweeper.
Functional Testing
Frequency Readout Accuracy
2. Perform the following steps to set up the equipment:
a. Press INSTRUMENT PR ESET on the synthesized sweeper, then set
the cont ro ls as follows:
CW, 1.490, GHz
POWER LEVEL
, 10, – dBm
b. Press System, Power On/Preset, Preset Type (Factory), Preset on the
analyzer, then wait for the preset routine to finish. Set the
analyzer by pressing the following keys:
Frequency, Center Freq, 1.490, GHz
, 10, MHz
SPAN
BW/Avg
Video B W
, Res BW, 100, kHz
, 30, kHz
3. Press Peak Search on the analyzer to measure the frequency
readou t a ccu racy. Rec or d t h is in t h e M a rker Frequ e nc y Readou t
column in Table 2-4 on page 80.
4. Press
Span, 100, kHz, BW/Avg, Res BW, 1, kHz, Video BW, 1, kHz.
5. Press Peak Search on the analyzer to measure the frequency
readou t a ccu racy. Rec or d t h is in t h e M a rker Frequ e nc y Readou t
column in Table 2-4 on page 80.
NOTE The Frequency Readout Accuracy in now complete. Continue with the
Marker Cou n t A ccu racy functional chec k.
Chapter 2 79
Page 80

Functional Testing
Marker Count Accuracy
Marker Count Accuracy
Procedure
1. Press System, Power On/Preset, Preset Type (Factory), Preset on the
analyzer, then wait for the preset routine to finish. Set the analyzer
to measure the marker count accuracy by pressing the following
keys:
Frequency, Cent er Freq, 1.490, GHz
, 10, MHz
SPAN
BW/Avg
Freq Count
2. Press Peak Search, then wait for a count to be taken (it may take
several seco n ds).
3. Record the Cntr1 frequency as the Marker Frequency Readout in
Table 2-4.
, Res BW, 100, kHz
, Resolution, 1, Hz
Table 2-4 Frequency Readout and Marker Count Accuracy Worksheet
Span Minimum Marker
Frequency
Readout
10 MHz 1.48988 GHz 1.49012 GHz
100 kHz 1.4899988 GHz 1.4900012 GHz
Marker Count
Accura cy w/Counter
Resolution at 1 Hz
1.489999999 GHz 1.490000001 GHz
Maximum
80 Chap ter 2
Page 81
Frequency Response
Test Limits
Functional Testing
Frequency Response
EMC Model Frequ e ncy Minimum
(dB)
E7401A 9 kHz to 1.5 GHz –1.5 1.5
E7402A 9 kHz to 3 GHz –1.5 1.5
E7403A 9 kHz to 3 GHz –1.5 1.5
3.01 GHz to 6.7 GH z –3.0 3.0
E7404A 9 kHz to 3 GHz –1.5 1.5
3.01 GHz to 6.7 GH z –3.0 3.0
6.71 GHz to 13. 2 GHz –3.5 3.5
E7405A 9 kHz to 3 GHz –1.5 1.5
3.01 GHz to 6.7 GH z –3.0 3.0
6.71 GHz to 13. 2 GHz –3.5 3.5
13.21 GHz to 25 GHz –4.0 4.0
25 GHz to 26.5 GHz –4.5 4.5
Maximum
Test Description
(dB)
The output of the synthesized sweeper i s fed through a power s plitter to
a power sensor and the analyzer. The synthesized sweeper’s power level
is adjuste d at 50 MHz to place t h e displayed signal at the analyz e r
center horizontal grati cule line. Measurements are made at va rious
points depending on the mod el being tested. The signal sourc e
amplitude is measured with a power meter to eliminate errors due to
source flatness. Th e po we r meter is zero ed and calibrated before
starting the measurement.
Required Equipment
Instrument Critical
Specifications
(for this test)
Signal S o urces
Synthesized Sweep er 8340A/B or 836xx Series
Chapter 2 81
Recommended
HP/Agilent Model
Page 82
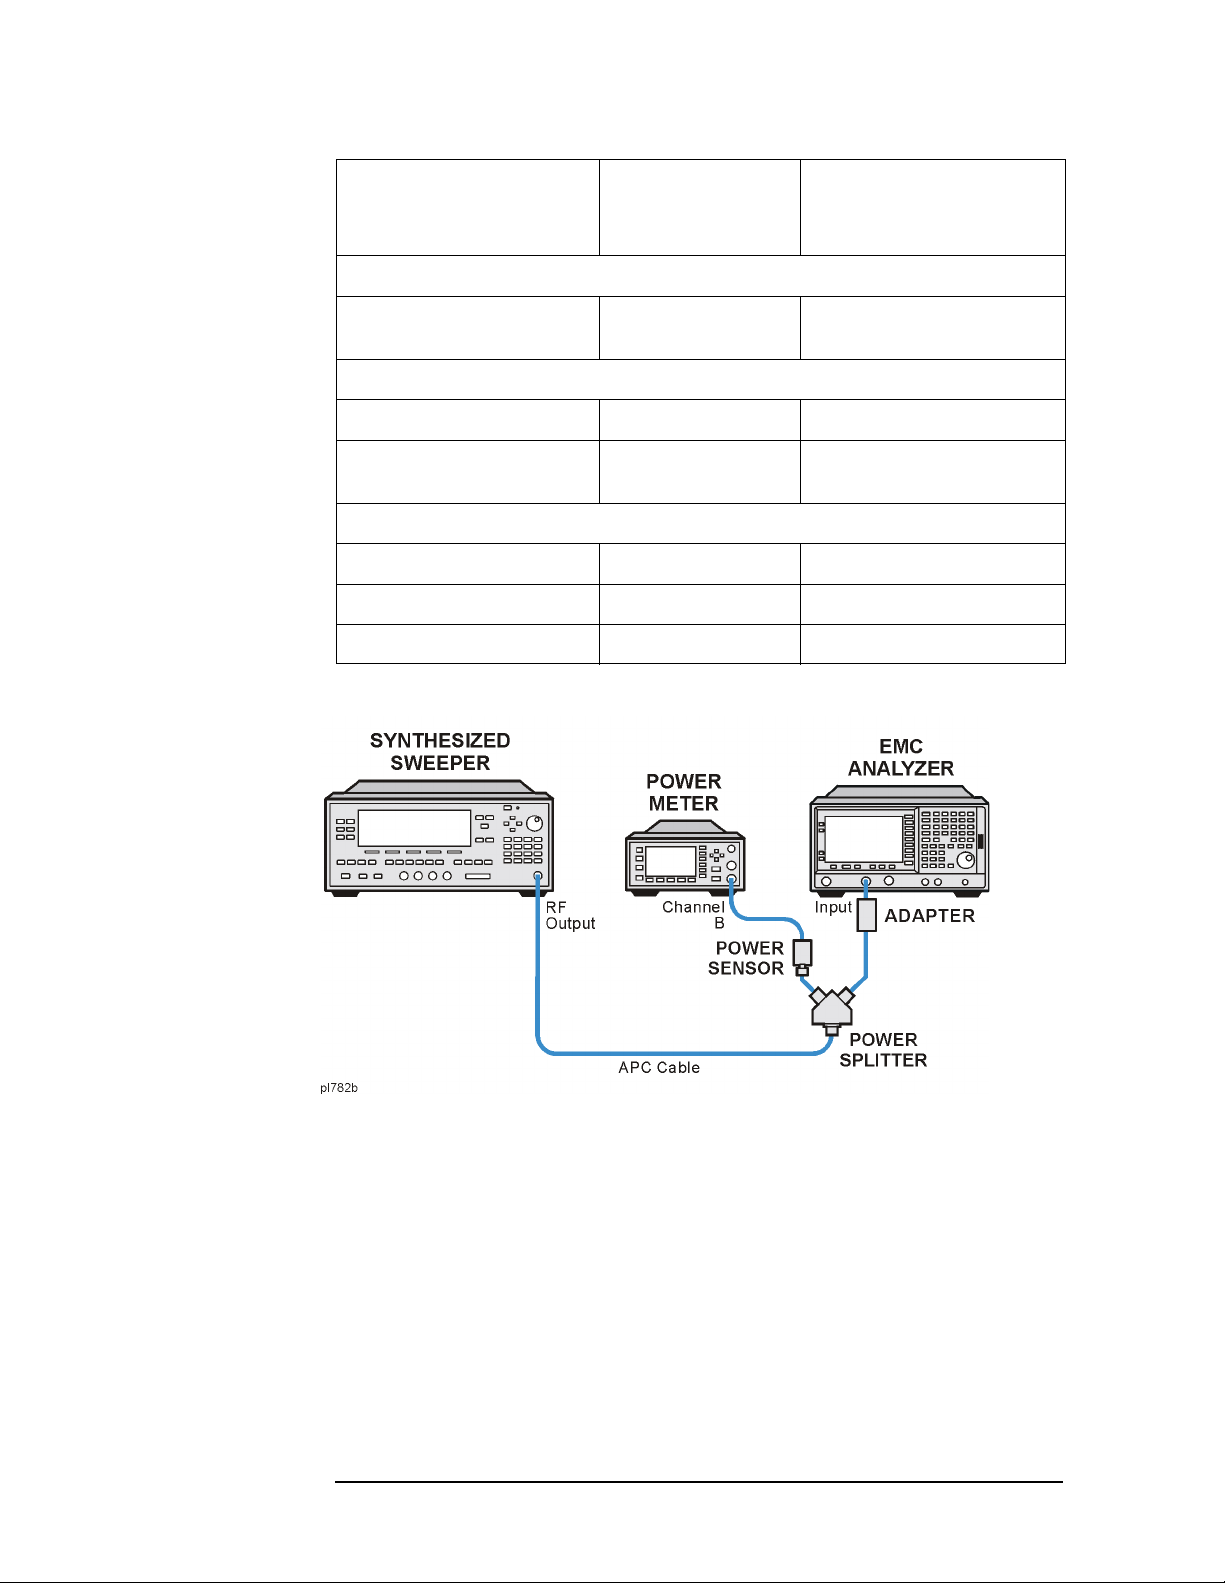
Functional Testing
Frequency Response
Instrument Critical
Adapters
Type-N (m), to APC
3.5(m)
Cables
(2) APC 3.5mm (36 in) E7405A only 8120-4921 or 11500E
BNC (m) both ends,
(48 in)
Miscellaneous
Power Meter EPM-441A (E4418A)
Power Sensor, 50 Ω 8485A
Power Splitter 11667B
Figure 2-5 Equipment Setup
Specifications
(for this test)
Recommended
HP/Agilent Model
1250-1743
10503A
Procedure
1. Zero and calibrate the power meter and power sensor as described in
the power meter operation ma nual.
2. Connect the equipment as shown in Figure 2-5.
3. Set the synthesized sweeper controls as follows:
FREQUENCY, Cent er Freq, 50, MHz
POWER LEVEL
82 Chap ter 2
, –8, dBm
Page 83

Functional Testing
Frequency Response
4. Press System, Power On/Preset, Preset Type (Factory), Preset on the
analyzer and wait for the preset routine to finish. Set the analyzer
by pressing the following keys.
FREQUENCY, 50 , MHz
CF Step
SPAN
AMPLITUDE
AMPLITUDE
AMPLITUDE
Scale/Div
BW/Avg
Video B W
Peak Search
FREQUENCY
, 50, MHz
, 20, kHz
, More, Y Axis Units, dBm
, –10, dBm
, Attenuation, 10, dB
, 2, dB
, Res BW, 10, kHz
, 3, kHz
, Signal Track (On)
5. Adj u st the sy n thesized sweeper powe r level for a marker a mplitude
reading of –14 dBm +/– 0.10 dB .
NOTE The power level of the synthesized sweeper remains unchanged for the
duration of the test. For each new test frequency, the power sensor cal
factor sho u ld be entered to minimize m e asu rement erro rs.
6. Refer to Table 2-5, “Frequency Response Wor ksheet.” Enter the
marker readout amplitude for 50 MHz as displayed on the analyzer
in the Analyzer Amplitude column.
7. E n t e r the po wer meter re ading in th e P o wer Meter Amplitude
column.
8. Compute the flatness error at 50 MHz using the following equation
and record the results in the Flatness Error column:
Flatness Error = Analy zer Amplitude – Power Me t e r A mplitude
9. Perform the following steps for each center frequency setting listed
in Table 2-5.
a. Tune the source to the next frequency li sted in the Center
Frequency column.
b. Enter the power sensor cal f actor for the new test frequency.
c. Tune the analyzer center freq uenc y by pr es s ing the ⇑ key or press
FREQUENCY, Cent er Freq, “n”, and MHz (w h e re “n” is the next test
frequency in Table 2-5).
d. Press
Peak Search.
e. Enter the power meter reading in the Power Meter A mp litude
column.
f. Enter the analyzer reading in the Analyzer Amplitude column.
Chapter 2 83
Page 84

Functional Testing
Frequency Response
g. Compute the flatness error using the following equation and
record the re su l t s in the Flatness Er ro r co lu mn:
Flatness Error = Analy zer Amplitude – Power Me t e r A mplitude
The flatness error should be less than the specified amount.
Table 2-5 Frequency Response Worksheet
Model Center
Freq
All Models 50 MHz ± 1.5
100 MHz ± 1.5
750 MHz ± 1.5
1250 MHz ± 1.5
1500 MHz ± 1.5
E7402A – E7405A 2000 MHz ± 1.5
2500 MHz ± 1.5
2999 MHz ± 1.5
E7402A – E7405A 4250 MHz ± 3.0
5750 MHz ± 3.0
6699 MHz ± 3.0
E7402A – E7405A 8000 MHz ± 3.5
Analyz e r
Amplitude
Power
Meter
Amplitude
Flatness
Error
Flatness
Error Test
Limits
(dB)
9000 MHz ± 3.5
10000 MHz ± 3.5
11000 MHz ± 3.5
13199 MHz ± 3.5
E7405A 14000 MHz ± 4.0
19000 MHz ± 4.0
24000 MHz ± 4.0
26500 MHz ± 4.5
84 Chap ter 2
Page 85
Reference Level Accuracy
Test Limits
Functional Testing
Reference Level Accuracy
Reference Level Minimum
(dB)
dBm dBmV
–30 21.76 Reference Reference
–20 31.76 –1.40 1.40
–10 41.76 –1.40 1.40
–40 11.76 –1.40 1.40
–50 1.76 –1.40 1.40
–60 –8.24 –1.40 1.40
–70 –18.24 –2.0 2.0
Maximum
(dB)
Test Description
A 50 MHz CW signal is applied to the Input of the analyzer. The
amplitude of the sourc e and the anal yzer’s reference level are decreased
in 10 dB steps. The analyzer marker functions are used to measure the
amplitude difference between steps . Ref erence L evel Accuracy i s te sted
in both Log and Linear Scale Modes. Most of the error is contributed
from the output attenuator inaccuracy in the synthesized sweeper and
not the analyzer.
Required Equipment
Instrument Critical Specifications
(for this test)
Signal S o urces
Synthesized
Sweeper
Adapters
Type-N (m), to
APC 3.5 (f)
Cables
Chapter 2 85
Output Level Accuracy
0 to –15 dBm: ±1.0 dB
–16 dBm to –63 dBm: ±1.4 dB
≤ –64 dBm: ≥2.0 dB
Recommended
HP/Agilent Model
8340A/B or 836XX
Series
1250-1745
Page 86
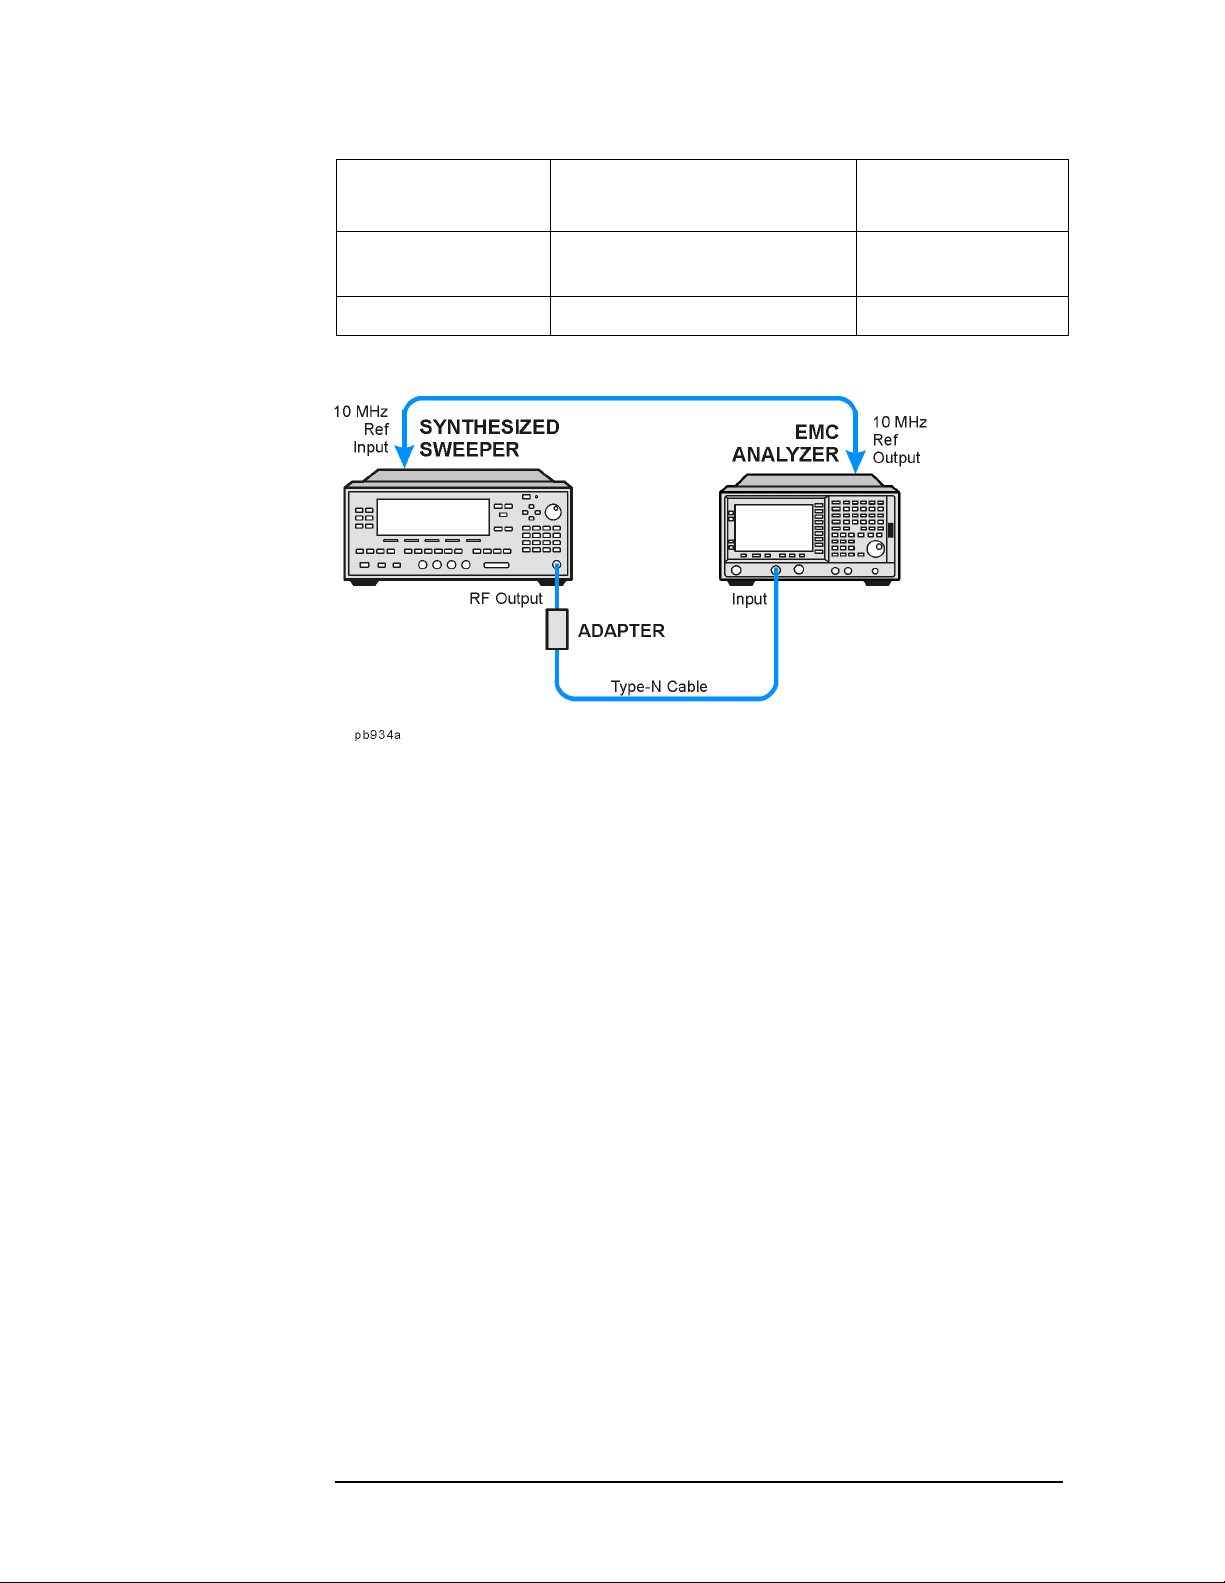
Functional Testing
Reference Level Accuracy
Instrument Critic al Spec if ication s
Type-N, 152-cm
(60-in)
BNC, 122-cm (48-in) 10503A
Figure 2-6 Equipment Setup
(for this test)
Recommended
HP/Agilent Model
11500D
Log Mode Procedure
1. Connect the equipment as shown in Figure 2-6.
2. Press
sweeper controls as follows:
3. Press System, Power On/Preset, Preset Type (Factory), Preset on the
analyzer, then wait for the preset routine to finish. Press System,
Alignments, Auto Al ign, Off. Set the analyzer by pressing the following
keys:
PRESET on the s ynthesized sweeper. Set the synthesized
CW, 50, MHz
Power Level
FREQUENCY, Center Freq, 50, MHz
, 50, kHz
SPAN
AMPLITUDE
AMPLITUDE
Attenuation (Man), 5, dB
BW/Avg
Video B W
, –30, dBm
, More, Y Axis Units, dBm
, –30, dBm
, Res BW, 3, kHz
, 30, Hz
86 Chap ter 2
Page 87

Functional Testing
Reference Level Accuracy
4. Press Peak Search on the analyzer. Adjust the amplitude on the
synthesized sweeper unti l the marker amplitude on the analyzer
reads –30 dBm +/– 0.10 dB. Enter the synthesize d sw e ep er po we r
level as t h e Synthesized Sweeper Amplitud e re ferenc e in Table 2-6
on page 87.
NOTE Under these analyzer conditions, the sw eep time is 1.7 seconds.
Therefore, the marker amplitude updates are fairly slow when
adjusting the synt he si ze r o utp u t pow er.
5. Now that the reference has been esta blished in step 4, adjust the
synthesized sw eeper power level a nd the analyzer refer enc e level
accordin g t o Table 2-6 on pag e 87. (The synthesized sweeper output
power and th e analyzer’s reference le vel will be changed in 10 dB
steps.)
6. On the analyzer, press
Single, wait for a sweep to finish, and then
press Peak Search, Marker, Delta.
7. For each new synthesized sweeper power l evel and analyzer
reference level c hange, press the following keys on the analyzer:
Single
Peak Search
Record the Analyzer Marker Amplitude reading in Table 2-6.
Table 2-6 Reference Level Accuracy Worksheet (Log Mode)
Analyzer
Reference Level
dBm
–30 Reference = _____ 0 (Referenc e) 0 (Reference) 0 (Reference)
–20 Reference + (10 dB) 8.60 11.40
–10 Reference + (20 dB) 18.60 21.40
–40 Reference + (–10 dB) –11.40 –8.60
–50 Reference + (–20 dB) –21.40 –18.60
Synthesized
Sweeper Amplitude
(dBm)
Minimum
(dB)
Analyzer
Marker ∆
Amplitude
(dB)
Maximum
(dB)
–60 Reference + (–30 dB) –31.40 –28.60
–70 Reference + (–40 dB) –42.0 –38.0
Chapter 2 87
Page 88

Functional Testing
Reference Level Accuracy
Linear Mode Procedure
1. Set the power level on the synthesized sweeper to –30 dBm by
pressing
Set the analyzer by pressing the following keys:
2.
Power Level, –30, dBm.
Sweep
AMPLITUDE
AMPLITUDE
Scale Type (Lin)
Marker
, Swe ep ( C ont)
, More, Y Axis Units, dBm
, –30, dBm (50 Ω Input)
, Off
3. Adjust the amplitude on the synthesized sweeper until the marker
amplitude on the analyzer reads –30 dBm +/– 0.10 dB. Enter the
synthesized sweeper power level as the Synthesized Sweeper
Amplit u de re fe re n ce in Table 2-7.
NOTE Under these analyzer conditions, the sweep time is 1.7 seconds.
Therefore, the marker amp litude updates are fairly slow when
adjusting th e syn th e sizer o u tpu t po we r.
4. Now that the reference has been established in step 4, adjust the
synthesized sweeper power lev el and the analyzer reference level
accord in g to Table 2-7. (The synthesized sweeper output power and
the analyzer’s reference level will be changed in 10 dB steps.)
5. On the analyzer, press
press
Peak Search, Marker, Delta.
Single, w ait for a sweep to finish, and then
6. For each new synthesized sweeper power level and analyzer
reference level chang e, press the following keys on the ana lyzer:
Single
Peak Search
Record the Analyzer Marker Amplitude reading in Table 2-7.
Table 2-7 Reference Level Accuracy Worksheet (Linear Mode)
Analyzer
Reference Level
dBm
–30 Reference = _____ 0 (Referen ce) 0 (Reference) 0 (Reference)
–20 Reference + (10 dB) 8.60 11.40
–10 Reference + (20 dB) 18.60 21.40
–40 Reference + (–10 dB) –11.40 –8.60
–50 Reference + (–20 dB) –21.40 –18.60
Synthesized
Sweeper Amplitude
(dBm)
88 Chap ter 2
Minimum
(dB)
Analyzer
Marker ∆
Amplitude
(dB)
Maximum
(dB)
Page 89

Reference Level Accuracy
Table 2-7 Reference Level Accuracy Worksheet (Linear Mo de)
Functional Testing
Analyzer
Reference Level
dBm
–60 Reference + (–30 dB) –31.40 –28.60
–70 Reference + (–40 dB) –42.0 –38.0
Synthesized
Sweeper Amplitude
(dBm)
Minimum
(dB)
Analyzer
Marker ∆
Amplitude
(dB)
Maximum
(dB)
Chapter 2 89
Page 90
Functional Testing
Resolution Bandwidth Switching Uncertainty
Resolution Band wi dt h Swit chi ng Uncer ta inty
Test Limits
Resolution Bandwidth Minimum (dB) Maximum (dB)
1 kHz 0 (Ref) 0 (Ref)
3 kHz –0.3 dB 0.3 dB
10 kHz –0.3 dB 0.3 dB
30 kHz –0.3 dB 0.3 dB
100 kHz –0.3 dB 0.3 dB
300 kHz –0.3 dB 0.3 dB
1 MHz –0.3 dB 0.3 dB
3 MHz –0.3 dB 0.3 dB
5 MHz –0.6 dB 0.6 dB
Test Description
To measure the resolution-bandwidth switching uncertainty , an
amplitude reference i s taken with the resolution bandwidth set to
1 kHz. The resolution bandwidth is c ha nged to s etti ngs b etwe en 5 MHz
and 3 kHz and the amplitude variation is measured at each setting
using the marker delta function and compared to the specification. The
span is changed as necessary to mai n t ain approxim ately the same
aspect ratio.
Required Equipment
No equipment required for analyzer models E7401A.
Instrument Crit ical Specificat ions
(for this test)
Cables
BNC, 9 inch 10502A
Recommended Model
Adapter
Type N to BNC 1250-0780 or 1250-1476
90 Chap ter 2
Page 91
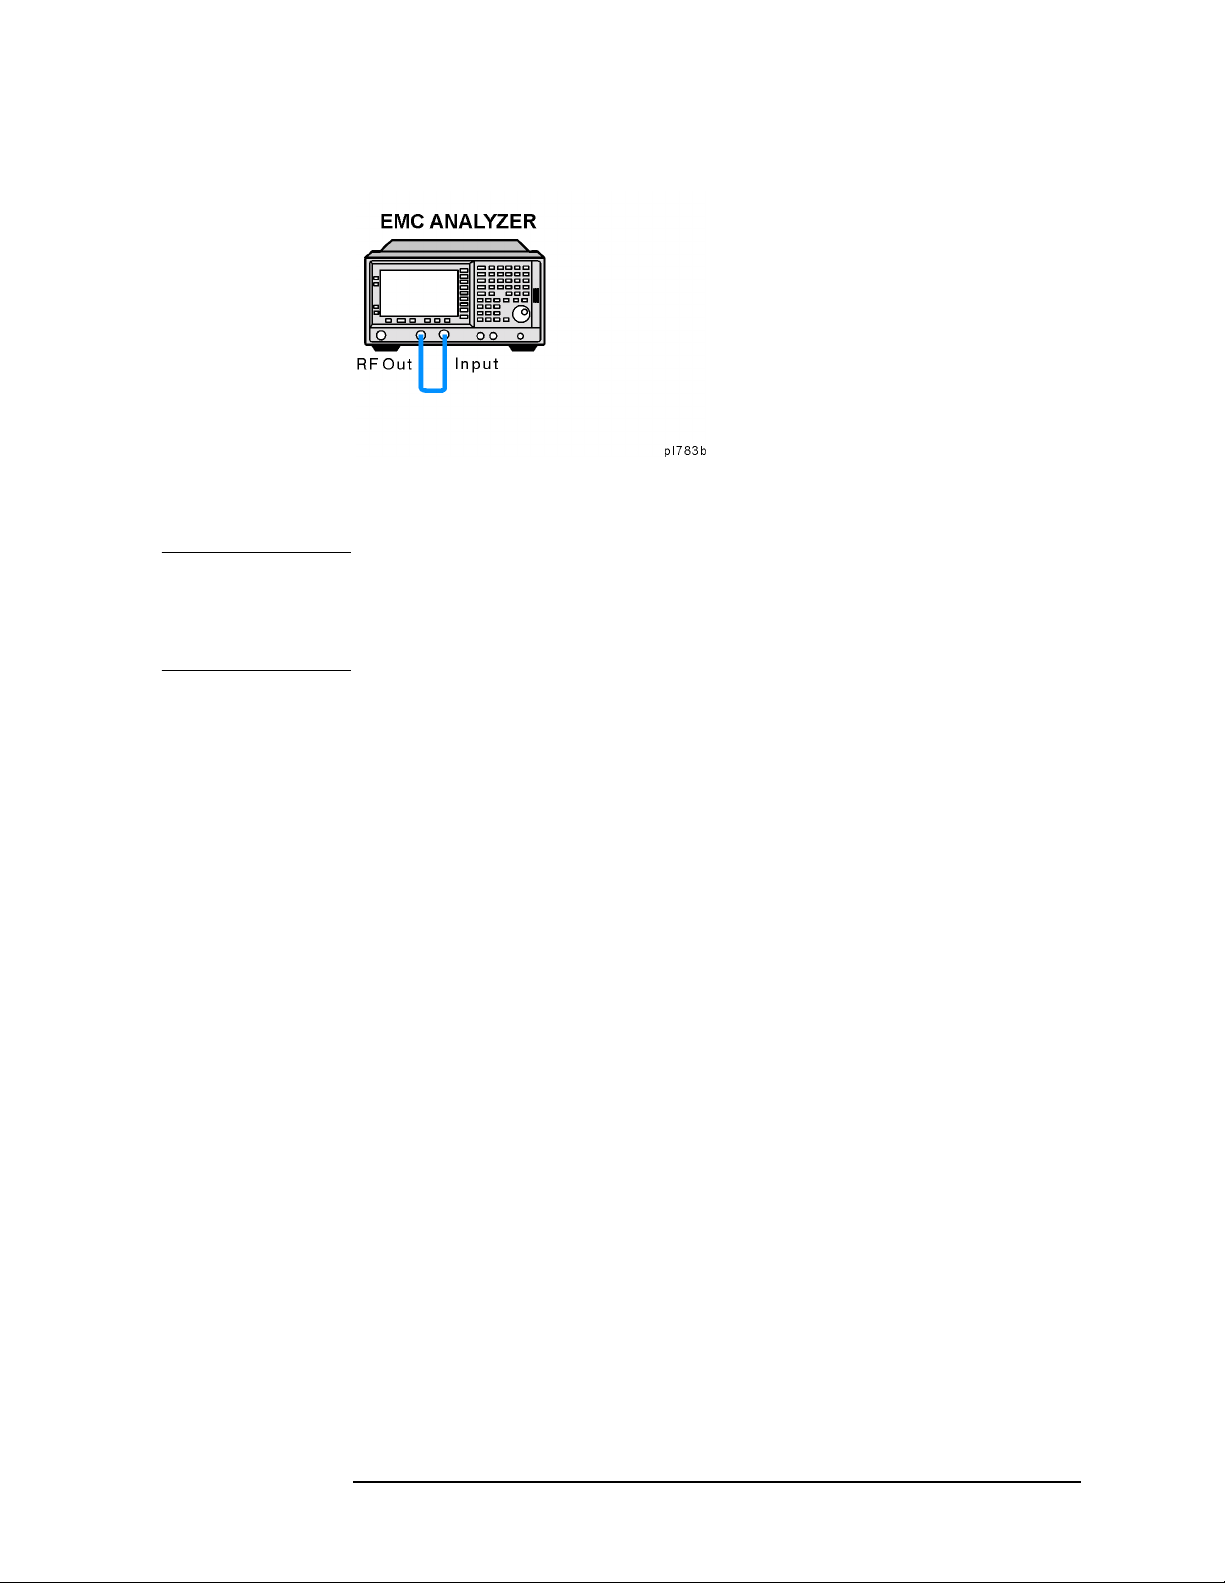
Functional Testing
Resolution Bandwidt h Swit ching Uncertainty
Figure 2-7 Equipment Setup
Procedure
NOTE The 50 MHz reference out put will automatically be switched internally
on the E7 401A and will not requ ire any ex ternal conne ctions. All other
EMC analyzers require that the AMPTD REF OUT be connected to the
INPUT to perform this test.
1. Press
System, Power On/Prese t, Preset Type (F actor y), Preset on the
analyzer. Wait for the preset routine to finish. Set the analyzer by
pressing the foll owing keys:
Input/Output, Amptd Ref ( On) (E7401A)
Input/Output, Amptd Ref Ou t (On ) (E7402A, E7403A, E7404A, and
E7405A).
Connect a cable from the AMPTD REF OUT to the INPUT 50 Ω, as
shown in Figure 2-7(E7402A, E7403A, E7404A, and E7405A).
FREQUENCY, 50 , MHz
, 50, kHz
SPAN
AMPLITUDE
AMPLITUDE
AMPLITUDE
BW/Avg
Video B W
, More, Y Axis Units, dBm
, –20, dBm
, Scale/Div, 1, dB
, Res BW, 1, kHz
, 1, kHz
2. Press AMPLITUDE and use the knob to adjust the reference level until
the signal appears five divisions (mid-screen) below the reference
level. Press the following keys on the analyzer:
Peak Search
Marker
FREQUENCY
, Delta
, Signal Track (On)
3. Set the analyzer Resolution Bandwidth and Span acc o rdi ng to Table
2-8 on page 92.
4. Press
Peak Search, t h en record the ∆ Mkr 1 amplitude readin g in
Table 2-8.
Chapter 2 91
Page 92
Functional Testing
Resolution Bandwidth Switching Uncertainty
5. Repeat step 3 and 4 for each of the remaining resolution bandwidth
and span set t ings li ste d in Table 2-8. The ∆ Mkr 1 amplitude reading
should be within the range indicated in the table “Test Li mi ts ” on
page 90.
Tab le 2-8 Resolution Bandwidth Switching Uncertainty Worksheet
Resolution
Bandwidth Setting
1 kHz 50 kHz 0 (Ref)
3 kHz 50 kHz
10 kHz 50 kHz
30 kHz 500 kHz
100 kHz 500 kHz
300 kHz 5 MHz
1 MHz 10 MHz
3 MHz 10 MHz
5 MHz 50 MHz
SPAN Setting ∆ Mkr 1 Amplitude Reading
92 Chap ter 2
Page 93
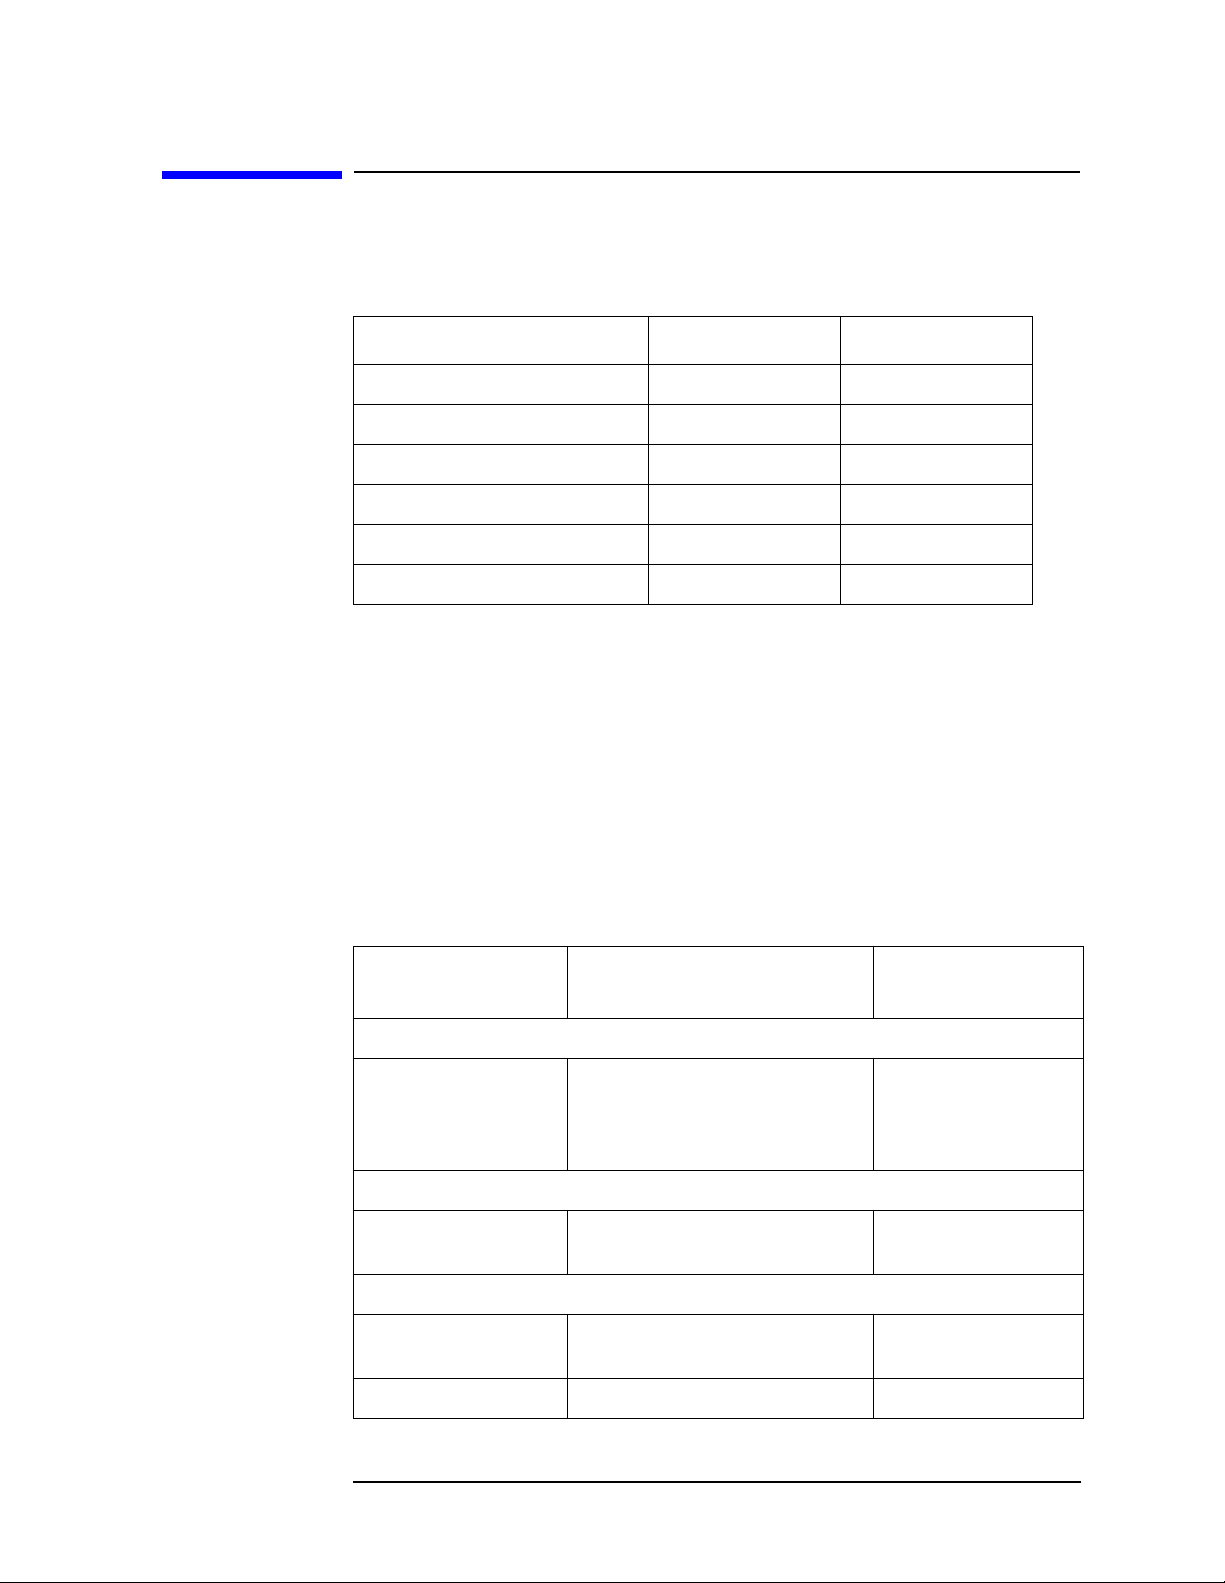
Functional Testing
Scale Fidelity
Test Limits
dB from Reference Level Minimum (dB) Maximum (dB)
–4 –1.0 1.0
–16 –1.4 1.4
–28 –1.4 1.4
–40 –1.4 1.4
–52 –1.4 1.4
–64 –2.0 2.0
Test Description
Scale Fidelity
A 50 MHz CW signal is applied from a synthesized sweeper to the input
of the analyzer. The source is a djusted for a response at the reference
level. The synthesized sweeper amplitude is adjusted to achieve a
nominal amplitude below the reference level. The analyzer’s amplitude
marker is compared to the actual source change to determine the scale
fidelity error. Most of the err or is the source’s output attenuator
inaccuracy from the synthesized sweeper.
Required Equipment
Instrument Critical Specifications
(for this test)
Signal S o urces
Synthesized
Sweeper
Adapters
Type-N (m), to
APC 3.5 (f)
Output Lev el Accura cy
0 to –15 dBm: ±1.0 dB
–16 dBm to –63 dBm: ±1.4 dB
≤ –64 dBm: ≥2.0 dB
Recommended
HP/Agilent Model
8340A/B or 836XX
Series
1250-1475
Cables
Type-N, 152-cm
(60-in)
BNC, 122-cm (48-in) 10503A
Chapter 2 93
11500D
Page 94
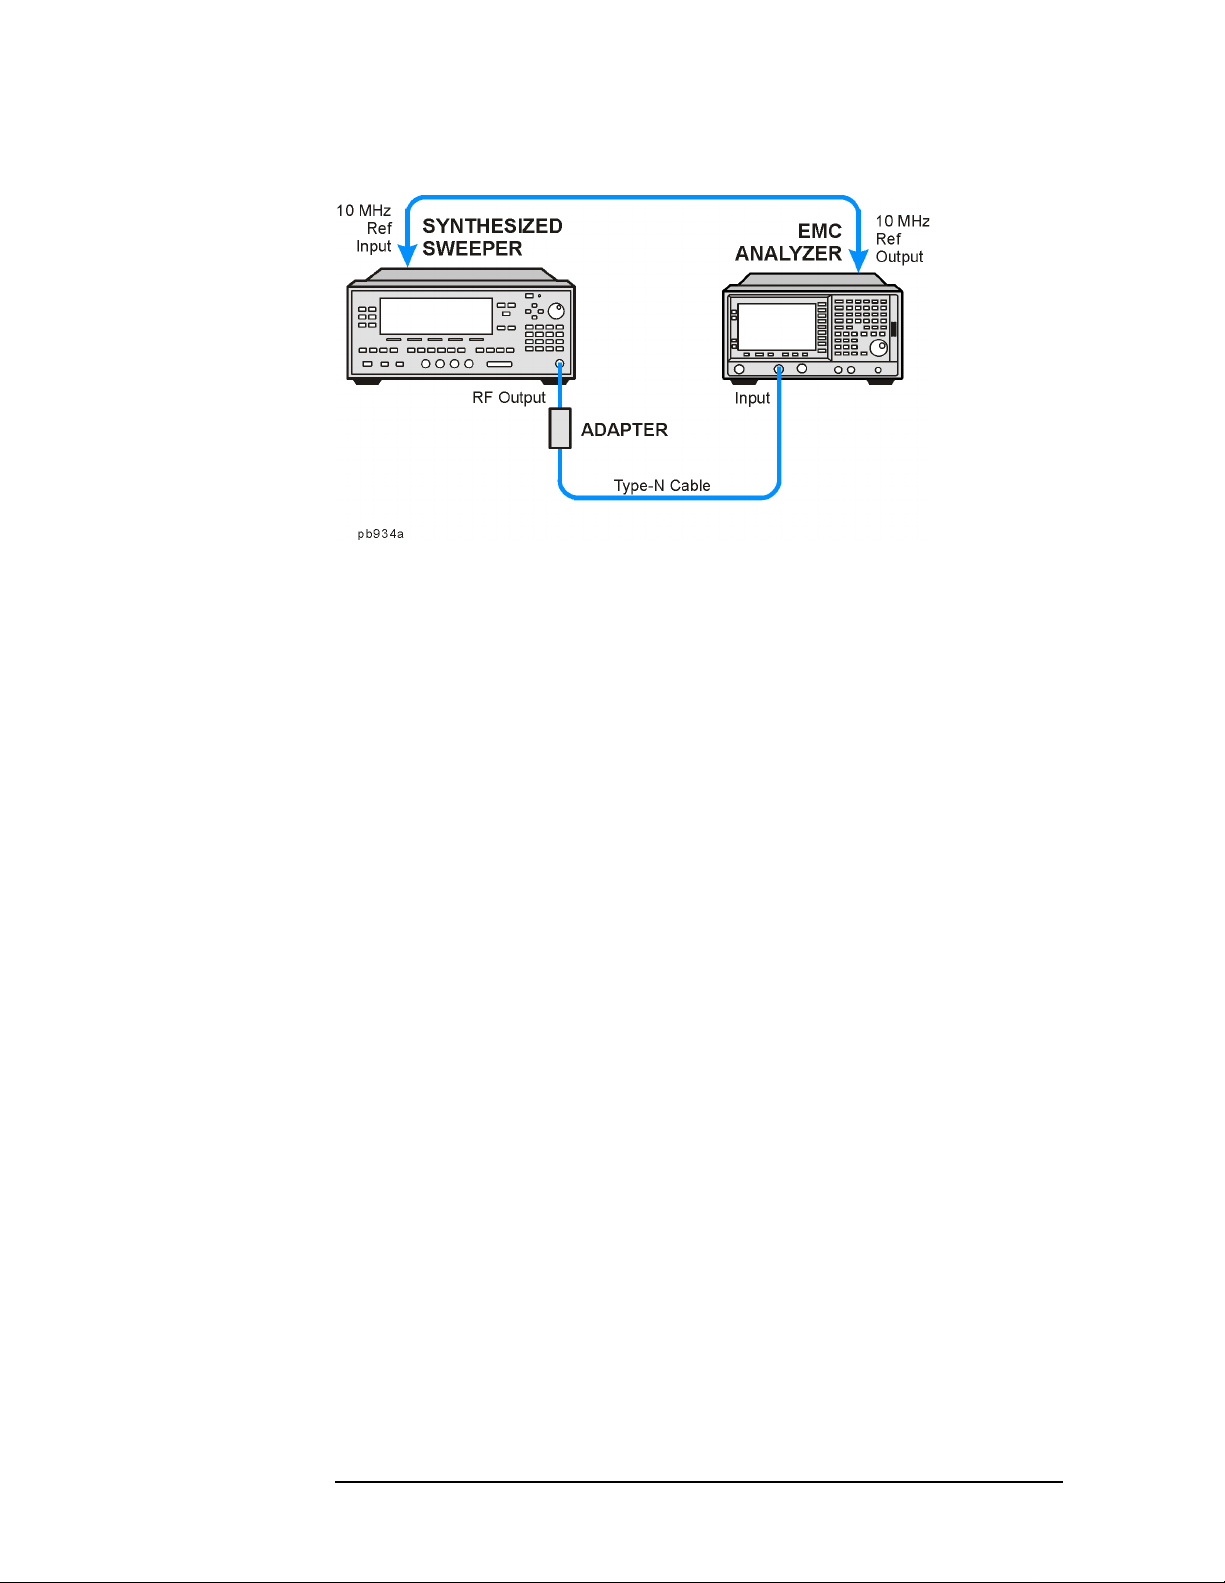
Functional Testing
Scale Fidelity
Figure 2-8 Equipment Setup
Procedure
1. Connect the equipment as shown in Figure 2-8.
2. Preset the synthesized sweeper. Set the synthesized sweeper
controls as follows:
CW, 50, MHz
Power Level
, 0, dBm
3. Press System, Power On/Preset, Preset Type (Factory), Preset on the
analyzer, then wait for the preset routine to finish. Press
Alignments, Auto Al ign, Off. Set the analyzer by pressing the following
System,
keys:
FREQUENCY, Center Freq, 50, MHz
, 45, kHz
SPAN
AMPLITUDE
AMPLITUDE
BW/Avg
Video B W
Peak Search
, More, Y Axis Units, dBm
, Attenuation, 10, dB
, Res BW, 3, kHz
, 1, kHz
4. Adjust the amplitude on the sythesized sweeper until the marker
amplitude on the analyzer reads 0 dBm +/– 0.10 dB. Record the
synthesized sweeper output level as the reference in Table 2-9 o n
page 95.
5. On the analyzer, press the following keys:
Single
Peak Search
Marker
94 Chap ter 2
, Delta
Page 95
6. R e co rd the marker de lta readin g in Table 2-9. At each new
synthesized sw eep er po we r level, press
record the marker am plitude leve l .
T a bl e 2-9 Scale Fide l it y Worksh ee t
Functional Testing
Scale Fidelity
Single, Peak Search, a nd
Synthesized
Sweeper Level
Reference=______ 0 (Reference) 0 (Reference)
Reference –4 dB –5.0 –3.0
Reference –16 dB –17.40 –15.60
Reference –28 dB –29.40 –26.60
Reference –40 dB –41.40 –38.60
Reference –52 dB –53.40 –50.60
Reference –64 dB –66.0 –62.0
Minimum (dB) Marker Level
(dB)
Maximum (dB)
Chapter 2 95
Page 96
Functional Testing
Second Harmonic Spurious Responses
Second Harmoni c Spuri ou s Respons es
Test Limits
Model Number Maximum
E7401A –55 dBc
E7402A –55 dBc
E7403A –55 dBc
E7404A –55 dBc
E7405A –55 dBc
Test Description
To test second harmonic distortion, a 50 MHz low pass filter is used to
filter the sourc e output, ensuring that harmonics read by the analyzer
are internally generated and not coming from the source. The source
power and input attenuation on the analyzer are adjusted so –20 dBm
is the power level at the first mixer.
Table 2-10
Required Equipment
Instrument Critical Specifications
(for this test)
Signal Sources
Synthesized Sweeper 8340A/B or 836XX
Miscellaneous
50 MHz Low pass filter Rejection at 80 MHz:
>60 dB
Adapters
Type-N (f), to APC 3.5(f) 1250-1745
3.5 mm (m) to 3.5 mm
(m)
SMA (f) to BNC (m) 1250-2015
Cables
Recommended
HP/Agilent Model
Series
0955-0306
5061-5311
(2) BNC, 122-cm (48-in) 10503A
96 Chap ter 2
Page 97
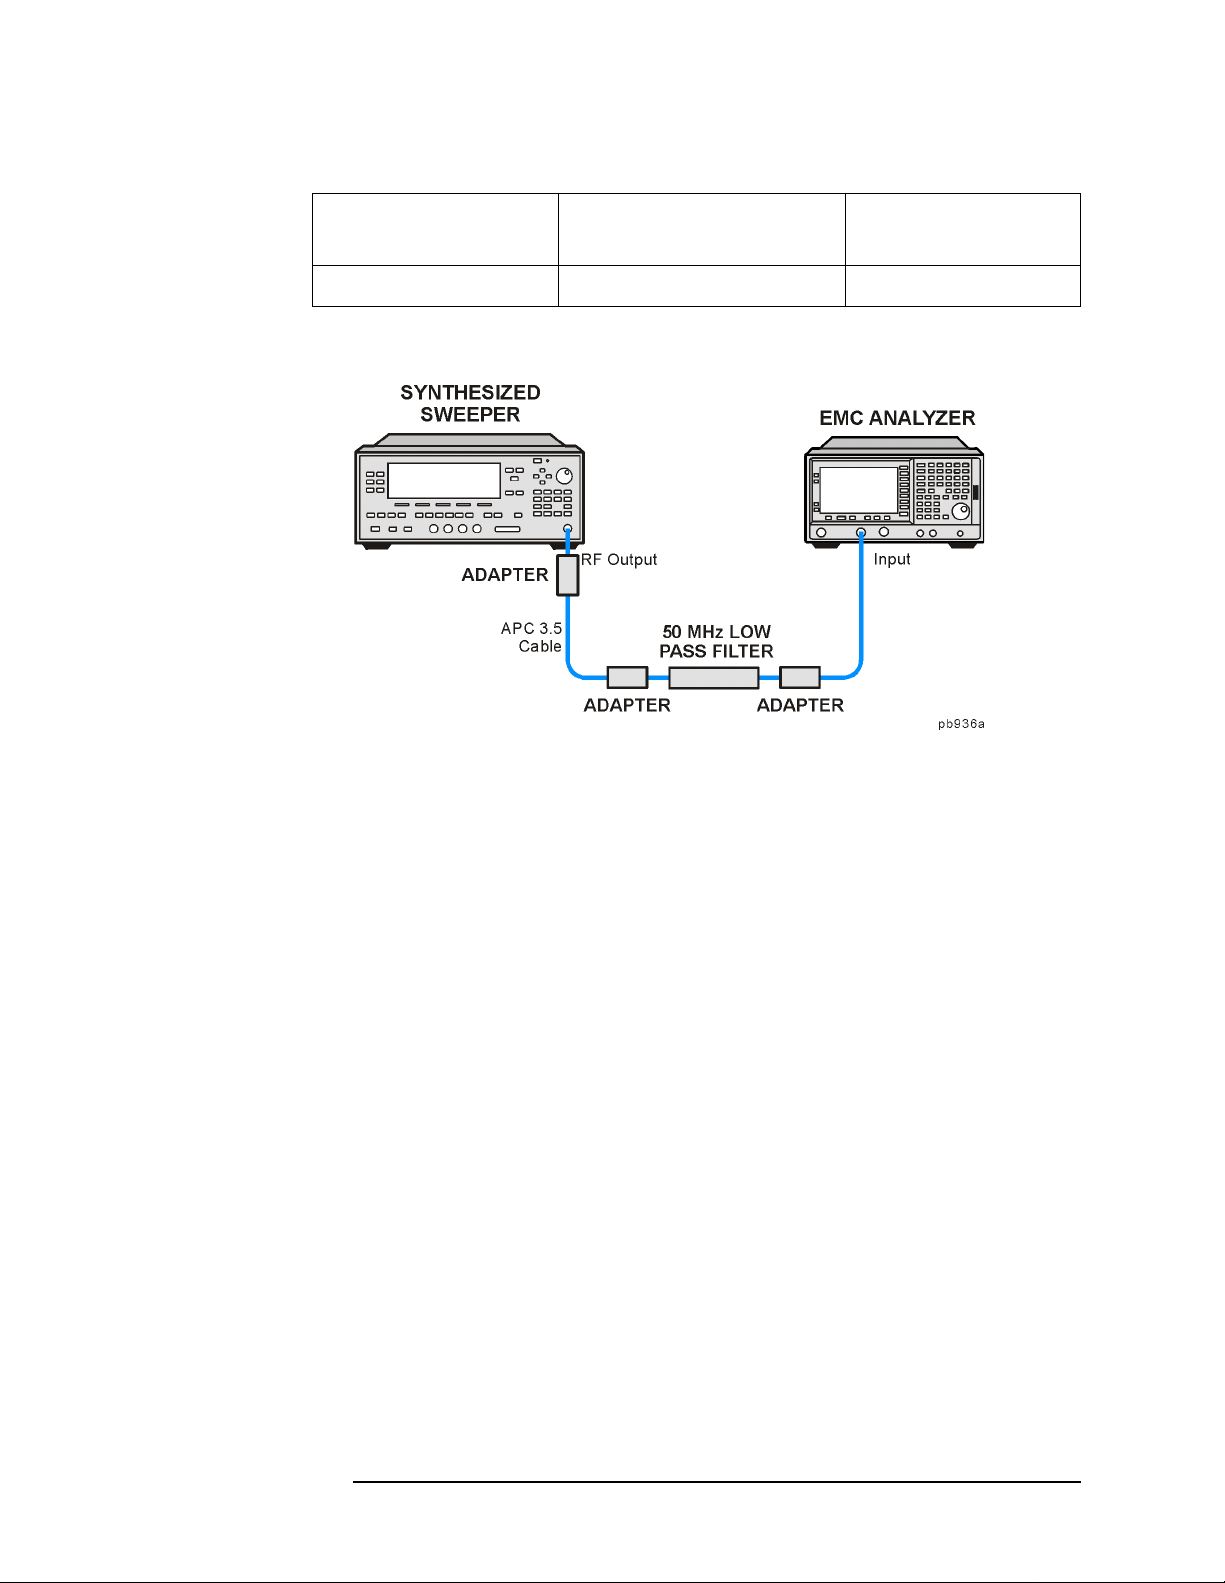
T a b l e 2- 1 0
Functional Testing
Second Harmonic Spurious Responses
Instrument Critical Specifications
APC 3.5 mm HP 11500D
Figure 2-9 Equipment Setup
Procedure
(for this test)
Recommended
HP/Agilent Model
1. Connect the equipment as shown in Figure 2-9.
2. Set the synthesized sweeper contr ols as follows:
Frequency, 40, MHz
POWER LEVEL
3. Press
System, Power On/Prese t, Preset Type (F actor y), Preset on the
, –10, dBm
analyzer. Wait for the preset routine to finish.
Set the analyzer b y pressing the following keys:
AMPLITUDE, More, Y Axis Units, dBm
FREQUENCY
, 1, MHz
SPAN
AMPLITUDE
Attenuation (Man), 10, dB
BW/Avg
, Center Freq, 40, MHz
, –10, dBm
, Res BW, 30, kHz
4. Adj u st the synthesized sweep er po wer level to place the peak of the
signal at the re fe rence leve l .
Chapter 2 97
Page 98

Functional Testing
Second Harmonic Spurious Responses
5. Set the analyzer by pressing the following keys:
SPAN, 50, kHz
BW/Avg
Video B W
, Res BW, 1, kHz
, 100, Hz
6. Wait for two sweeps to finish, then press the f ol lo wing a nalyzer key s:
Peak Search
Mkr →
Mkr → CF Step
Marker
FREQUENCY
, Delta
7. Press t h e ⇑ key on the analyzer to step to the second harmonic (at
80 MHz) . Press
Peak Search. The marker delta amplitude reading
should be less than the Maximum value listed in the Test Limits
Table.
98 Chap ter 2
Page 99
Functional Testing
Tracking Generator Level Flatness: M odel E7401A, Option 1DN
T racking Generator Level Flatness: Model
E7401A, Option 1DN
Test Limits
Minimum Maximum
Flatness ≤ 10 MHz –2. 5 d B 2.5 dB
Flatness > 10 MHz –2.0 dB 2.0 dB
Test Description
A calibrated power sensor is connected to the tracking generat or output
to measure the power lev el at 50 MHz. The power meter is set f or REL
mode so that future power level readings are in dB relative t o the power
level at 50 MHz. The tracking generator is then stepped to several
frequencies throughout its range. The output power difference relative
to the power level at 50 MH z is measured at each frequency and
recorded.
Required Equipment
Instrument Critical Specifications
(for this test)
Meters
Power Meter 438A or E4418A,
RF Power Sensor Frequency Range:
100 kHz to 1.5GHz
Adapters
Type-N (m to BNC
(f) (2)
Cables
BNC, 23-cm (9-in) 10502A
Recommended
HP/Agilent Model
E4419A
8482A
1250-1476
Chapter 2 99
Page 100
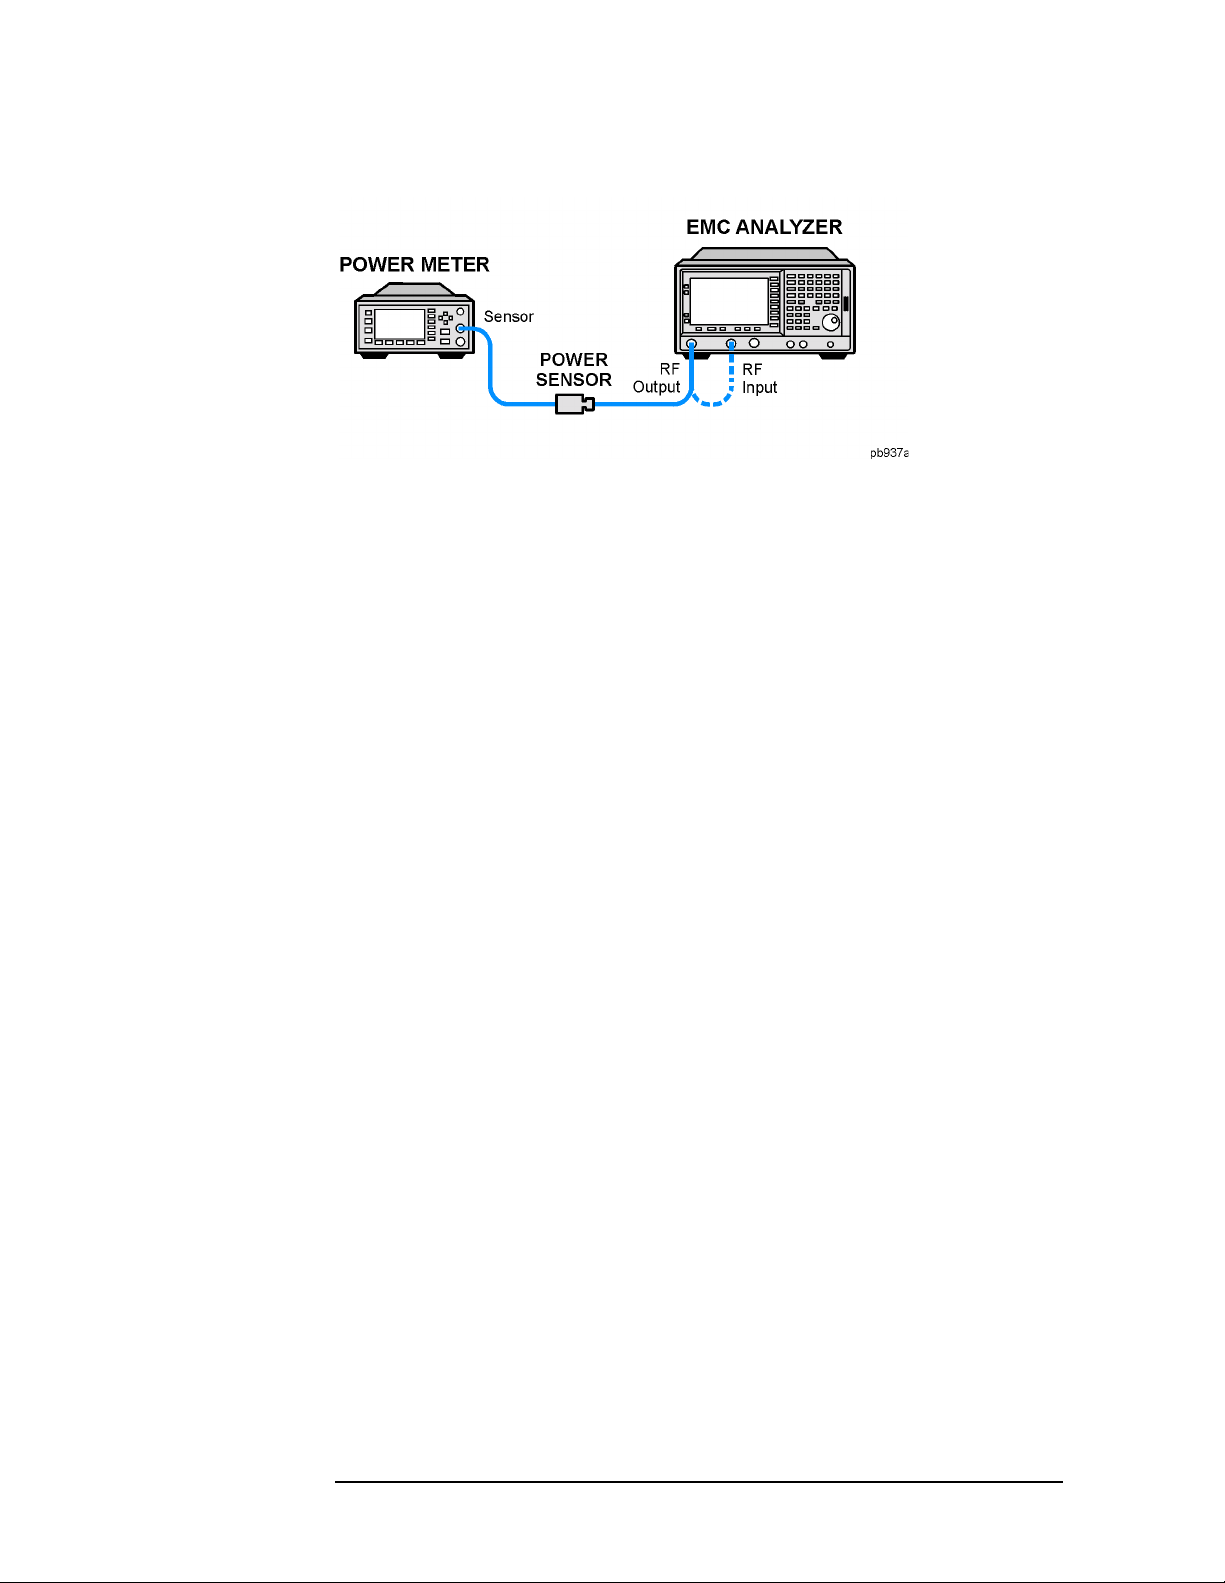
Functional Testing
Tracking Generator Level Flatness: Model E7401A, Option 1DN
Figure 2-10 Equipment Setup
Procedure
1. Calibrate the tracking generator by pressing System, Alignments,
Align Now , TG. Connect the RF Out to the Input when prompted.
2. Press
System, Power On/Preset, Preset Type (Factory), Preset on the
analyzer, then wait for the preset routine to finish. Set the analyzer
by pressing the following keys:
FREQUENCY, Center Freq, 50, MHz
CF Step
SPAN
AMPLITUDE
Source,
, 500, MHz
, Zero Span
, More, Y Axis Units, dBm
Amplitude (On), 0, dBm
3. Zero and calibrate the power meter and RF power sensor. Make sure
the power meter is rea ding out in dBm. Enter the power sensor
50 MH z cal factor in t o the po wer meter.
4. Connect the power sensor to the RF Out on the analyzer as shown in
Figure 2-10.
5. Press REL on the power meter . The power meter readout amplitudes
are now relative to the power level at 50 MHz.
6. Set the an alyzer cen t e r fre quency to 100 kHz by pre ssing
FREQUENCY, Center Freq, 100, kHz.
7. Enter the appropriate power sensor Cal Fac tor for the test fr equency
into the power meter as indicated on the label of the power sensor.
8. Re cord the po wer leve l d isplayed on the p ow e r meter as t h e Level
Flatn e ss in Table 2-11.
9. Repeat steps 7 through 8 to mea sure the flatness at each center
frequency setting listed in Table 2-11. The ⇑ may be used to tune to
center frequencies abov e 500 MHz.
100 Chap ter 2
 Loading...