

Page 1

Quick Start Guide
Agilent Technologies
AC Source/ Power Analyzer
Graphical User Interface
for Windows 95-98 and
Windows NT 4.0
Page 2

Contents
Description...........................................................................................................3
System Requirements ...........................................................................................3
Installing and Running the Software.....................................................................4
Configuring the I/O ..............................................................................................4
Performing Basic Operations ...............................................................................5
Printing and Saving Measurement Data ...............................................................7
Sample Tests ........................................................................................................ 8
Inrush Current Measurement............................................................................8
AC Line Dropout..............................................................................................9
AC Line Surge or Sag.....................................................................................10
Telephone Ring Generator.............................................................................11
Using the Transient List Table ...........................................................................12
Creating User-Defined output Waveforms.........................................................12
Generating AM or FM Output Signals...............................................................13
Advanced Controls ............................................................................................. 14
Warranty.............................................................................................................16
2
Page 3

Description
What the
GUI Will
Do
The Agilent AC Source Graphical User Interface (GUI) is an easy
to use soft front panel for the Agilent Technologies 6800-series
AC Power Source/Analyzers. With it, you can:
ñ Control output and measurement functions from a single
screen.
ñ View an oscilloscope-like display of actual output
waveforms.
ñ View the harmonic content of the output waveform.
ñ Easily generate complex output transients and user-defined
waveforms by clicking and dragging the mouse .
ñ View the instrument commands generated by the graphical
user interface.
ñ Operate in either simulation mode (no ac source hardware
required), or in instrument control mode.
What the
GUI Will
Not Do
The Graphical User Interface does not:
ñ Automatically generate test programs
ñ Control instruments other than Agilent a c sources
ñ Provide drivers for other GPIB instruments
ñ Link with the Agilent HFTS software
ñ Operate with Windows 3.1
System Requirements
PC
32-bit
Platforms
Supported
I/O
Supported
Ac Source
Models
ñ 486DX66 minimum (Pentium 100 or better recommended)
ñ 16 Mbytes RAM
ñ 4 Mbytes of disk space
ñ Windows 95 - 98
ñ Windows NT 4.0
ñ Agilent 82340B, 82341C, 82341D, 82335B
1
ñ National AT GPIB/TNT, AT GPIB/TNT PnP (Windows 95)
ñ RS-232
1
The Agilent 82335B is only supported for Windows 95, provided you have
either the E2094F or E2094E I/O library.
ñ Agilent 6811A/B, 6812A/B, 6813A/B, 6814B, 6834B
ñ Agilent 6841A, 6842A, 6843A (in Normal mode only)
3
Page 4
Installing and Running the Software
g
(
y
Automatically searches
NOTE: Before running the Agilent AC Source GUI, you must have installed
and connected your ac source to the pc using the appropriate interface
cable. If you are using a National Instruments GPIB interface, you
must have the appropriate card installed and configured on your pc. If
you are using an Agilent GPIB interface card, you must also have the
appropriate 32-bit SICL library drivers installed on your pc.
1. Place Disk #1 in the A: drive of your computer and run SETUP.EXE.
2. Follow the directions on the screen to install the software. The
README.TXT file contains product updates or corrections that are not
documented in the help file. Use any text editor to open and read this file.
3. To run the Agilent AC Source GUI, click on its desktop icon:
You can also click on the Start button and select:
Programs | Agilent AC Source | AC Source GUI.
Configuring the I/O
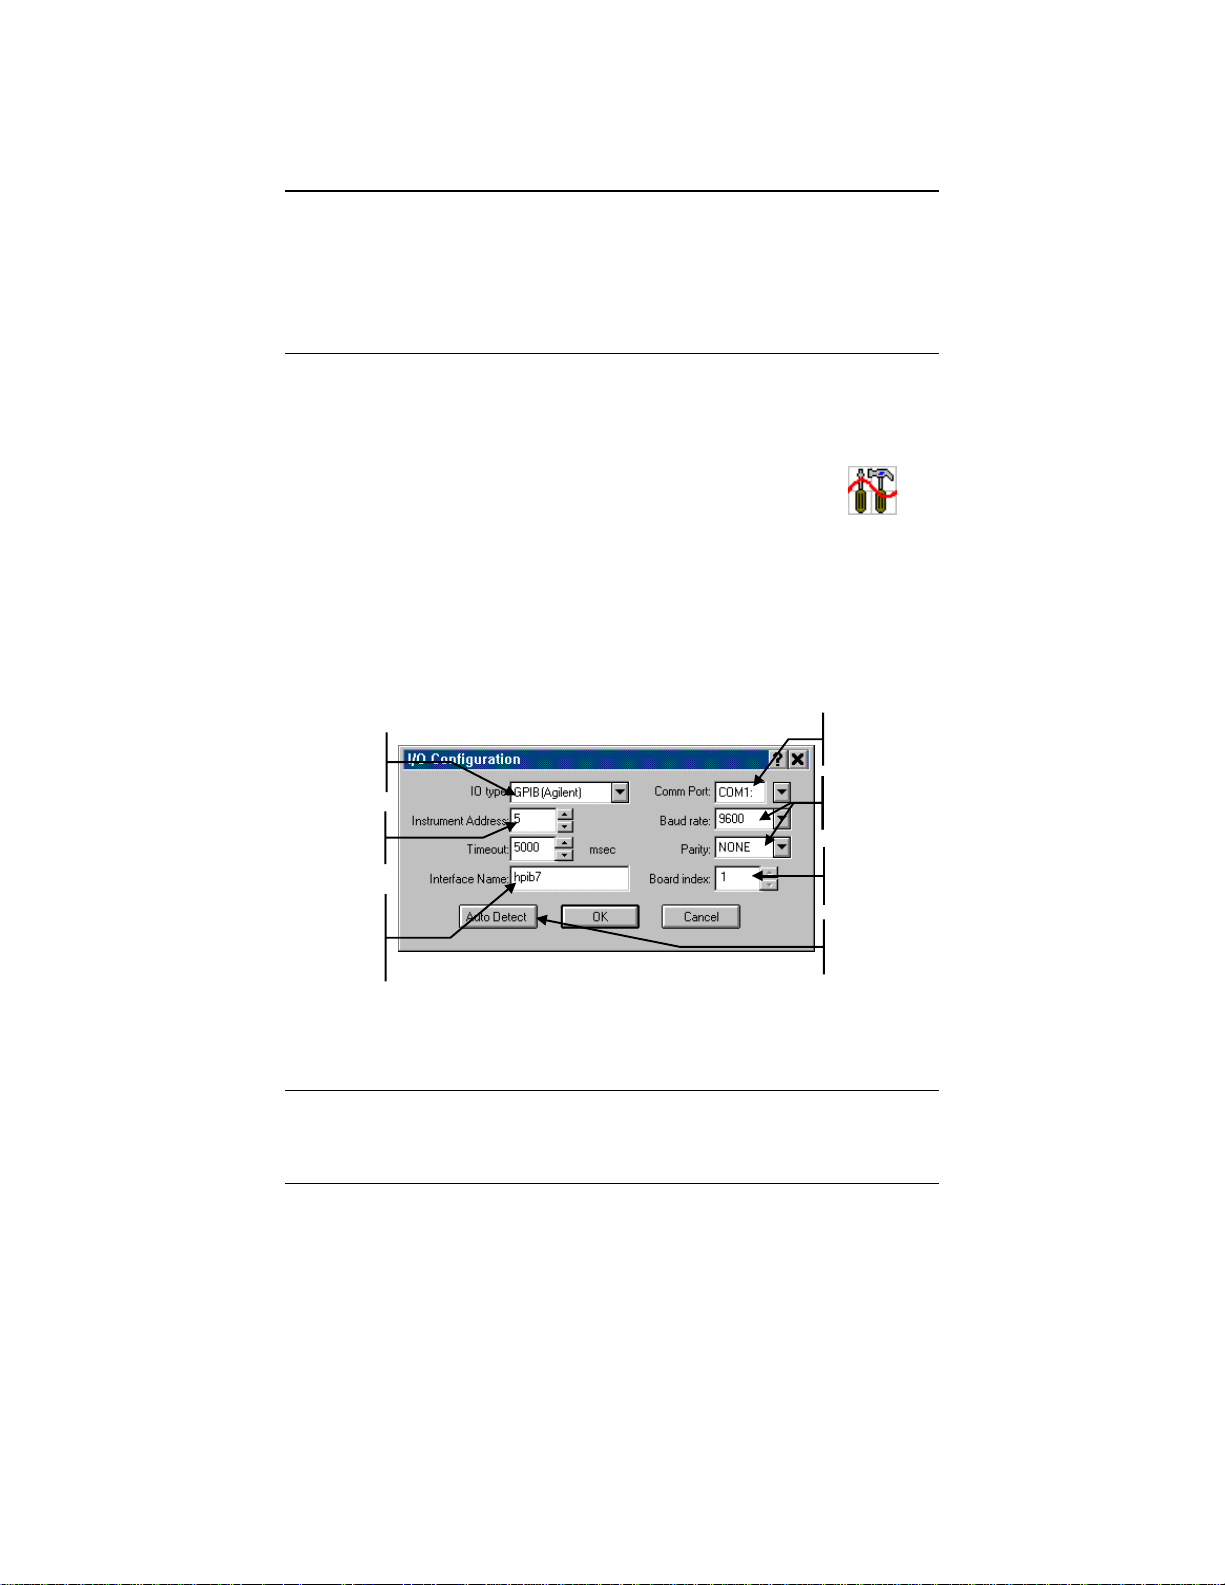
To configure the I/O, select the I/O Configuration command in the Edit menu.
This step is necessary to establish communication with the ac source. The I/O
configuration screen comes up automatically when you turn Simulation mode off
in the Source menu. Note that operating the ac source over a serial port is much
slower than GPIB operation.
Select I/O type.
(GPIB, serial port, or
simulation mode)
Address must match
Agilent GPIB cards
SICL name used in
setting of
instrument.
only. Must match
interface card’s
confi
GPIB
uration.
If there seems to be no communication between the Agilent AC Source GUI and
the ac source, select Auto Detect to detect any ac sources connected to your pc.
Also try resetting the I/O interface by clicking the red reset button. This also
resets the ac source to its default settings.
RS-232 only.
Specifies the com
port on the pc.
RS-232 only. Ac source
must match Baud rate
and Parit
National cards only.
Specifies board
index. (1 = GPIB1)
all interfaces for ac
sources.
settings.
NOTE: If you program the ac source from the front panel of the unit, you will
need to refresh or update the Agilent AC Source GUI. Go to the
Source menu and select the Refresh Instrument State command.
4
Page 5
Performing Basic Operations
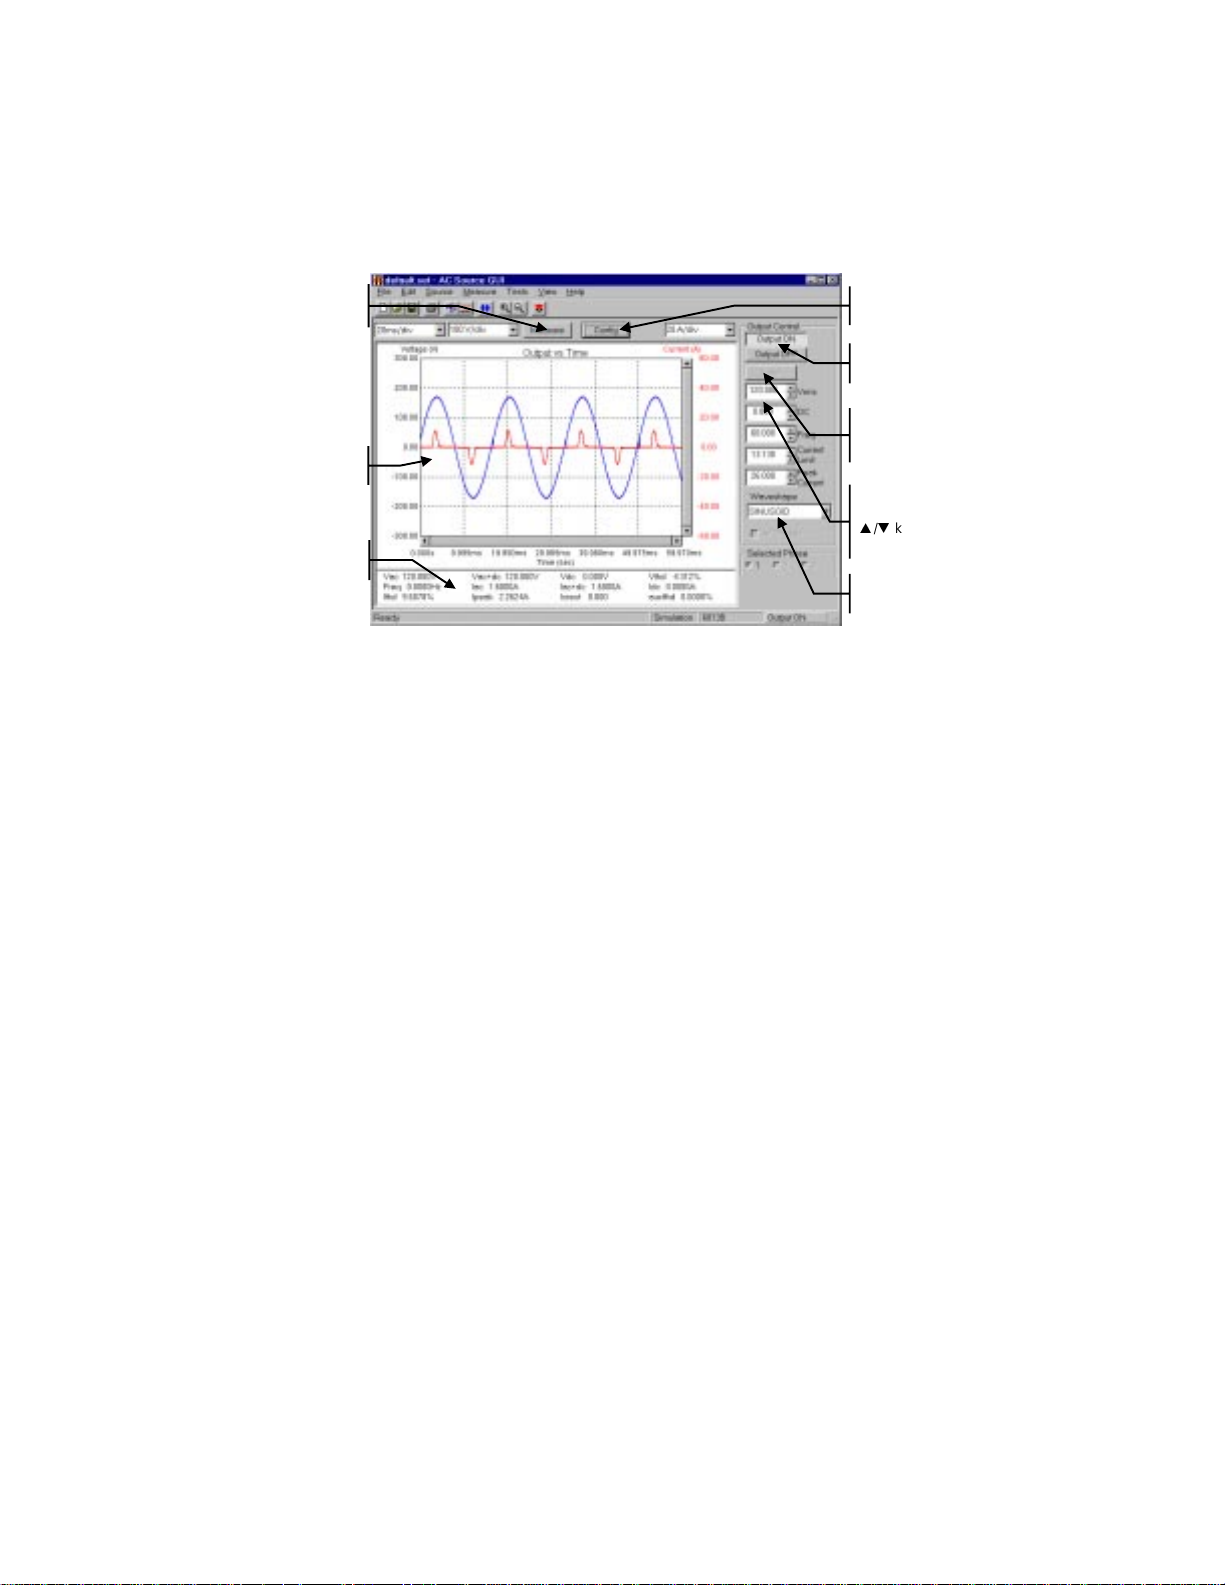
The Main window appears when you first run the Agilent AC Source GUI. From
this window you can control the output of the ac source as well as view all output
measurements.
Click to start
a
Waveform
display area.
Measurement
summary
Click to configure
measurements.
Turn on the ac
source output.
Click Enter to
apply all values
to the output.
Set the output
to 120Vac. Use
p/q
keyboard entry.
Select an
output
To access an existing configuration,
ñ Click File, Open Configuration in the menu. Configur ation files contain
Agilent AC Source GUI settings but not actual ac source instrument settings.
ñ Select the desired file (files have an *.set extension) and click Open.
ñ To create a new configuration, click File, New Configuration. This action
clears the present configuration, resets the ac source instrument to its default
values, and sets the I/O to simulation mode.
keys or
To program the output of the ac source,
ñ Under Output Control, program the output rms voltage, dc offset voltage,
frequency, rms current limit, and peak current limit. You can either type in
the values directly, or use the up/down arrows to adjust the present value. If
you type in the values, you mst press the Enter button.
ñ For 3-phase ac sources, select the Phase that you want to control. You can
couple or control All phases simultaneously, or control each phase
individually.
ñ Select a waveshape from the Waveshape list box - either Sinewave,
Squarewave, or Clipp ed sinewave. For clipped sinewave s, you can specify
the clipping level in percent of amplitude, or in percent of total harmonic
distortion.
5
Page 6
ñ Select Output On to enable the output of the unit. Select Output Off to
harmonic graph axes
turn the output off. Note that the selected waveshape will not appear on the
Main window unless you click the Measure button.
To view output measurements,
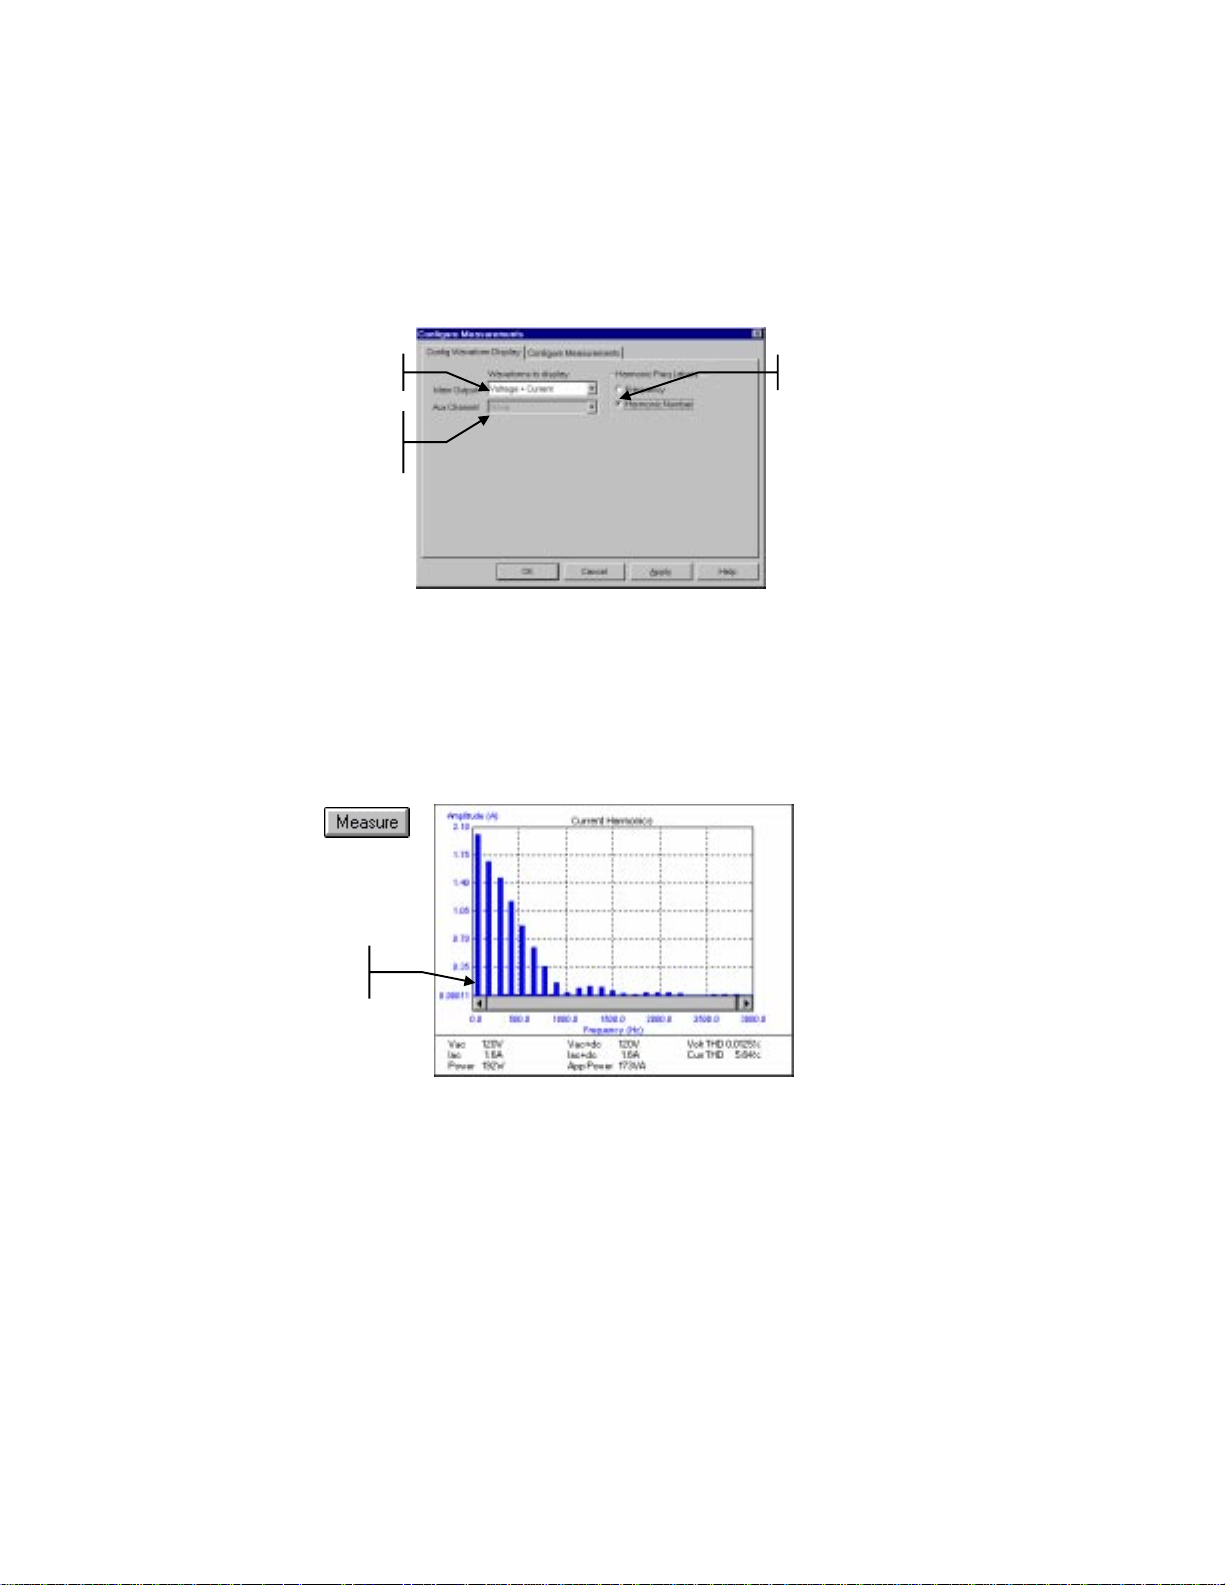
ñ Select the Config Measurements command in the Measure menu. Select
the Configure Waveform Display folder.
Specify type of
measurement.
Only applies to
units with the AUX
channel option.
Select units for
ñ To view voltage or current measurements, select Voltage, Current, or
Voltage + Current in the Waveform to Display dropdown list.
ñ To view harmonic measurements, select a harmonic display functions.
ñ Click the Measure button to make an output measurement. The following
figure shows a sample voltage harmonics measurement. Note that for 3phase ac sources, you can only measure one phase at a time. Only the
measurement of the selected phase is returned.
Click
Displays the
specified
harmonics.
To save the configuration settings,
ñ Click File, Save Config in the menu.
ñ Enter a filename (setup files have an .set extension) and click Save.
Note that Output Control settings are NOT saved in the setup file.
6
Page 7
Printing and Saving Measurement Data
g
waveform data logging.
g
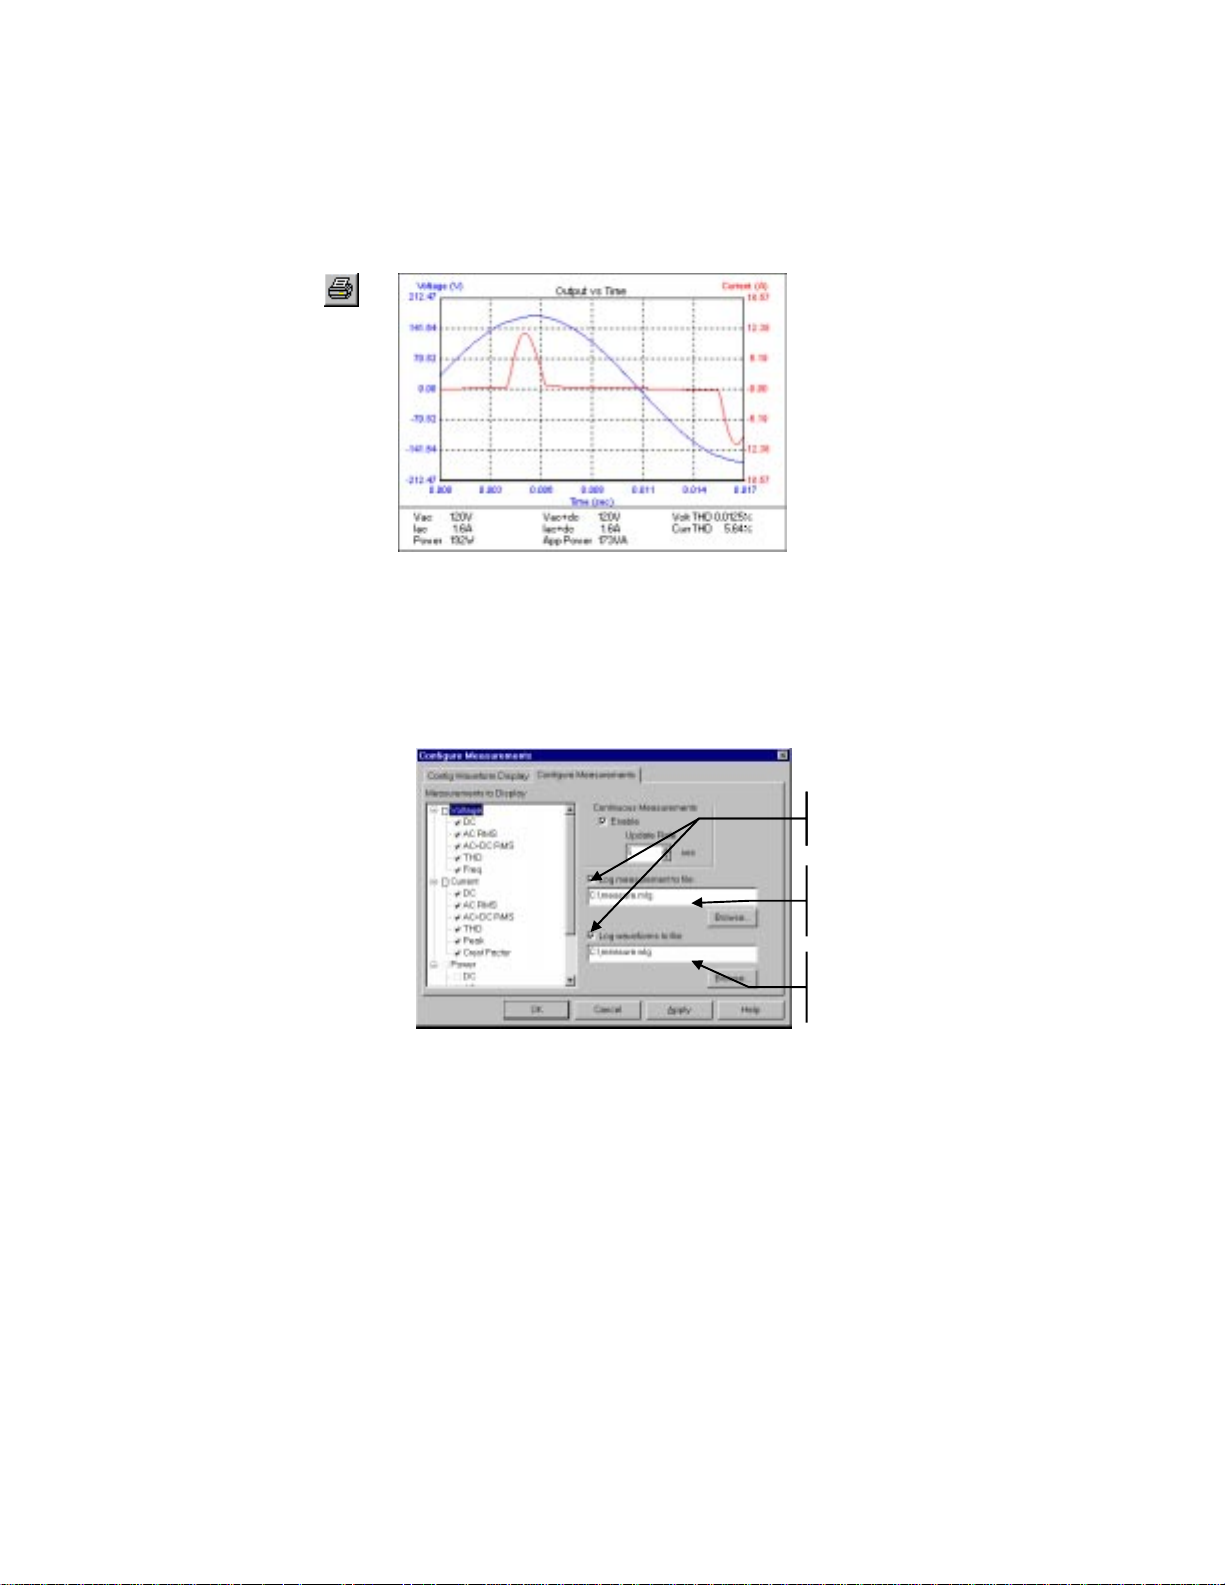
To print the measurement screen, click on either the Print icon or select the
Print command in the File menu. You can preview and print the Main window
only. The following is a sample preview/print of the Main window:
Click
To save the waveform that appears in the display, select Save Waveform in the
File menu. This saves the displayed waveform as an ASCII file, which can be
easily imported into other application programs.
To log measurement or waveform data to an ASCII text file, select the Config
Measurements command in the Measure menu. Select the Configure
Measurements folder. Check the appropriate Log to file box and provide a name
for the data file. Data will be logged whenever an output measurement is made.
Check to enable
measurement or
Specify a
measurement data
filename (file
extension = *.ml
Specify a
waveform data
filename (file
extension = *.wl
The measurement data file saves measurements in a comma-separated table of
values. The columns in the list correspond to all available measurements, with
blanks for non-measured values. For 3-phase units, only information from the
selected phase will be saved.
The waveform data file saves measurements in a 3-column format. The columns
are Time, Voltage and Current. Harmonics are not saved.
7
).
).
Page 8
Sample Tests
adjust a
ude.)
gg
Several sample tests are provided with the Agilent AC Source Graphical User
Interface. These pre-defined tests help you quickly perform some common ac
source applications.
Inrush Current Measurement
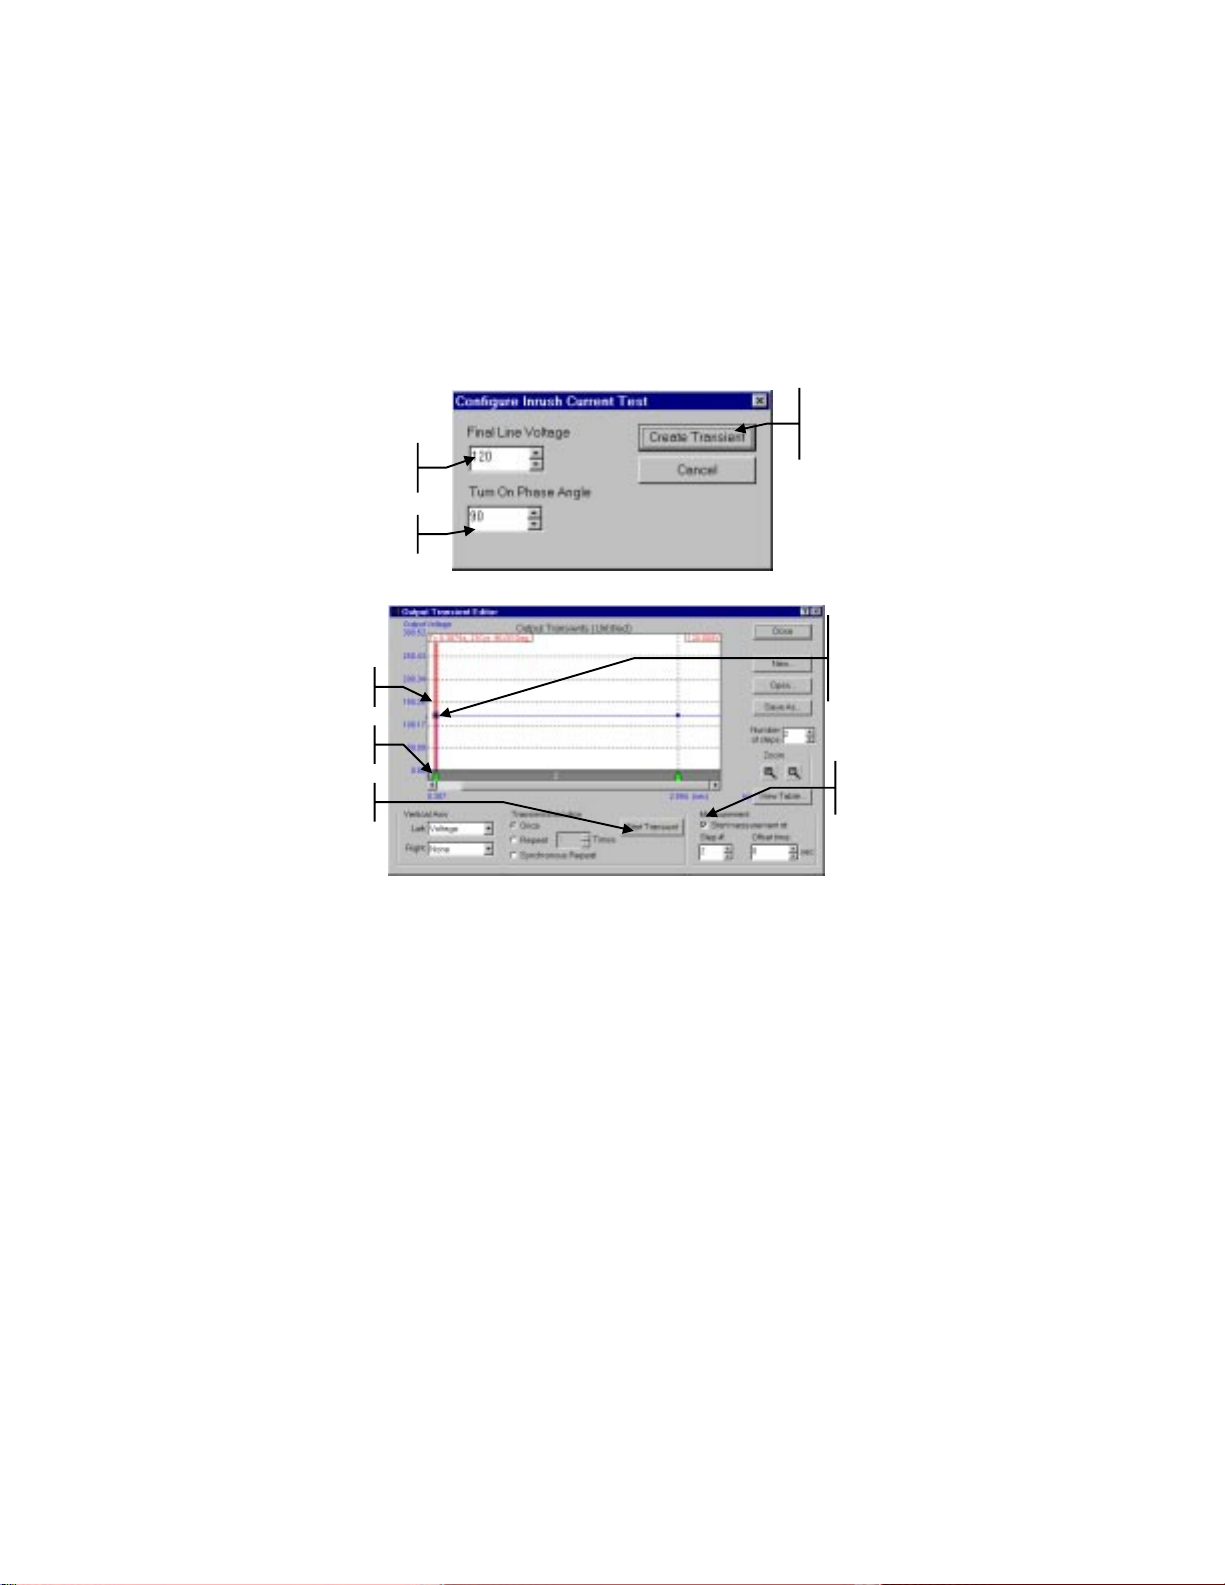
To perform an inrush current measurement, select Inrush Current in the Tests
menu. The test uses the parameters that you enter in the following dialog box.
This box is displayed on the screen when the test is first selected.
Click here to continue.
This displays the
Output Transient
Enter a Final
Line Voltage
Enter a turn-on
phase angle.
Editor. (see below)
Output goes to
120 Vac @ 90
phase angle.
Start of output
measurement
Output voltage
starts at 0 Vac.
Click to start
sample test.
(Drag point to
Check to enable
measurement
tri
er.
You can use the transient editor to make any final adjustments to the inrush
current measurment such as fine tuning the width of the transient step, or
positioning and enabling the measurement trigger.
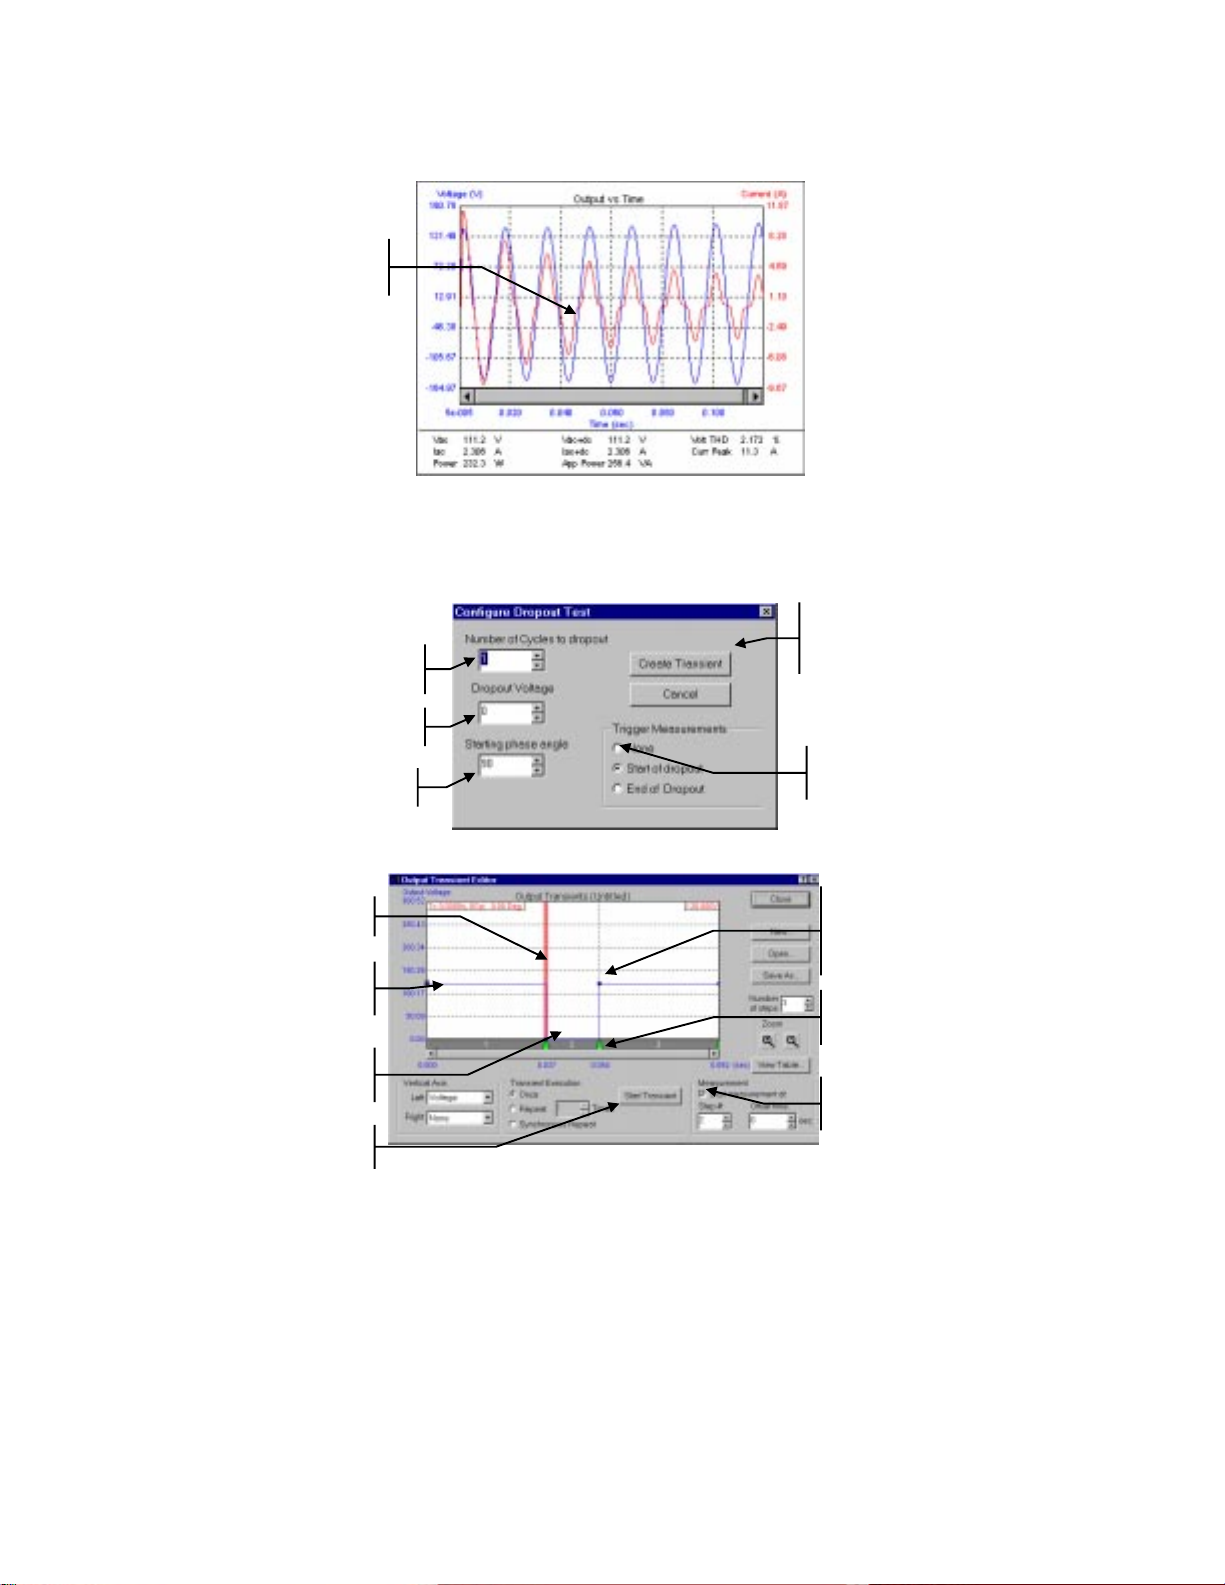
When measurements are enabled, you can view the inrush measurement in the
Main window. If necessary, move the Transient editor out of the way to see the
Main window. The following figure shows a sample inrush curent measurement.
°
mplit
8
Page 9
gg
gg
View the
inrush
current.
AC Line Dropout
To perform an ac line dropout, select Dropout in the Tests menu. The test uses
the parameters that you enter in the following dialog box. This box is displayed
on the screen when the test is first selected.
Click here to continue.
This displays the
Enter the number of
dropout cycles
Enter the dropout
voltage value
Enter a starting
phase angle.
Output Transient
Editor.
Check to enable
measurement
tri
er.
Start of output
measurement
Step #1,
output voltage
@ 120 Vac.
Step #2, output
voltage @ 0 Vac
for one cycle.
Click to start
sample test.
Step #3, output
voltage returns to
120 Vac.
(Drag point to adjust
amplitude .)
Drag pointer to
adjust width of
dropout.
Check to enable
measurement
tri
er.
9
Page 10
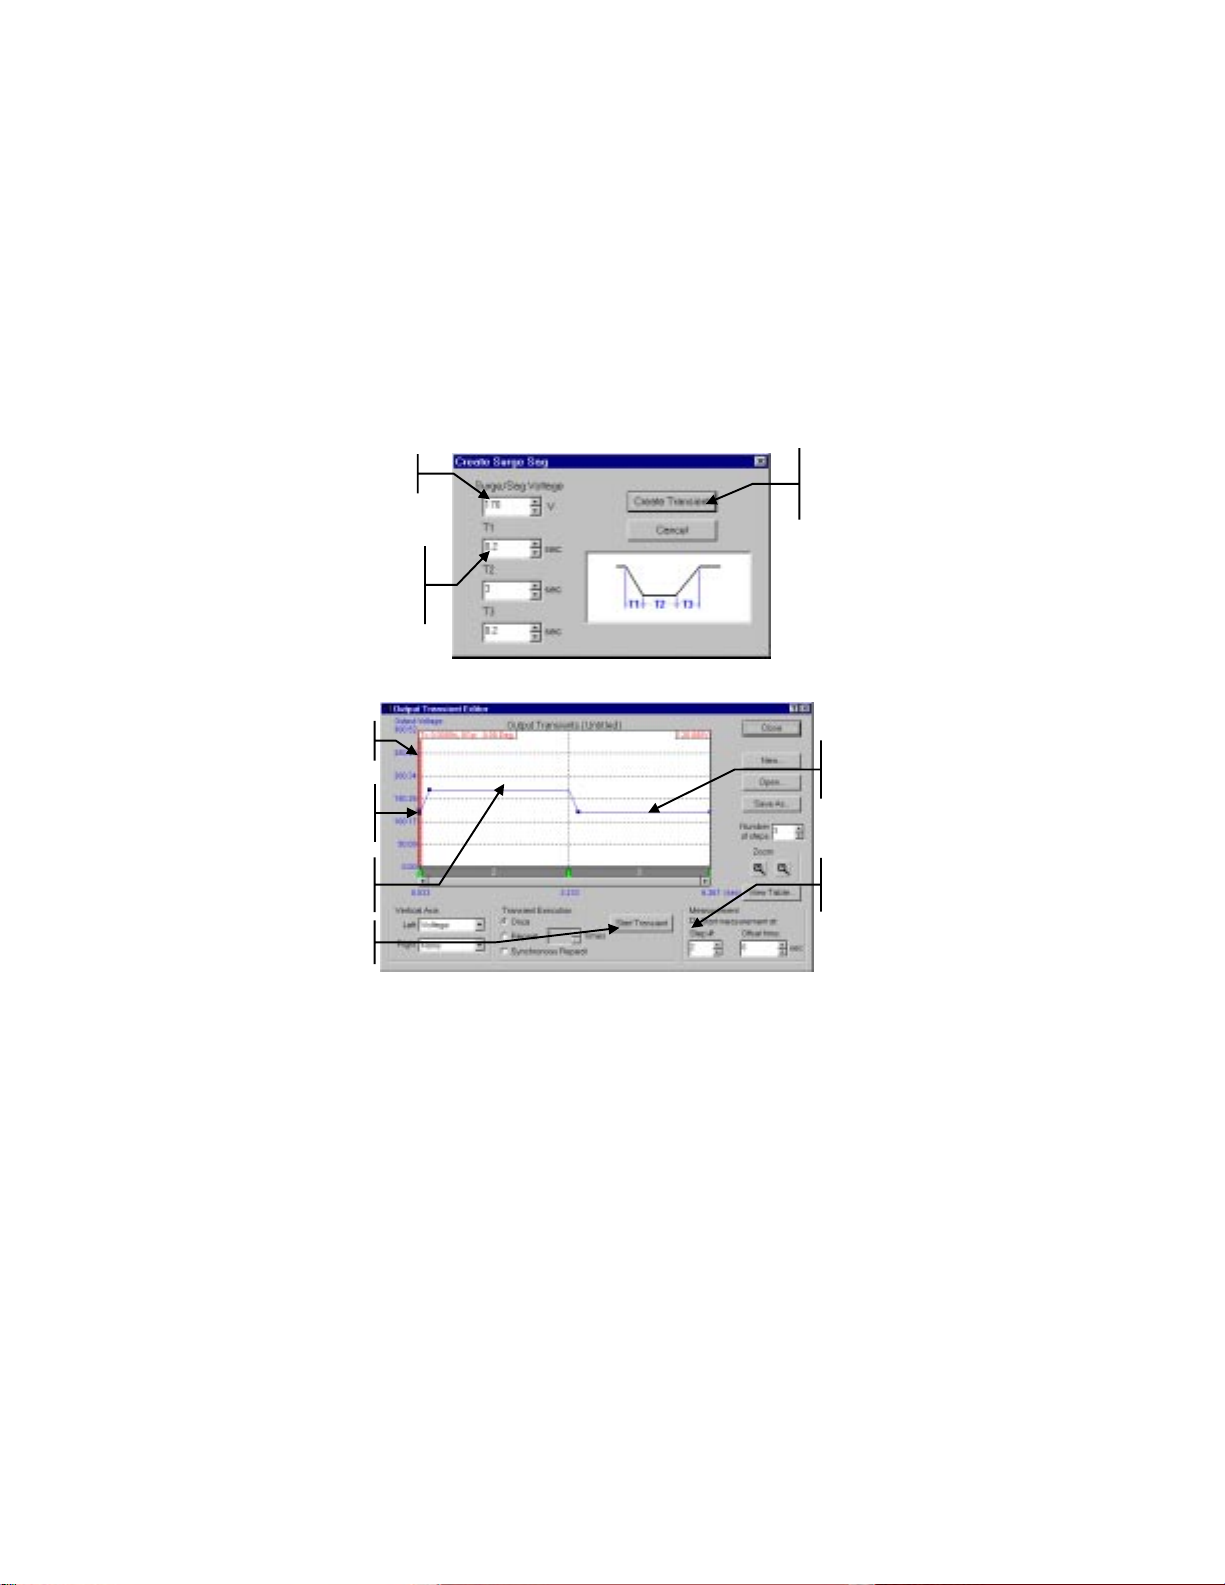
You can use the transient editor to make any final adjustments to the ac line
gg
dropout test such as fine tuning the width of the dropout, or positioning and
enabling the measurement trigger.
When measurements are enabled, you can view the line dropout measurement in
the Main window. If necessary, move the Transient editor out of the way to see
the Main window.
AC Line Surge or Sag
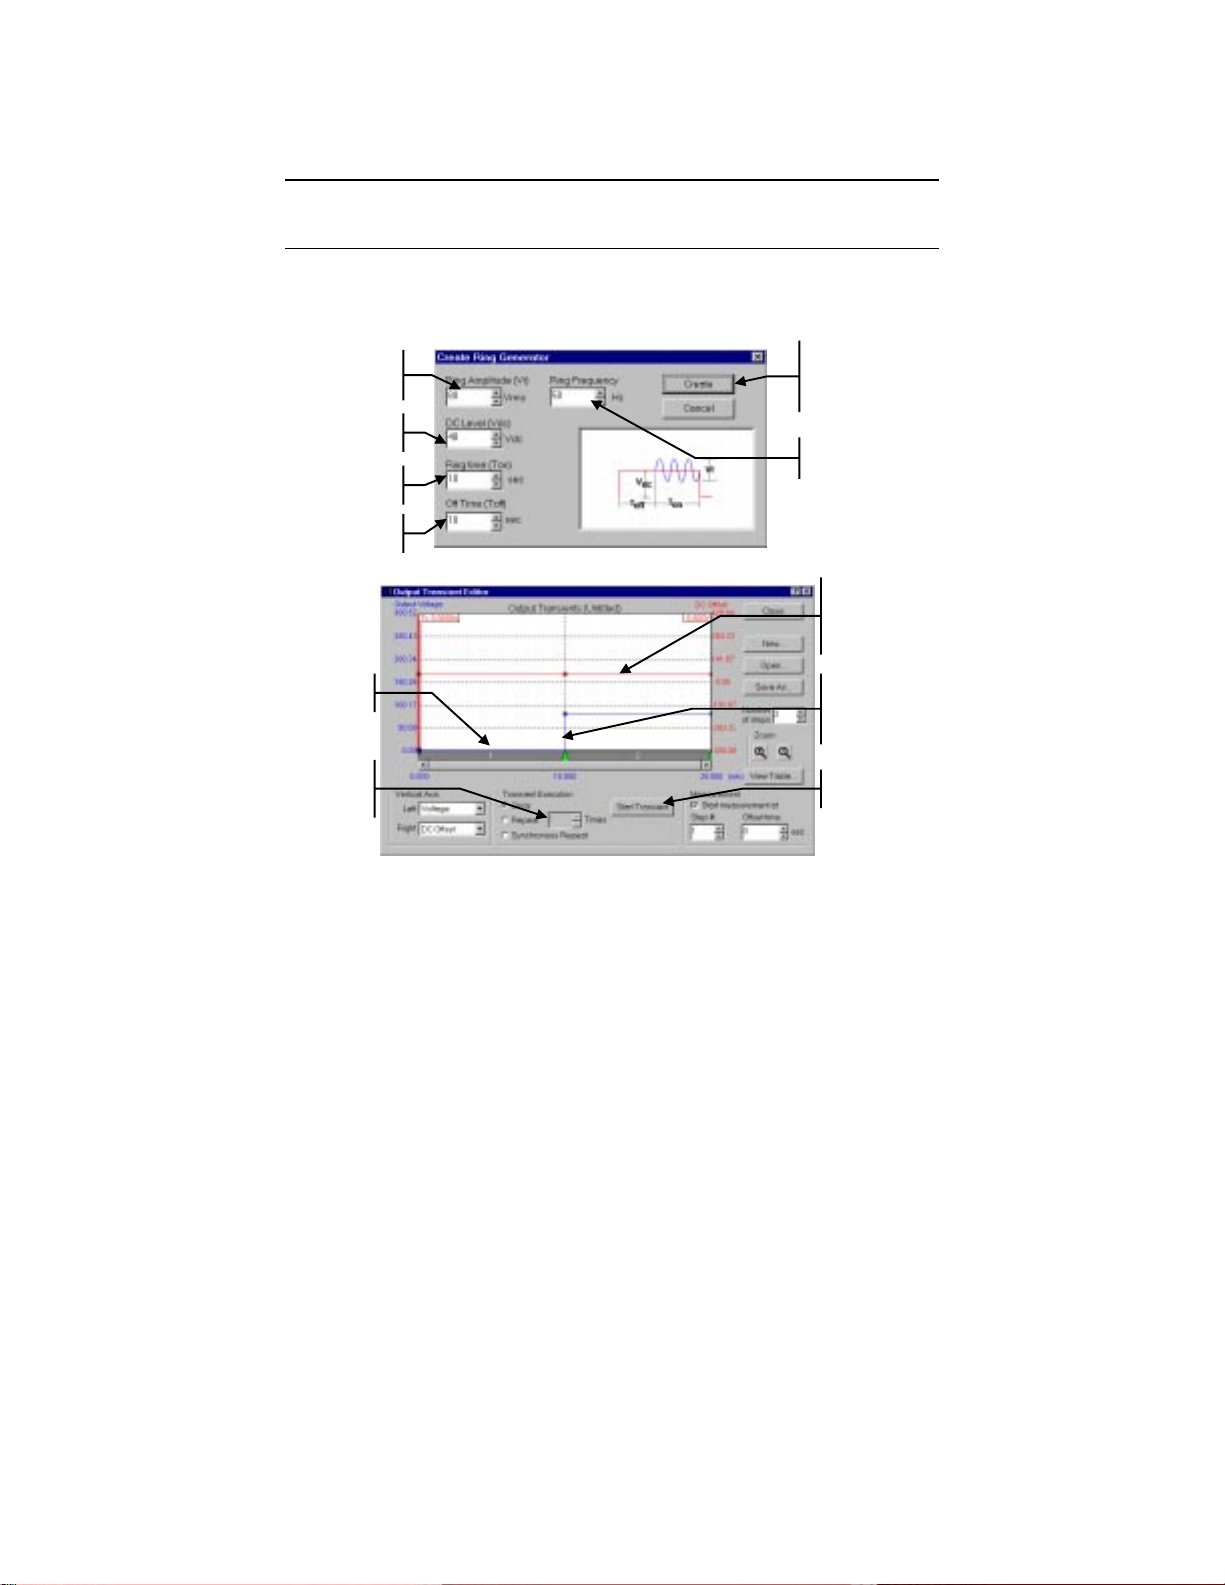
To perform an ac line surge/sag, select Surge/Sag in the Tests menu. The test
uses the parameters that you enter in the following dialog box. This box is
displayed on the screen when the test is first selected.
Enter a Surge/Sa g
Voltage value
Enter T1 value.
Also enter T2 and
T3 values in the
appropriate fields.
Start of output
measurement
Output voltage
set to 120 Vac
at step #1.
Click here to continue.
This displays the
Output Transient
Editor. (see below)
Output voltage
returns to 120 Vac
at step #3.
Output voltage
surges to 170
Vac at step #2.
Click to start
sample test.
Check to enable
measurement
tri
er.
You can use the transient editor to make any final adjustments to the ac line
surge/sag test such as fine tuning the slew rates of the surge or sag, or
positioning and enabling the measurement trigger.
When measurement are enabled, you can view the line surge/sag measurement in
the Main window. If necessary, move the Transient editor out of the way to see
the Main window.
10
Page 11
Telephone Ring Generator
)
CAUTION: This test is only designed to test telephone ringer circuits. Do not
use this test to power any device that requires ac input power.
The telephone ring generator produces an output signal to test telephone ringers.
The test uses the parameters that appear in the dialog box that is displayed on the
screen when the test is first selected.
Enter the ring
amplitude in rms
Enter the dc level
of the waveform
Enter a ringer on-
time value.
Enter a ringer off-
time value.
Click here to continue.
This displays the
Output Transient
Editor. (see below)
Enter a ringer
frequency.
DC offset set to
80 V (Drag
point to adjust
amplitude.)
Ringer off-
time level.
Repeat the
number of
rings.
Start of step #2.
(Drag pointer to
adjust width of
step.
Click to start
sample test.
You can use the transient editor to make any final adjustments to the telephone
ringer waveform such as fine tuning the dc level of the waveform. Note that the
transient editor only displays the rms-portion of the telephone ringer; it does not
display the actual waveform.
When measurements are enabled, you can view the ringer waveform in the Main
window. If necessary, move the Transient editor out of the way to see the Main
window.
11
Page 12
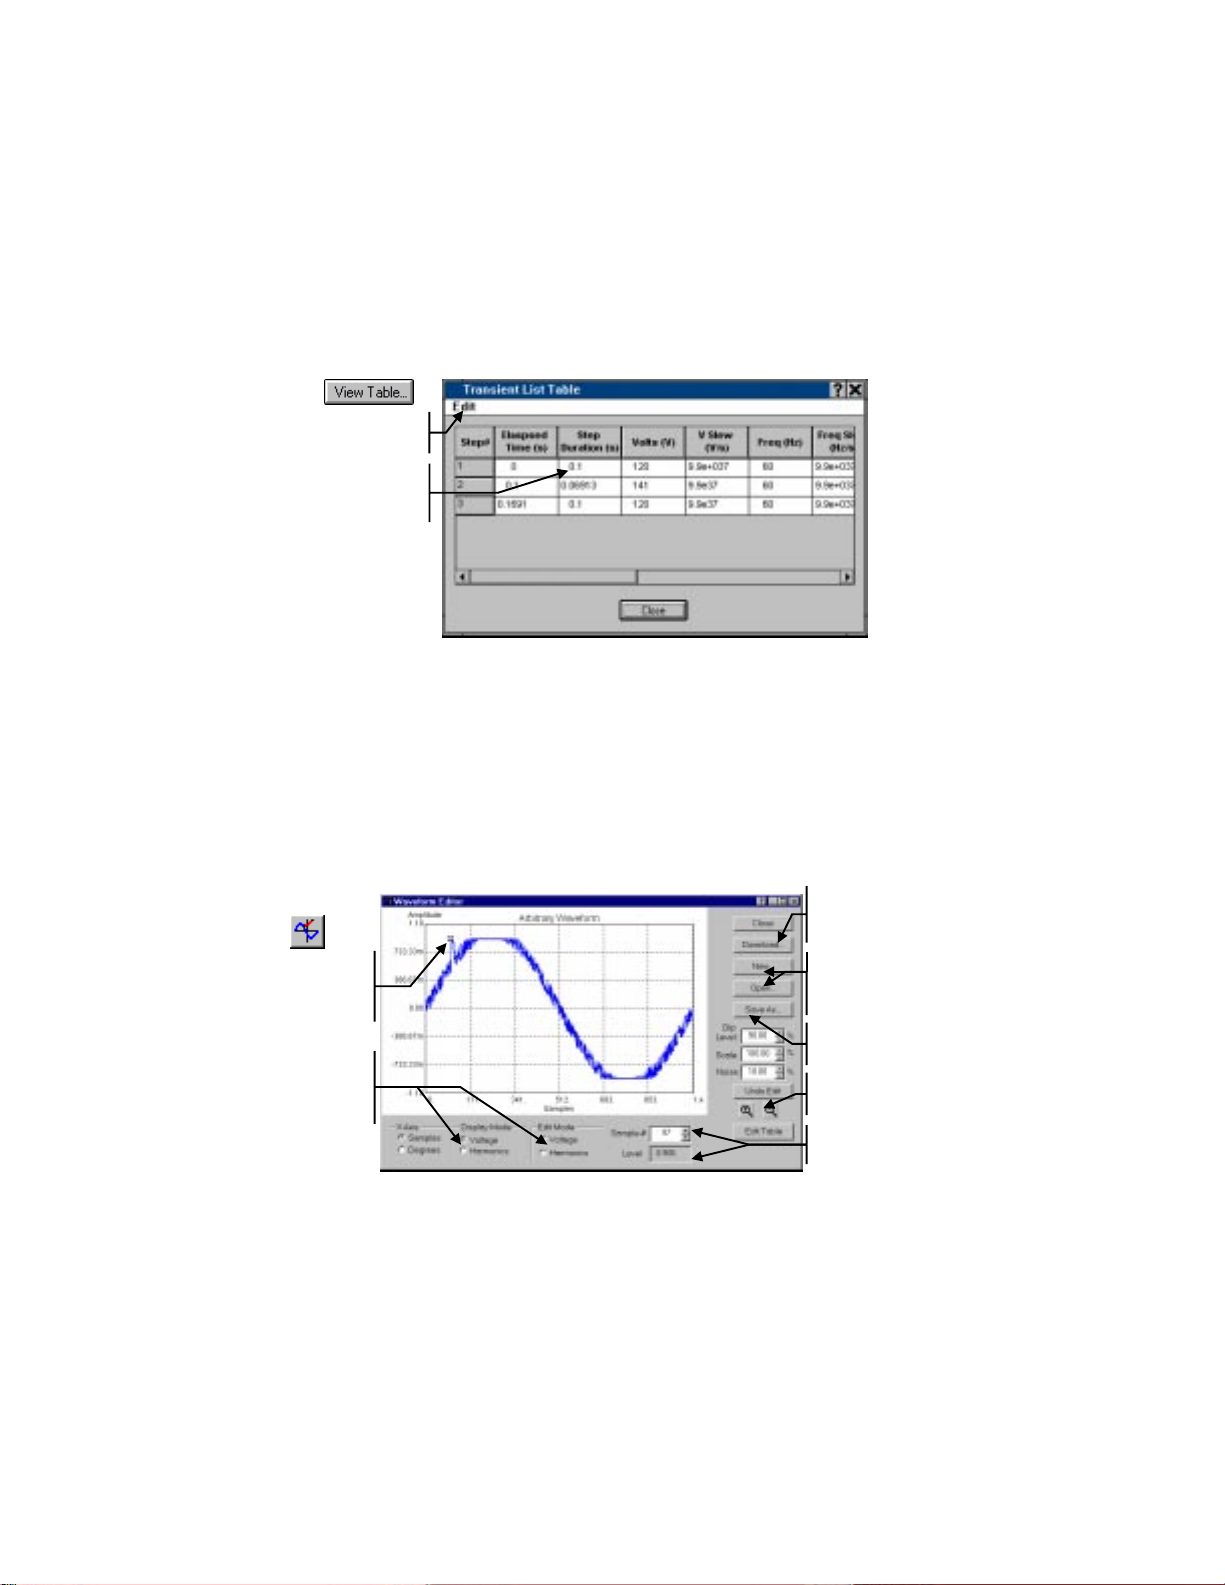
Editing With the Transient List Table
y
The previous four sample tests introduced you to using the click and drag editing
features of the Transient Editor.
A more precise method of creating and editing transients is available by using
the Transient List table. Click the View Table button in the Output Transient
editor. The Transient List table is simply another view of the transient editor.
The values in the table correspond exactly to the corresponding transient graph.
The following table shows the values for the sample Surge/Sag test.
Click
Menu commands
to simplify editing.
Select and edit
individual values
in each cell.
Creating User-Defined Output Waveforms
To create user-defined voltage waveforms, select either the waveform icon or
the Arbitrary Waveforms command in the Source menu. This window lets you
edit basic waveform shapes to create a user-defined arbitrary waveform.
Waveforms can be edited in either waveform or harmonic format. To create or
edit a waveform, the Display Mode must match the Edit Mode. Download the
completed waveform to the ac source. To output the downloaded waveform,
you must select it in the Waveshape box of the Main window.
Click
Drag
waveform
points to edit
the shape.
Edit Mode must
match Displa
Mode to edit the
waveform.
Download the
waveform to the ac
source.
Select New or
Open to edit a
waveform
Save the waveform
as an ASCII file.
Select to zoom the
display in or out.
Indicates the
of the active point.
12
Page 13
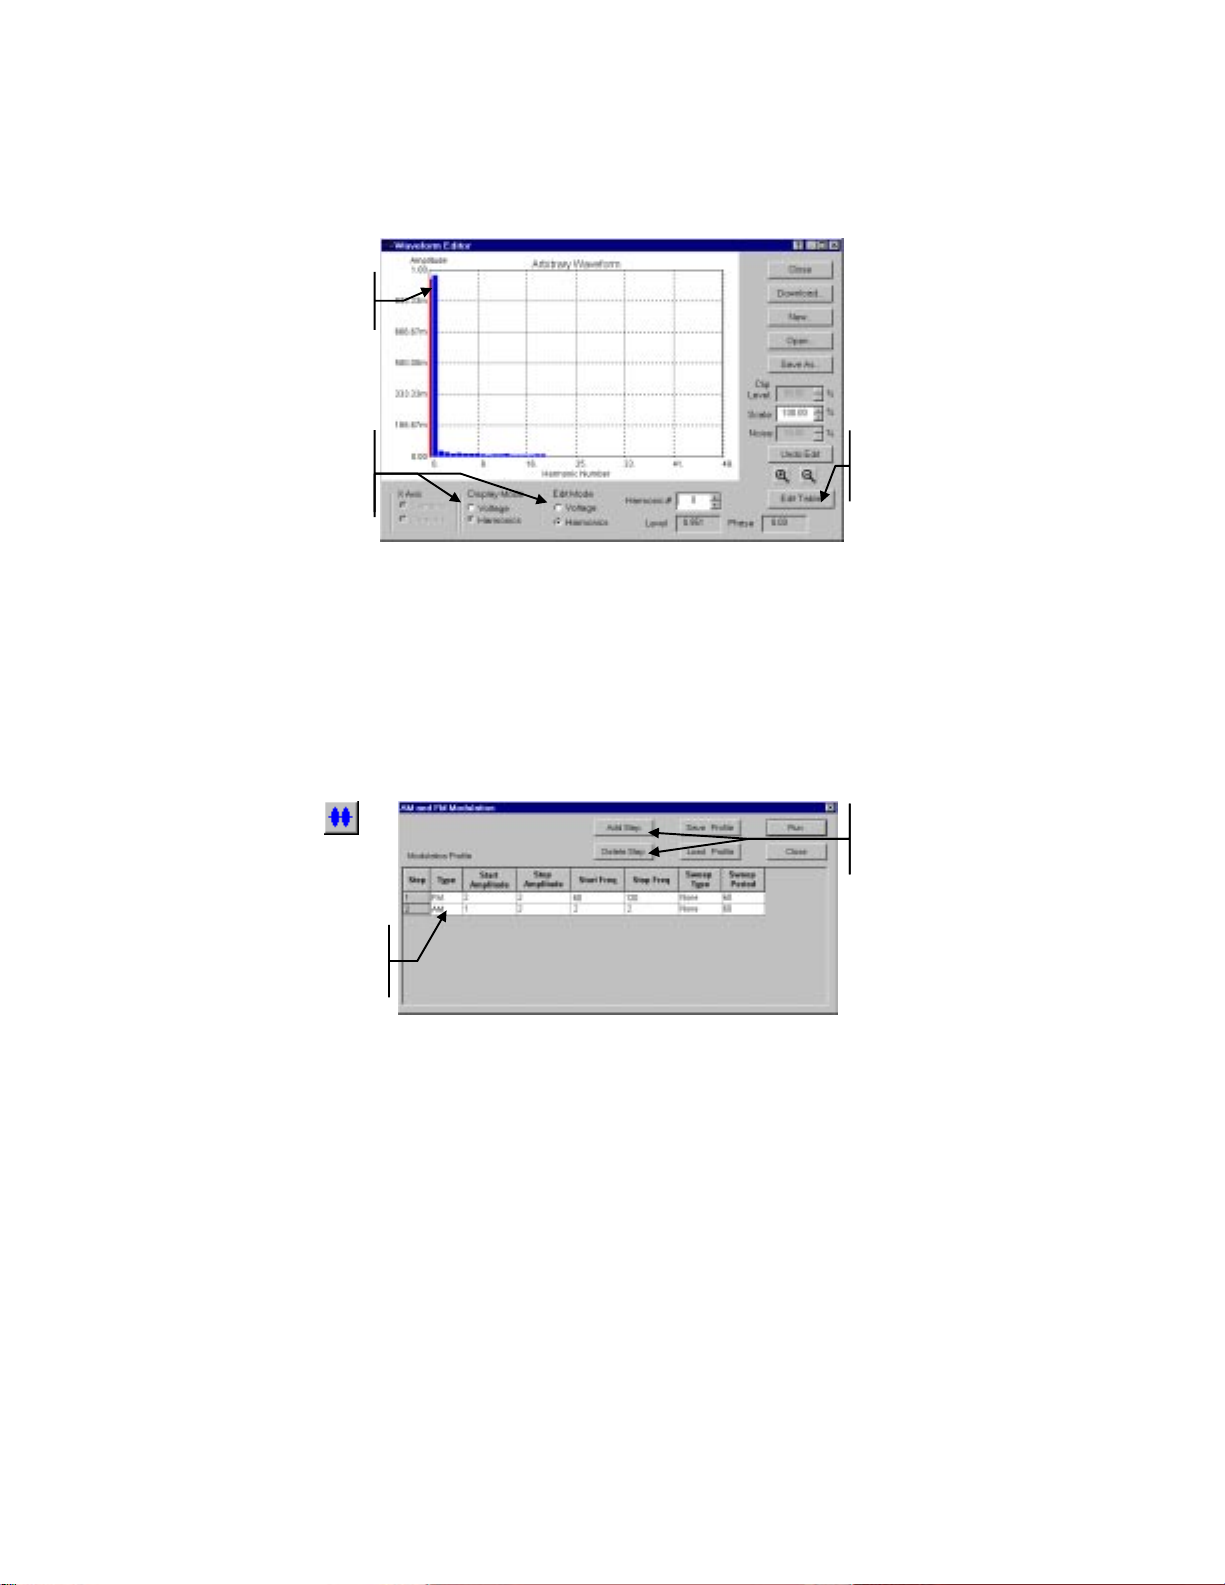
To create or edit waveforms in the harmonic format, set the Edit Mode and the
Display Mode to Harmonics. Note that continually switching edit modes will
result in cumulative waveform truncation errors. Therefore, select only one edit
mode to work in. Switching display modes does not cause recalculation errors.
Drag harmonic
to change the
amplitude.
Edit Mode must
match Display
Mode to edit the
waveform.
Lets you edit
individual
waveform
data points.
Generating AM or FM Output Signals
AM or FM ouput signals can be precisely generated using the AM amd FM
Modulation table. Either click the Modulation icon, or select the Modulat ion
command in the Source menu.
AM or FM output waveforms consist of a carrier signal (the fundamental) and a
modulation signal. The voltage and frequency of the carrier signal is defined in
the Output Control section of the Main window. Only the modulation signal is
defined in this dialog box.
Click
Enter
parameters for
modulation
signal.
Lets you edit
# of steps in
modulation
profile.
Modulation signals are comprised of from one to 20 individually programmed
steps that may be combined into a modulation sequence and then run. Each step
programs the modulation signal for the duration of the step. The amplitude and
frequency of the modulation signal may be constant, swept linearly, or swept
logarithmically from the starting value to a stop value. The sweep period is
programmed in seconds.
13
Page 14
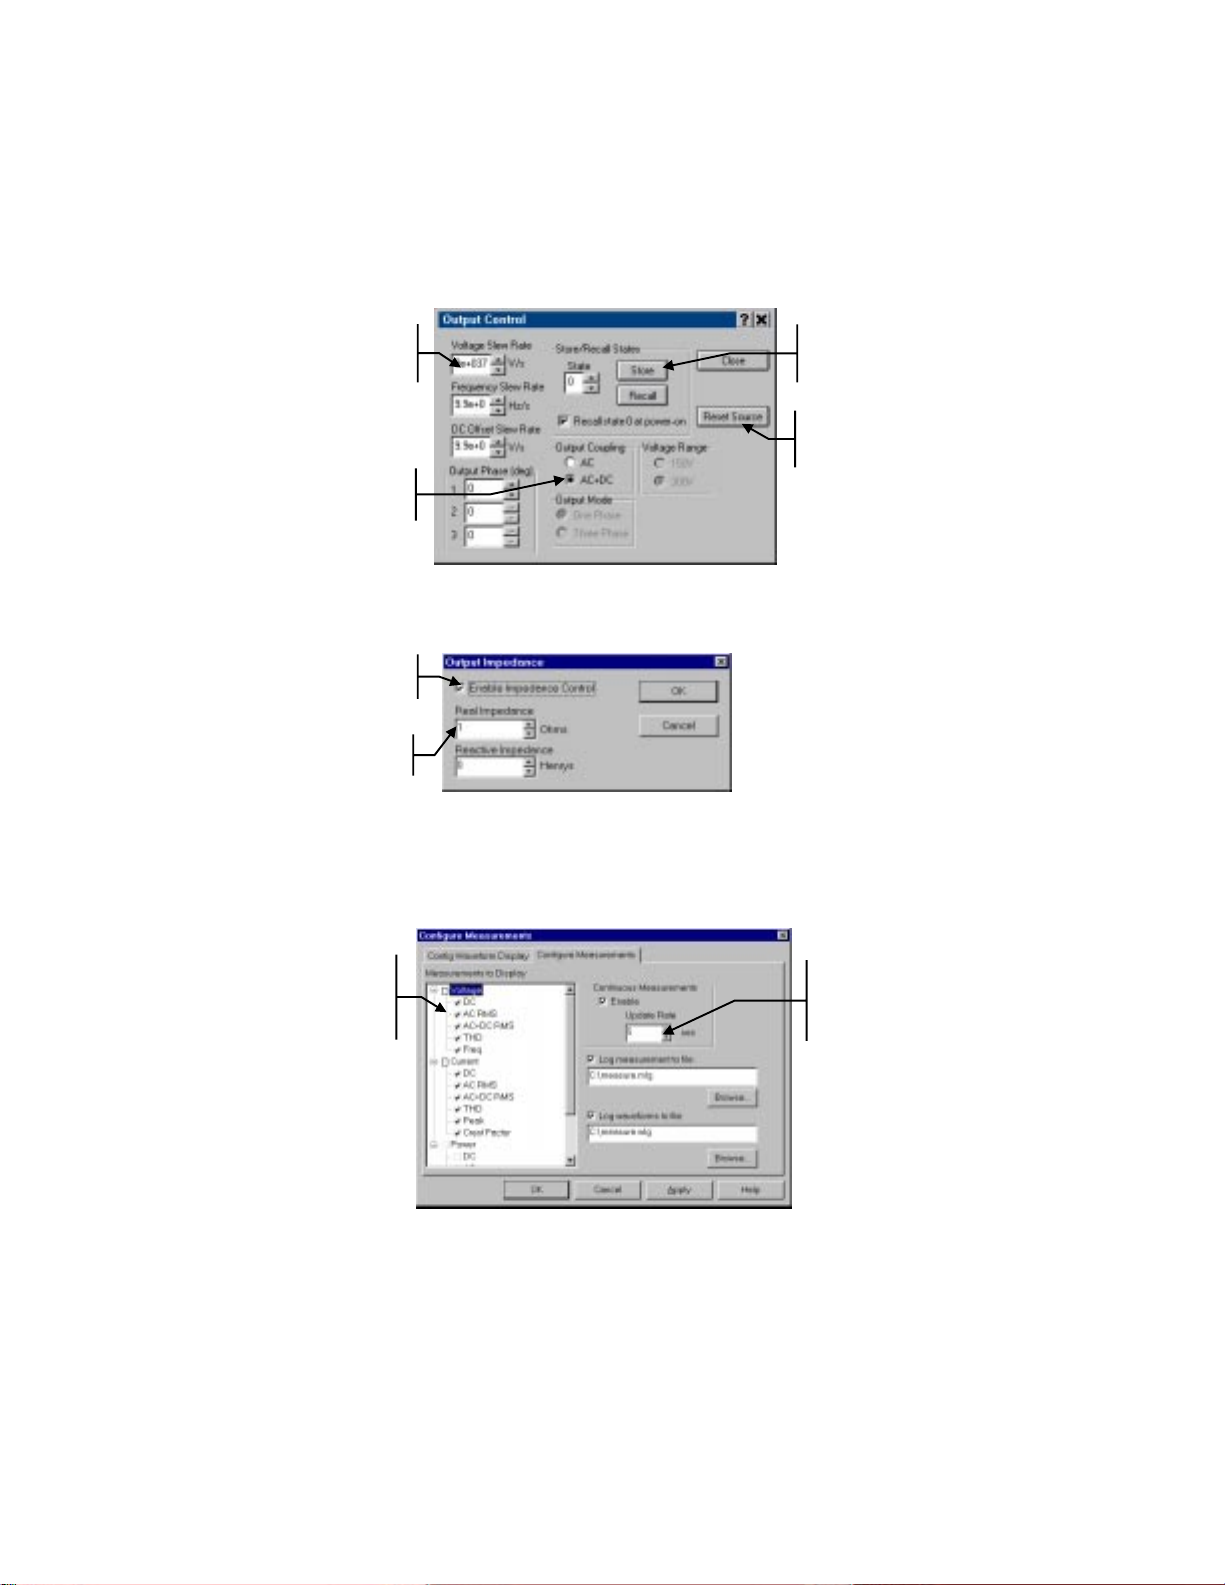
Advanced Controls
Applies to waveforms and
To access the less frequently used output controls, select the Output Control
command in the Source menu. These output controls include slew rate settings,
relative-phase on 3-phase units, output coupling, voltage range, and save/recall
states.
Specify output
voltage, frequency, or
dc offset slew rates.
Select AC+DC to
dc-couple the
output.
Save or Recall
instrument states in
non-volatile memory
Resets the ac
source to its poweron state.
To program Output impedance, select the Impedance command in the Source
menu.You can program real or reactive impedance. These controls are not
available on all ac source models.
Enable ouput
impedance control
Enter impedance
values
To configure output measurements, select the Config Measurements command
in the Measure menu. Then select the Configure Measurements folder. You can
select what measurements appear in the measurement summary area and how
often the summary measurements are updated. You can also configure
measurement and waveform logging, as previously discussed.
Check which
summary
measurements to
display on the Main
window.
Specifies the time
between measurements.
summary measurements.
14
Page 15
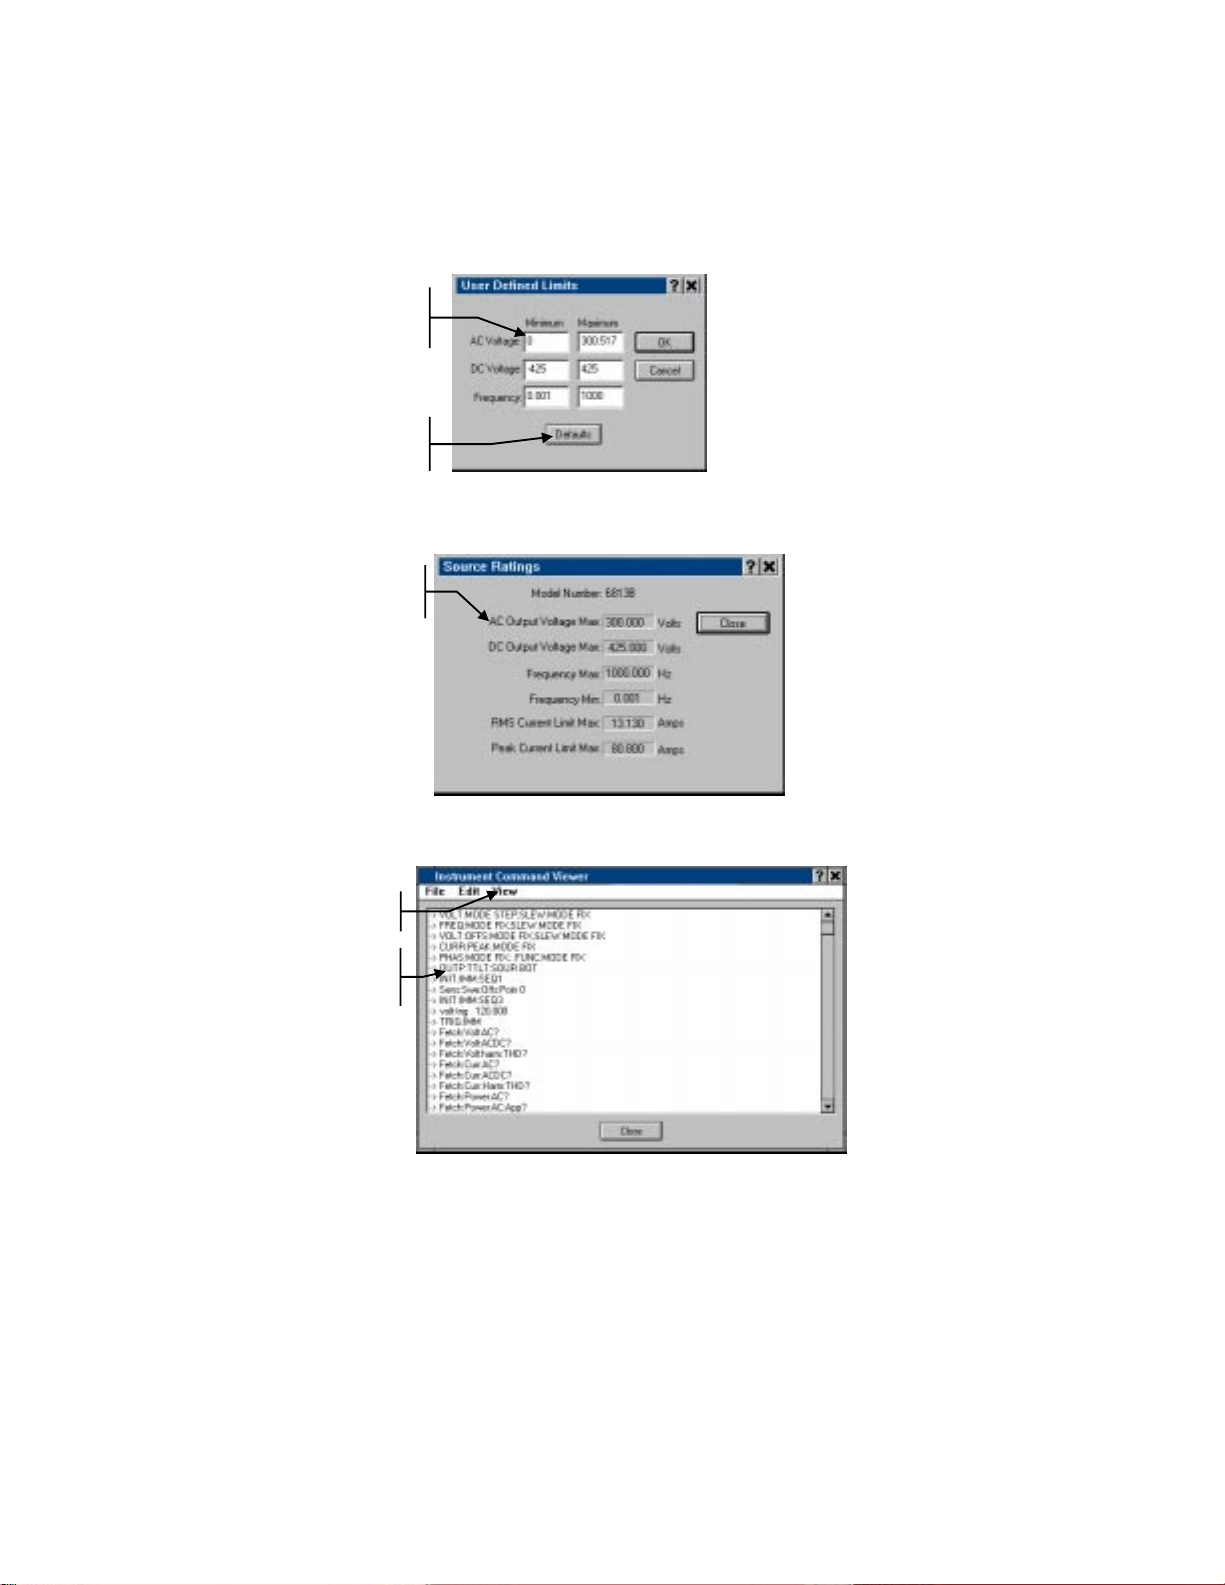
To program minimum and maximum user-defined limits for critical ac source
g
parameters, select the User Defined Limits command in the Source menu. The
controls in this dialog box can be used to prevent a user from accidentally
programming dangero us voltage or frequency values in the Main window.
Enter min imum and
maximum user-
defined limit values.
Resets the limits to
the hardware default
values.
To display the maximum programmable values for the ac source that is presently
being controlled by the Agilent AC Source GUI, select the Ratings command in
the Source menu.
Displays maximum
programmable
settin
s of ac source.
To view the SCPI instrument commands sent to the ac source, select
Instrument Commands in the View menu.
Select command
viewing options.
View the
programming
commands.
15
Page 16

Warranty
This Agilent Technologies software product is warranted against defects in materials and
workmanship for a period of 90 days from date of delivery. During the warranty period,
Agilent Technologies will, at its option either repair or replace parts which prove to be
defective.
Agilent Technologies makes no express or implied warranty of any kind, including, but
not limited to the implied warranties of merchantability or fitness for a particular
purpose, with regard to the program material contained herein. Agilent Technologies
shall not be liable for incidental or consequential damages in connection with or arising
out of the furnishing, performance, or use of this software.
Use of the supplied manual and software is restricted to Agilent Technologies ac source
products only. The software is copyrighted and may not be copied except for archival
purposes, to rep l ace a defective copy, or for program error verification. Agilen t
Technologies warrants that this software designed for use with a personal computer, will
execute its programming instructions when properly installed on that personal computer.
Agilent Technologies does not warrant that the operation of the personal computer ,
software, or ac source will be uninterrupted or error free.
Limitation of Warranty
The foregoing warranty shall not apply to defects resulting from: misuse, unauthorized
modification, operation or storage outside the environmental specifications for the
product, in-transit damage, improper maintenance, or defects resulting from use of nonAgilent Technologies software, accessories, media, or such items not designed for use
with the product.
Notice
This document contains proprietary information protected by copyright. All rights are
reserved. No part of this document may be photocopied, reproduced, or translated into
another language without the prior consent of Agilent Technologies. The information
contained in this document is subject to change without notice.
Copyright 1997, 1999, 2000 Agilent Technologies, Inc.
Windows is a registered trademark of Microsoft Corporation.
Manual part number: 5962-8191 Printed in USA, February 1999
Updated April 2000
 Loading...