

Page 1

The Agilent Ion Mobility Q-TOF Mass
Spectrometer System
Technical Overview
The Agilent Ion Mobility Q-TOF Mass Spectrometer
System
• Delivers an added dimension of separation
• Provides direct measurement of accurate collision cross sections
• Preserves structural characteristics of molecular conformations
• Expands coverage maps for complex samples.
Introduction
The Agilent 6560 Ion Mobility Quadrupole Time-of-Flight (IM-QTOF) LC/MS system
enables high performance ion mobility and very precise and accurate collision cross
section (CCS or W) measurements without class dependent calibration standards. The
Agilent mobility device operates under uniform low field conditions, thus allowing the
drift time information for ions to be directly converted to collision cross section information. The innovative ion funnel technology in this instrument dramatically increases
the ion sampling into the mass spectrometer and results in higher quality MS/MS
spectra at trace levels.
The Agilent IM-QTOF system is the first commercially available uniform field ion
mobility system, which coupled with the Agilent 1290 UHPLC, provides the combined
separation power and selectivity of LC, IM, and MS techniques. Laboratories involved
in cutting edge research can speed up research programs and have greater confidence in compound identification with the additional dimension of separation as well
as the structural information provided by ion mobility measurements. This instrument
is the only commercially available drift tube ion mobility high resolution (both mobility
and mass) LC/MS system that simultaneously provides high sensitivity and accurate
collision cross section measurements.
Authors
Ruwan Kurulugama, Ken Imatani, and
Lester Taylor
Agilent Technologies, Inc.
Santa Clara CA
Page 2

The Agilent ion mobility system was developed with the collaboration of scientists
from a number of academic institutions and government laboratories. In multiple studies, the instrument has demonstrated the ability to reveal significantly greater analytical detail for complex samples compared to high resolution mass spectrometry
technology alone.
Researchers have reported that while high resolution mass spectrometry has become
the analytical cornerstone for proteomics, metabolomics, and other research applications requiring the analysis of highly complex samples, there has also been significant
interest in the use of ultra-fast orthogonal techniques to provide added dimensions of
separation. This new ion mobility system will provide researchers with greater
analytical detail than ever before.
Principles of Ion Mobility Separation
In a classical uniform field drift tube, the electric field within the drift cell moves ions
through the device while the drag force due to the collisions of these ions with the
stationary buffer gas molecules acts against the electrical force that moves the ions.
The drag force experienced by the ions depends on their collision cross sections (a
function of size and shape), electrical charge, and mass. Multiply charged ions move
through the buffer gas more effectively than singly charged ones since they experience a greater force due to the electric field. Ions with larger cross sections are
retarded more easily by collisions with the buffer gas in the drift tube. The drag force
resulting from collisions of ions with the buffer gas molecules acts against their
acceleration imposed by the electric field. Thus an equilibrium state is quickly reached
and the ions start moving with constant velocity (Vd) which is proportional to the
applied electric field (E). The proportionality constant (K) is the gas phase mobility of
an ion. The diffusion limited resolving power is dependent upon the length (L) of the
drift cell, electric field (E), charge state of the analyte ions (Q), and the buffer gas
temperature (T).
V
d
= KE
Mobility is a function of the ion’s interaction with the buffer gas, its mass and its electrical charge. Furthermore, the reduced mobility (K
0
) depends on the gas temperature
and the mass of the buffer gas molecules.
2
where L is the length of the drift cell, tdis the corrected drift time, E is the electric field
across the drift cell, P is the pressure of the drift cell, and T is the temperature of the
buffer gas.
273.2
P
L
K0 =
E
t
d
760
T
Page 3
Agilent IM-QTOF System
The Agilent IM-QTOF system provides the following:
• Ion mobility resolving power of greater than 60
• Automated calculation of accurate collision cross sections (~ 1%) without the
need for calibration standards
• High sensitivity for trace level compounds
• Sophisticated data browsing and mining tools
3
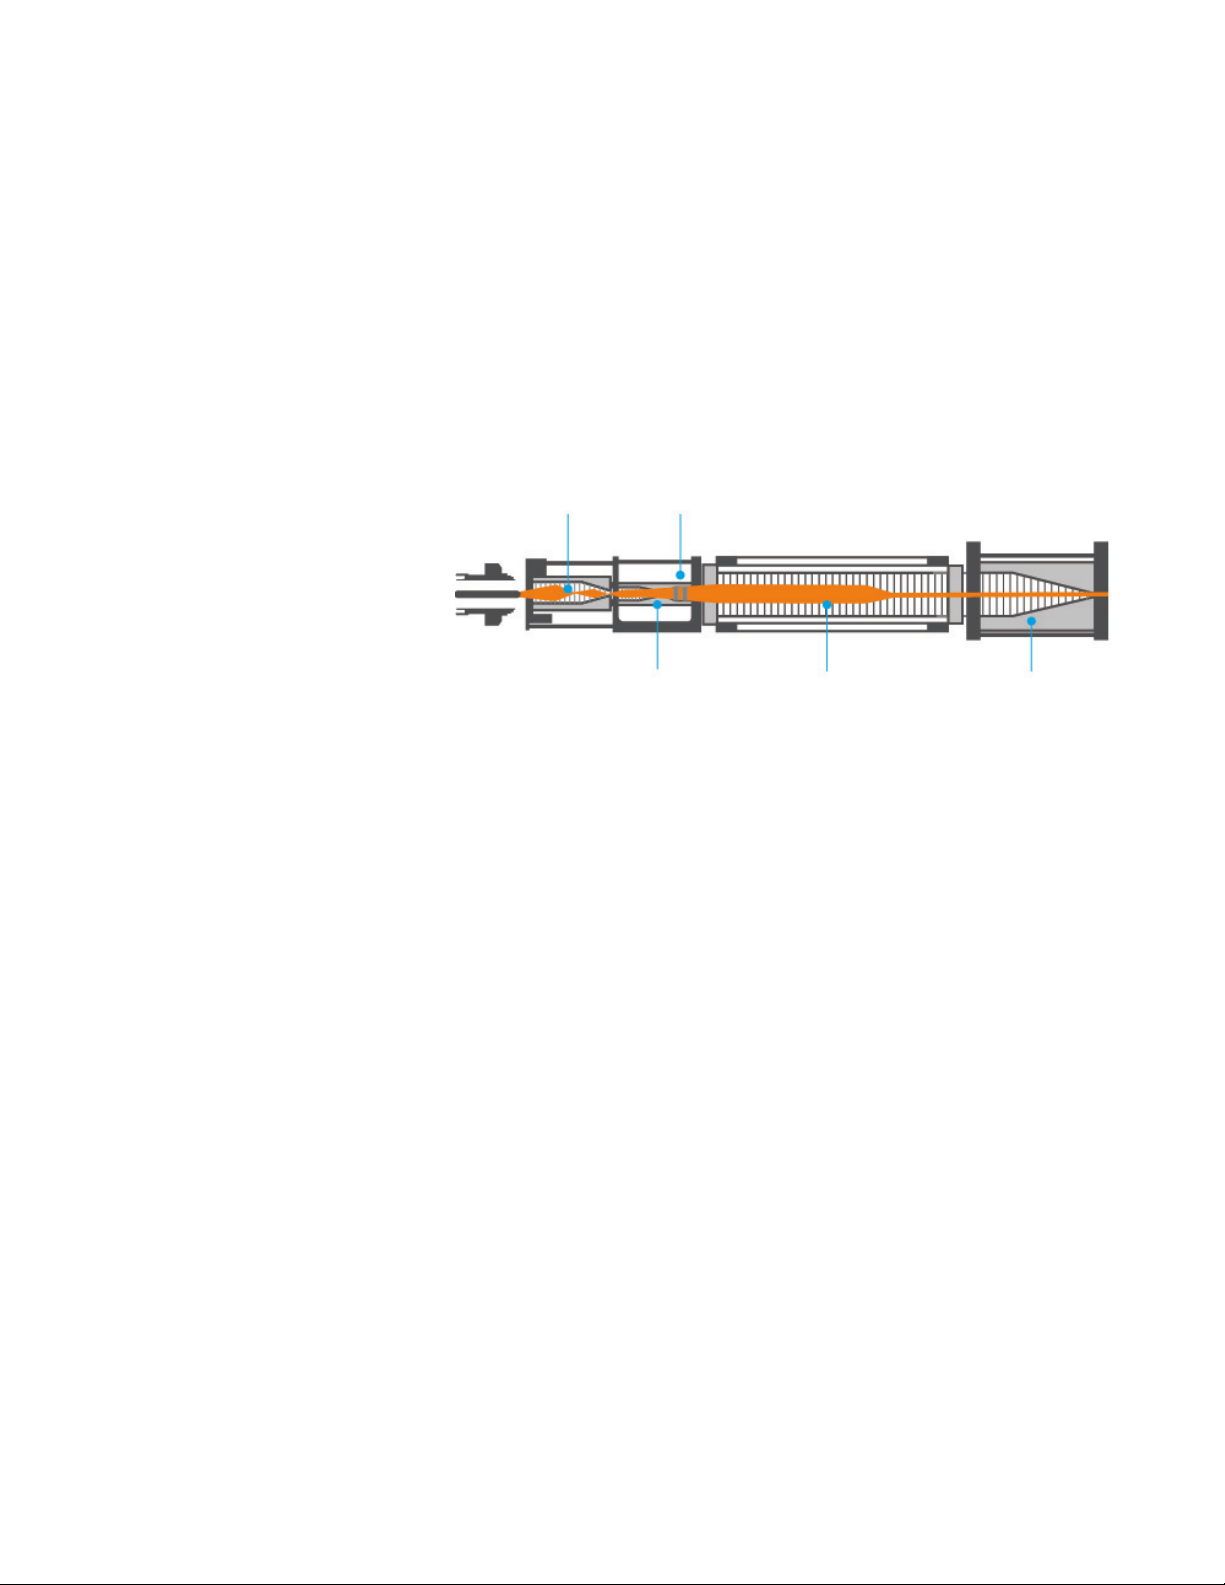
Figure 1. Schematic diagram of the ion mobility instrument. Ions generated in the source region are
carried into the front ion funnel through a single bore capillary. The front ion funnel improves
the sensitivity by efficiently transferring gas phase ions into the trapping funnel while pumping away excess gas and neutral molecules. The trapping funnel accumulates and releases
ions into the drift tube. The drift cell is ~80 cm long and generally operated at 20 V/cm drift
field. Ions exiting the drift tube enter the rear ion funnel that efficiently refocuses and
transfers ions to the mass analyzer.
Operation Description
As shown in Figure 1, the Agilent ion mobility system consists of a front funnel, trapping funnel, trapping gate, drift tube, and a rear funnel that couples through a hexapole to the Q-TOF mass analyzer. The front funnel operates at high pressure where
funnel DC and RF voltages propel ions toward the trapping funnel. The key function of
the front ion funnel is to enrich the sample ions and remove excess gas.
The continuous ion beam from the electrospray process has to be converted into a
pulsed ion beam prior to ion mobility separation. The trapping funnel operates by first
storing and then releasing discrete packets of ions into the drift cell.
Ions are separated as they pass through the ion mobility cell based on their size and
charge. Ions with larger collision cross sections undergo higher number of collisions
with drift gas molecules compared to ions with smaller collision cross section.
Therefore, larger ions travel through the drift cell slower than the smaller ions. Also,
ions with higher charge states experience a higher electric force, and hence travel at a
higher velocity, compared to ions with lower charge states. The drift cell is operated
under low field limit conditions allowing the instrument to generate accurate structural information for compounds. Under the low electric field conditions the mobility is
not dependent on the electric field but rather on the structure of the molecule and its
interaction with the buffer gas.
Ions exiting the drift cell are refocused by the rear ion funnel before entering the
hexapole ion guide.
Front funnel Trapping gate
Trapping funnel Drift tube Rear funnel
Page 4
Optimization of Performance - Drift Time Resolution
For ion mobility spectrometry, drift resolution depends on diffusional peak broadening,
width of the initial ion packet, and space charge effects. The most important of these
three factors is diffusional peak broadening. The diffusion limited resolving power is
dependent upon the length (L) of the drift cell, electric field (E), charge state of the
analyte ions and the buffer gas temperature. Longer drift tubes allow ions to drift for a
longer period of time, which results in better ion separation and drift resolution.
4
The Agilent ion mobility drift tube length is approximately 80 cm, and designed to optimize drift resolution and minimize signal loss. Use of a nitrogen buffer gas provides
robust operation at higher drift tube voltages and provides drift resolutions of greater
than 60 for small and large molecules.
Another factor contributing to higher drift resolution is the width of the initial ion
packet. This instrument uses a double grid trapping funnel device to optimize for
higher ion capacity and narrower ion packets. Setting appropriate ion gate pulse times
will determine the number of ions contained in the ion packets which are subsequently injected into the ion mobility cell. The pulse times are typically in the range of
60 to 100 milliseconds.
Figure 2. Separation of isobaric tri-saccharides using the IM-QTOF. A 1:1 mixture of melezitose and
raffinose was infused using a syringe pump. These two carbohydrates can be baseline separated using the ion mobility drift cell and detected using the Q-TOF mass analyzer as sodium
adducts. The ion mobility resolving power for this separation is 60.
t
D
R ==
Dt 16kbTln2
LEQ
OH
H
OH
HO
H
O
H
HO
H
H
OH
H
O
H
H
HO
O
HO
H
H
OH
H
OH
O
HO
H
O
OH
H
H
OH
Raffinose
H
HO
O
OH
HO
H
H
OH
H
O
H
H
O
H
H
HO
H
OH
HO
H
O
OH
H
OH
O
OH
H
Melezitose
×10
1.2
28
27
26
25
24
527.0
5
527.1580
527.5
528.0 528.5 529.0 529.5
28
Raffinose
27
26
25.76 26.68
Drif t time (ms)
25
Melezitose
24
1.0
0.8
0.6
0.4
0.2
0
526.8 527.2 527.6 528.0
528.4 528.8 529.2 529.6
m/z
Page 5

Lastly, a tapered section at the exit region of the trapping funnel is designed to
focus the ion packets into the drift cell to avoid ion losses and improve resolution and
sensitivity.
The net result is a high abundance, well confined packet of ions entering the drift
region resulting in high drift resolution and high sensitivity.
Optimization of Sensitivity
Uniform field ion mobility has existed for many years with numerous research built
designs. These uniform field designs show very high ion losses (> 99.9%) in the ion
gating region before the drift tube. Additionally, considerable number of ions can be
lost at the exit of the drift tube because of the small exit aperture.
The emergence of modern electrodynamic ion funnel technology pioneered by the
Richard Smith group at PNNL has enabled greater sensitivity gains for uniform field
drift tube designs. The PNNL trapping ion funnel was the first device that traps ions
at high pressure. System sensitivity performance is a function of ionization efficiency,
efficient ion transfer into and out of the drift tube region and minimization of
transmission losses between the ion source and mass spectrometer.
The Agilent IM-QTOF is shown schematically in Figure 3. The Agilent Jet Stream
ionization source provides very high ionization efficiency, with a 5-fold sensitivity
advantage compared with standard electrospray designs. The first stage ion funnel
efficiently removes excess gas while concentrating the ion beam for the second stage
trapping funnel.
At the exit of the drift tube, a rear funnel is employed to refocus the ion packets into
a narrower beam before entering the optics of the mass spectrometer. The high
efficiency ion trapping and rear funnel together result in a 1,000-fold sensitivity
improvement over previous non-funnel designs.
5
Figure 3. Schematic of the Agilent IM-QTOF instrument. The ion mobility spectrometer is coupled to a
quadrupole time-of-flight mass spectrometer using a hexapole ion guide.
Front funnel
Trapping gate
Trapping funnel
Ionization source
Drift tube
Rear funnel
Quad mass filter
Collision cell
IBC
Ion pulser
Page 6

Development of Accurate Collision Cross Section
Measurements
Collision cross section values are derived from ion mobility measurements. All of the
first order equations governing ion mobility apply at low electric fields. Uniform field
drift tube designs typically operate at low electric field resulting in very predictable
and accurate mobility measurements.
Conventional uniform field drift tube ion mobility provides a direct method to calculate
collision cross sections (W) using the Mason-Schamp equation given below:
6
where W is the rotationally averaged collision cross section, kbis the Boltzman constant, T is the temperature of the buffer gas, mlis the mass of analyte ion, mBis the
mass of buffer gas molecules, tdis the corrected drift time, ze is the charge state of
the analyte ion, E is the electric field, L is the length of the drift cell, P is the pressure
in drift cell, and N is the number density in the drift cell. It is important to note that t
d
can be determined from the total ion drift time in the IMS QTOF system. Once t
d
values are calculated they can be used to directly generate CCS measurements.
The accuracy to which the collision cross section can be calculated is determined by
the extent to which experimental parameters (pressure, temperature and electric field)
are maintained during the mobility experiment. Any time the ion spends outside of the
defined drift region produces “end effects,” which cause loss of measurement accuracy. Measurements of CCS within 2% accuracy or less can be routinely achieved
using uniform field drift tubes.
Table 4. Collision cross section data for a series of tetra alkyl ammonium (TAA) salts. A mixture of
TAA salts were directly infused into the Agilent IM-MS instrument at seven different drift
fields. The t0values for each salt was obtained by plotting drift time versus 1/voltage graphs.
The corrected drift times were then used to calculate the CCS values.
*Campuzano, I., Bush,M. F., Robinson, C. V., Beaumont, C., Richardson, K., Kim, H., Kim, H. I. Anal Chem
2012, 84(2) 1026-33. Structural Characterization of Drug-like Compounds by Ion Mobility Mass Spectrometry.
Analyte
Mass
(Da)
CCS literature*
(Å
2
)
CCS Agilent IM-MS
(Å
2
) % Deviation from literature
TAA -3 186.22 143.8 ± 0.1 146.1 ± 1.0 1.54
TAA -4 242.28 166.0 ± 0.3 167.3 ± 0.9 0.77
TAA -5 298.35 190 ± 0.1 190.3 ± 1.1 0.10
TAA -6 354.41 214.0 ± 0.3 213.9 ± 0.6 0.04
TAA -7 410.47 236.8 ± 0.2 237.7 ± 0.4 0.37
TAA -8 466.54 258.0 ± 0.4 258.7 ± 0.4 0.14
TAA -10 578.66 – 296.2 ± 0.4 –
TAA -12 690.79 – 325.5 ± 0.5 –
TAA -16 915.04 – 365.6 ± 0.7 –
1/2
tdE
1
+
m
B
760
LP
T
273.2
1
N
W =
1/2
(18p)
16ze(kbT)
1
1/2
m
l
Page 7

Preservation of Structural Characteristics of Molecular
Conformation
Collision cross section measurements are dependent on preserving molecular structure in the gas phase and studies have shown that structural conformation can be
preserved with reduced ion heating. The Agilent ion mobility design imparts minimal
ion heating since direct current (DC) is used to propel ions forward in the drift cell.
The Agilent IM-QTOF system also allows use of tunable trap voltage settings to
accommodate preservation of structural forms for a wide range of labile to very stable
compounds. Ion heating is minimized by having tunable RF voltages on the ion funnels that can be optimized for specific studies. Fragmentation along the ion path is
minimized by optimizing electric field strengths and pressure in the drift cell and the
Q-TOF interface.
Figure 4 shows IMS-TOF separation of different ubiquitin charge states by means of
tunable trapping voltages to preserve the low energy structures.
7
Figure 4. IM-QTOF separation of ubiquitin charge states. Ubiquitin was dissolved in 50:50 water:MeOH
solution with 0.1% acetic acid and infused into IM-QTOF instrument. The 3D plot of drift time
versus m/z shows the distribution of charge states in the drift and m/z space. The drift time
distribution plot shown to the left side is generated by summing all the drift distributions for
different charge states. Some charge states show multiple drift peaks corresponding to
multiple conformers.
38
36
34
32
30
28
26
24
40 20
(×106)
×10
2.5
2.0
1.5
1.0
0.5
Drif t time (ms)
35
30
25
6
0
600
13+
14+
600 700
800 1,000 1,200 1,400 1,600 1,800
11+
10+
12+
9+
8+
800 90 0 1,00 1,100
7+
1,200 1,300 1,400 1,50 0 1,60 0 1,700 1,80 0
m/z
6+
5+
Page 8

Enhanced Separation and Peak Capacity
Separation power is especially important for complex mixture analysis containing
multiple compound types. For in depth analysis, chromatographic separation alone is
not sufficient to allow characterization of several compounds that may elute within a
single LC peak. Additionally, high resolution mass spectrometers may be limited by
how fast they can perform MS scans and are unable to generate data for all compounds in a sample without efficient front end separation. Typically, data dependent
MS/MS experiments often miss low abundance peaks.
Ion mobility separation speed (milliseconds) fits between the HPLC (seconds) time
scale and TOF analyzer time scale (microseconds). Ion mobility provides the ability to
separate trace level compounds that are not resolved chromatographically. Under traditional MS/MS conditions, a quadrupole is used to select precursor ions for fragmentation. In All Ions MS/MS experiments, no precursor ion selection is done and all
ions are sent to the collision cell for fragmentation. The advantage of All Ions MS/MS
over traditional MS/MS is that one can collect structural information on all compounds present. The use of All Ions MS/MS is made more powerful in combination
with ion mobility since the drift time separation provides additional separation to help
understand sample complexity and more easily associate fragments with precursors.
The benefit of this is less ambiguity in identifying compounds when using All Ions
MS/MS with the better detection limits for trace level compounds.
As an example, a recent study by Vanderbilt University using the Agilent IM-QTOF
system showed an increase in the overall coverage of lipids by 5-fold. Similarly, in a
recent proteomics study by Pacific Northwest National Laboratory, a 3-fold improvement in the number of peptides and proteins identified was achieved using IM-QTOF
compared with LC/MS analysis alone, as illustrated in Figure 5.
A common metric for separation power is peak capacity, which can be defined as the
maximum number of peaks that can fit in any multidimensional method. A high peak
capacity can be achieved if the resolution of each method (LC, IMS, MS) is high and
the difference in their separation mechanism (orthogonality) is significant. Peak
capacity is a better indicator of separation power when compared to mass resolution
alone. In an ideal situation, peak capacity of the multidimensional method is a
multiplicative product of each dimension:
Peak capacity = UHPLC resolving power × IM resolving power × MS resolving power
× fraction orthogonality
A recent Vanderbilt University study has shown a 5-fold increase in peak capacity for
singly charged compounds compared to previous LC/MS methods.
The Agilent IM-QTOF system achieves a very high peak capacity since it can simultaneously combine the resolving power of UHPLC, IM, and mass resolution without
compromising sensitivity performance. As shown in Figure 6, a separation of near isobaric pesticides is achieved for mass differences of less than 0.2 mDa, which would
require a mass resolving power of 2,000,000 to effectively resolve.
8
Page 9

9
)
Figure 5. Increased selectivity obtained using the Agilent IM-QTOF instrument. The m/z versus drift
time plot shows the separation of tryptic peptides derived from mouse blood plasma sample
spiked with 20 reference peptides. The sample was subjected to 15 minutes LC separation
before IM-QTOF analysis. The inset shows a zoomed in region of the 3D plot where
10 peptides were identified for the LC-IM-QTOF experiment. The same sample was run with a
100-minute LC gradient using LTQ-FT-MS instrument that yielded only three identifications, as
indicated by asterisks.
Figure 6. IM-QTOF separation of pesticides aldicarb-sulfone and acetamiprid, which had a 0.2 mDa
mass difference. A mass resolution of about 2 million is required to separate these two compounds in an m/z domain. Due to the structural differences between these compounds, they
can be easily separated in the drift dimension.
1,330,000
49,400
0
0
02,430,000 026,600
Aldicarb-sulfone (C7H14N2O4S)
+
[M+Na]
= 245.056649
O
N
O
N
H
O
S
O
Acetamiprid (C10H11ClN4)
+
[M+Na]
= 245 .05644 5
CH
3
N
N
CH
N
Cl
3
N
C
IMS drift separation
4
×10
Acetamiprid
4
3
2
1
0
17 18
4
×10
Aldicarb-sulfone
1.0
0.8
0.6
0.4
0.2
0
17 18
19.441
19 20 21
18.297
19
20 21
×10
4
5
4
3
2
1
0
*18.297
17 17.5 18
*19.441
18.5 19
Drift time (ms)
19.5 20 20.5
Drift time (ms
Page 10

Beyond peak capacity - selectivity matters!
High resolving power or peak capacity is useful in situations where there are differences in mass or other physical properties. In situations where isobaric compounds
are analyzed, mass resolution > 1,000,000 may be insufficient to separate and identify
these isomers. The ability to determine CCS values can be used to confirm the identity of structural isomers as shown below in Figure 7 for permethylated
oligosaccharides.
10
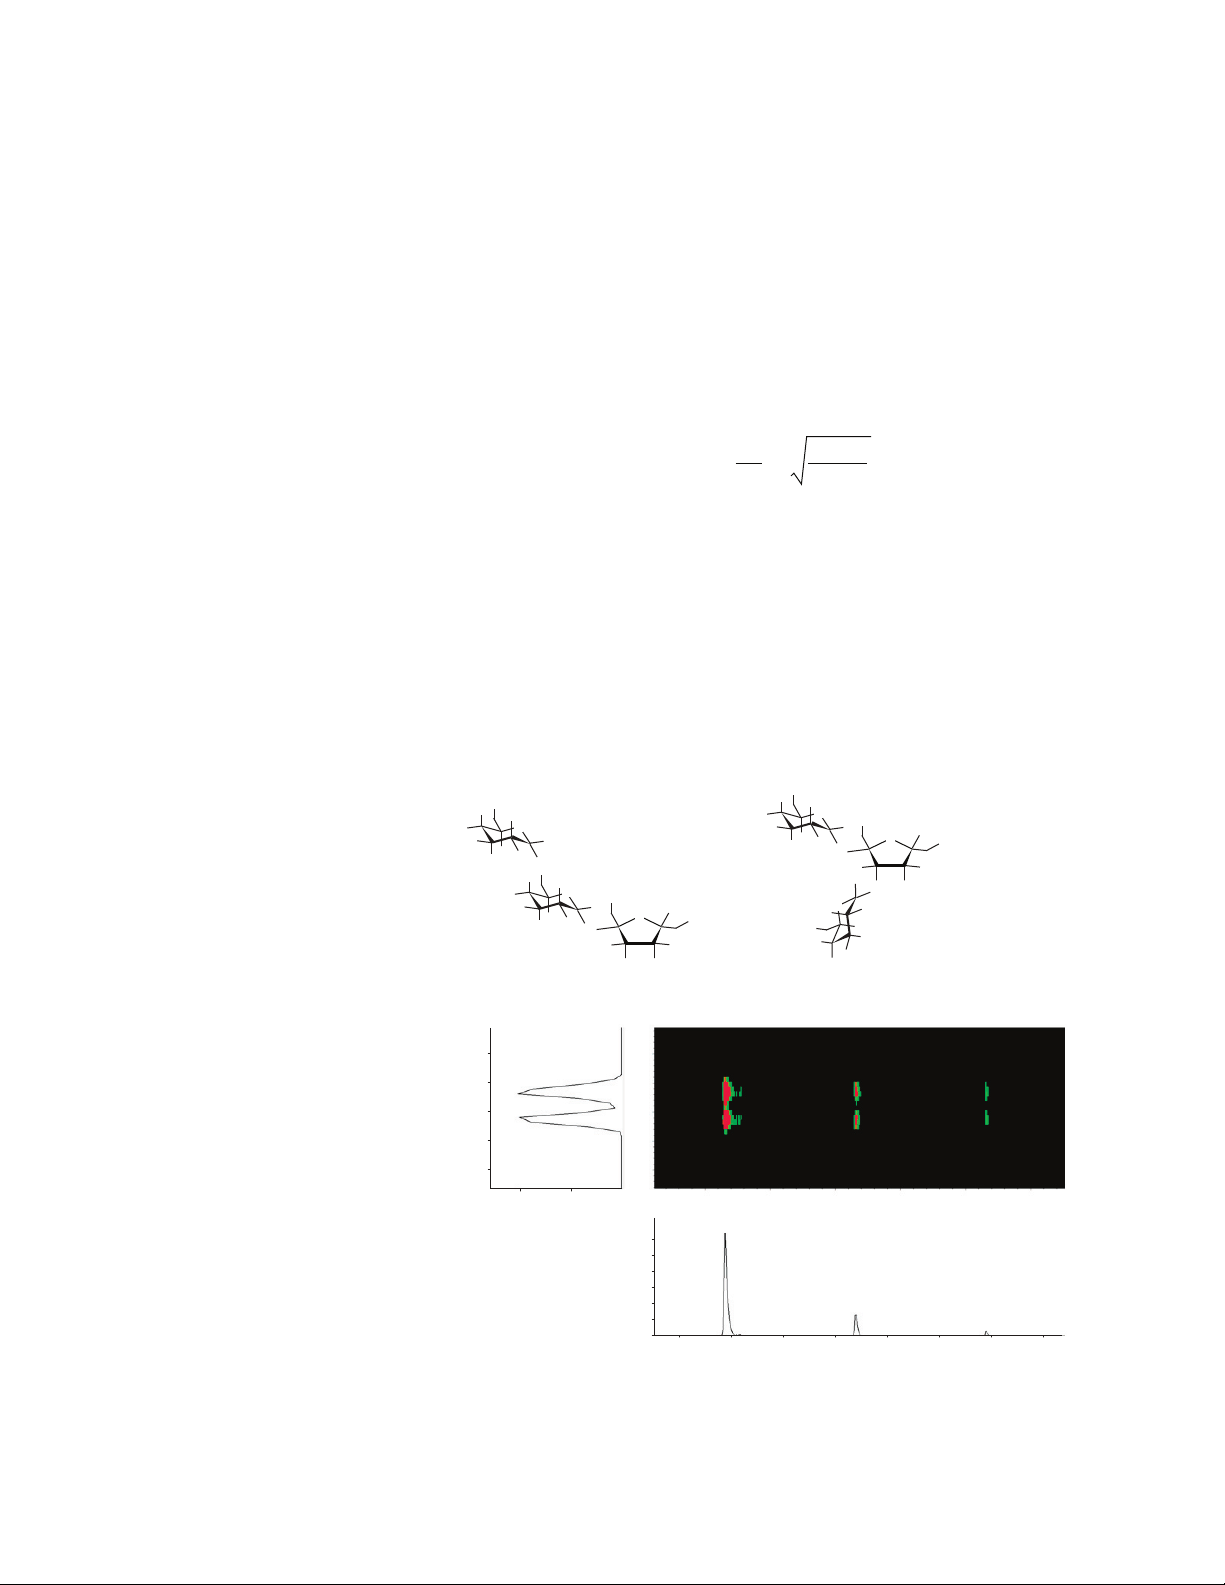
Figure 7. IM-QTOF separation of permethylated oligosaccharides. These oligosaccharide samples were
infused separately and analyzed using IM-QTOF as sodium adducts. These isobaric hexoses
show different drift distributions, indicating their structural differences. Ion mobility separation is a valuable technique that can be used to separate isobaric compounds with different
structures.
Conclusions
The Agilent IM-QTOF LC/MS system is a major advance in the commercial development of analytical ion mobility‑mass spectrometry. Optimized development of a uniform drift field mobility cell and interface to a high resolution Q-TOF instrument gives a
significant gain in ion mobility performance. The use of ion funnel technology pioneered by Agilent for both triple quadrupole and Q-TOF instruments over the past
three years has been incorporated into the new IM-QTOF system. This has resulted in
combined ion mobility separation and mass resolution with high sensitivity.
Recent work with several collaborators has confirmed that the instrument delivers:
• Greater separation of lipids and glycopeptides
• More accurate collision cross section measurements enabling more confident
characterization of structural conformations and isomeric compounds
• Greater numbers of trace level peptides in complex matrices
• Preservation of structural fidelity of metallo-proteins in liquid phase solutions
In order to maximize the analytical utility of this system, Agilent has also developed
software tools for data visualization of ion mobility data. This software is designed to
allow researchers to interrogate mobility/mass domain data and easily determine
collisional cross section values with high precision and accuracy.
1.0
0.9
0.8
0.7
0.6
0.5
0.4
Normalized intensity
0.3
0.2
0.1
0
35 36 37 38 39 40
Drift time (ms)
41 42 43 44 45
Cel6
Mal6
Lam6
Man6
IM6
3,4Glu
Page 11

References
Factors influencing drift resolution
1. H.E. Revercomb, and E.A. Mason, “Theory of plasma chromatography/gaseous
electrophoresis – a review”, Anal. Chem, 47, 970-983, 1975.
Triwave description and operation
2. K. Giles, S.D. Pringle, K.R. Worthington, D. Little, J.L. Wildgoose, and
R.H. Bateman, “Applications of a travelling wave-based radio-frequency only
stacked ring ion guide”, Rapid Commun. Mass Spectrom., 18, 2401-2414, 2004.
3. S.D. Pringle, K. Giles, J.L. Wildgoose, J.P. Williams, S.E. Slade, K. Thalassinos,
R.H. Bateman, M.T. Bowers, and J.H. Scrivens, “An Investigation of the mobility
separation of some peptide and protein ions using a new hybrid
quadrupole/travelling wave IMS/oa-TOF instrument”, Int. J. Mass Spectrom.,
261, 1-12, 2007.
PNNL study on sensitivity improvements using electrodynamic
funnels
4. K. Tang, A.A. Shvartsburg, H.N. Lee, D.C. Prior, M.A. Buschbach, F.M. Li,
A.V. Tolmachev, G.A. Anderson, and R.D. Smith, “High-sensitivity ion mobility
spectrometry/mass spectrometry using electrodynamic ion funnel interfaces”,
Anal. Chem., 77, 3330-3339, 2005.
5. Y. Ibrahim, M.E. Belov, A.V. Tolmachev, D.C. Prior, and R.D. Smith, “Ion funnel
trap interface for orthogonal time-of-flight mass spectrometry”, Anal. Chem., 79,
7845-7852, 2007.
6. B.H. Clowers, Y.M. Ibrahim, D.C. Prior, W.F. Danielson, M.E. Belov, and
R.D. Smith, “Enhanced ion utilization efficiency using an electrodynamic ion
funnel trap as an injection mechanism for ion mobility spectrometry”, Anal.
Chem., 80, 612-623, 2008.
Studies showing limitations of cross section measurements using the Triwave
system for unknowns. Ion heating and several references to poor calibration –
significant heating of ions depending on the parameters of the T-Wave
7. D. Morsa, V. Gabelica, and E. De Pauw, “Effective temperature of ions in traveling wave ion mobility spectrometry”, Anal. Chem., 83, 5775–5782, 2011.
Theory of ion heating in T-Wave
8. A.A. Shvartsburg and R.D. Smith, “Fundamentals of traveling wave ion mobility
spectrometry”, Anal. Chem., 80, 9689-99, 2008.
9. S.I. Merenbloom, T.G. Flick, and E.R. Williams, “How hot are your ions in TWAVE
ion mobility spectrometry?”, J. Am. Soc. Mass Spectrom., 23, 553-62, 2012.
11
Page 12

Protein calibration: wide spread of data points around the calibration line (up to
± 10%). A lot fewer conformers of cytochrome C detected (only the unfolded
ones) compared to Clemmer’s data
10. D.P. Smith, T.W. Knapman, I. Campuzano, R.W. Malham, J.T. Berryman,
S.E. Radford, and A.E. Ashcroft, “Deciphering drift time measurements from
travelling wave ion mobility spectrometry-mass spectrometry studies”,
Eur. J. Mass Spectrom., 15, 113–130, 2009.
Protein CCS calibration using different types of proteins (for example, native
versus denatured) leads to gross errors (20–30%). In some cases the CCS
measured depend on wave height.
11. M.F. Bush, Z. Hall, K. Giles, J. Hoyes, C.V. Robinson, and B.T. Ruotolo, “Collision
cross sections of proteins and their complexes: A calibration framework and
database for gas-phase structural biology. CCS values and increased coverage of
lipids”, Anal. Chem., 82, 9557–9565, 2010.
12. J. May, C. Goodwin, R.T. Kurulugama, A. Mordehai, G. Stafford, and J. McLean,
“Ion mobility conformational space mapping for complex sample characterization”, Vanderbilt University department of chemistry, Nashville, TN and Agilent
Technologies, Inc., Santa Clara, CA, Oral session at 61st Annual ASMS
conference, 2013, Minneapolis, MN.
Separation and peak capacity
13. P. Dwivedi, A.J. Schultz, and H.H. Hill Jr., “Metabolic profiling of human blood by
high-resolution ion mobility mass spectrometry (IM-MS)”, Int. J. Mass
Spectrom., 298, 78-90, 2010.
14. C. Lapthorn, F. Pullen, and B.Z. Chowdhry, “Ion mobility spectrometry-mass
spectrometry (IMS-MS) of small molecules: separating and assigning structures
to ions”, Mass Spectrom. Rev., 32, 43-71, 2013.
w
ww.agilent.com/chem
Agilent shall not be liable for errors contained herein or
for incidental or consequential damages in connection
with the furnishing, performance, or use of this material.
Information, descriptions, and specifications in this
publication are subject to change without notice.
For Research Only. Not for use in diagnostic procedures.
RA44229.2315625
© Agilent Technologies, Inc., 2013, 2021 Printed
in the USA
February 15, 2021
5991-3244EN
 Loading...