

Page 1

Agilent
QC Chart Tool 3.5
User Guide
For Research Use Only. Not for use in
diagnostic procedures.
Agilent Technologies
Page 2

Notices
CAUTION
WARNING
© Agilent Technologies, Inc. 2015, 2018,
2021
No p art o f this manu al may be re produce d in
any form or by any means (including electronic storage and retrieval or translation
into a foreign language) without prior agreement and written consent from Agilent
Technologies, Inc. as governed by United
States and international copyright laws.
Manual Part Number
G4460-90048
Edition
Revision C0, January 2021
Printed in USA
Agilent Technologies, Inc.
5301 Stevens Creek Blvd.
Santa Clara, CA 95051
Software Revision
This guide is valid for 3.5 and later revisions
of the Agilent QC Chart Tool software, until
superseded.
Technical Support
For US and Canada
Call (800) 227-9770 (option 3,4,2)
Or send an e-mail to:
informatics_support@agilent.com
For all other regions
Agilent’s world-wide Sales and Support
Center contact details for your location can
be obtained at
www.agilent.com/en/contact-us/page.
Warranty
The material contained in this document is provided “as is,” and is subject to being changed, without notice,
in future editions. Further, to the maximum extent permitted by applicable
law, Agilent disclaims all warranties,
either express or implied, with regard
to this manual and any information
contained herein, including but not
limited to the implied warranties of
merchantability and fitness for a particular purpose. Agilent shall not be
liable for errors or for incidental or
consequential damages in connection with the furnishing, use, or performance of this document or of any
information contained herein. Should
Agilent and the user have a separate
written agreement with warranty
terms covering the material in this
document that conflict with these
terms, the warranty terms in the separate agreement shall control.
Technology Licenses
The hardware and/or software described in
this document are furnished under a license
and may be used or copied only in accordance with the terms of such license.
Restricted Rights Legend
U.S. Government Restricted Rights. Software and technical data rights granted to
the federal government include only those
rights customarily provided to end user customers. Agilent provides this customary
commercial license in Software and technical data pursuant to FAR 12.211 (Technical
Data) and 12.212 (Computer Software) and,
for the Department of Defense, DFARS
252.227-7015 (Technical Data - Commercial
Items) and DFARS 227.7202-3 (Rights in
Commercial Computer Software or Computer Software Documentation).
Safety Notices
A CAUTION notice denotes a hazard. It calls attention to an operating procedure, practice, or the like
that, if not correctly performed or
adhered to, could result in damage
to the product or loss of important
data. Do not proceed beyond a
CAUTION notice until the indicated
conditions are fully understood and
met.
A WARNING notice denotes a
hazard. It calls attention to an
operating procedure, practice, or
the like that, if not correctly performed or adhered to, could result
in personal injury or death. Do not
proceed beyond a WARNING
notice until the indicated conditions are fully understood and
met.
QC Chart Tool
Page 3

In This Guide...
This guide describes how use the Agilent QC Chart Tool
software to query, filter, and evaluate microarray extractions.
It also describes how to visualize current and historical
batch microarray extraction processes.
1 Getting Started
This chapter gives an overview of how to use the software to
evaluate microarray extraction quality. It gives instructions
for how to do common tasks.
2 Building Queries, Metric Sets, and Charts to Evaluate Extractions
This chapter describes how Queries are applied to
extractions, how Metric Sets are built and used to filter and
evaluate extractions, and how to visualize batch processes
using Charts.
3 QC Chart Tool Reference
This chapter describes the parts of the Agilent QC Chart
Tool main window that you use to query and evaluate
microarray extractions. It also describes any dialog boxes
that appear during quality evaluation of the extractions.
QC Chart Tool 3
Page 4

4 QC Chart Tool
Page 5

Contents
1 Getting Started 7
What Is the QC Chart Tool Software? 8
Example use cases 9
2 Building Queries, Metric Sets, and Charts to Evaluate Extractions 15
Importing Data 16
To import FE statistics and parameter information 16
To import a query result 17
Building and Running Queries 18
To create a query 18
To create a composite query 19
To edit a query 20
To run a query 21
To delete a query 21
To rename a query 21
To import a query result 22
To export a query result 22
Defining Metrics 23
To create a new metric 23
To delete a metric 24
Defining Metric Sets and Thresholds 25
To create a metric set 25
To edit a metric set 26
To view a metric set 26
To set metric thresholds in metric sets 27
To export metric sets 30
To import metric sets 31
To delete a metric set 31
QC Chart Tool 5
Page 6

Contents
To remove a metric from a metric set 31
To rename a metric set 32
Producing and Displaying Charts 33
To create a chart 33
To view the chart 34
To edit a chart 34
To delete a chart 34
To rename a chart 35
3 QC Chart Tool Reference 37
The QC Chart Tool Window 38
Command ribbon 39
Navigator 43
Data window 47
Dialog Boxes 52
Agilent Feature Extraction Importer 52
Chart Configuration dialog box 54
Create a new Metric dialog box 55
Delete Metrics 58
Frequency Distribution 59
Metric Set Configuration dialog box: Add Metrics to Metric Set tab 60
Metric Set Configuration dialog box: Selected/Existing Metrics tab 64
Query Builder dialog box 66
6 QC Chart Tool
Page 7

Agilent QC Chart Tool
User Guide
1
Getting Started
What Is the QC Chart Tool Software? 8
Example use cases 9
This chapter provides an overview of how to use Agilent QC Chart Tool to
query, evaluate, and chart microarray extraction data. For a list of how- to
instructions for the tasks available in the QC Chart Tool software, see
Chapter 2, “Building Queries, Metric Sets, and Charts to Evaluate
Extractions”. For a description of each part of this software, including all
of the dialog boxes that can appear when you click buttons and other
elements, see Chapter 3, “QC Chart Tool Reference”.
Agilent Technologies
7
Page 8

1Getting Started
What Is the QC Chart Tool Software?
What Is the QC Chart Tool Software?
Agilent QC Chart Tool is installed when you install the Agilent Feature
Extraction software. It analyzes summary statistics from Feature
Extraction output files in order to monitor microarray processing
performance.
The data is kept in the shared Feature Extraction database, that you can
query. Queries enable you to search this data. You can save the queries to
allow the display of specific subsets of the data. For instance, queries can
select the data found in specific designs, batches, or dates of processing.
Using the data, you can create metrics that monitor aspects of the
microarray processing workflow.
Additionally, you can create metric sets that combine metrics, and you can
set thresholds for metrics within a metric set. Agilent includes default
metric sets for each microarray type in the database. These metric sets
were optimized for the workflow using the Agilent microarray scanner,
Feature Extraction default protocols, and Agilent laboratory protocols. You
can change and save a default metric set using a new name, to create one
or more custom metric sets; for example, to optimize the thresholds for
your custom protocols.
With QC Chart Tool, you can select a query to define which extractions to
view and select a metric set to define which metrics to view. You then
graphically plot the results from current or historical microarray data, and
create thresholds for the metrics that are appropriate for your
experimental conditions and processing environment.
The QC Chart Tool software is designed for use in a production
environment where:
• Microarray processing protocols are standardized and you want to
examine the effect of variables on performance related to:
• Operators
• Wet- lab protocols
• FE parameter protocols
• Monitoring run- to- run consistency is an important goal to:
• Identify extractions that fall outside the established normal range
• Identify systematic data trends
8 QC Chart Tool
Page 9

For the most recent information and to download QC metric sets, go to
the website: www.agilent.com/en/qc- chart- tool- metric- sets.
Example use cases
Feature Extraction generates output to assist in quality assessment. A
table of array- wide, or global statistics (the “Stats” table in FE), is useful
in data quality determination for each extraction. These global statistics
capture information from every independent FE step; for example, the
numbers of outliers, the averages of negative control signal statistics, and
spike- in regression values.
The number of output fields are sometimes cumbersome without a tool for
quality assessment of each extraction. QC Chart Tool captures key global
statistics to use as metrics and create graphs for easy visual assessment of
metrics. Additionally, you can use the metrics that are used for analysis
for specific monitoring requirements.
This section provides several common use cases for the software. Although
these examples are from an earlier version of the software, the use cases
and results are the same in the current software version.
Getting Started 1
Example use cases
Use Case 1
QC Chart Tool 9
Analysis of Feature Extraction output
Feature Extraction analysis is a common way to use the QC Chart Tool
software with everyday extraction monitoring. An example of this type of
analysis was performed using a collection of microarrays from several
experiments.
Some of these microarrays were previously annotated by the operator as
having issues in the labeling, hybridization, and/or washing steps. These
microarrays had poor correlation with their replicate microarray sets, and
were chosen because they each had at least one metric flagged as having
values outside of the normal range.
This analysis of Feature Extraction consisted of:
1 A comparison to all other extractions within the extraction set.
2 A comparison to thresholds associated with the default metric set. For
information on creating metric sets, see “Defining Metrics” on page 23.
Page 10
1Getting Started
Example use cases
By default, the chart generated by QC Chart Tool shows extractions in the
order they were performed. Because QC Chart Tool has customized
sorting, color- by, and shape- by attributes, it is a powerful tool for
visualizing and highlighting trends in patterns.
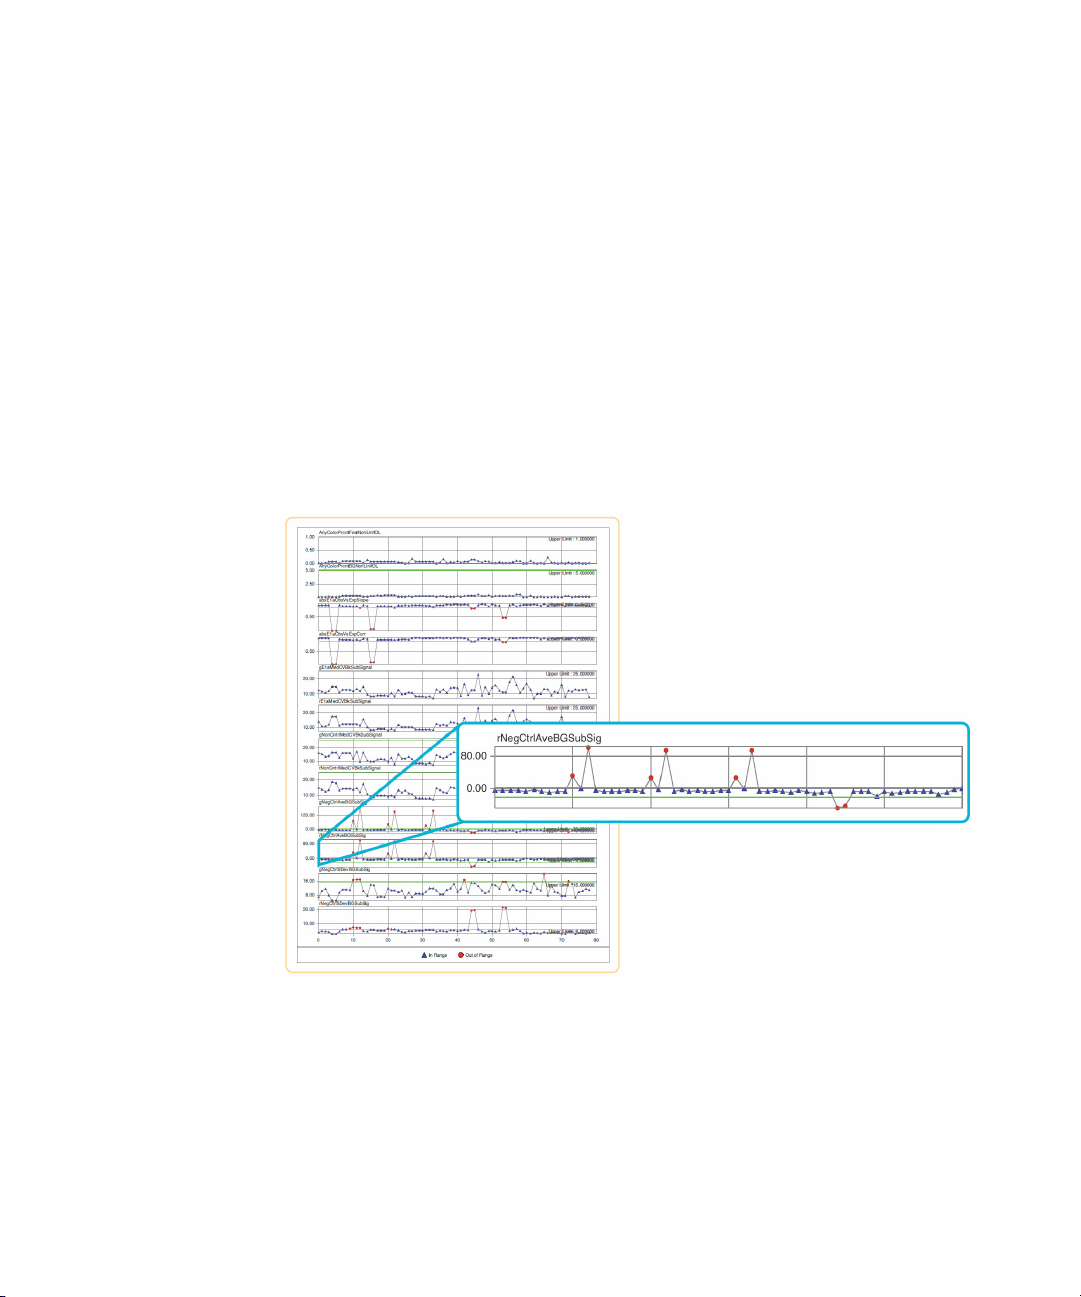
Figure 1 confirms the presence of processing artifacts and replicate
microarray outliers. The chart shows that several microarrays have more
than one metric out of normal range (represented by red circles). Values
in range are also displayed (blue triangles). The inset window zooms in on
the “rNegCtrlAveGBSubSig” metric, which is the average of the red- channel
negative- control background- subtracted signals. For more information
about Feature Extraction statistics used for metrics, see the Feature
Extraction User Guide.
Figure 1 Assessment of extraction statistics used for metrics with QC Chart Tool
10 QC Chart Tool
Page 11

Getting Started 1
Example use cases
Use Case 2
Analysis of the user effect on extraction quality
Often the effects of specific variables on extraction quality are needed in
a production setting. One such variable is the effect of the user. A
retrospective analysis of different users was generated using the following
steps in QC Chart Tool:
1 A query was created to select only those extractions of interest and
applied to a chart as the X- axis. For information on creating queries,
see “Building and Running Queries” on page 18.
2 A two- color gene expression metric set was chosen and applied to the
chart as the Y- axis. For information on creating metric sets, see
“Defining Metric Sets and Thresholds” on page 25.
3 The extractions were then color- coded to reflect the three different
operators who had processed the arrays in those extractions.
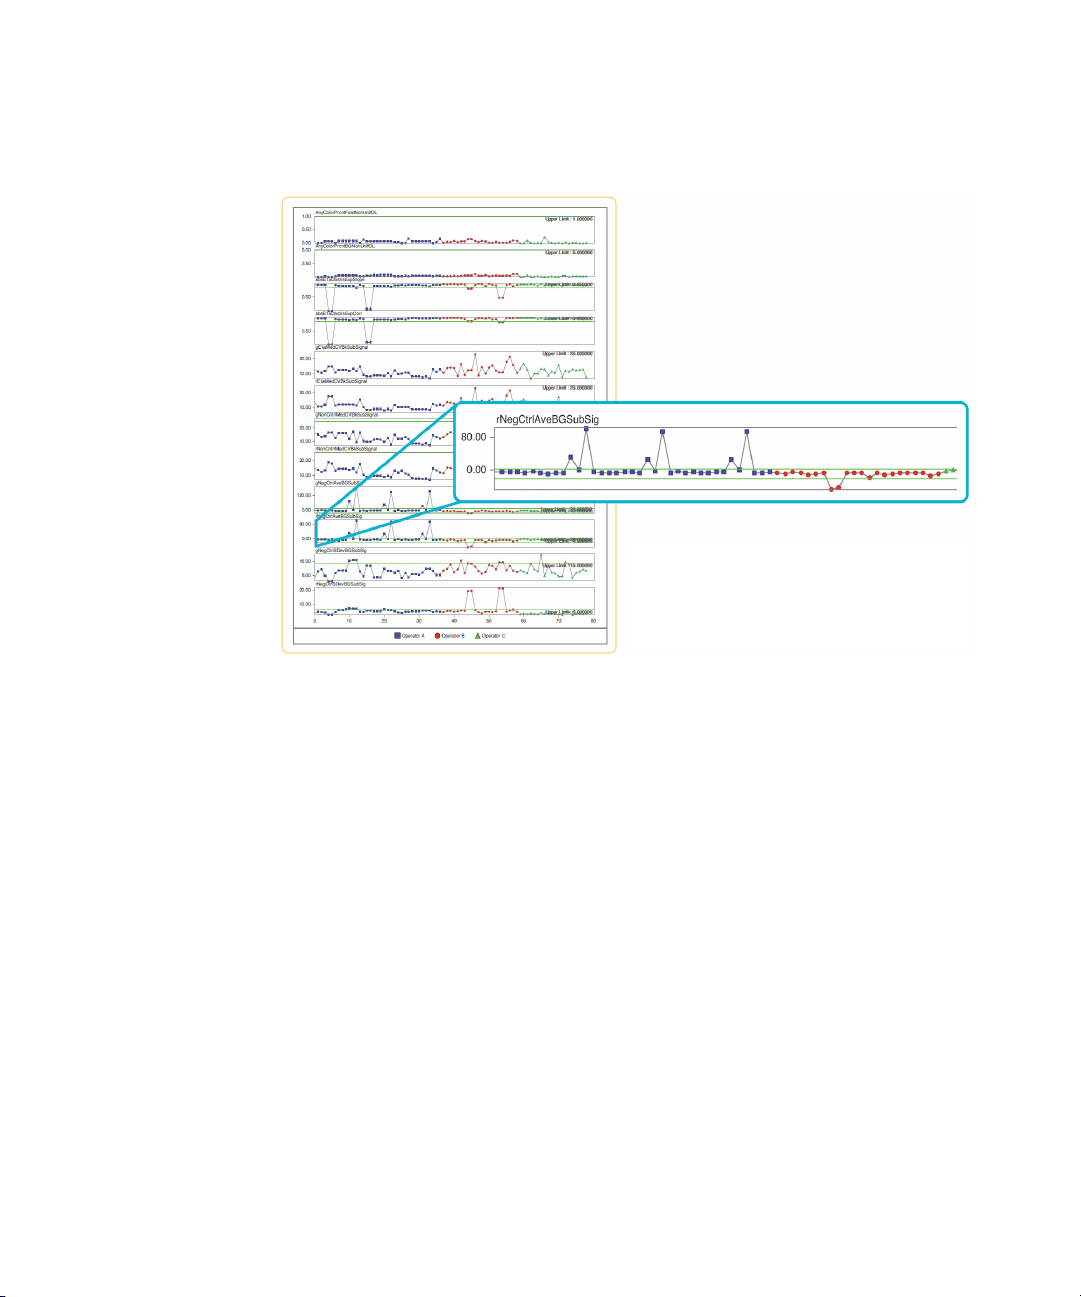
Figure 2 on page 12 shows data from microarrays processed by users A
(represented by blue squares), B (red circles), and C (green triangles).
Threshold limits appear in upper right- hand corners and as green lines
within each plot. The inset window zooms in on the
“rNegCtrlAveGBSubSig” metric, which is the average of the red- channel
negative- control background- subtracted signals. For more information
about Extraction statistics used for metrics, see the Feature Extraction
User Guide.
QC Chart Tool 11
Page 12
1Getting Started
Example use cases
Figure 2 Comparison of the effect of variable users on microarray performance using
QC Chart Tool
Use Case 3
12 QC Chart Tool
Analysis of the effect of changing the FE parameter protocols
Analysis of Extraction statistics used for metrics with the QC Chart Tool
software gives an intuitive evaluation of competing protocol methods, such
as background processing algorithms. An 18- array set was extracted with
either the default FE parameter protocol “Spatial Detrend” background
method or an alternative “Minimum Signal” background method. It was
then processed using the standard metric set in QC Chart Tool.
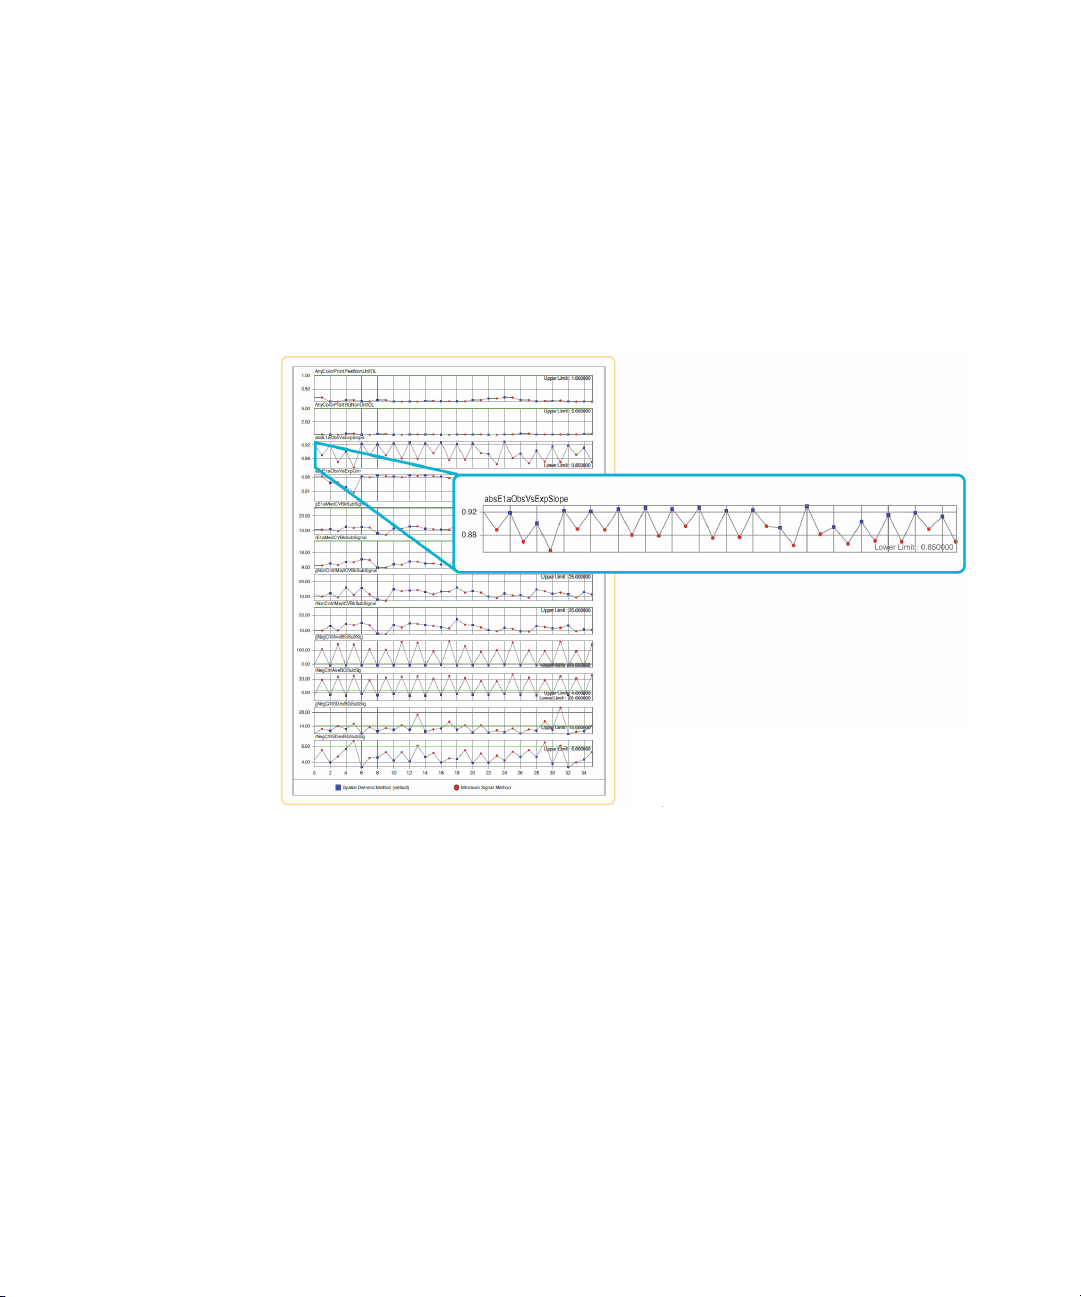
Figure 3 on page 13 shows extractions with either the default Spatial
Detrend background (represented by blue squares), or the alternate
Minimum Signal background data (red circles). For this data set, more
favorable metric values were clearly seen with the Spatial Detrend method.
This improvement is seen especially with the average negative control
background- subtracted signal, which is closer to the expected value of
zero. It is therefore a more accurate estimate of background.
Page 13
Getting Started 1
Example use cases
Additionally, under subtraction of background, as seen with the Minimum
Signal method, results in compression of log ratios. The inset window
shows a plot of observed versus expected spike- in ratios (the
“absE1aObsVsExpSlope” metric), where Spatial Detrend background yields
a slope closer to 1.0. For more information about Feature Extraction
statistics used for metrics, see the Feature Extraction User Guide.
Figure 3 Comparison of the effect of FE parameter protocols on extraction quality
QC Chart Tool 13
Page 14

1Getting Started
Example use cases
14 QC Chart Tool
Page 15

Agilent QC Chart Tool
User Guide
2
Building Queries, Metric Sets, and
Charts to Evaluate Extractions
Importing Data 16
Building and Running Queries 18
Defining Metrics 23
Defining Metric Sets and Thresholds 25
Producing and Displaying Charts 33
This chapter provides a list of how- to instructions for the tasks available
in the QC Chart Tool software. Most functionality in the QC Chart Tool is
accessible from either the command ribbon or from the object under
consideration in the Navigator.
For a description of each part of this software, including all of the dialog
boxes that can appear when you click buttons and other elements, see
Chapter 3, “QC Chart Tool Reference”.
Agilent Technologies
15
Page 16

2 Building Queries, Metric Sets, and Charts to Evaluate Extractions
NOTE
Importing Data
Importing Data
This chapter describes how to import data into QC Chart Tool. After
running an extraction in Feature Extraction, you can import quality
information from the extraction manually using the Import function in QC
Chart Tool 3.5.
To import FE statistics and parameter information
1 On the command ribbon, click Import and then click FE Stats and
Parameters. The Import FE Files dialog box appears.
2 Navigate to the Feature Extraction output files.
3 Click Open.
The Agilent Feature Extraction Importer dialog box appears with the
list of selected microarrays.
4 For microarrays that are dye flipped, under Dye Flip, click the arrow
and select Flipped. Otherwise, leave the selection Normal.
5 Click OK.
The FE quality information is added to the available extractions that
you can query and evaluate.
If you import an extraction whose ArrayID (barcode) and ExtractionName are the same as
an extraction in the database, the program prompts you to rename the duplicate extraction,
or ignore it and import the remaining extractions.
If you import an extraction that has the same Array ID (barcode) as another extraction in
the database, you are notified there are duplicate extractions for that barcode. The
extraction is imported as a new row. This can occur if you perform a second feature
extraction on the same image file, or if you washed and reused a microarray.
See Also Refer to “Chapter 3” of the Feature Extraction Reference Guide for a
description of the statistics and parameters that are imported.
16 QC Chart Tool
Page 17

Building Queries, Metric Sets, and Charts to Evaluate Extractions 2
NOTE
To import a query result
1 On the command ribbon, click Import and then click Query Result. The
Import Query Result dialog box appears.
2 Navigate to a previously exported query result file and click Open.
The program imports the extractions from the query result file. Each
extraction in the file appears as a row in the extraction table.
If there is an extraction in the table that matches an extraction in the query result file, the
extraction row in the extraction table is updated. The existing attribute values in the
extraction table for that row are overwritten with the values from the file. The values of any
attributes that are not present in the query result file will not be updated in the extraction
table.
To import a query result
QC Chart Tool 17
Page 18

2 Building Queries, Metric Sets, and Charts to Evaluate Extractions
Building and Running Queries
Building and Running Queries
QC Chart Tool has a Query builder where you can create a query for a
subset of the extractions from the Agilent QC Chart Tool database, based
on criteria that you select.
A query is used to define a subset of extractions for a representative data
set, for use in metric and threshold development, and in producing Charts.
One example is a query that contains data from similar biological samples
processed under identical conditions. Another example is to query for
different types of samples or for different processing methods. With the
latter example, you then use the different processing attributes to
color- code a chart. See “Chart Configuration dialog box” on page 54 for
information about using processing attributes. See “Example use cases” on
page 9 for examples of color- coding a chart based on the processing
attributes.
A subset of extractions is defined in a query by specific FEParameter
fields, or by user- added attribute fields.
To create a query
1 To start the query builder, on the command ribbon, click Queries and
then click New.
2 In the Column Name drop- down list, select the parameter to set.
3 In the Operator drop- down list, select the appropriate operator.
4 In the text box on the right, select the value with which to compare the
value of the Column Name parameter.
5 Click Add.
6 In the Query Name area, type a name for the query.
7 Click Save.
You can now use the query to develop thresholds for metrics or to define
a Quality chart. You can run the query, and export and save the results.
You can also rename and delete queries.
18 QC Chart Tool
Page 19

Building Queries, Metric Sets, and Charts to Evaluate Extractions 2
See Also “To edit a query” on page 20
“To run a query” on page 21
“To delete a query” on page 21
“To rename a query” on page 21
“To import a query result” on page 22
“To export a query result” on page 22
“Query Builder dialog box” on page 66
To create a composite query
1 Create a basic query as described in “To create a query” on page 18.
2 Click AND or OR.
Use AND to find extractions that meet all criteria. Use OR to find
extractions that meet at least one criterion.
3 Create the next basic query.
4 To group composite queries, click a query, then click “(” or “)”. Repeat
for the query at the other end of the group.
5 In the Query Name area, enter a name for the query. See Figure 4 on
page 20.
6 Click Save.
To create a composite query
These components and attributes are described in “Query Builder dialog
box” on page 66.
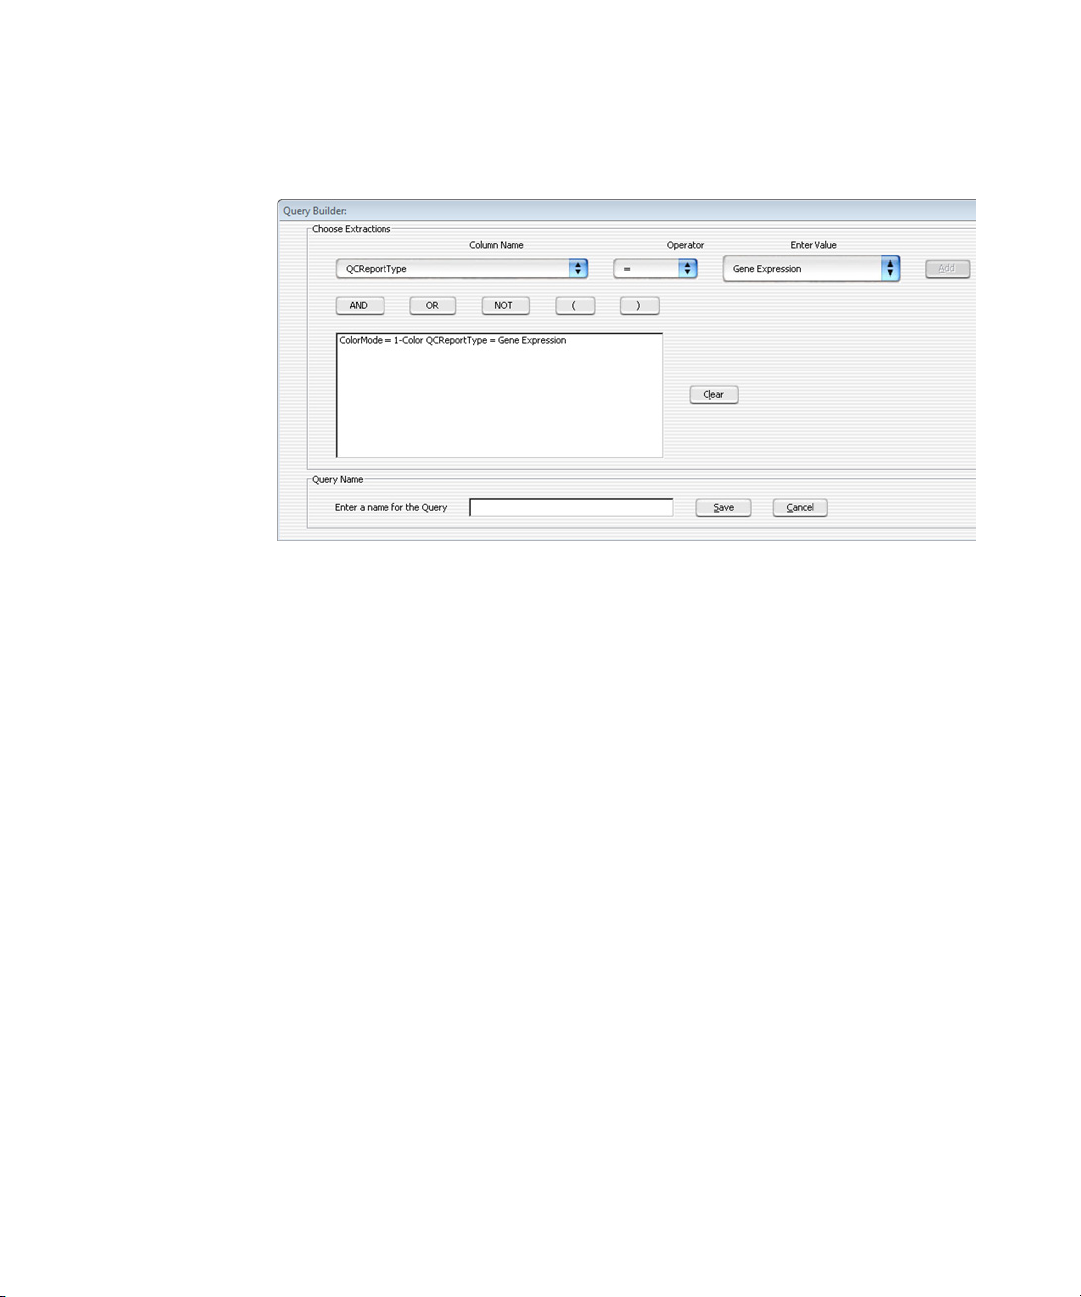
Figure 4 shows an example of a query that finds all 1- color gene
expression extractions.
QC Chart Tool 19
Page 20
2 Building Queries, Metric Sets, and Charts to Evaluate Extractions
To edit a query
Figure 4 Query Builder showing a composite query.
To edit a query
1 In the Navigator, under Queries in the Extractions pane, select the
query to edit.
2 On the command ribbon, click Queries and then click Edit.
Alternatively, right click on the query of interest and select Edit Query.
3 In the Query Builder dialog box, make any necessary changes. Click
Clear to remove all query conditions.
4 Click Save to save the query with the existing name.
OR
Click Save As to type a new name for the query and save it.
20 QC Chart Tool
Page 21

To run a query
NOTE
1 In the Navigator, under Queries in the Extractions pane, select the
query to run.
2 On the command ribbon, click Queries and then click Run.
Alternatively, right click on the query of interest and select Run Query.
To delete a query
1 In the Navigator, under Queries in the Extractions pane, select the
query to delete.
2 On the command ribbon, click Queries and then click Delete.
Alternatively, right click on the query of interest and select Delete
Query.
3 In the Delete Query dialog box, click Yes to confirm the deletion.
If a query is used in a chart, you cannot delete the query.
Building Queries, Metric Sets, and Charts to Evaluate Extractions 2
To run a query
To rename a query
1 In the Navigator, under Queries in the Extractions pane, select the
query to rename.
2 On the command ribbon, click Queries and then click Rename.
Alternatively, right click on the query of interest and select Rename
Query.
3 In the Enter New Name dialog box, type the new name for the query.
4 Click OK.
QC Chart Tool 21
Page 22

2 Building Queries, Metric Sets, and Charts to Evaluate Extractions
To import a query result
To import a query result
1 On the command ribbon, click Import and then click Query Result. The
Import Query Result dialog box appears.
2 Navigate to the previously exported query result file and click Open.
To export a query result
1 In the Navigator, in the Extractions pane, under Queries, select the
query to export.
2 On the command ribbon, click Queries and then click Export.
Alternatively, right click on the query of interest and select Export
Query.
3 In the Export Query Result dialog box, type the path and name of the
export query result file.
4 Click OK.
22 QC Chart Tool
Page 23

Defining Metrics
Metrics are defined in order for you to track desired statistical values
within a set of extractions. These metrics are associated in a metric set.
To create a new metric
1 On the command ribbon, click Metrics and then click New.
The Create a new Metric dialog box opens.
2 Select a metric from the Choose Metric Column list and then click
Add.
3 Define a new metric as an expression. Use the operator buttons and
type numbers, if needed, in the Numerical Constant text field to create
a formula.
4 In the Metric Name text box, type a name to save the new metric.
5 Click Save.
The new metric is saved to the database.
Building Queries, Metric Sets, and Charts to Evaluate Extractions 2
Defining Metrics
See Also These components and attributes are described in “Create a new Metric
dialog box” on page 55.
Example
Feature Extraction calculates a slope for the eQC spike- ins (observed
versus expected Log Ratio). Depending upon the hybridization, this
spike- in mixture is present as “+1” or “–1” polarity. If it is “–1”, then any
threshold that is set (for example, Slope > 0.85), does not pass. Therefore
you can make a derivative metric by taking the absolute of the slope.
To create this metric:
1 Click New from the Metric area of the command ribbon to open the
Create a new Metric dialog box.
2 Click Abs. The term Abs( appears in the Metric Calculation box.
3 From the Choose Metric Column list, select the statistic
eQCObsVsExpLRSlope, click Add, then select “)” to finish the expression.
4 Save the metric as Abs_eQCSlope.
QC Chart Tool 23
Page 24

2 Building Queries, Metric Sets, and Charts to Evaluate Extractions
To delete a metric
To delete a metric
1 On the command ribbon, click Metrics and then click Delete.
The Delete Metrics dialog box appears. Metrics that can be removed
from the database appear in the table. Default metrics cannot be
removed from the database.
2 Select one or more metrics you want to delete.
3 Click Delete.
If the delete button is gray, the metric is associated with one or more
metric sets. You must remove the metric from all metric sets with which it
is associated before you can remove the metric globally.
24 QC Chart Tool
Page 25

Building Queries, Metric Sets, and Charts to Evaluate Extractions 2
Defining Metric Sets and Thresholds
Metric Sets are combinations of existing metrics applied with optional
user- defined thresholds. You can save and export metric sets for future
use.
To create a metric set
1 On the command ribbon, click Metric Sets and then click New.
2 When the Metric Set Configuration dialog box appears, select the Add
Metrics to Metric Set tab.
3 Select the metrics from the Existing Metrics checklist that you want to
associate with the selected metric set.
4 Set the appropriate thresholds for the Metric. See “To set metric
thresholds in metric sets” on page 27.
5 Optional: assign an Extraction Query to the metric set.
This option is available in Standard, Robust, and Percentage Threshold
Calculation modes. An Extraction Query filters the appropriate
extractions from the database. Therefore, just the data from the queried
extractions are used in the calculation of the statistical summary values
used to set the thresholds.
6 In the Metric Set Name area, type the name for the Metric Set.
7 Click Save.
You can now display, export, and save the Metric Set. You can also
delete and rename Metric Sets.
Defining Metric Sets and Thresholds
Tip You can also create a metric set by editing an existing metric set, then
saving it with a new name as described in “To edit a metric set” on
page 26.
See Also “To view a metric set” on page 26
“To set metric thresholds in metric sets” on page 27
“To export metric sets” on page 30
“To import metric sets” on page 31
QC Chart Tool 25
Page 26

2 Building Queries, Metric Sets, and Charts to Evaluate Extractions
To edit a metric set
“To delete a metric set” on page 31
“To remove a metric from a metric set” on page 31
“To rename a metric set” on page 32
“Metric Set Configuration dialog box: Add Metrics to Metric Set tab” on
page 60
To edit a metric set
1 Select the Metric Set of interest in the Metric Sets pane of the
Navigator.
2 Click Metric Sets on the command ribbon and click Edit.
3 When the Metric Set Configuration dialog box appears, select the Add
Metrics to Metric Set tab.
4 Select or clear the metrics from the Existing Metrics checklist to add or
remove from the selected metric set.
5 Set the appropriate thresholds for the Metric. See “To set metric
thresholds in metric sets” on page 27.
6 Optional: assign an Extraction Query to the metric set.
This option is available in Standard, Robust, and Percentage Threshold
Calculation modes. An Extraction Query filters the appropriate
extractions from the database. Therefore, just the data from the queried
extractions are used in the calculation of the statistical summary values
used to set the thresholds.
7 Change the name of the Metric Set if necessary in the Metric Set Name
area. Typing a new name creates a new custom Metric Set.
8 Click Save.
To view a metric set
1 In the Navigator, in the Metric Sets panel, select the metric set to view.
2 On the command ribbon, click Metric Sets and then click View.
Alternatively, double- click the metric set in the Navigator.
3 The metric set is displayed in the window.
26 QC Chart Tool
Page 27

Building Queries, Metric Sets, and Charts to Evaluate Extractions 2
To set metric thresholds in metric sets
You can associate a threshold with a given metric at the same time that
the metric is associated with a metric set, or after the association.
1 Open the Metric Set Configuration dialog box. See “To create a metric
set” on page 25 or “To edit a metric set” on page 26.
2 Select the Add Metrics to Metric Set tab.
3 Select the metric from the Existing Metrics checklist.
4 In the Threshold Type area, select the type of threshold to associate
with the metric:
• Upper Limit
• Upper Warning Limit
• Lower Warning Limit
• Lower Limit
5 In the Threshold Calculation area, select the limit calculation type:
• Manual
• Standard
• Robust
• Percentage
The relevant calculations and their limits are displayed.
6 Optional: assign an Extraction Query to the metric set.
This option is available in Standard, Robust, and Percentage Threshold
Calculation modes. An Extraction Query filters the appropriate
extractions from the database. Therefore, just the data from the queried
extractions are used in the calculation of the statistical summary values
used to set the thresholds.
7 Edit the limits as appropriate. The text boxes accept floating point
constants.
8 If necessary, type or change the name for the metric set in the Metric
Set Name area.
9 In the Edit Thresholds dialog box, click Save Threshold to save the
threshold values for the selected metric.
10 In the Metric Set Name area at the bottom of the dialog box, click Save.
The chosen metric is saved in the metric set, along with its limits.
To set metric thresholds in metric sets
QC Chart Tool 27
Page 28

2 Building Queries, Metric Sets, and Charts to Evaluate Extractions
To set metric thresholds in metric sets
If the metric is already present, then it is updated with the new limits.
These components and parameters are described in “Metric Set
Configuration dialog box: Add Metrics to Metric Set tab” on page 60.
Threshold example
To flag extractions with a high standard deviation of background
subtracted signals:
1 Select the metric ‘gNegCtrlSDevBGSubSig’ from the Existing Metrics
checklist to associate to the selected metric set.
2 In the Threshold Type area, select Upper Limit.
3 In the Threshold Calculation area, select Standard as the limit
calculation type.
4 In the Calculations area, enter the value of 3 for the Upper Limit: Mean
+ SD* field (this number is the SD multiplier value).
5 Click Save Threshold.
6 In the Metric Set Name area, enter the name for the metric set.
7 Click Save.
The statistics of the gNegCtrlSDevBGSubSig values of all extractions are
calculated. For this example, calculations include the mean and the
standard deviation. An upper limit is then set as Mean + SD* 3, which is
shown to be the value 5.6552 in Figure 5:
28 QC Chart Tool
Page 29

Building Queries, Metric Sets, and Charts to Evaluate Extractions 2
To set metric thresholds in metric sets
Figure 5 Metric Set Configuration dialog box with settings for the threshold example
If you select the Robust type of calculation, then the median and IQR
(interquartile range) is calculated. Using the IQR, the robust equivalent of
SD is also calculated.
If you select Percentage type of calculation, then the percentiles that you
choose are calculated for an upper limit (for example, 99%), lower limit
(for example, 1%), or range (for example, 99%, 1%).
QC Chart Tool 29
Page 30

2 Building Queries, Metric Sets, and Charts to Evaluate Extractions
To export metric sets
To export metric sets
You can manually export a metric set as an XML file and reimport it in
QC Chart Tool.
• On the command ribbon, click Metric Sets and then click Export. The
Export Metric Set dialog box appears. Browse to the location where you
want to save the file, type a name for the file, and then click Export.
The following is an example of an XML Metric Set file:
<MetricSetFile>
<MetricSet
Name = “GE1_QCMT_Oct08”
isNotRemovable = “false”
CreatedOn = “13-Mar-2009 15:47”>
<Metric
Name = “DetectionLimit”
StatisticType = “0”
UpperLimitConst = “-10000.00000”
UpperWarningLimitConst = “-10000.00000”
LowerWarningLimitConst = “-10000.00000”
LowerLimitConst = “-10000.00000”
UpperLimitValue = “2.0”
UpperWarningLimitValue = “-10000.00000”
LowerWarningLimitValue = “-10000.00000”
LowerLimitValue = “0.01”
Owner = “dgd”
CreatedOn = “13-Mar-2009 15:47”
LastUpdated = “13-Mar-2009 15:47”>
</Metric>
</MetricSet>
</MetricSetFile>
30 QC Chart Tool
Page 31

Building Queries, Metric Sets, and Charts to Evaluate Extractions 2
NOTE
To import metric sets
You can import metric sets that were exported, or that were downloaded
to your computer from the Agilent website at
www.agilent.com/en/qc- chart- tool- metric- sets.
1 From the command ribbon, click Metric Sets and then select Import.
The Import Metric Set dialog box appears.
1 Browse to a location, select the metric set file, and then click Open.
2 If a warning appears that asks if you want to overwrite Threshold
settings for the matching metrics, click Yes.
You can also edit metric sets, for example, add or remove thresholds, or
edit thresholds.
You can also copy (using “Save As”) or remove Metric Sets. Once you have
copied a metric set, you can assign different metrics, and thresholds.
To delete a metric set
To import metric sets
1 In the Metric Sets panel of the Navigator, select the metric set to
remove.
2 On the command ribbon, select Metric Sets and then click Delete.
Alternatively, right- click the metric set in the Navigator and select
Delete Metric set.
You cannot delete a metric set that is used in a chart, and you cannot delete any of the
default metric sets.
To remove a metric from a metric set
1 Open the Metric Set Configuration dialog box. See “To create a metric
set” on page 25.
2 Select the Add Metrics to Metric Set tab.
3 Clear the box next to the metrics in the Existing Metrics list you want
removed from the selected metric set.
QC Chart Tool 31
Page 32

2 Building Queries, Metric Sets, and Charts to Evaluate Extractions
NOTE
NOTE
To rename a metric set
4 Click Save.
You cannot change any of the default metric sets. To change a default metric set, save it
using a new name.
To rename a metric set
1 In the Metric Sets pane of the Navigator, right- click a metric set and
then select Rename.
2 In the Enter new name dialog box, type the new name for the metric
set.
3 Click Ok.
OR
1 Open the Metric Set Configuration dialog box. See “To create a metric
set” on page 25.
2 Select the Add Metrics to Metric Set tab.
3 In the Metric Set Name area, enter a new name for the metric set.
4 Click Save.
You cannot rename a default metric set.
32 QC Chart Tool
Page 33

Building Queries, Metric Sets, and Charts to Evaluate Extractions 2
Producing and Displaying Charts
You can chart a metric set for a chosen query. The chart is defined in the
Chart Configuration dialog box. See “Chart Configuration dialog box” on
page 54 for more information.
To create a chart
1 On the command ribbon, click Chart and then select New. The Chart
Configuration dialog box appears.
2 Select the metric set use for the chart from the Metric Set drop- down
list.
3 Optional: select the Extraction Query from the drop- down list to apply
to the metric set.
If the metric set already includes an extraction query as part of the
threshold operations, then this extraction query can further reduce the
extractions displayed in the chart.
4 Optional: in the Sort by Columns area, select any ordering of the
metrics to be displayed in the chart.
5 Optional: Select the Color and shape by in/out of the threshold range
check box. This selection sets the color and shape of all points by
whether the value is in or out of range.
Otherwise, clear the Color and shape by in/out of the threshold
range check box and set the color and shape for the chart as follows:
• In the Color By area, select any color for one of the metrics to be
displayed in the chart.
• In the Shape By area, select any shape for one of the metrics to be
displayed in the chart.
6 In the Chart Name area, enter a name for the chart.
7 Click Save.
The chart can now be run. Charts can also be edited, renamed, and
deleted.
Producing and Displaying Charts
QC Chart Tool 33
Page 34

2 Building Queries, Metric Sets, and Charts to Evaluate Extractions
To view the chart
See Also “To view the chart” on page 34
“To edit a chart” on page 34
“To delete a chart” on page 34
“To rename a chart” on page 35
“Chart Configuration dialog box” on page 54
To view the chart
1 In the Navigator, in the Charts panel, select the chart to view.
2 In the command ribbon, click Chart and then click View. Alternatively,
double- click the chart in the Navigator.
3 The selected chart is displayed.
To return the view to another metric set, chart, or query result, click
the appropriate entity in the Navigator.
See Also “Disassociate Metric” on page 48
To edit a chart
1 In the Navigator, in the Charts panel, select the chart to edit.
2 In the command ribbon, click Chart and then click Edit. Alternatively,
right- click the chart in the Navigator and select Edit Chart. The Chart
Configuration dialog box appears.
3 Configure the dialog box according to your needs. See “To create a
chart” on page 33.
4 If necessary, change the name of the chart in the Chart Name area.
5 Click Save.
To delete a chart
1 In the Navigator, in the Charts panel, select the chart to delete.
2 In the command ribbon, click Chart and then click Delete.
Alternatively, right- click the chart in the Navigator and select Delete
Chart.
3 When the Delete Chart dialog box appears, click Yes.
34 QC Chart Tool
Page 35

To rename a chart
1 In the Navigator, in the Charts panel, select the chart to rename.
2 In the command ribbon, click Chart and then click Rename.
Alternatively, right- click the chart in the Navigator and select Rename
Chart. The Enter New Name dialog box appears.
3 Enter the new name for the chart, then click Ok.
Building Queries, Metric Sets, and Charts to Evaluate Extractions 2
To rename a chart
QC Chart Tool 35
Page 36

2 Building Queries, Metric Sets, and Charts to Evaluate Extractions
To rename a chart
36 QC Chart Tool
Page 37

Agilent QC Chart Tool
User Guide
3
QC Chart Tool Reference
The QC Chart Tool Window 38
Dialog Boxes 52
This chapter provides a description of each part of this software,
including all of the dialog boxes that appear when you click buttons and
other elements.
Agilent Technologies
37
Page 38

3 QC Chart Tool Reference
The QC Chart Tool Window
The QC Chart Tool Window
Figure 6 QC Chart Tool window
The QC Chart Tool software is divided into the following functional areas.
• “Command ribbon” on page 39
• “Navigator” on page 43
• “Data window” on page 47
38 QC Chart Tool
Page 39

Command ribbon
Figure 7 Command ribbon
The command ribbon has the following functions:
Import
The QC Chart Tool software uses microarray extractions imported into the
Agilent QC Chart Tool database to create meaningful metrics and
thresholds.
The following submenu options are available for Import:
QC Chart Tool Reference 3
Command ribbon
Figure 8 Import submenu
FE Stats and
Parameters
Query Results Imports results of a query previously exported using the QC Chart Tool
QC Chart Tool 39
Imports file output from Feature Extraction, specifically importing the
Stats and Parameter table information. Refer to “Chapter 3” of the Feature
Extraction Reference Guide for a description of the statistics and
parameters that are imported.
software.
Page 40

3 QC Chart Tool Reference
Command ribbon
Queries
The Agilent QC Chart Tool database captures quality columns from
microarray extractions. The software lets you query using any combination
of those quality columns.
The following submenu options are available for Queries:
Figure 9 Queries submenu
New Launches the Query Builder dialog box to create a query.
Run Executes the selected query on the database and displays the extractions
from that query in the window.
Edit Opens the Query Builder dialog box to allow the query to be changed.
Delete Permanently removes the selected query from Agilent QC Chart Tool
software.
Rename Opens the Enter New Name dialog box to change the name of the selected
query.
Export Opens the Export Query dialog box to save the results of a query to an
external tab- delimited text file.
Metrics
Metrics are defined as any combination of existing metrics. They are
created and deleted as necessary.
The following submenu options are available for Metrics:
40 QC Chart Tool
Page 41

QC Chart Tool Reference 3
Command ribbon
Figure 10 Metrics submenu
New Opens the Create a new Metric dialog box to allow definition of a new
metric.
Delete Permanently removes the selected metric from Agilent QC Chart Tool.
Metric Sets
Metric Sets are a set of metrics with optional thresholds. You can create,
delete, import, or export metric sets as necessary. You cannot delete the
default Agilent metric sets
The following submenu options are available for Metric Sets:
Figure 11 Metric Sets submenu
New Opens the Metric Set Configuration dialog box to allow the creation of a
Metric Set.
View Displays the currently selected metric set in tabular form in.
Edit Opens the Metric Set Configuration dialog box to allow you to change the
selected metric set.
Delete Permanently removes the selected metric set from Agilent QC Chart Tool.
QC Chart Tool 41
Page 42

3 QC Chart Tool Reference
Command ribbon
Rename Opens the Enter New Name dialog box to change the name of the selected
metric set.
Import Opens the Import Metric Set dialog box to import a previously exported
metric set.
Export Opens the Export Metric Set dialog box to export the selected metric set
to a tab- delimited text file.
Charts
Chart functions graphically present the software of the query and metric
functions and allow further segmentation of the data by color and shape
coding.
The following submenu options are available for Charts:
Figure 12 Charts submenu
New Opens the Chart Configuration dialog box to create a visualization of the
extraction metrics, metric sets, and thresholds.
View Opens the selected chart.
Edit Opens the Chart Configuration dialog box so that you can change the
chart.
Delete Permanently removes the selected chart from Agilent QC Chart Tool.
Rename Opens the Enter New Name dialog box to change the name of the selected
chart.
42 QC Chart Tool
Page 43

Navigator
Search term box
Resize buttons
Search button
Search term clear button
Pane list buttonScroll buttons
The Navigator consists of the Search pane, the Extractions pane, the
Metric Sets pane, and the Charts panes. These panes are described in
this section.
Search pane
The Search pane lets you find all occurrences of an entire name or
specific search string in the Navigator. It also contains several buttons that
you can use to move, hide, show, or resize the Navigator.
QC Chart Tool Reference 3
Navigator
Search term box The place where you type your desired search term. Search terms are not
QC Chart Tool 43
Figure 13 Navigator Search pane
Resize buttons Click to hide, show, or expand the Navigator.
case- sensitive, but they must reflect the entire name of an array or other
content item that you want to find. You can use asterisks (*) as wildcards
to represent groups of unspecified characters. For example, a search term
*25887* searches for any content that contains the string “25887”.
Pane list Lets you limit a search to a specific pane. Select the name of the desired
pane from the list. To select all panes, select All Panels. By default, the
software searches all panes.
Extractions Pane
This pane displays a list of query views of extractions in the database.
The query named “All” is a permanent, unchangeable query and consists
of no query parameters; it displays all extractions in the database.
Page 44
3 QC Chart Tool Reference
Navigator
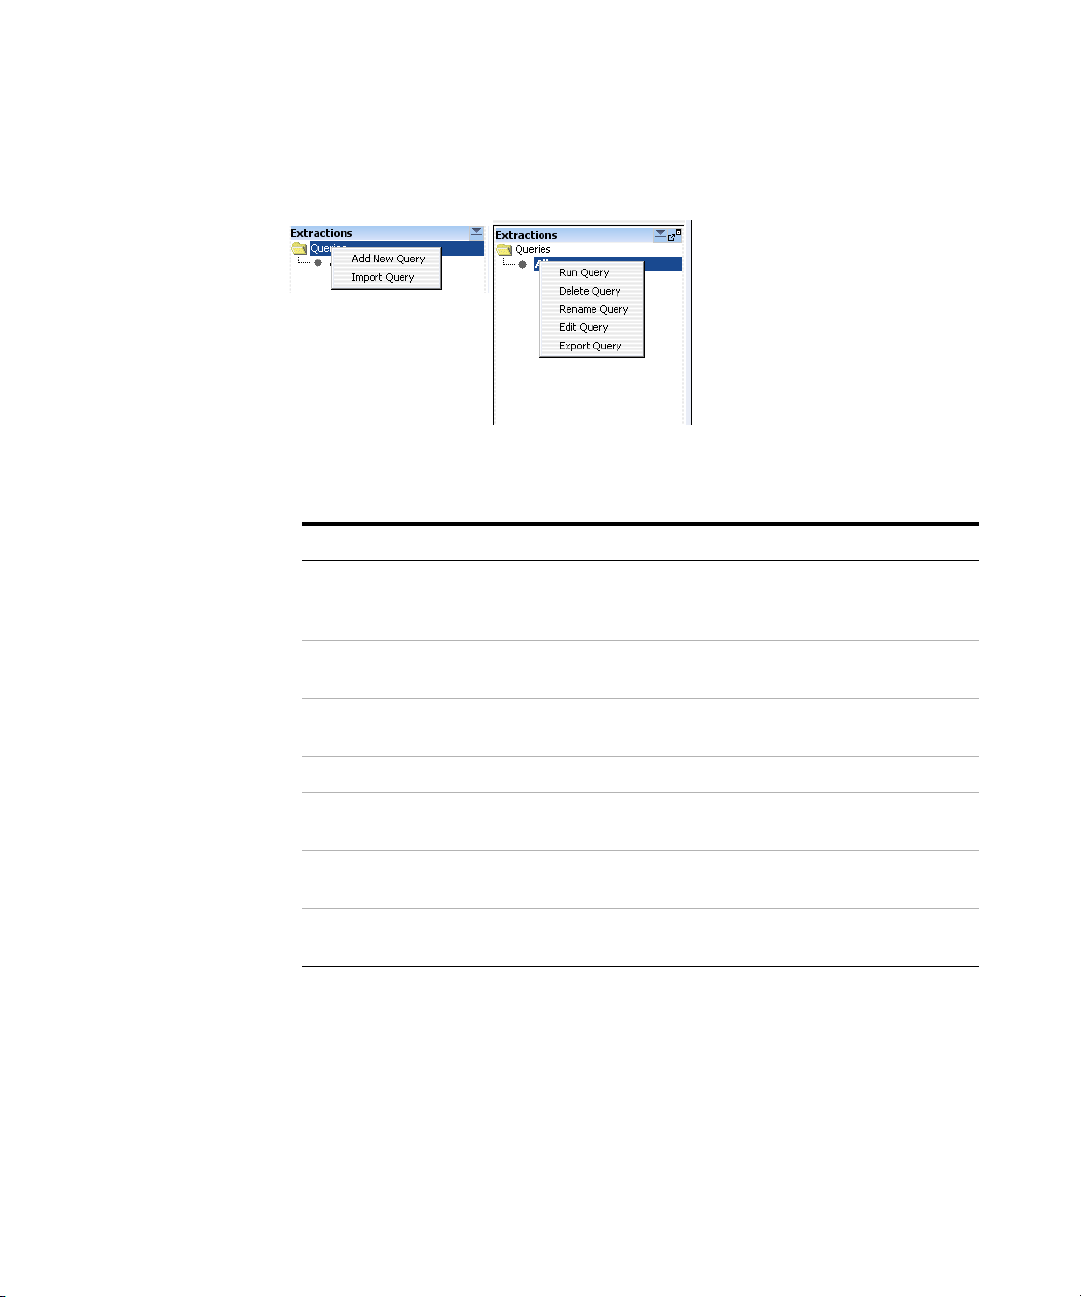
Right- click to see the following options in the Extractions pane:
Figure 14 Extractions Navigator options
Command Description
Add New Query Opens the Query Builder dialog box, where you define and
Import Query Opens the Import Query Result dialog box, where you browse
save a new Quality query. See “Query Builder dialog box” on
page 66.
to and select a query file to import.
Run Query Runs the selected query on the database and displays the
extractions from that query in the data window.
Delete Query Permanently removes the selected query.
Rename Query Opens the Enter New Name dialog box to change the name of
the selected query.
Edit Query Opens the Query Builder dialog box, identical to clicking Query
in the command ribbon and then selecting Edit.
Export Query Opens the Export Query dialog box, identical to clicking Query
in the command ribbon and then selecting Export.
Metric Sets Pane
This pane displays a list of metric sets that were created in or imported
into the software.
Right- click to see the following options in the Metric Sets pane:
44 QC Chart Tool
Page 45

QC Chart Tool Reference 3
Navigator
Figure 15 Metric Sets Navigator options
Command Description
Add New Metric set Opens the Metric Set Configuration dialog box, where you
define and save a new metric set. See “Metric Set
Configuration dialog box: Add Metrics to Metric Set tab” on
page 60.
Import Metric set Opens the Import Metric Set dialog box, where you browse to
and select a metric set file to import.
Delete Metrics Opens the Delete Metrics dialog box, where you select metrics
you want to remove from the database. See “Delete
Metrics” on page 58.
Edit Metric set Opens the Metric Set Configuration dialog box, identical to
when you click Metric Sets in the command ribbon and then
select Edit. See “Metric Set Configuration dialog box: Add
Metrics to Metric Set tab” on page 60.
Duplicate Metric set Opens the Duplicate Metric Set dialog box, which lets you
enter a name for the duplicate metric set.
Delete Metric set Permanently removes the selected metric set from the
software.
Refresh Metrics Updates the list of displayed metrics.
Rename Metric set Opens the Enter New Name dialog box to change the name of
the selected metric set.
Export Metric set Opens the Export Metric Set dialog box, identical to when you
click Metric Sets in the command ribbon and then select
Export.
QC Chart Tool 45
Page 46

3 QC Chart Tool Reference
Navigator
Charts Pane
This pane displays a list of charts that were created in or imported into
the software.
Right- click to see the following options in the Metric Sets pane:
Figure 16 Metric Sets Navigator options
Command Description
Add New Chart Appears when you right-click Charts folder. Opens the Chart
Configuration dialog box where you set up and name a new
chart. See “Chart Configuration dialog box” on page 54.
Edit Chart Opens the Chart Configuration dialog box, identical to clicking
Charts in the command ribbon and then selecting Edit. See
“Chart Configuration dialog box” on page 54.
Delete Chart Permanently removes the selected chart.
Rename Chart Opens the Enter new name dialog box to change the name of
the selected chart.
46 QC Chart Tool
Page 47

QC Chart Tool Reference 3
Data window
Data window
The data window displays the results of a selection from any pane in the
Navigator (Query, Metric set, or Chart) in the Navigator. Examples of each
pane are shown in this section.
Tip When you click a row heading in the table, the results are sorted by the
values in that column.
Data window- Extractions Table
The extractions loaded into the Agilent QC Chart Tool database are
displayed in the form of a grid- view. See Figure 17:
Figure 17 Data window - Extractions Table
To change the order of the columns in the table, drag the column headings
to the desired positions.
Data window - Metric Sets
The Metric Sets created in or imported into the software are displayed in
the form of a grid- view. See the following figure:
QC Chart Tool 47
Page 48

3 QC Chart Tool Reference
Data window
Figure 18 Data Window - Metric Sets
Disassociate
Metric
A button on the far right that lets you quickly remove a metric from a
custom Metric Set.
Data window - Charts
This pane has both a table and graphical view of the data. In the
graphical view, you can zoom in on a chart by using the mouse to drag
and release on the area to zoom. Double- click the chart to return to
normal view.
The charts view supports the operations shown in Figure 19:
48 QC Chart Tool
Page 49

QC Chart Tool Reference 3
Data window
Figure 19 Data Window - Charts
Plot Draws the chart according to the data selected in the view.
Show Frequency
Distribution
Select
All/Deselect All
Export to PDF Saves the chart in PDF format.
Export to File Exports the data from the chart to a tab- delimited text file.
Copy Chart Copies the chart to the Clipboard as a bitmap that you can paste in MS
QC Chart Tool 49
Displays a binned vertical bar chart (a histogram) of each metric selected
in the table view.
Selects all or none of the available metrics to include in the chart.
Word and MS Paint, or in any other appropriate software.
Page 50

3 QC Chart Tool Reference
Data window
The plots in this dialog box represent the selected columns in the QC
Metrics Table. Each plot shows the value of a given metric for all arrays.
These plots have several additional features:
• The background colors in each plot correspond to quality guidelines
developed by Agilent. These guidelines are based on normal ranges
observed for analyses of well- established cell lines using standard
Agilent protocols. See the descriptions of each of these metrics in the
Feature Extraction Reference Guide.
• A “Box & Whisker” plot appears to the right of the main plot for
each metric. See the following description of “‘Box & Whisker’ Plot”.
• You can right- click any bar to open a shortcut menu for the
corresponding array.
“Box & Whisker”
Plots
A small plot appears to the right of each of the main plots. It represents
the overall distribution of values for the metric. Two examples appear in
Figure 20. The symbols have the following meanings:
• The lower and upper edges of the box represent the 25th and 75th
percentiles, respectively.
• The black horizontal line in the box is the median.
• The black dot is the mean.
• The “whiskers” represent the range of values that are not outliers.
An outlier is a point that is out of the 25th to 75th percentile range
by more than 150%.
• Open circles represent outliers, and an open triangle represents
outliers that plot beyond the available space on the graph.
50 QC Chart Tool
Page 51

Figure 20 Two “Box & Whisker” plots
QC Chart Tool Reference 3
Data window
QC Chart Tool 51
Page 52

3 QC Chart Tool Reference
Dialog Boxes
Dialog Boxes
The following dialog boxes appear when using QC Chart Tool. This section
describes the components of the dialog boxes and the functions of each
component. The dialog boxes are shown in alphabetical order by title.
Agilent Feature Extraction Importer
Figure 21 Agilent Feature Extraction Importer dialog box
Purpose: Lets you edit the name of the FE data file you intend to import.
Also, lets you select to flip the red/green ratio for the data.
To open: In the command ribbon, click Import, and then click FE Stats
and Parameters. In the Import FE Files dialog box, select the desired FE
data files, then click Open.
52 QC Chart Tool
Page 53

QC Chart Tool Reference 3
Agilent Feature Extraction Importer
Extraction Name Shows the name of each microarray to import. You can change the names
of the files to names that you are more likely to recognize or remember.
Dye Flip For each array:
Select Normal if:
• The test samples were labeled with cyanine- 5 (red).
• The control samples were labeled with cyanine- 3 (green).
• The imported ratio (test/control) must be reported directly.
Select Flipped if:
• The test samples were labeled with cyanine- 3 (green).
• The control samples were labeled with cyanine- 5 (red).
• The imported ratio (control/test) must be reported with the ratio
inverted (test/control).
The software does not combine dye- flip pairs.
OK Imports the files in the foreground. You cannot use your computer for
other purposes while the import occurs.
Cancel Cancels the entire import process without importing anything.
QC Chart Tool 53
Page 54

3 QC Chart Tool Reference
Chart Configuration dialog box
Chart Configuration dialog box
Figure 22 Chart Configuration dialog box
Purpose: To configure the appearance of a Quality chart.
To open: On the Quality ribbon, click Chart and then select New.
The Chart Configuration dialog box has the following components and
functionality:
Metric Set Select the metric set to use with the chart.
Extraction Query Select the extraction query to evaluate for a chart.
Sort by Columns Select how you want to order the extractions in the chart. You can select
three conditions, and select whether to sort them in Ascending or
Descending order.
Color and shape
by in/out of the
threshold range
Color By Indicates whether to color- code extraction data points depending on
54 QC Chart Tool
When this check box is selected, the color and shape of all points are set
by whether the value is in or out of range. The Color By and Shape By
settings are ignored.
whether they fall inside or outside the threshold level. Points that are
outside the limits are color- coded in red and the ones within the limits
Page 55

QC Chart Tool Reference 3
Create a new Metric dialog box
are color- coded in blue. All the points are connected by a light- gray line.
If this check box is selected, the ShapeBy and ColorBy columns are
disabled.
Shape By Indicates what groups are used to differentiate the data points by shape.
For example, selecting Username causes all the extractions that are from a
particular user to have the same shape.
Chart Name Lets you enter a name to be associated with the chart.
Save Saves the chart using the name you entered.
Cancel Closes the Chart Configuration dialog box without saving any changes.
Create a new Metric dialog box
Figure 23 Create a new Metric dialog box
QC Chart Tool 55
Page 56

3 QC Chart Tool Reference
Create a new Metric dialog box
Purpose: Lets you create a metric in the command ribbon to track
selected statistical values for a set of extractions.
To open: On the command ribbon, click Metrics, and then select New.
The Create a new Metric dialog box has the following components and
functionality:
Choose Metric
Column
Add Selects the chosen metric and adds it to the Metric Calculations text area
Operations The following mathematical operators are available for any metric or
A list of metrics that are used to create a calculation as a new metric.
for review.
collection of metrics that are selected using the Choose Metric Column.
• Precedence of operations is left to right, except when interrupted by
parentheses.
• Operations proceed left to right inside any set of parentheses, and
inside out in terms of stacked parentheses.
+ Adds any two metrics or collection of metrics grouped by matched
parentheses.
- Subtracts any two metrics or collection of metrics grouped by matched
parentheses.
* Multiplies any two metrics or collection of metrics grouped by matched
parentheses.
/ Divides any two metrics or collection of metrics grouped by matched
parentheses.
( ) Let you subset and prioritize the mathematical operations.
, Lets you list any two metrics or collection of metrics grouped by
parenthetical operators for the evaluative operations listed.
Min Returns the smallest value from a list of metrics (or collection of metrics
grouped by matching parenthesis). The list elements are separated by the
‘,’ operator.
Max Returns the largest value from a list of metrics (or collection of metrics
grouped by matching parenthesis). The list elements are separated by the
‘,’ operator.
56 QC Chart Tool
Page 57

QC Chart Tool Reference 3
Create a new Metric dialog box
Abs Returns the absolute value of a metric or a collection of metrics grouped
by matching parenthesis.
Numerical
Constant
Add Constant
button
Lets you enter a value to add to the metric calculation formula.
Accepts the value entered in the Numerical Constant field and adds it to
the metric calculation formula.
Metric Calculations
The area in which the metric calculation formula is displayed for review.
Clear Removes all metrics, mathematical operators, and constants from the
formula in the Metric Calculations area.
Save Metric Lets you type a name to be associated with the metric.
Save Saves the metric using the name you entered.
QC Chart Tool 57
Page 58

3 QC Chart Tool Reference
Delete Metrics
Delete Metrics
Figure 24 Delete Metrics dialog box
Purpose: Used to select unnecessary metrics from the database. When you
delete a metric, it is permanently removed from the database.
To open: In the command ribbon, in the Metric Sets Navigator, right- click
the Metric Sets folder and select Delete Metrics.
Delete Deletes the selected metrics from the database.
Select All Selects all metrics.
Deselect All Removes the selection from all metrics.
Close Closes the dialog box.
58 QC Chart Tool
Page 59

Frequency Distribution
QC Chart Tool Reference 3
Frequency Distribution
Figure 25 Frequency Distribution dialog box
Purpose: The plots in this dialog box represent the selected columns in a
Quality chart. Each plot shows the number of arrays within each value
range for a metric.
To open: Click Show Frequency Distribution in the quality charts
window.
Edit Opens a menu with a Copy command that copies the plots in the dialog
box to the Clipboard. You can then paste the image into a document.
Close Closes the dialog box.
QC Chart Tool 59
Page 60
3 QC Chart Tool Reference
Metric Set Configuration dialog box: Add Metrics to Metric Set tab
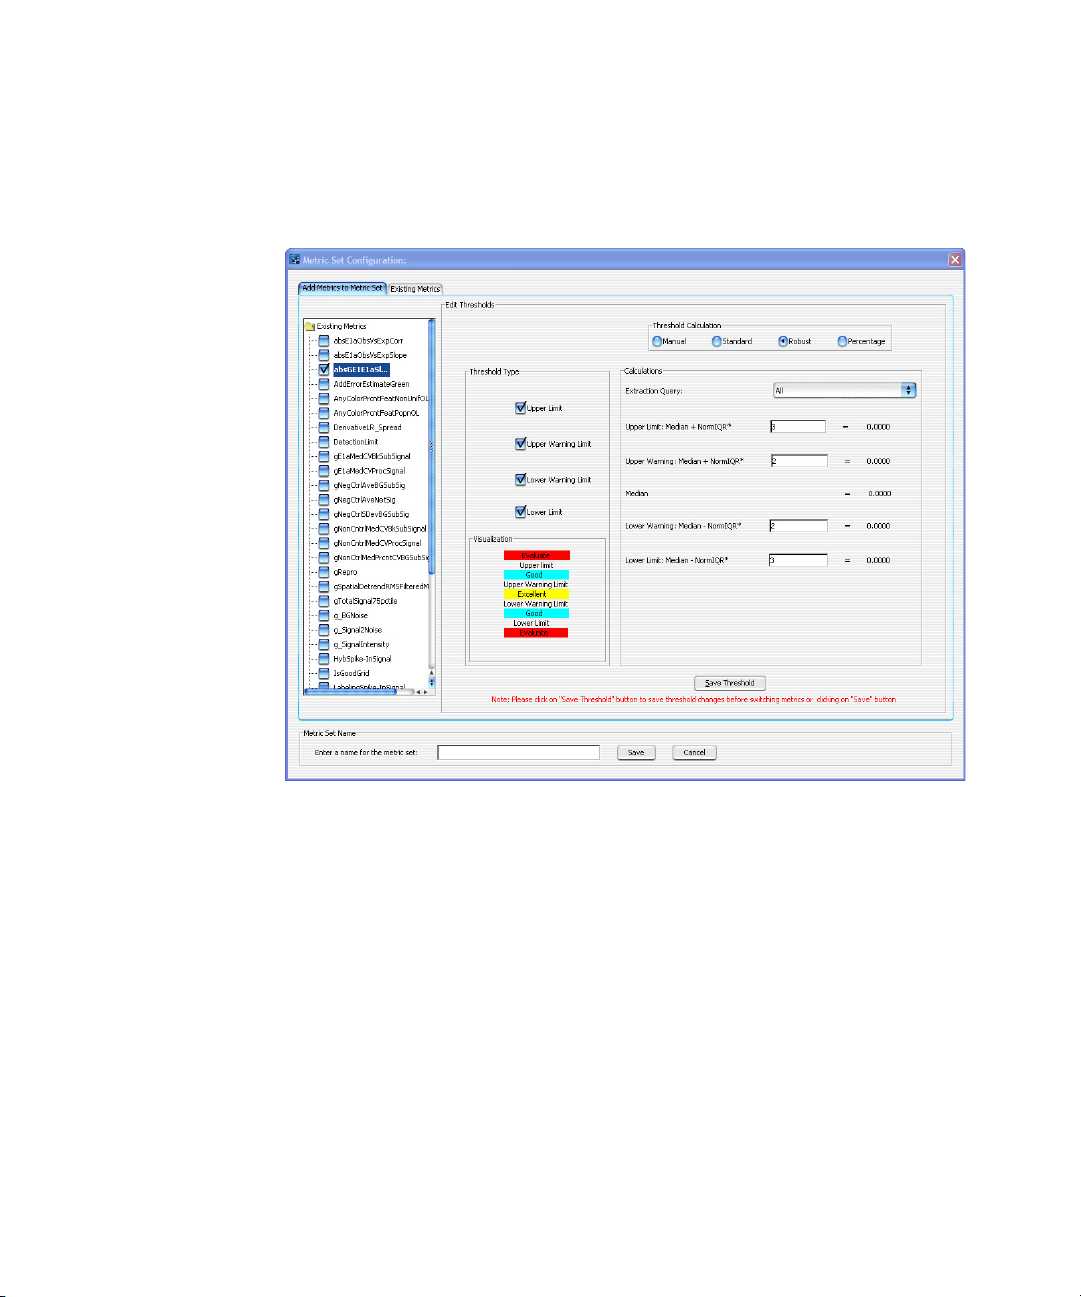
Metric Set Configuration dialog box: Add Metrics to Metric Set tab
Figure 26 Metric Set Configuration dialog box - Add Metrics to Metric Set tab
Purpose: Used to define a metric set that consists of existing metrics and
user- defined thresholds.
To open: On the command ribbon, click Metric Sets, and then click New.
The Add Metrics to Metric Set tab of the Metric Set Configuration dialog
box has the following components and functionality:
Existing Metrics Displays a list of the metrics that you can use in the metric set.
Threshold Type
The following fields are threshold types, which are used to select which
thresholds to apply and display.
60 QC Chart Tool
Page 61

QC Chart Tool Reference 3
Metric Set Configuration dialog box: Add Metrics to Metric Set tab
Upper Limit Sets a limit where extraction values that are greater than the limit
calculation are displayed in the color red and flagged as “Evaluate”.
Extractions with metric values lower than this limit are displayed in the
color blue and flagged as “Good”, unless there are additional limits
selected that further separate the extractions.
Upper Warning
Limit
Lower Warning
Limit
LowerLimit Sets a limit where extraction values for the appropriate metric that are
Sets a limit where extraction values that are greater than the limit
calculation are displayed in the color blue and flagged as “Good”.
Extractions with metric values lower than this limit are displayed in the
color yellow and flagged as “Excellent”, unless there are additional limits
selected that further separate the extractions.
Sets a limit where extraction values for the appropriate metric that are
less than the limit calculation are displayed in the color blue and flagged
as “Good”. Extractions with metric values higher than this limit are
displayed in the color yellow and flagged as “Excellent”, unless there are
additional limits selected that further separate the extractions.
less than the limit calculation are displayed in the color red and flagged
as “Evaluate”. Extractions with metric values higher than this limit are
displayed in the color blue and flagged as “Good”, unless there are
additional limits selected that further separate the extractions.
Threshold Calculation
Manual Applies a constant value for Upper Limit, Upper Warning Limit, Lower
Warning Limit, and LowerLimit.
Standard Takes a constant value as the number of standard deviations of the data
beyond the mean to calculate the limit. For detailed information, see
“Standard Threshold Calculations” on page 62.
Robust Takes a constant value as the number of inter- quartile ranges (IQR) of the
data beyond the mean to calculate the limit. For detailed information, see
“Robust Threshold Calculations” on page 62.
Percentage Takes a percentage range of the data to calculate the limit. For detailed
information, see “Percentage Threshold Calculations” on page 63.
QC Chart Tool 61
Page 62

3 QC Chart Tool Reference
Metric Set Configuration dialog box: Add Metrics to Metric Set tab
Extraction Query Optional: Lets you assign an Extraction Query to the metric set for
Standard, Robust, and Percentage Threshold Calculation modes. This query
filters the appropriate extractions from the database, so that just the data
from the queried extractions are used in the calculation of the statistical
summary values used to set the thresholds.
Standard Threshold Calculations
Take a constant value as the number of standard deviations of the data
beyond the mean to calculate the limits.
Upper Limit Lets you define a multiplier for the number of standard deviations to add
to the mean to create the Upper Limit. For example, to apply an upper
limit of two standard deviations, enter the number 2 in the text field. The
Upper Limit is defined as the mean + constant*SD.
Upper Warning
Limit
Lower Warning
Limit
LowerLimit Lets you define a multiplier for the number of standard deviations to
Lets you define a multiplier for the number of standard deviations to add
to the mean to create the Upper Warning Limit. The Upper Warning Limit
is defined as the mean + constant*SD.
Lets you define a multiplier for the number of standard deviations to
subtract from the mean to create the Lower Warning Limit. The Lower
Warning Limit is defined as the mean - constant*SD.
subtract from the mean to create the Lower Limit. The Lower Limit is
defined as the mean - constant*SD.
Robust Threshold Calculations
Take a constant value as the number of inter- quartile ranges (IQR) of the
data beyond the mean to calculate the limits.
Upper Limit Lets you define a multiplier for the number of IQRs to add to the mean to
create the Upper Limit. For example, to apply an upper limit of 2 IQR,
enter the number 2 in the text field. The Upper Limit is defined as the
Median + constant*IQR.
Upper Warning
Limit
Lets you define a multiplier for the number of IQRs to add to the mean to
create the Upper Warning Limit. The Upper Warning Limit is defined as
the Median + constant*IQR.
62 QC Chart Tool
Page 63

QC Chart Tool Reference 3
Metric Set Configuration dialog box: Add Metrics to Metric Set tab
Lower Warning
Limit
LowerLimit Lets you define a multiplier for the number of IQRs to subtract from the
Lets you define a multiplier for the number of IQRs to subtract from the
mean to create the Lower Warning Limit. The Lower Warning Limit is
defined as the Median - constant*IQR.
mean to create the Lower Limit. The Lower Limit is defined as the Median
- constant*IQR.
Percentage Threshold Calculations
Take a percentage range of the data to calculate the limits.
Upper Limit Lets you define percentage from the uppermost values of the data to
calculate the Upper Limit. For example, to set an Upper Limit that is
equal to the best 1% of the extractions for a particular metric, set the
Upper Limit text box to 99%.
Upper Warning
Limit
Lower Warning
Limit
Lets you define a multiplier for the percentage from the uppermost values
of the data to calculate the Upper Warning Limit. For example, to set an
Upper Warning Limit that is equal to the best 25% of the extractions for a
particular metric, set the Upper Warning Limit text box to 75%.
Lets you define percentage from the bottommost values of the data to
calculate the Lower Warning Limit. For example, to set a Lower Warning
Limit that is equal to the lower 25% of the extractions for a particular
metric, set the Lower Warning Limit text box to 25%.
Lower Limit Lets you define percentage from the bottommost values of the data to
calculate the Lower Limit. For example, to set a Lower Limit that is equal
to the lower 1% of the extractions for a particular metric, set the Lower
Limit text box to 1%.
Save Threshold Saves the threshold settings for the selected metrics. These metrics with
their associated thresholds become available in the “Metric Set
Configuration dialog box: Selected/Existing Metrics tab” on page 64.
Metric Set Name Lets you enter a name for the new metric set.
Save Saves the metric set.
Cancel Closes the Metric Set Configuration dialog box without saving any changes.
QC Chart Tool 63
Page 64

3 QC Chart Tool Reference
Metric Set Configuration dialog box: Selected/Existing Metrics tab
Metric Set Configuration dialog box: Selected/Existing Metrics tab
Figure 27 Metric Set Configuration dialog box - Selected/Existing Metrics tab.
Purpose: Used to display existing/selected metrics in a metric set.
To open: In the Metric Set Configuration dialog box, click the Existing
Metrics or Selected Metrics tab.
The Selected/Existing Metrics tab of the Metric Set Configuration dialog
box has the following components and functionality:
Table
The Metric Sets created in or imported into the software are displayed in
the form of a table, or grid- view.
The column headers appear in this order:
64 QC Chart Tool
Page 65

Metric Set Configuration dialog box: Selected/Existing Metrics tab
• Metric Name
• Expression
• Upper Limit
• Upper Warning Limit
• Lower Warning Limit
• Lower Limit
• Calculation Type
• Defined By
• Date Created
• Date Modified
Metric Set Name Lets you enter a name to save the metric set.
Save Saves the existing metric set with the previously defined name.
Save As Saves the metric set with a newly defined name.
Cancel Closes the Metric Set Configuration dialog box without saving any changes.
QC Chart Tool Reference 3
QC Chart Tool 65
Page 66

3 QC Chart Tool Reference
Query Builder dialog box
Query Builder dialog box
Figure 28 The Query Builder dialog box
Purpose: Used to define a subset of extractions for a representative data
set, for use in metric and threshold development, and in producing Charts.
To open: In the command ribbon, click Queries and then click New.
The Query Builder dialog box has the following components and
functionality:
Column Name Displays a list of the metrics that you can use to create an expression
with which to query the database.
Operator Displays a list of the relational operators that you can use with the
selected metric.
Enter Value A text area where a value is typed that is compared to the metric for each
extraction. If the chosen relation between the metric and value is valid,
the query produces extractions that pass that condition (for which the
relation between the metric and value is true).
Operations The following buttons are logical operations used to link two or more
metric- value relations built using the functions listed previously. Each
logical operation can link two metric- value relations at a time.
66 QC Chart Tool
Page 67

QC Chart Tool Reference 3
Query Builder dialog box
AND Produces a complex query which is true only if both metric- value
relations are true.
OR Produces a complex query which is true if either metric- value
relations are true.
NOT Produces a complex query which is true only if both metric- value
relations are not true.
( ) Lets you create a subset for and prioritize the complex query.
Text area The area in which complex relations using the logical operations are listed
for review.
Query Name A text area for entering a name under which to save the query.
Save Saves the query using the name specified in the Query Name field.
Cancel Cancels all query operations and closes the Query Builder dialog box.
QC Chart Tool 67
Page 68

www.agilent.com
In This Book
This book contains
information to set up and
use the QC Chart Tool
software with Agilent
Feature Extraction.
Agilent Technologies, Inc. 2015, 2018,
2021
Revision C0, January 2021
*G4460-90048*
G4460-90048
Agilent Technologies
 Loading...