

Page 1
PD-L1 IHC 22C3 pharmDx
Interpretation Manual –
Non-small Cell Lung Cancer (NSCLC)
CE-IVD–marked for in vitro diagnostic use
Page 2

PD-L1 IHC 22C3 pharmDx Interpretation Manual – NSCLC
For countries outside of the European Union, see the local KE YTRUDA product
label for approved indications and expression cutoff values to guide therapy.
2
Page 3

Table of Contents
PD-L1 IHC 22C3 pharmDx Interpretation Manual – NSCLC
Intended Use 04
Introduction 06
PD-L1 Overview 08
PD-L1 IHC 22C3 pharmDx Overview 10
Kit Configuration (SK006) 11
Technical Considerations 12
Specimen Preparation 12
In-house Control Tissue 12
Optional Additional In-house Control: Tonsil Tissue 13
Tissue Processing 13
PD-L1 IHC 22C3 pharmDx Staining Procedure 14
Technical Checklist 17
Clinical Interpretation Guidelines 18
General Considerations 18
Specimen Adequacy 18
Evaluating Controls 19
Slide Evaluation Flowchart 23
Evaluate Staining and Determine Tumor Proportion Score 24
Definition of Tumor Proportion Score (TPS) 24
Evaluation of PD-L1 Staining 24
Guidelines and Methods to Determine Tumor Proportion Score 25
Scoring Guidelines 26
Suggested Methods for Determining TPS 27
Identifying Patients With NSCLC for Treatment 29
Reporting Results 31
PD-L1 Staining Characteristics 32
Key Considerations in Scoring PD-L1 IHC 22C3 pharmDx 32
Stained Specimens
Image Guide for Interpretation of PD-L1 IHC 22C3 pharmDx 33
Staining in NSCLC
PD-L1 IHC 22C3 pharmDx TPS < 1% Case Examples 39
PD-L1 IHC 22C3 pharmDx TPS 0–10% Case Examples 43
PD-L1 IHC 22C3 pharmDx TPS 1–49% Case Examples 48
PD-L1 IHC 22C3 pharmDx TPS ≥ 50% Case Examples 52
PD-L1 IHC 22C3 pharmDx TPS 40–60% Case Examples 59
Artifacts 64
Troubleshooting Guide 69
Clinical Performance Evaluation 70
References 80
3
Page 4

PD-L1 IHC 22C3 pharmDx Interpretation Manual – NSCLC
Intended Use
For in vitro diagnostic use.
PD-L1 IHC 22C3 pharmDx is a qualitative immunohistochemical assay using
monoclonal mouse anti-PD-L1, Clone 22C3, intended for use in the detection of
PD-L1 protein in formalin-fixed, paraffin-embedded (FFPE) non-small cell lung
cancer (NSCLC), urothelial carcinoma, head and neck squamous cell carcinoma
(HNSCC), and melanoma tissues using EnVision FLEX visualization system on
Autostainer Link 48.
PD-L1 protein expression in NSCLC is determined by using Tumor Proportion
Score (TPS), which is the percentage of viable tumor cells showing partial or
complete membrane staining at any intensity.
PD-L1 protein expression in urothelial carcinoma is determined by using
Combined Positive Score (CPS), which is the number of PD-L1 staining cells
(tumor cells, lymphocytes, macrophages) divided by the total number of viable
tumor cells, multiplied by 100.
KEYTRUDA is a registered trademark of
Merck Sharp & Dohme Corp., a subsidiary of
Merck & Co., Inc.
PD-L1 protein expression in HNSCC is determined by using CPS and/or TPS.
Companion diagnostic indications
Tumor
Indication
NSCLC TPS ≥ 1%
Urothelial
Carcinoma
PD-L1
Expression Level Intended Use
PD-L1 IHC 22C3 pharmDx is indicated as an
TPS ≥ 50%
aid in identifying NSCLC patients for treatment
with KEYTRUDA
®
(pembrolizumab).*
CPS ≥ 10 PD-L1 IHC 22C3 pharmDx is indicated as
an aid in identifying urothelial carcinoma
patients for treatment with KEYTRUDA
(pembrolizumab).*
HNSCC CPS ≥ 1
TPS ≥ 50%
PD-L1 IHC 22C3 pharmDx is indicated
as an aid in identifying HNSCC patients
for treatment with KEYTRUDA
®
(pembrolizumab).*
* See the KEYTRUDA® product label for PD-L1 expression cutoff values and
specific clinical circumstances guiding therapy.
®
4
Page 5
PD-L1 IHC 22C3 pharmDx Interpretation Manual – NSCLC
5
Page 6

PD-L1 IHC 22C3 pharmDx Interpretation Manual – NSCLC
Introduction
PD-L1 IHC 22C3 pharmDx is the only clinical trial-proven companion diagnostic
CE-IVD–marked as an aid in identifying patients with NSCLC for treatment
®
with KEYTRUDA
is provided as a tool to help guide pathologists and laboratory personnel in
achieving correct and reproducible results in assessing PD-L1 expression
in formalin-fixed, paraffin-embedded non-small cell lung cancer (NSCLC)
specimens. PD-L1 expression evaluation may be used to identify patients for
anti-PD-1 immunotherapy.
The manual provides detailed scoring guidelines and technical information
from the PD-L1 IHC 22C3 pharmDx Instructions for Use (IFU) to ensure highquality staining and diagnostic assessment. To help familiarize you with the
requirements for scoring NSCLC stains with PD-L1 IHC 22C3 pharmDx, example
cases of various PD-L1 expression levels are provided as references. These
example cases and in-depth recommendations for interpretation of NSCLC
specimens stained with PD-L1 IHC 22C3 pharmDx can help individual labs
achieve reproducible and reliable results.
(pembrolizumab) monotherapy. This Interpretation Manual
PD-L1 IHC 22C3 pharmDx is considered a qualitative immunohistochemical
assay. PD-L1 protein expression in NSCLC is determined by using Tumor
Proportion Score (TPS), which is the percentage of viable tumor cells showing
partial or complete membrane staining at any intensity.
NSCLC tissue specimens that are tested for PD-L1 expression are scored and
divided into expression levels based on a Tumor Proportion Score (TPS):
– TPS < 1%
– TPS ≥ 1%
– TPS ≥ 50%
PD-L1 expression levels are used to inform patient eligibility for treatment with
KEYTRUDA monotherapy. For more details on staining and interpretation, please
refer to the current version of the IFU provided with PD-L1 IHC 22C3 pharmDx,
Code SK006 or visit www.agilent.com.
6
Page 7

PD-L1 IHC 22C3 pharmDx Interpretation Manual – NSCLC
Assay Interpretation
The clinical interpretation of any staining, or the absence of staining, must be
complemented by the evaluation of proper controls. Evaluation must be made by
a qualified pathologist within the context of the patient’s clinical history and other
diagnostic tests. This product is intended for in vitro diagnostic (IVD) use.
Reporting Results
To help understand what information should be reported to the treating physician,
please refer to the Reporting Results section of this manual on page 31.
Photomicrographs
The included photomicrographs are of NSCLC unless otherwise noted.
Note: Photomicrograph magnification levels may appear different from indicated
in respective annotations due to adjustment of image size.
7
Page 8

PD-L1 IHC 22C3 pharmDx Interpretation Manual – NSCLC
PD-L1 Overview
The PD-1/PD-L1 Pathway
Controls the Immune
Response in Normal Tissue
The Tumor Escapes
Detection by Utilizing the
PD-1/PD-L1 Pathway
Anti-PD-1 Therapy Enables
the Immune Response
Against Tumors
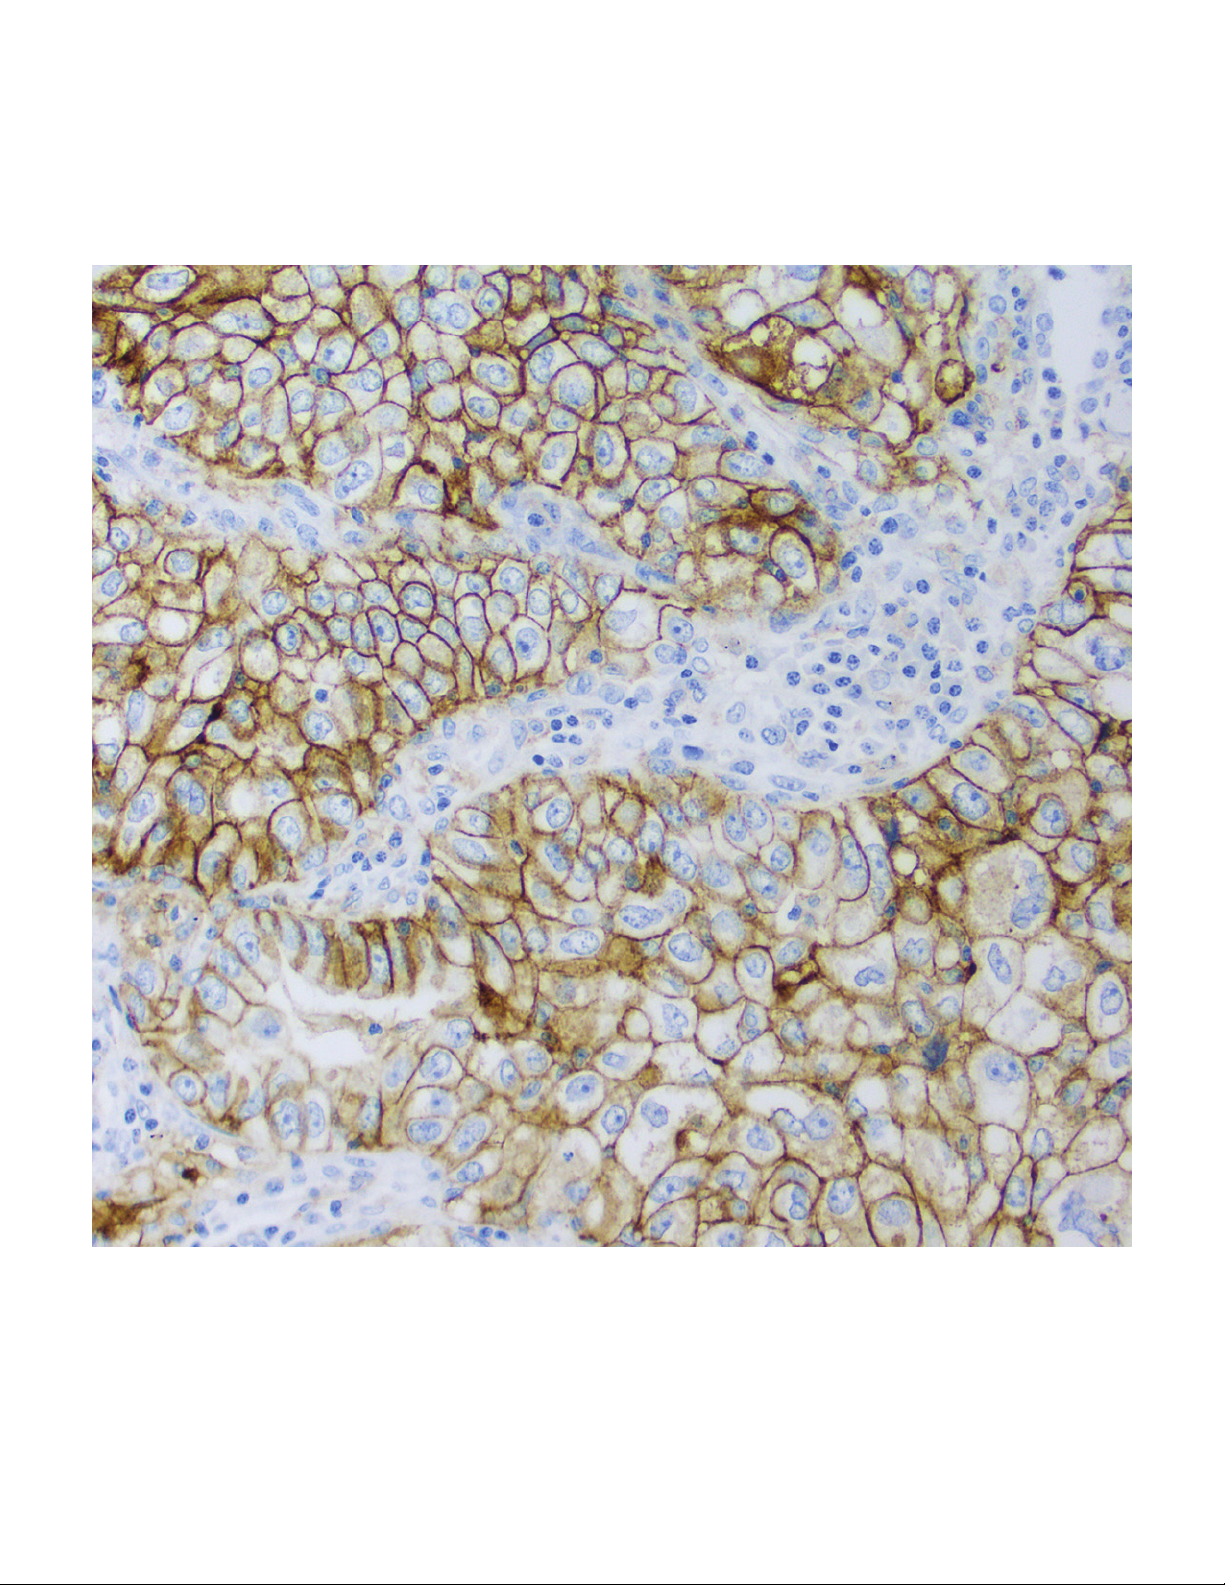
Programmed death-ligand 1 (PD-L1) is a transmembrane protein that binds to
the programmed death-1 receptor (PD-1) during immune system modulation.
The PD-1 receptor is typically expressed on cytotoxic T-cells and other immune
cells, while the PD-L1 ligand is typically expressed on normal cells. Normal cells
use the PD-1/PD-L1 interaction as a mechanism of protection against immune
recognition by inhibiting the action of T-cells (Figure 1). Inactivation of cytotoxic
T-cells downregulates the immune response such that the inactive T-cell is
exhausted, ceases to divide, and might eventually die by programmed cell death,
or apoptosis.
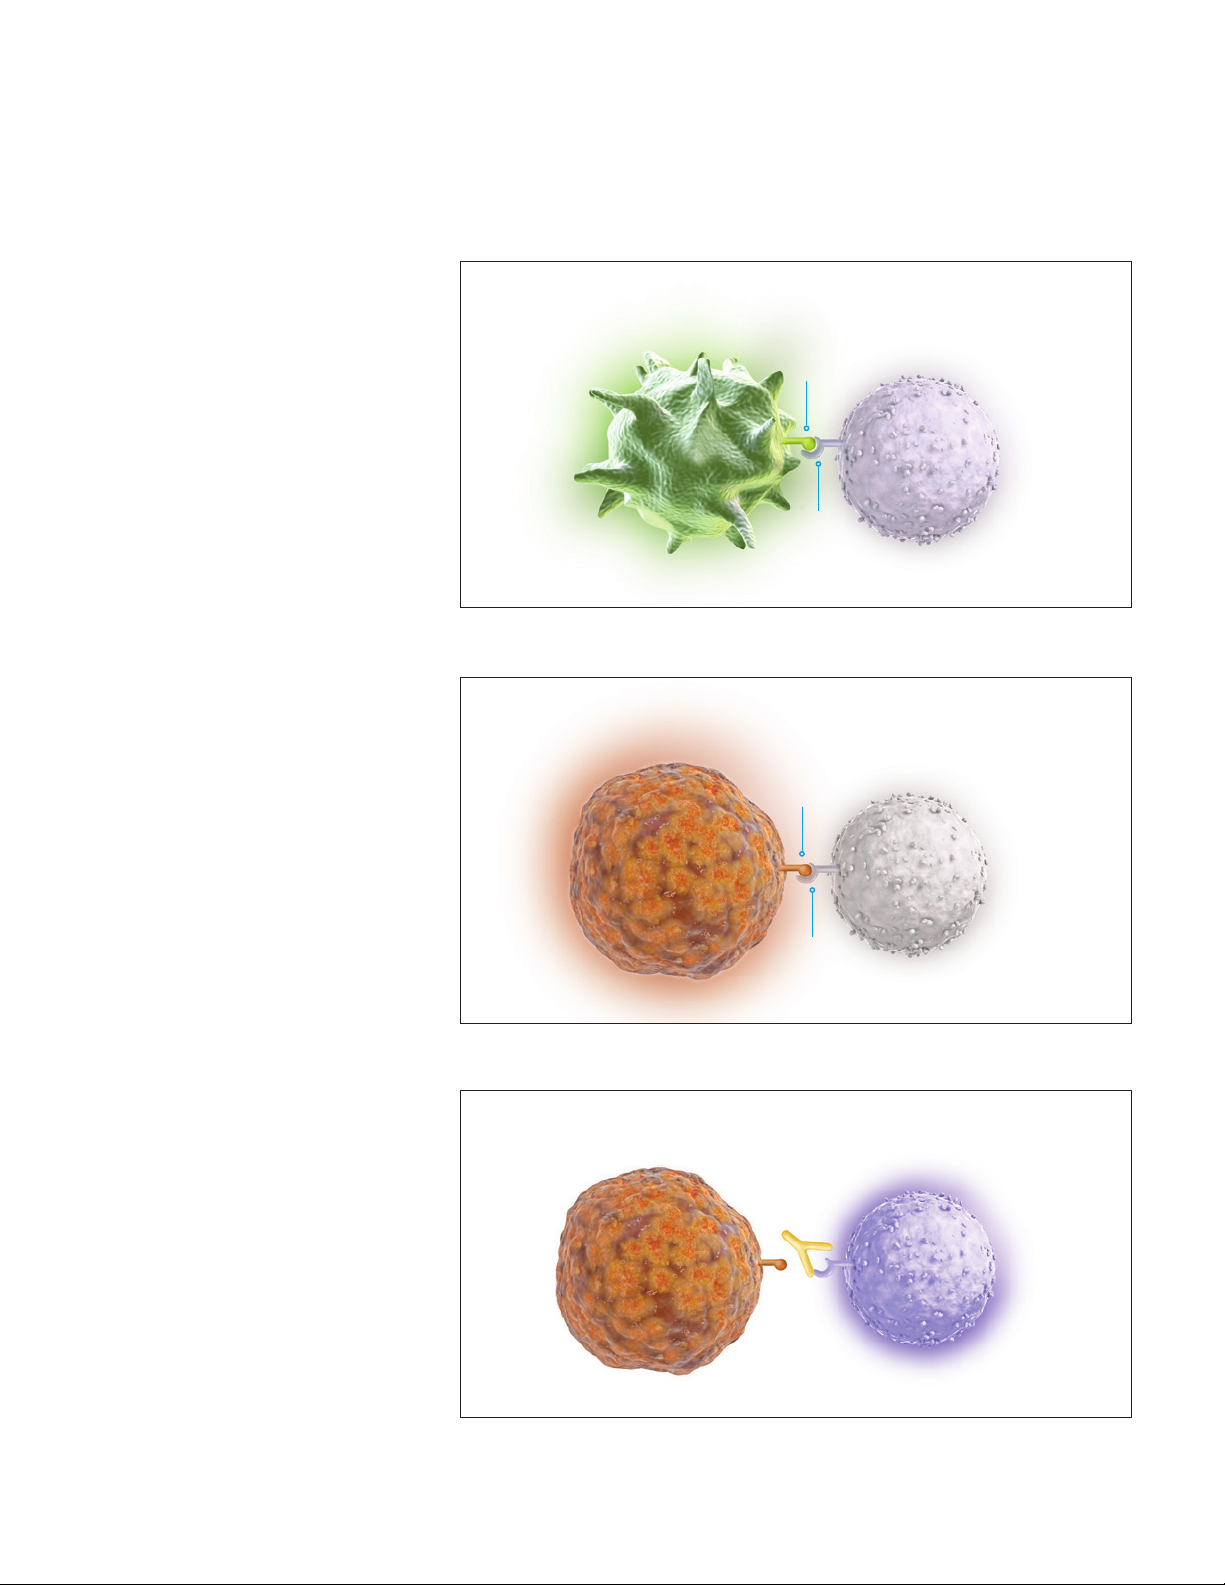
Many tumor cells are able to upregulate the expression of PD-L1 as a mechanism
to evade the body’s natural immune response. Activated T-cells recognize the
PD-L1 marker on the tumor cell, similar to that of a normal cell, and PD-L1
signaling renders the T-cell inactive (Figure 2). The tumor cell escapes the
immune cycle, continues to avoid detection for elimination, and is able
to proliferate.
PD-1/PD-L1 interaction between tumor cells and activated T-cells (Figure 3) is a
mechanistic pathway used by immunotherapeutic agents. When the tumor cell
is unable to interact with the activated T-cell, the immune system remains active,
helping to prevent immunosuppression.
PD-L1 IHC 22C3 pharmDx
Detects PD-L1 in
NSCLC Specimens
8
PD-L1 upregulation in NSCLC is a biomarker for response to anti-PD-1 therapy.
PD-L1 IHC 22C3 pharmDx was the only companion diagnostic used in the
®
KEYTRUDA
and KEYNOTE-042) to evaluate the relationship between PD-L1 expression and
clinical efficacy. KEYTRUDA is a humanized monoclonal PD-1-blocking antibody.
(pembrolizumab) clinical trials (KEYNOTE-010, KEYNOTE-024,
Page 9
The PD-1/PD-L1 Pathway
PD-L1 IHC 22C3 pharmDx Interpretation Manual – NSCLC
PD-L1 expressing cell
Figure 1: Inactivation of T-cells limits damage to normal tissue.
Tumor cell
Inactive cytotoxic T-cell
PD-L1
PD-1
Inactive cytotoxic T-cell
PD-L1
PD-1
Figure 2: Inactivation of T-cells reduces tumor cell death and elimination.
Tumor cell
Anti-PD-1
therapy
Figure 3: Blocking the PD -1/PD- L1 interaction helps to enable active T-cells and tumor cell death
and elimination.
Active cytotoxic T-cell
9
Page 10
PD-L1 IHC 22C3 pharmDx Interpretation Manual – NSCLC
PD-L1 IHC 22C3 pharmDx Overview
What is PD-L1 IHC 22C3 pharmDx?
PD-L1 IHC 22C3 pharmDx is the only clinical trial-proven companion diagnostic
indicated as an aid in identifying patients with NSCLC for treatment with
®
KEYTRUDA
qualitative immunohistochemical (IHC) assay intended for use in the detection of
PD-L1 protein in formalin-fixed, paraffin-embedded (FFPE) NSCLC tissue samples
using EnVision FLEX visualization system on Autostainer Link 48.
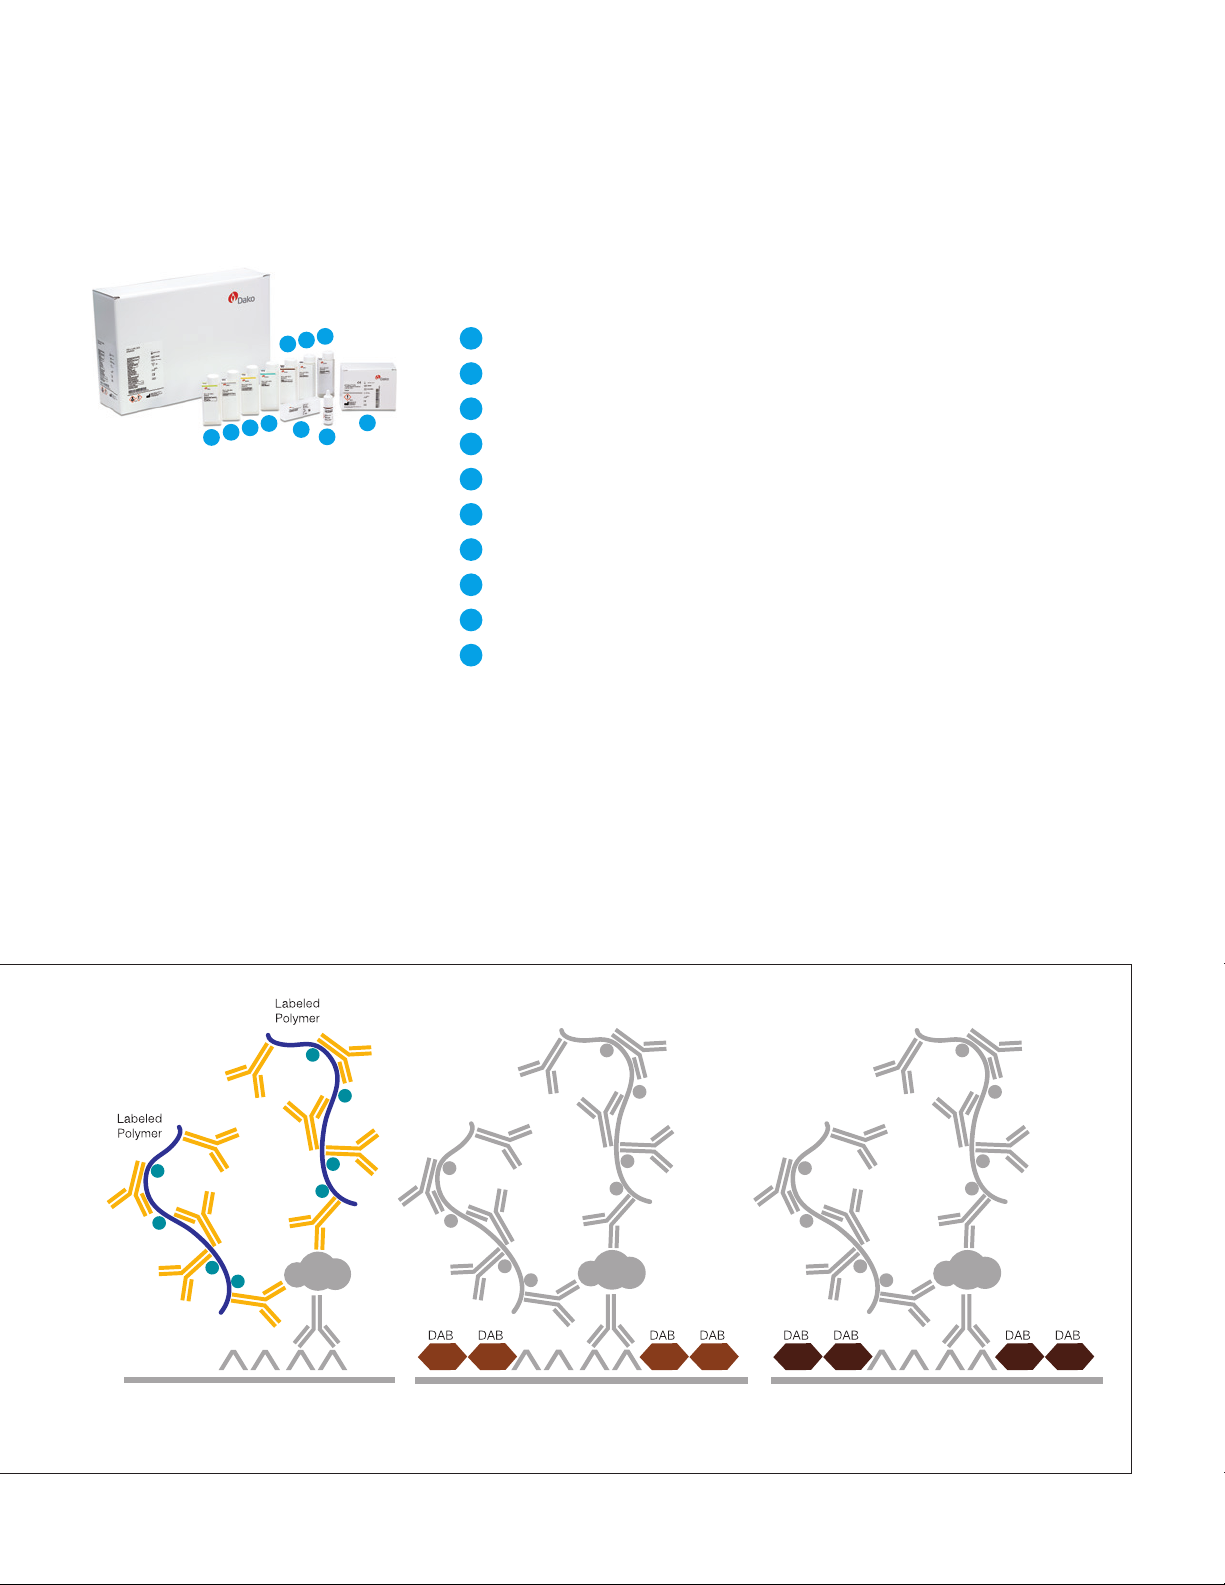
Components of PD-L1 IHC 22C3 pharmDx
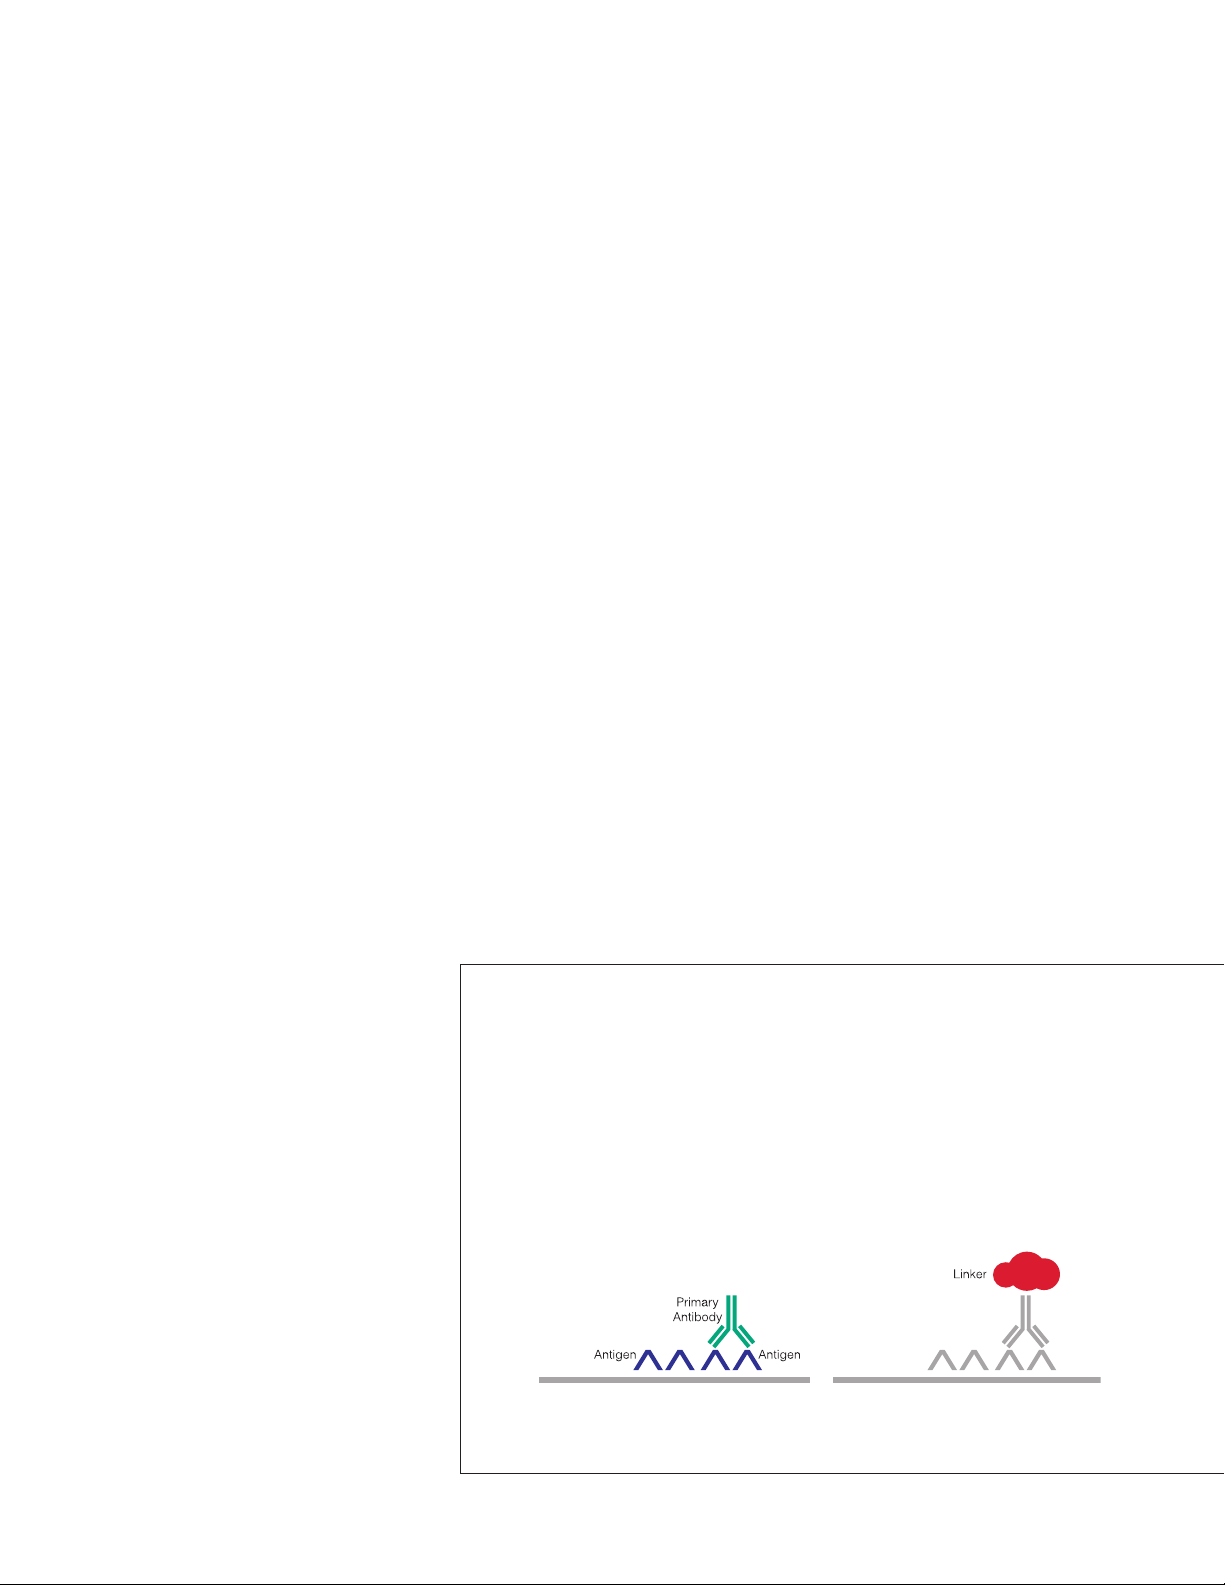
PD-L1 IHC 22C3 pharmDx contains optimized reagents to perform an IHC
staining procedure using a linker and a chromogen enhancement reagent
(Figure 4). Deparaffinization, rehydration, and target retrieval is performed
using a 3-in-1 procedure on PT Link. Following peroxidase block, specimens are
incubated with the monoclonal mouse primary antibody to PD-L1 or the Negative
Control Reagent. Specimens are then incubated with a Mouse LINKER, followed
by incubation with a ready-to-use Visualization Reagent consisting of secondary
antibody molecules and horseradish peroxidase molecules coupled to a dextran
polymer backbone.
(pembrolizumab) monotherapy. PD-L1 IHC 22C3 pharmDx is a
The enzymatic conversion of the subsequently added chromogen results in
precipitation of a visible reaction product at the site of the antigen. The color of
the chromogenic reaction is modified by a chromogen enhancement reagent.
The specimen may then be counterstained and coverslipped. Results are
interpreted using a light microscope.
Application of Primary Antibody. Application of Linker.
10
Figure 4: PD-L1 IHC 22C3 pharmDx staining procedure.
Page 11
Kit Configuration (SK006)
PD-L1 IHC 22C3 pharmDx (Code SK006) contains reagents to perform 50 tests
in up to 15 individual runs (Figure 5):
4
9
7
5
6
2
3
Figure 5: PD-L1 IHC 22C3
pharmDx components.
* Dr. AF Gazdar and Dr. JD Minna at NIH are acknowledged
for their contribution in developing NCI-H226
(ATCC Number: CRL-5826™)
10
1
8
1
EnVision FLEX Target Retrieval Solution, Low pH (50×)
2
Peroxidase-blocking
3
Primary Antibody: Monoclonal Mouse Anti-PD-L1, Clone 22C3
4
Negative Control Reagent
5
Mouse LINKER
6
Visualization Reagent-HRP
7
DAB+ Substrate Buffer
8
DAB+ Chromogen
9
DAB Enhancer
10
PD-L1 IHC 22C3 pharmDx Control Cell Line Slides*
EnVision FLEX Wash Buffer, (20×) (Code K8007) and EnVision FLEX Hematoxylin
(Code K8008) are required but not included in the kit.
PD-L1 IHC 22C3 pharmDx Interpretation Manual – NSCLC
Reagent
Application of Visualization Reagent. Application of DAB+ Substrate-
Chromogen Solution.
Application of DAB Enhancer.
11
Page 12

PD-L1 IHC 22C3 pharmDx Interpretation Manual – NSCLC
Technical Considerations
Technical problems related to PD-L1 IHC 22C3 pharmDx may arise and can be attributed to
two areas: specimen collection and preparation prior to performing the test, and the actual
performance of the test itself. Technical problems are generally related to procedural deviations
and can be controlled and minimized through training and, where necessary, clarification of the
product instructions.
Specimen Preparation
In-house Control Tissue
Specimens must be handled to preserve the tissue for immunohistochemical
staining. Determine intact tumor morphology and the presence of sufficient tumor
cells for evaluation. Use standard methods of tissue processing for all specimens.
Differences in processing and embedding in the user’s laboratory may produce
significant variability in results. Include positive and negative in-house control
tissue in each staining run, in addition to the PD-L1 IHC 22C3 pharmDx Control
Cell Line Slide.
Select positive and negative control tissue from fresh specimens of the same
tumor indication as the patient specimen. Fix, process, and embed the control
tissue in the same manner. Control tissues processed differently from the patient
specimen validate reagent performance only and do not verify tissue preparation.
The ideal positive control tissue provides a complete dynamic representation of
weak-to-moderate staining of tumor cells. The ideal negative control tissue gives
no staining on tumor cells but contains tumor-associated macrophages/immune
cells which may express PD-L1 and offer an internal positive control.
12
Page 13

PD-L1 IHC 22C3 pharmDx Interpretation Manual – NSCLC
Optional Additional In-house
Control: Tonsil Tissue
Tissue Processing
Tonsil stained with PD-L1 should be pre-screened to exhibit strong staining in
portions of the crypt epithelium and weak-to-moderate staining of the follicular
macrophages in the germinal centers. PD-L1 expression of the endothelium,
fibroblasts, as well as the surface epithelium should be negative.
Formalin-fixed, paraffin-embedded tissues have been validated for use. Block
specimens into a thickness of 3 mm or 4 mm, fix in formalin and dehydrate
and clear in a series of alcohols and xylene, followed by infiltration with melted
paraffin. The paraffin temperature should not exceed 60 °C. Feasibility studies
on NSCLC tissue samples were performed with fixation in 10% neutral buffered
formalin for 12–72 hours. Fixation times of 3 hours or less should not be used
for PD-L1 assessment. The use of PD-L1 IHC 22C3 pharmDx on decalcified
tissues or tissues processed with other fixatives has not been validated and is
not recommended.
Cut tissue specimens into sections of 4–5 µm. After sectioning, tissues should
be mounted on Dako FLEX IHC Microscope Slides (Code K8020) or Fisherbrand
Superfrost Plus slides, and then placed in a 58 ± 2 °C oven for 1 hour. Store tissue
sections in the dark at 2–8 °C (preferred) or at room temperature up to 25 °C to
preserve antigenicity, and stain within 6 months of sectioning.
13
Page 14

PD-L1 IHC 22C3 pharmDx Interpretation Manual – NSCLC
PD-L1 IHC 22C3 pharmDx Staining Procedure
The PD-L1 IHC 22C3 pharmDx reagents and instructions have been designed for optimal
performance. Further dilution of the reagents, alteration of incubation times, temperatures, or
materials may give erroneous results. All of the required steps and incubation times for staining
are pre-programmed in the DakoLink software.
Reagent Storage
Store all components of PD-L1 IHC 22C3 pharmDx, including Control Cell Line
Slides, in the dark at 2–8 °C when not in use.
Reagent Preparation
Equilibrate all components to room temperature (20–25 °C) prior to
immunostaining. Do not use after the expiration date printed on the outside
of the package.
EnVision FLEX Target Retrieval Solution, Low pH
Dilute EnVision FLEX Target Retrieval Solution, Low pH (50×) 1:50 using
distilled or deionized water (reagent-quality water). One 30 mL bottle of
concentrate provides 1.5 L of working solution, which is sufficient to fill one
PT Link tank. Discard 1× EnVision FLEX Target Retrieval Solution, Low pH after
3 uses or 5 days after dilution.
EnVision FLEX Wash Buffer
Dilute EnVision FLEX Wash Buffer (20×) 1:20 using distilled or deionized water
(reagent-quality water). Store unused 1× buffer at 2–8 °C for no more than
1 month. Discard if cloudy in appearance.
14
Page 15

PD-L1 IHC 22C3 pharmDx Interpretation Manual – NSCLC
DAB+ Substrate-Chromogen Solution
Add 1 drop of DAB+ Chromogen per mL of DAB+ Substrate Buffer and mix.
Prepared DAB+ Substrate-Chromogen is stable for 5 days if stored in the dark
at 2–8 °C. Mix the DAB+ Substrate-Chromogen Solution thoroughly prior to use.
Any precipitate developing in the solution will not affect staining quality.
– If using an entire bottle of DAB+ Substrate Buffer, add 9 drops of DAB+
Chromogen. Although the DAB+ Substrate Buffer label states 7.2 mL, this is the
usable volume and does not account for the “dead volume” of DAB+ Substrate
Buffer in the bottle
– The color of the DAB+ Chromogen may vary from clear to lavender brown.
This will not affect the performance of the product. Dilute per the guidelines
above. Adding excess DAB+ Chromogen to the DAB+ Substrate Buffer results
in deterioration of the positive signal
Controls to Assess Staining Quality
The following quality controls should be included in each staining run:
– One PD-L1 IHC 22C3 pharmDx Control Cell Line Slide stained with
the primary antibody
– Positive and negative in-house control tissues stained with the
primary antibody
– Subsequent sections of each patient specimen stained with the
Negative Control Reagent
15
Page 16

PD-L1 IHC 22C3 pharmDx Interpretation Manual – NSCLC
Deparaffinization, Rehydration, and Target Retrieval
Use PT Link to perform a Deparaffinization, Rehydration, and Target Retrieval
3-in-1 procedure:
– Set Preheat and Cool to 65 °C, and set Heat to 97 °C for 20 minutes
– Fill PT Link tanks with 1.5 L per tank of 1× EnVision FLEX Target Retrieval
Solution, Low pH working solution to cover the tissue sections
– Preheat the Target Retrieval Solution, Low pH to 65 °C
– Immerse Autostainer racks containing mounted, FFPE tissue sections into
the preheated Target Retrieval Solution, Low pH in PT Link tank. Incubate
for 20 minutes at 97 °C
– When incubation has been completed and the temperature has cooled to
65 °C, remove each Autostainer slide rack with slides from the PT Link tank
and immediately place the slides into a tank (e.g., PT Link Rinse Station,
Code PT109) containing room temperature 1× EnVision FLEX Wash Buffer
working solution
– Leave Autostainer rack with slides in room temperature 1× EnVision FLEX
Wash Buffer for 5minutes
Staining and Counterstaining
– Place the Autostainer rack with slides on the Autostainer Link 48
– Ensure slides remain wet with buffer while loading and prior to initiating the
run. Dried tissue sections may display increased non-specific staining
– Select the PD-L1 IHC 22C3 pharmDx protocol. The instrument performs the
staining and counterstaining procedures by applying the appropriate reagent,
monitoring the incubation time, and rinsing slides between reagents
– Counterstain slides using EnVision FLEX Hematoxylin, Code K8008
Mounting
Use non-aqueous permanent mounting media. To minimize fading, store slides
in the dark at room temperature (20–25 °C).
16
Page 17

PD-L1 IHC 22C3 pharmDx Interpretation Manual – NSCLC
Technical Checklist
Use the checklist below to ensure correct usage of PD-L1 IHC 22C3 pharmDx:
Customer Name/Institution
Name and Title
Autostainer Link 48 Serial Number Software Version
Regular preventive maintenance is performed on the Autostainer Link 48 and PT Link?
PD-L1 IHC 22C3 pharmDx is used before the expiration date printed on the outside of the box?
All PD-L1 IHC 22C3 pharmDx components, including Control Cell Line Slides, are stored in the dark
at 2–8 °C?
All PD-L1 IHC 22C3 pharmDx components, including Control Cell Line Slides, are equilibrated to
room temperature (20–25 °C) prior to immunostaining?
Yes No
Appropriate positive and negative control tissue from NSCLC are identified?
Tissues are fixed in neutral buffered formalin?
Tissues are infiltrated with melted paraffin, at or below 60 °C?
Tissue sections of 4–5 µm are mounted on Dako FLEX IHC Microscope Slides or Fisherbrand
Superfrost Plus slides?
Specimens are oven-dried at 58 ± 2 °C for 1 hour?
Specimens are stained within 6 months of sectioning when stored in the dark at 2–8 °C (preferred)
or at room temperature up to 25 °C?
EnVision FLEX Target Retrieval Solution, Low pH is prepared properly? pH of 1× Target Retrieval
Solution must be 6.1 ± 0.2.
EnVision FLEX Wash Buffer is prepared properly?
DAB+ Substrate-Chromogen Solution is prepared properly?
Slides are counterstained with EnVision FLEX Hematoxylin?
The Deparaffinization, Rehydration, and Target Retrieval 3-in-1 procedure is followed using PT Link?
Slides remain wet with buffer while loading and prior to initiating run on Autostainer Link 48?
The PD-L1 IHC 22C3 pharmDx protocol is selected on Autostainer Link 48?
Do you have all the necessary equipment to perform the PD-L1 IHC 22C3 pharmDx according
to protocol? If not, specify what is missing in comments below.
Additional Observations or Comments:
17
Page 18

PD-L1 IHC 22C3 pharmDx Interpretation Manual – NSCLC
Clinical Interpretation Guidelines
General Considerations
Specimen Adequacy
PD-L1 IHC 22C3 pharmDx evaluation should be performed by a qualified
pathologist using a light microscope. Details of the PD-L1 IHC 22C3 pharmDx
interpretation guidelines are reviewed on page 26. Before examining the patient
specimen for PD-L1 staining, it is important to examine the controls to assess
staining quality.
PD-L1 expression is best assessed by requesting 3 serial tissue sections (H&E,
PD-L1 stain, and NCR stain) so that if the H&E is first assessed and is acceptable,
IHC staining of the remaining 2 serial sections is likely to be acceptable.
Each PD-L1 IHC 22C3 pharmDx is configured with Control Cell Line Slides that
should be included in each IHC run. Guidelines on interpreting the Control Cell
Line Slide are reviewed to the right. In-house control tissue slides should also be
assessed with every IHC run.
Confirm the Presence of at Least 100 Viable Tumor Cells
A hematoxylin and eosin (H&E) stained section is recommended for the
evaluation of specimen adequacy. PD-L1 IHC 22C3 pharmDx and the H&E
staining should be performed on serial sections from the same paraffin block
of the specimen.
A minimum of 100 viable tumor cells must be present in the PD-L1
stained slide for the specimen to be considered adequate for
PD-L1 evaluation.
Instructions for Patient Specimens With Less Than 100 Viable
Tumor Cells
Tissue from a deeper level of the block, or potentially another block, could have
a sufficient number of viable tumor cells for PD-L1 IHC 22C3 pharmDx testing.
18
Page 19
PD-L1 IHC 22C3 pharmDx Interpretation Manual – NSCLC
Evaluating Controls
Figure 6: Each Control Cell Line Slide
contains sections of cell pellets with
positive and negative PD-L1 expression.
PD-L1 IHC 22C3 pharmDx Control Cell Line Slide
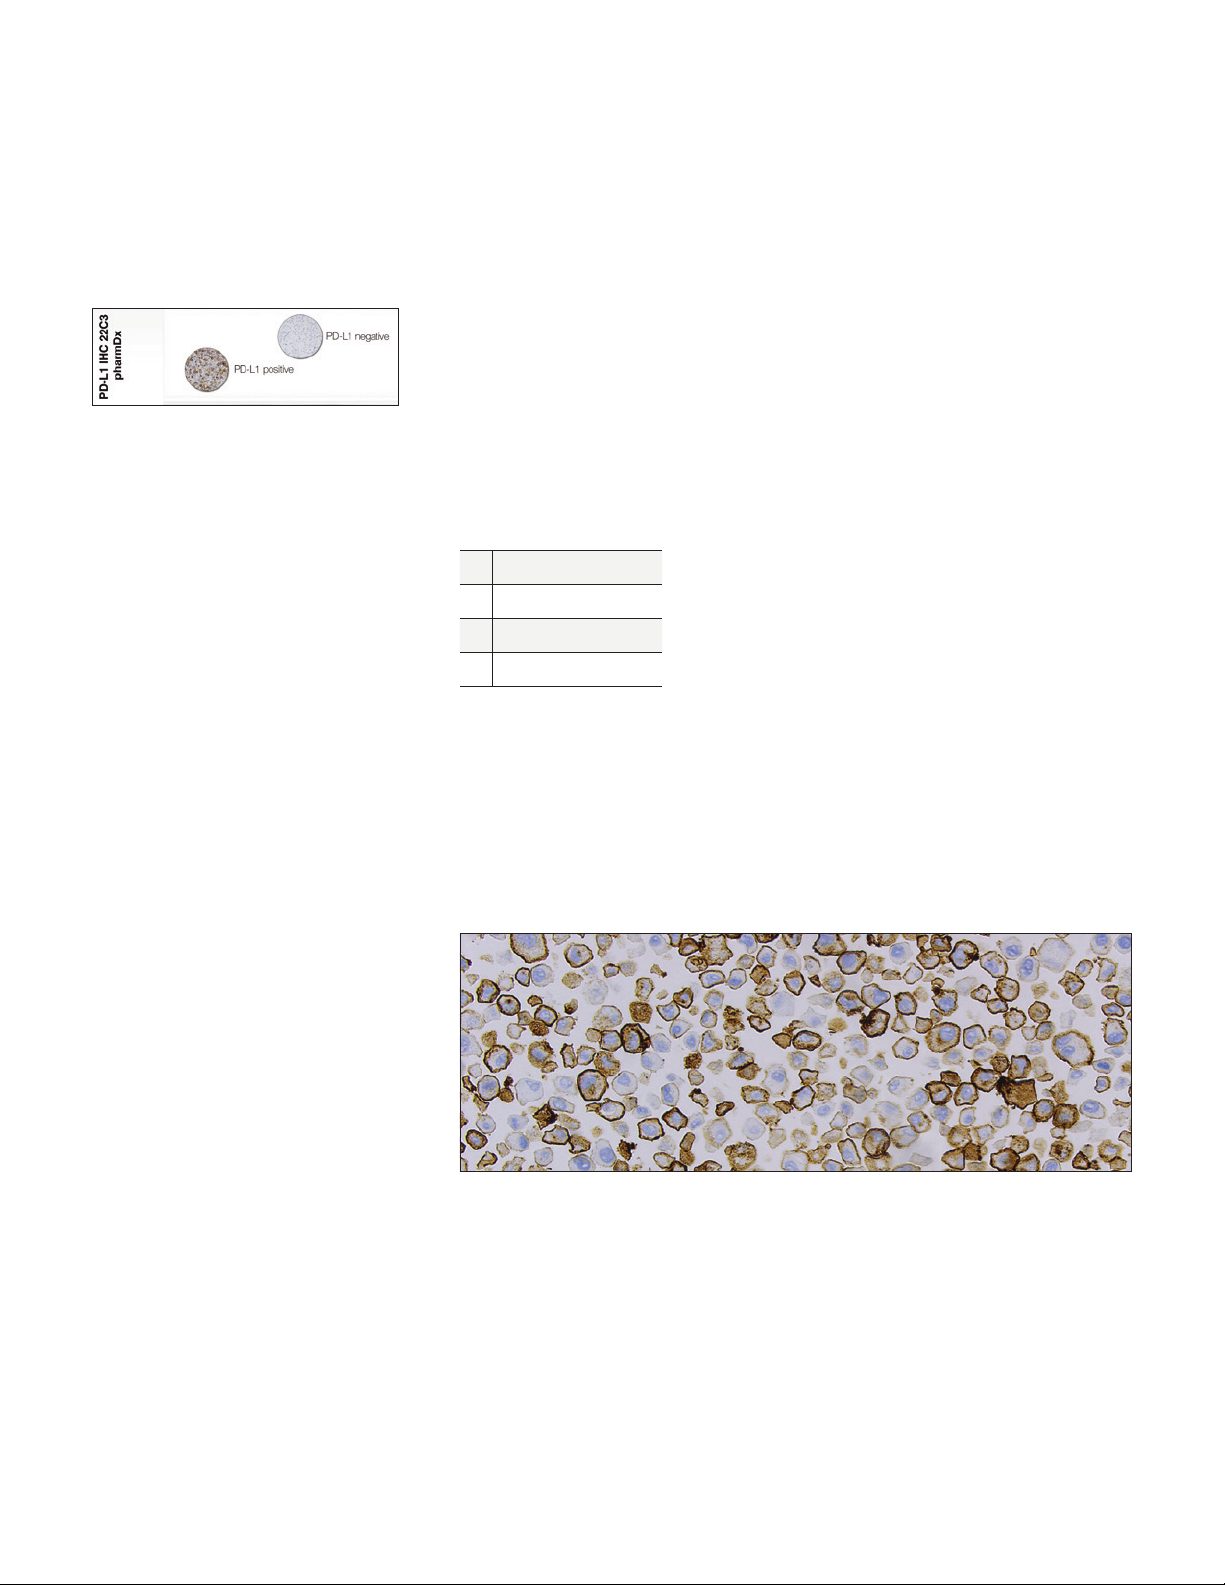
Examine the PD-L1 IHC 22C3 pharmDx Control Cell Line Slide to determine that
reagents are functioning properly. Each slide contains sections of cell pellets
with positive and negative PD-L1 expression (Figure 6). Assess the percentage
of positive cells and the staining intensity. If any staining of the Control Cell
Line Slide is not satisfactory, all results with the patient specimens should be
considered invalid. Do not use the Control Cell Line Slide as an aid in interpretation
of patient results.
Evaluate the overall staining intensity using the following guide:
0 Negative
1+ Weak intensity
2+ Moderate intensity
3+ Strong intensity
Positive Control Cell Pellet
The following staining is acceptable for the PD-L1 positive cell pellet (Figure 7):
– Cell membrane staining of ≥ 70% of cells
– ≥ 2+ average staining intensity
– Non-specific staining < 1+ intensity
Figure 7: Positive cell pellet with acceptable staining of PD-L1 IHC 22C3 pharmDx Control Cell
Line Slide (20× magnification).
19
Page 20
PD-L1 IHC 22C3 pharmDx Interpretation Manual – NSCLC
Negative Control Cell Pellet
For the PD-L1 negative cell pellet, the following staining is acceptable (Figure 8):
– The majority of cells should demonstrate no staining. Note: The presence of
10 or fewer cells with distinct cell membrane staining is acceptable
– Non-specific staining < 1+ intensity
Figure 8: Negative cell pellet with no staining of PD -L1 IHC 22C3 pharmDx Control Cell Line Slide
(20× magnification).
Do not use the Control Cell Line Slide as an aid in interpretation of
patient results.
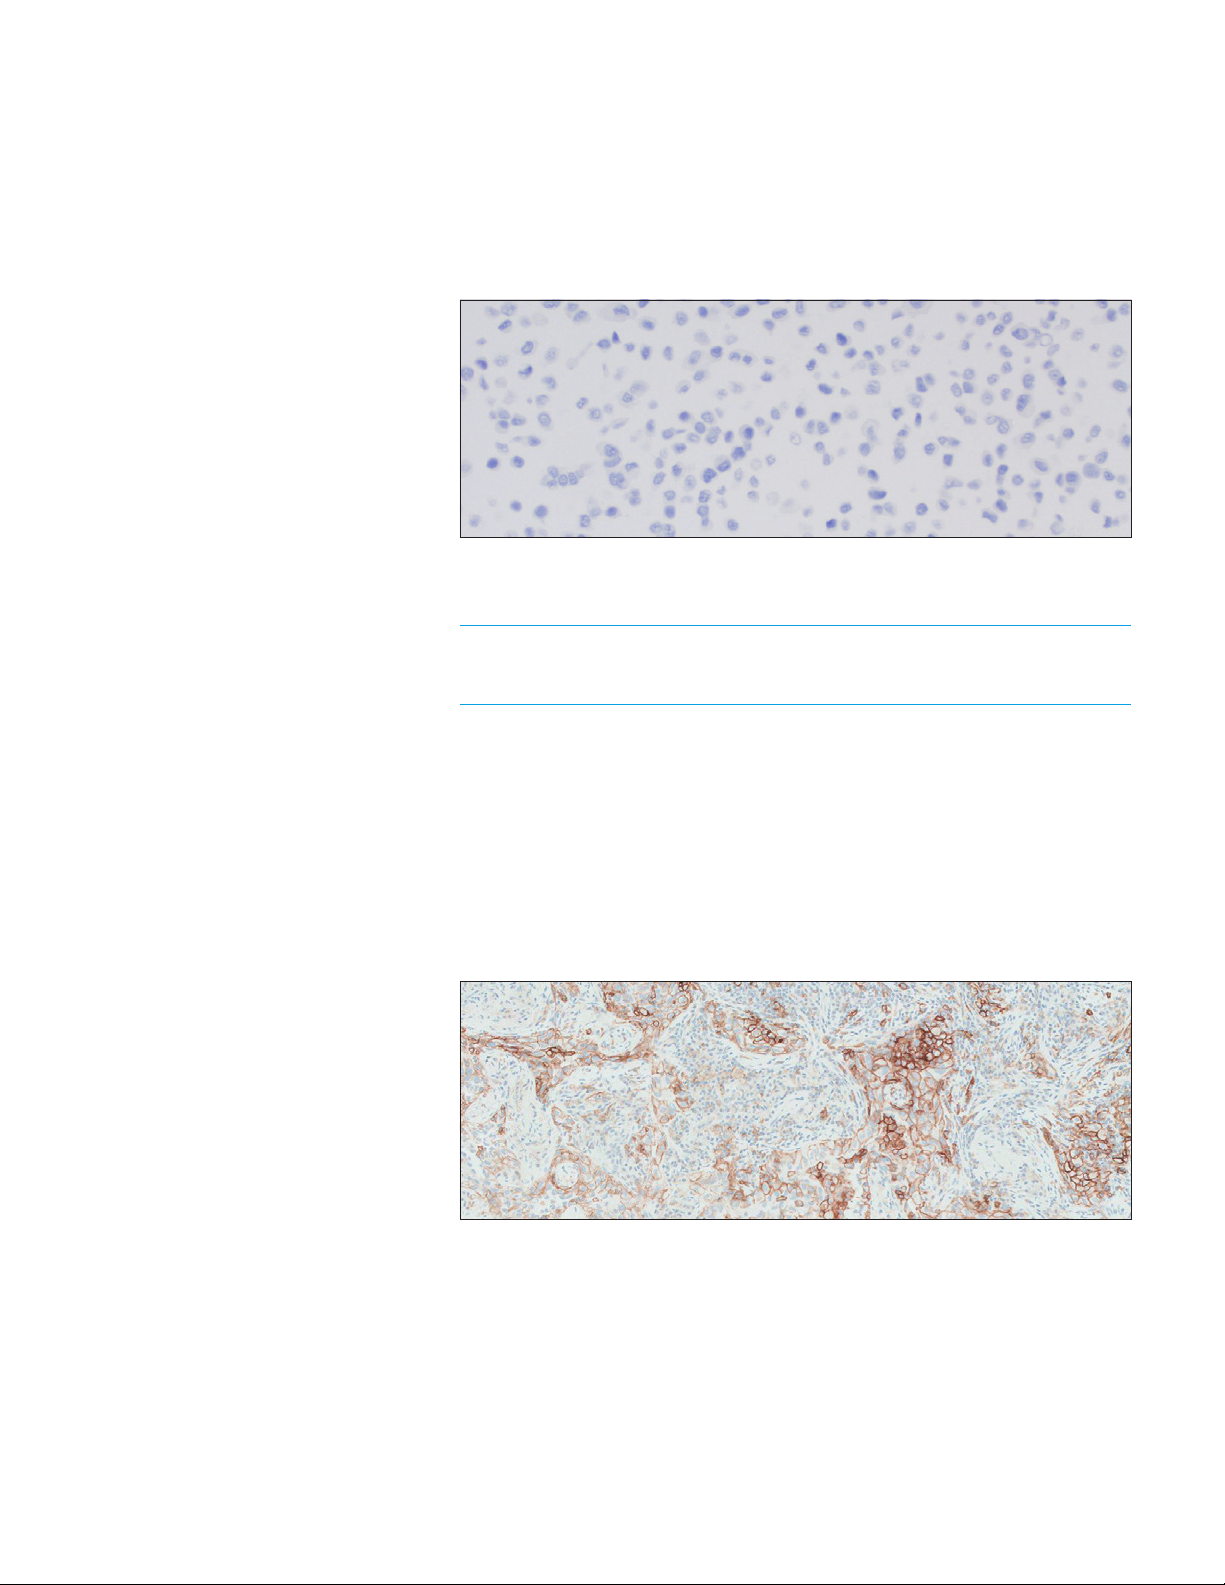
Positive and Negative In-house Control Tissue (NSCLC)
Examine the positive in-house NSCLC control tissue to determine that the tissues
are correctly prepared and reagents are functioning properly. The ideal positive
control tissue provides a complete dynamic representation of weak-to-moderate
tumor cell membrane staining (Figure 9). If staining of positive in-house control
tissue is not satisfactory, all results with the patient specimen should be
considered invalid.
Figure 9: Ideal positive in-house control tissue (10× magnification).
20
Page 21
PD-L1 IHC 22C3 pharmDx Interpretation Manual – NSCLC
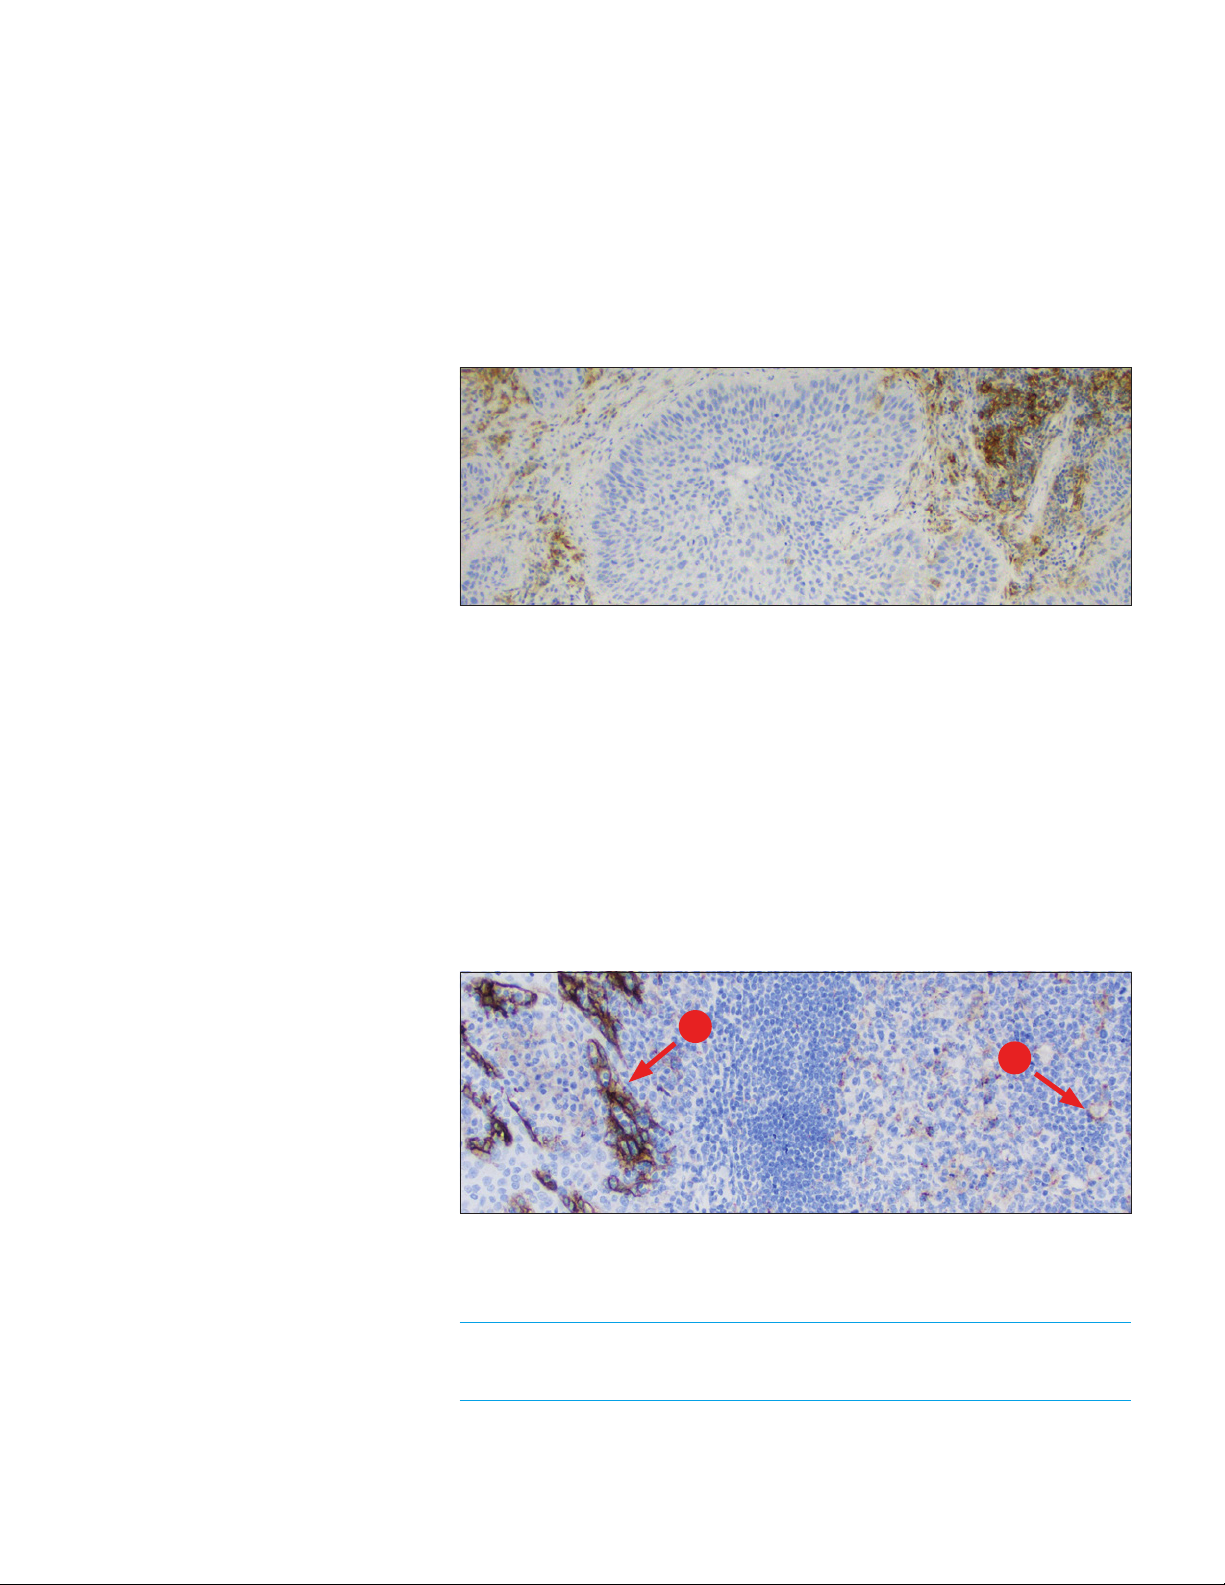
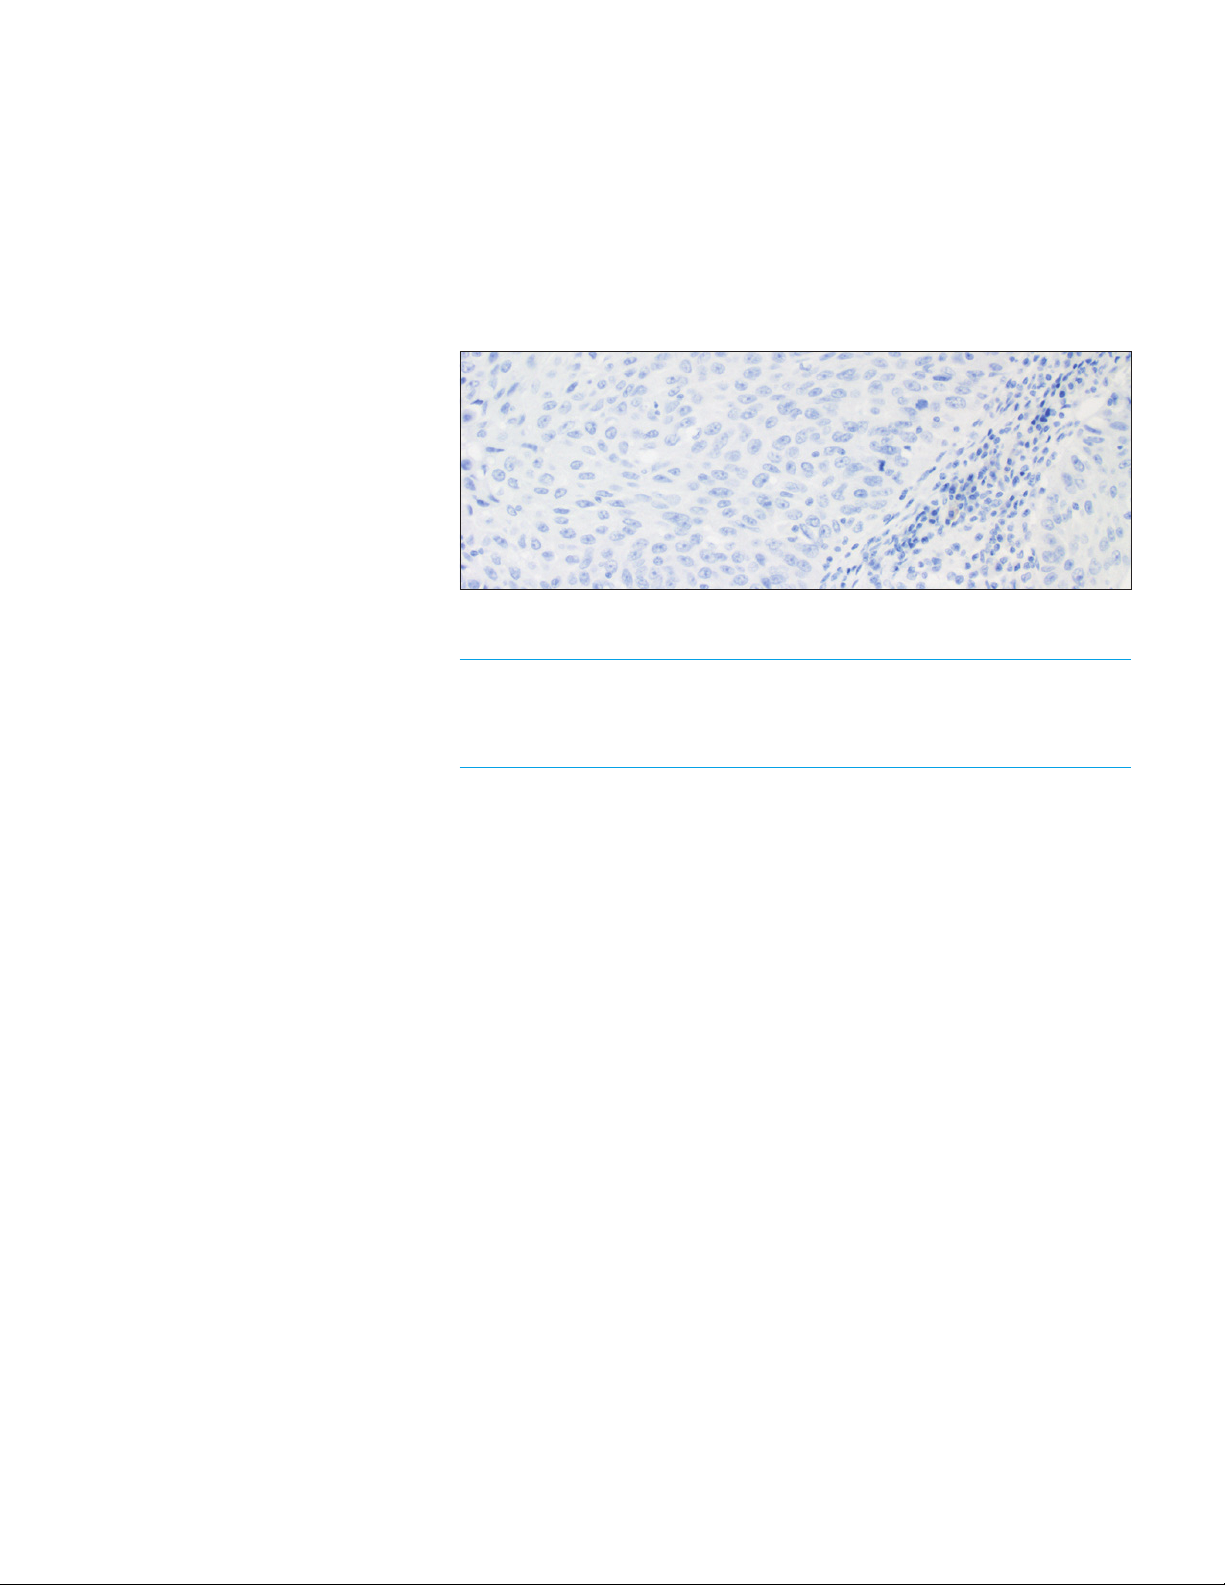
The ideal NSCLC negative control tissue demonstrates no staining on tumor
cells but contains tumor-associated macrophages/immune cells that express
PD-L1 and offer an internal positive control (Figure 10). Examine the negative
in-house control tissue to determine the expected staining. The variety of
different cell types present in most tissue sections offers internal negative
control sites; this should be verified by the user.
If unwanted staining occurs in the in-house control tissues, results with the
patient specimen should be considered invalid.
Figure 10: Ideal negative in-house control tissue demonstrating lack of staining of tumor cells
(10× magnification).
Optional Control Tissue
In addition to the Control Cell Line Slide and in-house control tissues, FFPE tonsil
may also be used as an optional control specimen. Tonsil stained with PD-L1
should exhibit strong membrane staining in portions of the crypt epithelium
and weak-to-moderate membrane staining of the follicular macrophages in the
germinal centers (Figure 11).
PD-L1 expression of the endothelium, fibroblasts, and the surface epithelium
should be absent.
A
B
Figure 11: Tonsil stained with PD -L1 primary antibody exhibiting strong membrane staining
in portions of the crypt epithelium (A) and weak-to-moderate membrane staining of follicular
macrophages in the germinal centers (B) (10× magnification).
Do not use in-house control tissue as an aid in interpretation of
patient results.
21
Page 22
PD-L1 IHC 22C3 pharmDx Interpretation Manual – NSCLC
Negative Control Reagent (NCR)
Examine the slides stained with the NCR to identify non-specific background
staining that may interfere with PD-L1 staining interpretation, making the
specimen non-evaluable. Satisfactory performance is indicated by the absence
of staining (Figure 12).
Examine the patient specimens stained with the NCR to determine if there is any
non-specific staining that may interfere with interpreting the PD-L1 stained slide.
Figure 12: Ideal negative in-house control tissue stained with NCR (20× magnification).
NCR-stained slides indicate non-specific background staining and
allow for better interpretation of patient specimens stained with the
primary antibody.
22
Page 23
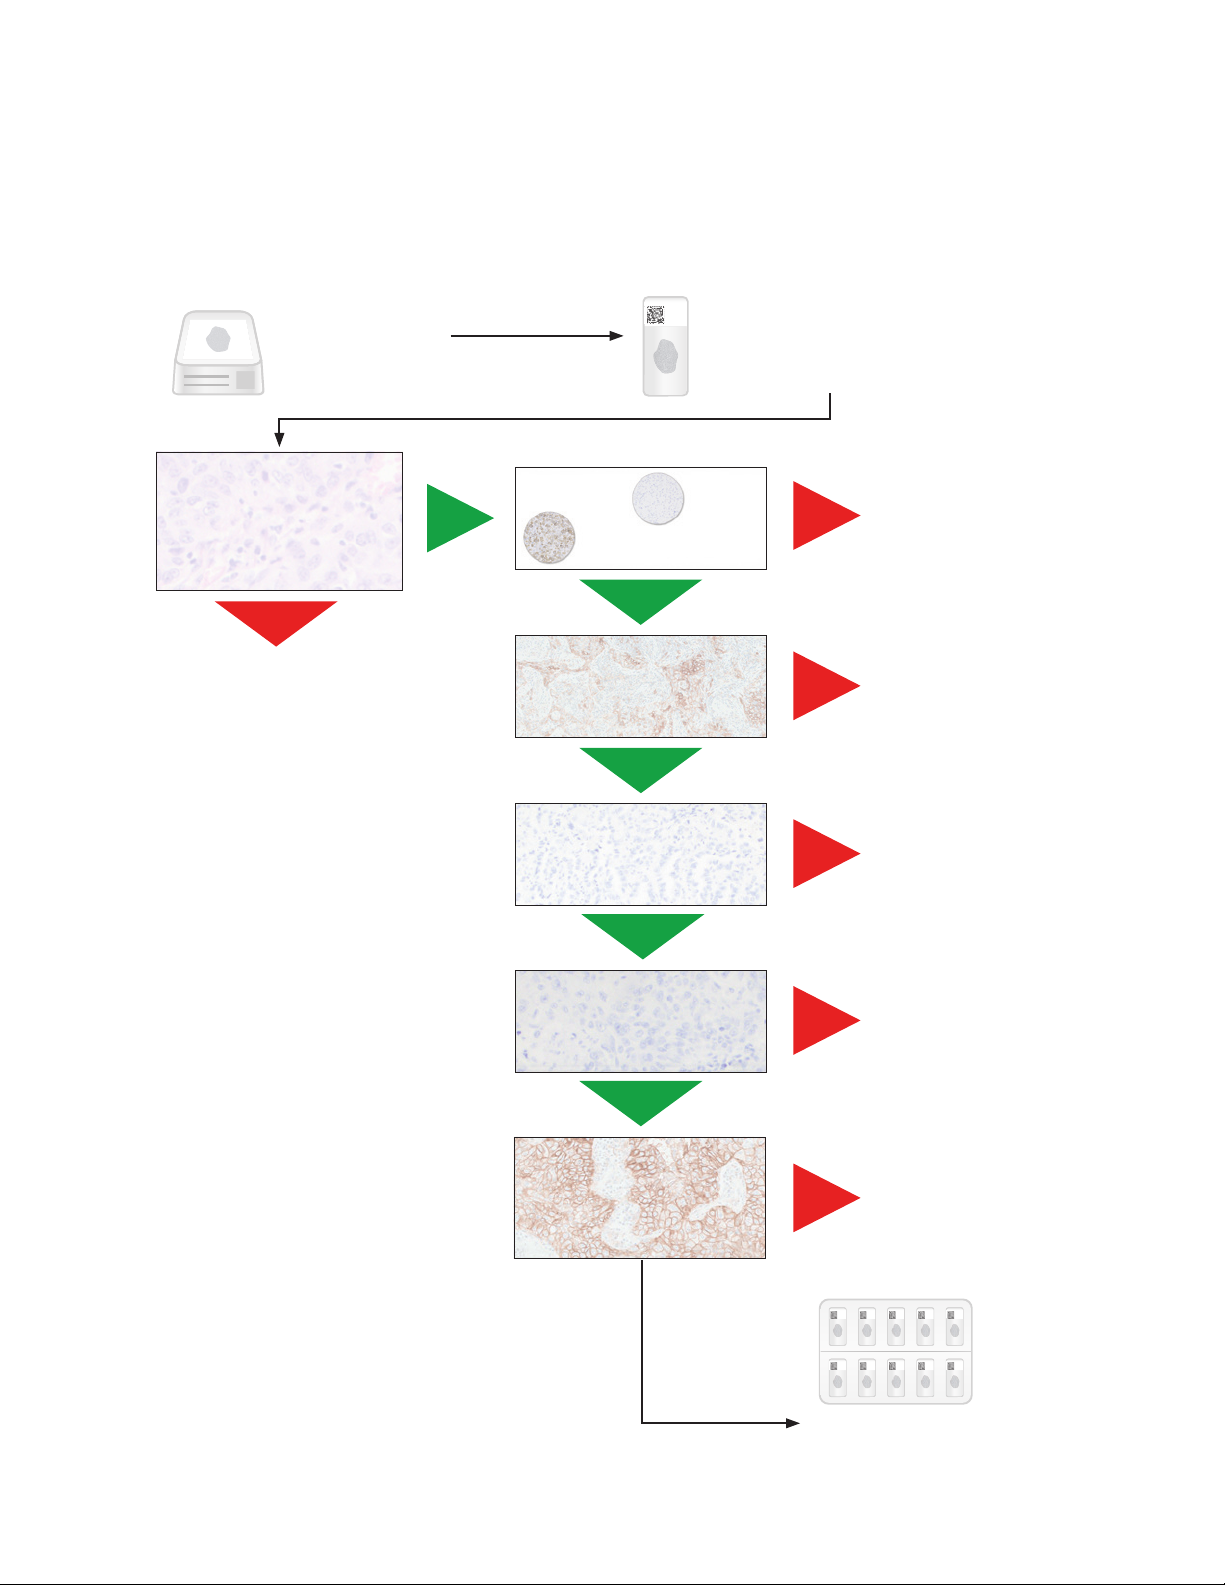
Slide Evaluation Flowchart
PD-L1 IHC 22C3 pharmDx Interpretation Manual – NSCLC
Tissue Block
3 serial sections are
cut/prepared
One section is stained with
H&E (H&E Patient Specimen)
Is H&E slide acceptable?
(≥ 100 viable tumor cells)
No
Repeat staining run with a
deeper cut in the block
or a new patient specimen
Yes
Control Cell Line
Slide acceptable?
Yes
Positive control
tissue acceptable?
Yes
Negative control
tissue acceptable?
Sections of 4–5 µm thickness
are mounted on glass
microscope slides
No
No
No
Repeat
staining run
Repeat
staining run
Repeat
staining run
Figure 13: Recommended order of slide evaluation.
Yes
Patient specimen stained
with Negative Control
Reagent acceptable?
Yes
Patient specimen stained with
primary antibody exhibiting
≥ 100 viable tumor cells?
Scored by
Pathologist
No
No
Provide case report
Repeat
staining run
Repeat
staining run
23
Page 24

PD-L1 IHC 22C3 pharmDx Interpretation Manual – NSCLC
Evaluate Staining and Determine
Tumor Proportion Score
Definition of Tumor
Proportion Score (TPS)
The Tumor Proportion Score is the percentage of viable tumor cells showing
partial or complete membrane staining at any intensity (≥ 1+) relative to all viable
tumor cells present in the sample.
TPS is defined accordingly:
TPS (%) =
# PD-L1 staining cells (tumor cells)
× 100
Total # of viable tumor cells
Table 1: TPS Numerator Inclusion/Exclusion Criteria for NSCLC
Tissue Elements Included in TPS Scoring for NSCLC Excluded from TPS Scoring for NSCLC
Tumor Cells Convincing partial or complete cell
membrane staining (at any intensity)
of viable tumor cells
Immune Cells Not included Exclude any staining of immune cells,
Other Cells Not included Exclude any staining of:
Exclude any cytoplasmic staining
such as:
– Mononuclear inflammatory cells
(large lymphocytes, monocytes,
pulmonary macrophages)
– Plasma cells
– Neutrophils
– Normal cells adjacent to tumor cells
– Stromal cells (fibroblasts)
– Necrotic cells and/or cellular debris
– Anthracotic pigment
Evaluation of PD-L1 Staining
24
Score partial or complete cell membrane staining (≥ 1+) of tumor cells
that is perceived distinct from cytoplasmic staining. Cytoplasmic staining
should be considered non-specific staining and is excluded in the
assessment of staining intensity.
Score only viable tumor cells. Exclude any staining of immune cells, such
as mononuclear inflammatory cells (large lymphocytes, monocytes,
pulmonary macrophages), plasma cells, and neutrophils. Exclude any
staining of normal cells adjacent to tumor cells, stromal cells (fibroblasts),
necrotic cells and/or cellular debris, as well as anthracotic pigment.
Page 25

PD-L1 IHC 22C3 pharmDx Interpretation Manual – NSCLC
Guidelines and Methods
to Determine Tumor
Proportion Score
– At low magnification, examine all well-preserved tumor areas. Evaluate
overall areas of PD-L1 staining tumor cells, keeping in mind that partial
membrane staining or ≥ 1+ membrane staining may be difficult to see at low
magnification. Ensure there are at least 100 viable tumor cells in the sample
– At higher magnifications, including 10×, 20×, and 40×, observe all tumor areas
with and without cell membrane staining
– At this stage of working with multiple magnifications, primary analysis involves:
Distinguishing tumor cells from tumor-associated immune cells
°
Determining PD-L1 staining and non-staining tumor areas
°
Determining partial and complete membrane staining (≥ 1+) of tumor cells
°
– Calculate the Tumor Proportion Score by evaluating the percentage of PD-L1
staining tumor cells relative to all viable tumor cells present in the specimen
Note: Carefully consider the overall tumor area without any perceptible and
convincing cell membrane staining
Make Sure to Exclude Immune Cells and Necrotic Tissue
From Scoring
The following considerations can help distinguish tumor cells from immune cells:
– Immune cells may have smaller nuclei than tumor cells
– Macrophages may contain pigmented particles in their cytoplasm
– Macrophages may have a scattered distribution. Pulmonary macrophages
are present in the alveolar space
25
Page 26
PD-L1 IHC 22C3 pharmDx Interpretation Manual – NSCLC
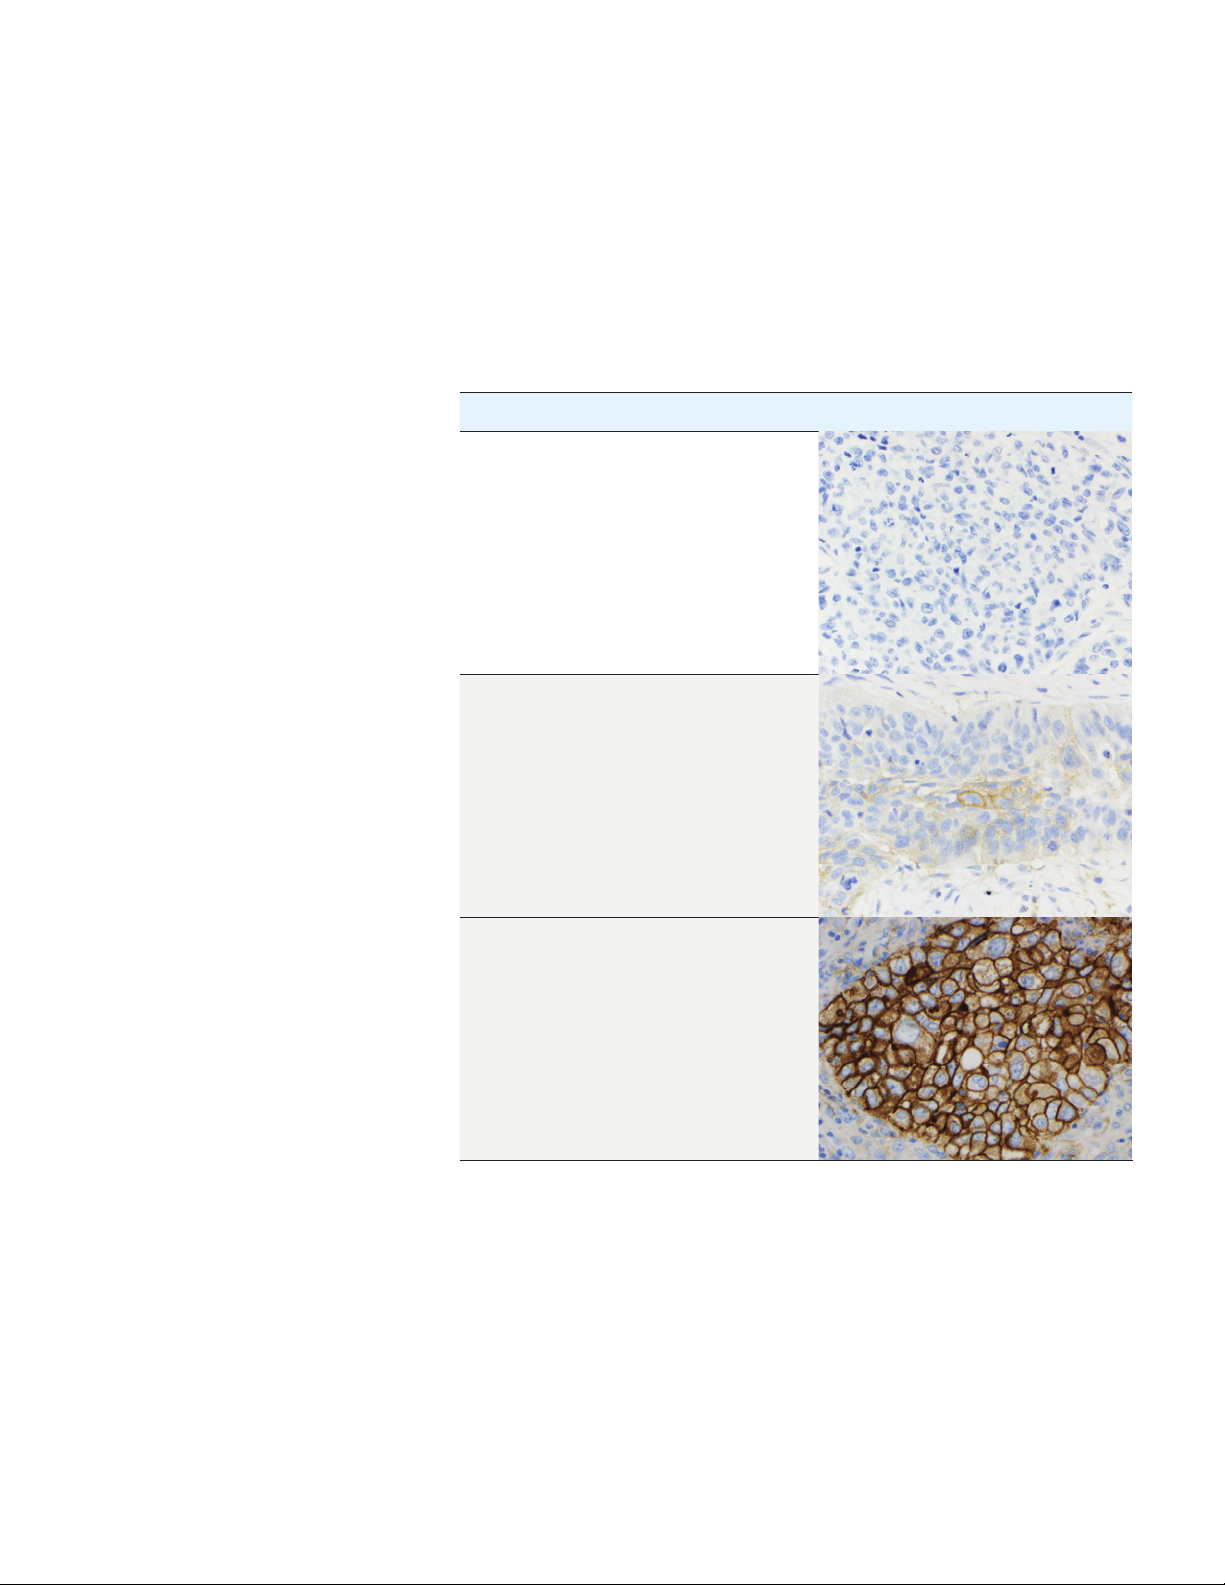
Scoring Guidelines
The TPS determines the PD-L1 expression levels of the specimen. See the table
below for scoring guideline examples.
Table 2: TPS and PD-L1 Expression Levels
TPS Expression Level Image (20× magnification)
< 1% No PD-L1 Expression
≥ 1% PD-L1 Expression
≥ 50% High PD-L1 Expression
26
Page 27

PD-L1 IHC 22C3 pharmDx Interpretation Manual – NSCLC
Suggested Methods for Determining TPS
Agilent recommends that scoring be performed within the context of the pathologist’s past
experience and best judgment in interpreting IHC stains. We offer two different examples of
techniques that may be used when considering various staining patterns to determine the
respective Tumor Proportion Scores.
Example 1: Calculation of Tumor Proportion Score Based on a Small PD-L1 Staining Area
At lower magnification: Evaluate the tumor area for any
perceptible and convincing ≥ 1+ cell membrane staining.
Assessment: 10% of area shows staining; 90% of area
shows no staining
All tumor
90% non-staining
10% staining
At higher magnification: Evaluate the area of staining to
estimate the percentage of PD-L1 staining tumor cells.
Assessment: 50% of tumor cells are PD-L1 staining
Calculate Tumor Proportion Score: Determine the overall
percentage of PD-L1 staining tumor cells for the entire
tumor area.
Assessment: Tumor Proportion Score (TPS):
10% × 50% = 5%
Clinical Interpretation: TPS ≥ 1%, PD-L1 Expression
Figure 14: Example of tumor with small PD-L1 staining area.
Non-staining tumor cell
1+, 2+, and 3+ staining
tumor cells
Tumor-associated
immune cell
27
Page 28

PD-L1 IHC 22C3 pharmDx Interpretation Manual – NSCLC
Example 2: Calculation of Tumor Proportion Score Based on a Heterogeneous PD-L1 Staining Area
At lower magnification: Visually divide the tumor area
into sections.
At higher magnification: Observe tumor areas with cell
membrane staining for percentage of PD-L1 staining cells
in each section.
Assessment: Percentage of PD-L1 staining cells in each of
the four respective sections: 80%, 25%, 50%, 100%
80% PD-L1
staining cells
50% PD-L1
staining cells
Calculate the Tumor Proportion Score: Determine the overall
percentage of PD-L1 staining tumor cells for the entire tumor area.
Assessment: Tumor Proportion Score (TPS):
(80% + 25% + 50% + 100%) / 4 ≈ 60%
25% PD-L1
staining cells
100% PD-L1
staining cells
Non-staining tumor cell
1+, 2+, and 3+ staining
tumor cells
Tumor-associated
immune cell
Clinical Interpretation: TPS ≥ 50%, High PD-L1 Expression
Figure 15: Example with heterogeneous PD-L1 staining area.
28
Page 29

PD-L1 IHC 22C3 pharmDx Interpretation Manual – NSCLC
Identifying Patients With NSCLC for Treatment
PD-L1 IHC 22C3 pharmDx is the only clinical-trial proven companion diagnostic indicated as an aid
in identifying patients with NSCLC for treatment with KEYTRUDA
®
(pembrolizumab) monotherapy.
Clinical Validation of PD-L1
IHC 22C3 pharmDx in
Previously Untreated Patients
with Metastatic NSCLC
(First-line)
Clinical Validation of PD-L1
IHC 22C3 pharmDx in
Previously Treated
Patients with Metastatic
NSCLC (Second-line
and Beyond)
The clinical validity of PD-L1 IHC 22C3 pharmDx in identifying high PD-L1
expression (TPS ≥ 50%) in previously untreated patients with metastatic NSCLC
is based onthe KEYTRUDA KEYNOTE-024 study sponsored by Merck Sharp &
Dohme Corp. Specimens from previously untreated patients with NSCLC were
tested for PD-L1expression using PD-L1 IHC 22C3 pharmDx. Only patients with
TPS ≥ 50% were included in the KEYNOTE-024 study.
Table 3: PD-L1 Prevalencea in Patients with NSCLCb Screened for KEYNOTE-024
PD-L1 Expression TPS < 1% TPS 1–49% TPS ≥ 50%
Prevalence % (n) 30.7% (507) 39.1% (646) 30.2% (500)
a. Merck & Co., data on file
b. Patients screened for enrollment in KEYNOTE-024 NSCLC
c. International phase 3 study comparing pembrolizumab with investigator’s choice platinum containing
(including pemetrexed+carboplatin, pemetrexed+cisplatin, gemcitabine+cisplatin, gemcitabine+carboplatin,
or paclitaxel+carboplatin) in patients with non-small cell lung carcinoma who were previously untreated for
advanced metastatic disease. ClinicalTrials.gov number NCT02142738
c
The clinical validity of PD-L1 IHC 22C3 pharmDx in identifying PD-L1 expression
(TPS ≥ 1%) in previously treated patients with NSCLC is based on the KEYTRUDA
KEYNOTE-010 study sponsored by Merck Sharp & Dohme Corp. Specimens from
previously treated patients with metastatic NSCLC were tested for PD-L1
expression using PD-L1 IHC 22C3 pharmDx. Only patients with TPS ≥ 1%
were included in the KEYNOTE-010 study.
Table 4: PD-L1 Prevalenced in Patients with NSCLCe Screened for KEYNOTE-010
f
PD-L1 Expression TPS < 1% TPS 1–49% TPS ≥ 50%
Prevalence % (n) 43.0% (433) 34.2% (344) 22.8% (230)
d. Merck & Co., data on file
e. Patients screened for enrollment in KEYNOTE-010 NSCLC
f. International phase 2/3 study comparing pembrolizumab with docetaxel in patients with non-small cell
lung carcinoma who have experienced disease progression after platinum-containing system therapy
ClinicalTrials.gov number NCT01905657
Note: PD-L1 testing with PD-L1 IHC 22C3 pharmDx was used to qualify
patients with NSCLC for first-line treatment with KEYTRUDA monotherapy in the
KEYNOTE-042 clinical trial. For more information on the KEYNOTE clinical trials,
review the Instructions for Use. Clinical efficacy of KEYTRUDA treatment is also
presented in the Clinical Performance Evaluation section on pages 70–80.
29
Page 30

PD-L1 IHC 22C3 pharmDx Interpretation Manual – NSCLC
PD-L1 IHC 22C3 pharmDx
Testing Scheme
* See the KEYTRUDA product label for expression
cut-off values guiding therapy in specific clinical
circumstances.
Use the following flowchart to help you understand which patients are indicated for
®
treatment with KEYTRUDA
(pembrolizumab) monotherapy based on their TPS
and treatment history.
Metastatic NSCLC patient specimen
Use PD-L1 IHC 22C3 pharmDx to determine PD-L1 expression
Pathologist reports TPS and PD-L1 expression level
TPS ≥ 1% TPS ≥ 50%TPS < 1%
Oncologist determines treatment
Previously treated patients with
metastatic NSCLC are indicated
for treatment with KEYTRUDA
monotherapy if TPS ≥ 1%*
Figure 16: Testing scheme for PD-L1 IHC 22C3 pharmDx.
Previously untreated patients with
metastatic NSCLC are indicated
for treatment with KEYTRUDA
monotherapy if TPS ≥ 50%*
30
Page 31

PD-L1 IHC 22C3 pharmDx Interpretation Manual – NSCLC
Reporting Results
Suggested information to include when reporting results with PD-L1 IHC 22C3 pharmDx.
PD-L1 IHC 22C3 pharmDx Summary of Sample Tested
Date of Run: _________________________________________________________________________________________________________________
PD-L1 IHC 22C3 pharmDx Lot: _______________________________________________________________________________________________
Staining Run Log ID: _________________________________________________________________________________________________________
Specimen ID: ________________________________________________________________________________________________________________
Patient Identifiers: ___________________________________________________________________________________________________________
Type of Service: IHC Stain With Manual Interpretation
Other: ________________________________________________________________________________________________________________________
PD-L1 Included in Non-small Cell Lung Cancer Comprehensive Panel: Yes:
Type of Tissue: Squamous Cell:
Non-squamous Cell:
No:
PD-L1 Testing Results
Control Cell Line Slide Results: Pass: Fail:
Adequate Tumor Cells Present (≥ 100 cells):
PD-L1 IHC 22C3 pharmDx Result to Treating Physician
Tumor Proportion Score (TPS): _______________________________________________________________________________________________
TPS < 1%:
Comments to Treating Physician:
– KEYTRUDA® (pembrolizumab) as monotherapy is indicated for the first-line treatment of metastatic non-small cell lung
carcinoma (NSCLC) in adults whose tumors express PD-L1 with a ≥ 50% tumor proportion score (TPS) with no EGFR or
ALK positive tumor mutations
TPS ≥ 1%: TPS ≥ 50%:
– KEYTRUDA as monotherapy is indicated for the treatment of locally advanced or metastatic NSCLC in adults whose tumors
express PD-L1 with a ≥ 1% TPS and who have received at least one prior chemotherapy regimen. Patients with EGFR or
ALK positive tumor mutations should also have received targeted therapy before receiving KEYTRUDA
31
Page 32

PD-L1 IHC 22C3 pharmDx Interpretation Manual – NSCLC
PD-L1 Staining Characteristics
Key Considerations in Scoring
PD-L1 IHC 22C3 pharmDx
Stained Specimens
To successfully score PD-L1 IHC 22C3 pharmDx stained specimens, it is
critical that:
– A minimum of 100 viable tumor cells are present for evaluation
– The appropriate cells are evaluated—only viable tumor cells should be scored
– The proper cellular localization is identified—only membrane staining of tumor
cells should be evaluated
– The staining is properly interpreted
The pathologist’s experience and judgment are important in the evaluation
of PD-L1 staining. For evaluation of the immunohistochemical staining and
scoring, objectives of 10×, 20×, and 40× magnifications are appropriate.
However, below are several staining characteristic patterns that should be
considered in the Tumor Proportion Score (TPS) calculation:
– Membrane staining of tumor cells at all intensities (1–3+) should be included
– Partial and/or complete membrane staining should be included
– Any perceptible and convincing membrane staining should be included
– Cytoplasmic staining should not be included
– Tumor-associated immune cells such as infiltrating lymphocytes or
macrophages should not be included
– Granular staining must demonstrate a perceptible and convincing membrane
pattern to be included
The following pages provide guidance on various staining characteristics.
32
Page 33

PD-L1 IHC 22C3 pharmDx Interpretation Manual – NSCLC
Image Guide for Interpretation
of PD-L1 IHC 22C3 pharmDx
Staining in NSCLC
Perceptible and Convincing Membrane Staining
Scoring should include any perceptible and convincing membrane staining at any
intensity (≥ 1+) and at any magnification. Review at higher magnification may be
needed to confirm perceptible and convincing membrane staining.
Figure 17a: NSCLC specimen stained with PD-L1 primary antibody exhibiting weak membrane
staining of tumor cells (10× magnification).
Figure 17b: NSCLC specimen stained with PD-L1 primary antibody exhibiting weak but perceptible
and convincing membrane staining of tumor cells (arrow) (40× magnification).
Key Point
Any perceptible and convincing membrane staining of tumor
cells (≥ 1+) should be included in the TPS
33
Page 34

PD-L1 IHC 22C3 pharmDx Interpretation Manual – NSCLC
Weak Acceptable Membrane Staining
Scoring of tumor cells should include any perceptible and convincing membrane
staining, including weak intensity of 1+.
Figure 18a: NSCLC specimen stained with PD-L1 primary antibody exhibiting weak but perceptible
and convincing membrane staining of tumor cells (20× magnification).
Figure 18b: NSCLC specimen stained with PD-L1 primary antibody exhibiting weak but perceptible
and convincing membrane staining of tumor cells (arrow) (40× magnification).
Key Point
Weak but perceptible and convincing 1+ membrane staining of tumor
cells should be included in the TPS
34
Page 35

PD-L1 IHC 22C3 pharmDx Interpretation Manual – NSCLC
Distinguishing Tumor Cells From Tumor-associated Immune
Cells (TAIC)
Scoring should only include all viable tumor cells with membrane staining (≥ 1+).
Tumor-associated immune cells should be excluded from scoring.
A
B
Figure 19: NSCLC specimen stained with PD-L1 primary antibody exhibiting strong staining of the
TAIC (A) and lack of PD-L1 staining of tumor cells (B); TAIC staining should be excluded from the
scoring (20× magnification).
B
A
Figure 20: NSCLC specimen stained with PD-L1 primary antibody exhibiting strong staining of
tumor cells (A) and moderate staining of the TAIC (B); TAIC staining should be excluded from the
scoring (20× magnification).
Key Point
Staining of TAIC should be excluded from the TPS
35
Page 36

PD-L1 IHC 22C3 pharmDx Interpretation Manual – NSCLC
Heterogeneous Staining Intensities
Membrane staining of PD-L1 on NSCLC specimens is often heterogeneous with
various staining intensities (1–3+).
A
B
C
Figure 21: NSCLC specimen stained with PD-L1 primary antibody exhibiting a heterogeneous
membrane staining pattern with various staining intensities: 1+ staining (A), 2+ staining (B), and
3+ staining (C) (20× magnification).
Key Point
All membrane staining of tumor cells, at all intensities (1–3+), should
be included in the TPS
Partial vs. Complete Membrane Staining
Scoring should include viable tumor cells showing partial or complete membrane
staining (≥ 1+).
B
A
Figure 22: NSCLC specimen stained with PD-L1 primary antibody exhibiting a heterogeneous
membrane staining pattern with various staining intensities (1–3+): partial membrane staining of
tumor cell (A) and complete cell membrane staining (B) (20× magnification).
Key Point
Partial and/or complete membrane staining of tumor cells (≥ 1+)
should be included in the TPS
36
Page 37

PD-L1 IHC 22C3 pharmDx Interpretation Manual – NSCLC
Cytoplasmic and Membrane Staining
Tumor cells can exhibit cytoplasmic and/or membrane staining. Cytoplasmic
staining should be excluded from the TPS scoring assessment.
Figure 23: NSCLC specimen stained with PD-L1 primary antibody exhibiting strong cytoplasmic
and membrane staining of tumor cells (20× magnification).
Key Point
Only membrane staining of tumor cells should be included in the TPS
Granular Staining
PD-L1 membrane staining may be indistinguishable when the staining pattern
appears granular. Granular staining can be difficult to interpret and easily confused
with cytoplasmic staining. Only perceptible and convincing granular membrane
staining should be included in the TPS scoring.
Figure 24: NSCLC specimen stained with PD- L1 primary antibody with the majority of tumor cells
exhibiting a granular pattern of perceptible and convincing membrane staining (20× magnification).
Key Point
Granular staining of tumor cells must demonstrate a perceptible
and convincing membrane pattern to be included in the TPS
37
Page 38

PD-L1 IHC 22C3 pharmDx Interpretation Manual – NSCLC
Patchy Staining
Staining of PD-L1 on NSCLC specimens may be patchy in appearance. A review of
each portion of the specimen at high power may be needed to score accurately.
Figure 25: NSCLC specimen stained with PD-L1 primary antibody exhibiting a patchy membrane
staining pattern (10× magnification).
Key Point
Assess entire specimen to accurately determine the TPS
Anthracotic Pigment
Anthracotic pigment is an accumulation of carbon in the lungs from inhaled smoke
or coal dust. It appears as granular dark spots and is often helpful to distinguish
tumor cells from TAIC, as anthracotic pigment is found within pulmonary
macrophages and not within tumor cells.
A
B
Figure 26: NSCLC specimen stained with PD-L1 primary antibody exhibiting strong staining of
tumor cells (A) and moderate staining of the TAIC (B); TAIC staining should be excluded from the
scoring (20× magnification).
Key Point
Anthracotic pigment should be disregarded
38
Page 39

PD-L1 IHC 22C3 pharmDx
TPS < 1% Case Examples
Case 1: TPS < 1%
Figure 27a: 10× magnification.
PD-L1 IHC 22C3 pharmDx Interpretation Manual – NSCLC
Figure 27b: 20× magnification.
Figure 27c: 40× magnification.
Figure 27a–27c: NSCLC specimen stained with PD-L1 antibody
exhibiting TPS < 1%.
39
Page 40

PD-L1 IHC 22C3 pharmDx Interpretation Manual – NSCLC
Case 2: TPS < 1%
Figure 28a: 10× magnification.
Figure 28b: 20× magnification.
Figure 28c: 40× magnification.
Figure 28a–28c: NSCLC specimen stained with PD-L1 antibody
exhibiting TPS < 1%.
40
Page 41

Case 3: TPS < 1%
PD-L1 IHC 22C3 pharmDx Interpretation Manual – NSCLC
Figure 29a: 10× magnification.
Figure 29b: 20× magnification.
Figure 29c: 40× magnification.
Figure 29a–29c: NSCLC specimen stained with PD-L1 antibody exhibiting
TPS < 1%. TAIC are staining, but should be excluded from scoring.
41
Page 42

PD-L1 IHC 22C3 pharmDx Interpretation Manual – NSCLC
Case 4: TPS < 1%
Figure 30a: 10× magnification.
Figure 30b: 20× magnification.
Figure 30c: 40× magnification.
Figure 30a–30c: NSCLC specimen stained with PD-L1 antibody exhibiting
TPS < 1%. TAIC are staining, but should be excluded from scoring.
42
Page 43

PD-L1 IHC 22C3 pharmDx
TPS 0–10% Case Examples
Challenging Case 1:
TPS 0–10%
Figure 31a: 10× magnification.
PD-L1 IHC 22C3 pharmDx Interpretation Manual – NSCLC
Figure 31b: 20× magnification.
Figure 31c: 40× magnification.
Figure 31a–31c: NSCLC specimen stained with PD-L1 antibody
exhibiting TPS < 1%.
43
Page 44

PD-L1 IHC 22C3 pharmDx Interpretation Manual – NSCLC
Challenging Case 2:
TPS 0–10%
Figure 32a: 10× magnification.
Figure 32b: 20× magnification.
Figure 32c: 40× magnification.
Figure 32a–32c: NSCLC specimen stained with PD-L1 antibody
exhibiting TPS < 1%.
44
Page 45

Challenging Case 3:
TPS 0–10%
PD-L1 IHC 22C3 pharmDx Interpretation Manual – NSCLC
Figure 33a: 10× magnification.
Figure 33b: 20× magnification.
Figure 33c: 40× magnification.
Figure 33a–33c: NSCLC specimen stained with PD-L1 antibody
exhibiting TPS 1–10%.
45
Page 46

PD-L1 IHC 22C3 pharmDx Interpretation Manual – NSCLC
Challenging Case 4:
TPS 0–10%
Figure 34a: 10× magnification.
Figure 34b: 20× magnification.
Figure 34c: 40× magnification.
Figure 34a–34c: NSCLC specimen stained with PD-L1 antibody
exhibiting TPS 1–10%.
46
Page 47

Challenging Case 5:
TPS 0–10%
PD-L1 IHC 22C3 pharmDx Interpretation Manual – NSCLC
Figure 35a: 10× magnification.
Figure 35b: 20× magnification.
Figure 35c: 40× magnification.
Figure 35a–35c: NSCLC specimen stained with PD-L1 antibody
exhibiting TPS 1–10%.
47
Page 48

PD-L1 IHC 22C3 pharmDx Interpretation Manual – NSCLC
PD-L1 IHC 22C3 pharmDx
TPS 1–49% Case Examples
Case 5: TPS 1–49%
Figure 36a: 10× magnification.
Figure 36b: 20× magnification.
Figure 36c: 40× magnification.
Figure 36a–36c: NSCLC specimen stained with PD-L1 antibody
exhibiting TPS 1–49%.
48
Page 49

Case 6: TPS 1–49%
PD-L1 IHC 22C3 pharmDx Interpretation Manual – NSCLC
Figure 37a: 10× magnification.
Figure 37b: 20× magnification.
Figure 37c: 40× magnification.
Figure 37a–37c: NSCLC specimen stained with PD-L1 antibody
exhibiting TPS 1–49%.
49
Page 50

PD-L1 IHC 22C3 pharmDx Interpretation Manual – NSCLC
Case 7: TPS 1–49%
Figure 38a: 10× magnification.
Figure 38b: 20× magnification.
Figure 38c: 40× magnification.
Figure 38a–38c: NSCLC specimen stained with PD-L1 antibody
exhibiting TPS 1–49%.
50
Page 51

Case 8: TPS 1–49%
PD-L1 IHC 22C3 pharmDx Interpretation Manual – NSCLC
Figure 39a: 10× magnification.
Figure 39b: 20× magnification.
Figure 39c: 40× magnification.
Figure 39a–39c: NSCLC specimen stained with PD-L1 antibody
exhibiting TPS 1–49%.
51
Page 52

PD-L1 IHC 22C3 pharmDx Interpretation Manual – NSCLC
PD-L1 IHC 22C3 pharmDx
TPS ≥ 50% Case Examples
Case 9: TPS ≥ 50%
Figure 40a: 10× magnification.
Figure 40b: 20× magnification.
Figure 40c: 40× magnification.
Figure 40a–40c: NSCLC specimen stained with PD-L1 antibody
exhibiting TPS ≥ 50%.
52
Page 53

Case 10: TPS ≥ 50%
PD-L1 IHC 22C3 pharmDx Interpretation Manual – NSCLC
Figure 41a: 10× magnification.
Figure 41b: 20× magnification.
Figure 41c: 40× magnification.
Figure 41a–41c: NSCLC specimen stained with PD-L1 antibody
exhibiting TPS ≥ 50%.
53
Page 54

PD-L1 IHC 22C3 pharmDx Interpretation Manual – NSCLC
Case 11: TPS ≥ 50%
Figure 42a: 10× magnification.
Figure 42b: 20× magnification.
Figure 42c: 40× magnification.
Figure 42a–42c: NSCLC specimen stained with PD-L1 antibody
exhibiting TPS ≥ 50%.
54
Page 55

Case 12: TPS ≥ 50%
PD-L1 IHC 22C3 pharmDx Interpretation Manual – NSCLC
Figure 43a: 10× magnification.
Figure 43b: 20× magnification.
Figure 43c: 40× magnification.
Figure 43a–43c: NSCLC specimen stained with PD-L1 antibody
exhibiting TPS ≥ 50%.
55
Page 56

PD-L1 IHC 22C3 pharmDx Interpretation Manual – NSCLC
Case 13: TPS ≥ 50%
Figure 44a: 10× magnification.
Figure 44b: 20× magnification.
Figure 44c: 40× magnification.
Figure 44a–44c: NSCLC specimen stained with PD-L1 antibody
exhibiting TPS ≥ 50%.
56
Page 57

Case 14: TPS ≥ 50%
PD-L1 IHC 22C3 pharmDx Interpretation Manual – NSCLC
Figure 45a: 10× magnification.
Figure 45b: 20× magnification.
Figure 45c: 40× magnification.
Figure 45a–45c: NSCLC specimen stained with PD-L1 antibody
exhibiting TPS ≥ 50%.
57
Page 58

PD-L1 IHC 22C3 pharmDx Interpretation Manual – NSCLC
Case 15: TPS ≥ 50%
Figure 46a: 10× magnification.
Figure 46b: 20× magnification.
Figure 46c: 40× magnification.
Figure 46a–46c: NSCLC specimen stained with PD-L1 antibody
exhibiting TPS ≥ 50%.
58
Page 59

PD-L1 IHC 22C3 pharmDx
TPS 40–60% Case Examples
Challenging Case 6:
TPS 40–60%
Figure 47a: 10× magnification.
PD-L1 IHC 22C3 pharmDx Interpretation Manual – NSCLC
Figure 47b: 20× magnification.
Figure 47c: 40× magnification.
Figure 47a–47c: NSCLC specimen stained with PD-L1 antibody
exhibiting TPS 40%.
59
Page 60

PD-L1 IHC 22C3 pharmDx Interpretation Manual – NSCLC
Challenging Case 7:
TPS 40–60%
Figure 48a: 10× magnification.
Figure 48b: 20× magnification.
Figure 48c: 40× magnification.
Figure 48a–48c: NSCLC specimen stained with PD-L1 antibody
exhibiting TPS 40%.
60
Page 61

Challenging Case 8:
TPS 40–60%
PD-L1 IHC 22C3 pharmDx Interpretation Manual – NSCLC
Figure 49a: 10× magnification.
Figure 49b: 20× magnification.
Figure 49c: 40× magnification.
Figure 49a–49c: NSCLC specimen stained with PD-L1 antibody
exhibiting TPS 50%.
61
Page 62

PD-L1 IHC 22C3 pharmDx Interpretation Manual – NSCLC
Challenging Case 9:
TPS 40–60%
Figure 50a: 10× magnification.
Figure 50b: 20× magnification.
Figure 50c: 40× magnification.
Figure 50a–50c: NSCLC specimen stained with PD-L1 antibody
exhibiting TPS 60%.
62
Page 63

Challenging Case 10:
TPS 40–60%
PD-L1 IHC 22C3 pharmDx Interpretation Manual – NSCLC
Figure 51a: 10× magnification.
Figure 51b: 20× magnification.
Figure 51c: 40× magnification.
Figure 51a–51c: NSCLC specimen stained with PD-L1 antibody
exhibiting TPS 60%.
63
Page 64

PD-L1 IHC 22C3 pharmDx Interpretation Manual – NSCLC
Artifacts
The following pages provide examples of artifacts you may see when staining with
PD-L1 IHC 22C3 pharmDx.
Non-specific
Background Staining
Background staining is defined as diffuse, non-specific staining of a specimen.
It is caused by several factors. These factors include, but are not limited to:
– Pre-analytic fixation and processing of the specimen
– Incomplete removal of paraffin from the section
– Incomplete rinsing of slides during staining
– Drying of slides; ensure slides remain wet with buffer while loading
onto Autostainer Link 48 and prior to initiating run
– Improper deparaffinization procedure
– Incomplete rinsing of reagents from slides
The non-specific background staining of the NCR-stained test specimen is useful
in determining the level of background staining in the positive test specimen.
All specimens must have ≤ 1+ non-specific background staining.
The use of fixatives other than neutral buffered formalin may be a source of
background staining and is not recommended. Background staining with
PD-L1 IHC 22C3 pharmDx is rare.
Figure 52: NSCLC specimen stained with PD- L1 primary antibody exhibiting acceptable
non-specific background staining (20× magnification).
64
Page 65

PD-L1 IHC 22C3 pharmDx Interpretation Manual – NSCLC
Figure 53: NSCLC specimen stained with PD-L1 primary antibody exhibiting unacceptable
non-specific background staining ( > 1+) (20× magnification).
Figure 54: NSCLC specimen stained with NCR exhibiting acceptable non-specific background
staining (20× magnification).
Key Point
All specimens must have ≤ 1+ non-specific background staining
65
Page 66

PD-L1 IHC 22C3 pharmDx Interpretation Manual – NSCLC
Edge Artifact
Commonly, edge artifact is linked to the following pre-analytic factors:
– Thick tissue sections
– Drying of tissue prior to fixation or during staining procedure
Both factors can lead to accentuation of staining at the periphery of the section
and minimal staining or non-staining in the central portion. Only PD-L1 staining at
the edge of the tissue section is excluded from scoring.
Figure 55a: NSCLC specimen stained with PD -L1 primary antibody exhibiting edge artifact
staining; edge staining should be excluded from the scoring (4× magnification).
Figure 55b: NSCLC specimen stained with PD -L1 primary antibody exhibiting edge artifact
staining; edge staining should be excluded from the scoring (20× magnification).
Key Point
Scoring of the edge of a specimen should be avoided if staining is
inconsistent with the rest of the specimen
66
Page 67

PD-L1 IHC 22C3 pharmDx Interpretation Manual – NSCLC
Crush Artifact
Areas of the examined section exhibiting cytologically and morphologically
distorted secondary crush artifact may show exaggerated staining and should be
excluded from the score.
Figure 56: NSCLC specimen stained with PD -L1 primary antibody exhibiting crush artifact
(10× magnification).
Key Point
Scoring of crush artifact should be avoided
Necrosis
Necrosis can be described as morphological changes indicative of cell death
with undefined cellular detail. Necrosis is often present in NSCLC specimens and
should be excluded from scoring.
Figure 57: NSCLC specimen stained with PD -L1 primary antibody exhibiting strong staining of
necrosis and viable tumor cells; necrosis staining should be excluded from the scoring
(20× magnification).
Key Point
Scoring of necrotic areas should be excluded from the TPS
67
Page 68

PD-L1 IHC 22C3 pharmDx Interpretation Manual – NSCLC
Poor Fixation
Standardization of fixation is very important when using PD-L1 IHC 22C3
pharmDx. Sub-optimal fixation on tissues may give erroneous results.
Figure 58: NSCLC specimen stained with PD-L1 primary antibody exhibiting poor tissue fixation
(10× magnification).
Key Point
Proper fixation is important for accurate diagnosis
68
Page 69

Troubleshooting Guide
PD-L1 IHC 22C3 pharmDx Interpretation Manual – NSCLC
Troubleshooting Guidelines
for PD-L1 IHC 22C3 pharmDx
For further troubleshooting help, contact your local Agilent representative.
Problem Probable Cause Suggested Action
Verify that the PD-L1 IHC 22C3 pharmDx
program was selected for programming
of slides
Verify that DAB+ Substrate-Chromogen
Solution was prepared properly
Check kit expiration date and kit storage
conditions on outside of package
Ensure that only neutral buffered formalin
fixative and approved fixation methods
are used
Check size of tissue section and reagent
volume applied
Verify that the 3-in-1 pre-treatment
procedure was correctly performed
Verify that the 3-in-1 pre-treatment
procedure was correctly performed
Ensure slides remain wet with buffer
while loading and prior to initiating run
Check for proper fixation of the specimen
and/or the presence of necrosis
Ensure that only neutral buffered formalin
fixative and recommended fixation
methods are used
Use Dako FLEX IHC Microscope Slides,
(Code K8020), or charged slides (such as
Superfrost Plus).
Cut sections should be placed in a
58 ± 2 °C oven for 1 hour prior to staining
Ensure that only approved fixatives
and fixation methods are used
This is normal and does not
influence staining
No staining of slides
Weak staining of
specimen slides
Weak staining of
specimen slides or
of the positive cell
line pellet on the
Dako-provided
Control Slide
Excessive background
staining of slides
Tissue detached
from slides
Excessively strong
specific staining
Target Retrieval Solution
is cloudy in appearance
when heated
Programming error
Lack of reaction with DAB+
Substrate-Chromogen
Solution (DAB)
Sodium azide in wash buffer Use only Dako Wash Buffer (Code K8007)
Degradation of Control Slide
Inappropriate fixation
method used
Insufficient reagent
volume applied
Inappropriate wash buffer used Use only Dako Wash Buffer (Code K8007)
Inadequate target retrieval
Inappropriate wash buffer used Use only Dako Wash Buffer (Code K8007)
Paraffin incompletely removed
Slides dried while loading onto
Autostainer Link 48
Nonspecific binding of
reagents to tissue section
Inappropriate fixation
method used
Use of incorrect
microscope slides
Inadequate preparation
of specimens
Inappropriate fixation
method used
Inappropriate wash buffer used Only use Dako Wash Buffer (Code K8007)
When heated the Target
Retrieval Solution turns cloudy
in appearance
Note: If the problem cannot be attributed to any of the above causes, or if the
suggested corrective action fails to resolve the problem, please call Agilent
Technical Support for further assistance. Additional information on staining
techniques and specimen preparation can be found in Dako Education Guide:
Immunohistochemical Staining Methods (available from Agilent Technologies).
69
Page 70

PD-L1 IHC 22C3 pharmDx Interpretation Manual – NSCLC
Clinical Performance Evaluation
KEYNOTE-042: Controlled
Trial of NSCLC Patients
Naïve to Treatment
The safety and efficacy of pembrolizumab were also investigated in
KEYNOTE-042, a multicenter, controlled study for the treatment of previously
untreated locally advanced or metastatic NSCLC. The study design was similar
to that of KEYNOTE-024 (see page 73), except that patients had PD-L1 expression
with a TPS ≥ 1% based on PD-L1 IHC 22C3 pharmDx. Patients were randomized
(1:1) to receive pembrolizumab at a dose of 200 mg every 3 weeks (n=637)
or investigator’s choice platinum-containing chemotherapy (n=637; including
pemetrexed+carboplatin or paclitaxel+carboplatin; patients with non-squamous
NSCLC could receive pemetrexed maintenance). Assessment of tumor status was
performed every 9 weeks for the first 45 weeks, and every 12 weeks thereafter.
Among the 1,274 patients in KEYNOTE-042, 599 (47%) had tumors that
expressed PD-L1 with TPS ≥ 50% based on PD-L1 IHC 22C3 pharmDx. The
baseline characteristics of these 599 patients included: median age 63 years
(45% age 65 or older); 69% male; 63% White and 32% Asian; 17% Hispanic or
Latino; and ECOG performance status 0 and 1 in 31% and 69%, respectively.
Disease characteristics were squamous (37%) and non-squamous (63%); stage
IIIA (0.8%); stage IIIB (9%); stage IV (90%); and treated brain metastases (6%).
The primary efficacy outcome measure was OS. Secondary efficacy outcome
measures were PFS and ORR (as assessed by BICR using RECIST 1.1). The trial
demonstrated a statistically significant improvement in OS for patients whose
tumors expressed PD-L1 TPS ≥ 1% randomized to pembrolizumab monotherapy
compared to chemotherapy (HR 0.82; 95% CI 0.71, 0.93 at the final analysis)
and in patients whose tumors expressed PD-L1 TPS ≥ 50% randomized to
pembrolizumab monotherapy compared to chemotherapy. Table 5 summarizes
key efficacy measures for the TPS ≥ 50% population at the final analysis
performed at a median follow-up of 15.4 months. The Kaplan-Meier curve for OS
for the TPS ≥ 50% population based on the final analysis is shown in Figure 59.
70
Page 71

PD-L1 IHC 22C3 pharmDx Interpretation Manual – NSCLC
Table 5: Efficacy Results (PD-L1 TPS ≥ 50%) in KEYNOTE-042
Endpoint
Pembrolizumab
200 mg every 3 weeks
n=299
Chemotherapy
n=300
OS
Number (%) of patients with event 180 (60%) 220 (73%)
Hazard ratio* (95% CI) 0.70 (0.58, 0.86)
p-Value
†
0.0003
Median in months (95% CI) 20.0 (15.9, 24.2) 12.2 (10.4, 14.6)
PFS
Number (%) of patients with event 238 (80%) 250 (83%)
Hazard ratio* (95% CI) 0.84 (0.70, 1.01)
Median in months (95% CI) 6.5 (5.9, 8.5) 6.4 (6.2, 7.2)
Objective Response Rate
ORR % (95% CI) 39% (34, 45) 32% (27, 38)
Complete response % 1% 0.3%
Partial response % 38% 32%
Response Duration
Median in months (range) 22.0
‡
10.8
(2.1+, 36.5+)
(1.8+, 30.4+)
% with duration ≥ 18 months 57% 34%
* Hazard ratio (pembrolizumab compared to chemotherapy) based on the stratified Cox proportional hazard model
†
Based on stratified log-rank test
‡
Based on patients with a best objective response as confirmed complete or partial response
71
Page 72

PD-L1 IHC 22C3 pharmDx Interpretation Manual – NSCLC
Number at Risk
Pembrolizumab:
Chemotherapy:
100
90
80
70
60
50
40
Overall Survival (%)
30
20
10
0
0 2412 366 3018 42
299
300
Treatment arm
Pembrolizumab
Chemotherapy
231 113151 59 31 8 2 0
OS rate at
12 months
64% 45% 0.70 (0.58, 0.86) 0.0003
51 % 30%
Time in Months
157190224 94 50 21 1 0
OS rate at
24 months
HR (95% Cl)
Figure 59: Kaplan-Meier cur ve for overall survival by treatment arm in KEYNOTE-042
(patients with PD-L1 expression TPS ≥ 50%, intent to treat population).
p-value
48
The results of a post-hoc exploratory subgroup analysis indicated a trend towards
reduced survival benefit of pembrolizumab compared to chemotherapy, during
both the first 4 months and throughout the entire duration of treatment, in patients
who were never-smokers. However, due to the exploratory nature of this subgroup
analysis, no definitive conclusions can be drawn.
72
Page 73

PD-L1 IHC 22C3 pharmDx Interpretation Manual – NSCLC
KEYNOTE-024: Controlled
Study of NSCLC Patients
Naïve to Treatment
The safety and efficacy of pembrolizumab were investigated in KEYNOTE-024,
a multicenter, open label, controlled study for the treatment of previously
untreated metastatic NSCLC. Patients had PD-L1 expression with a ≥ 50%
TPS based on PD-L1 IHC 22C3 pharmDx. Patients were randomized (1:1)
to receive pembrolizumab at a dose of 200 mg every 3 weeks (n=154) or
investigator’s choice platinum-containing chemotherapy (n=151; including
pemetrexed+carboplatin, pemetrexed+cisplatin, gemcitabine+cisplatin,
gemcitabine+carboplatin, or paclitaxel+carboplatin; patients with non-squamous
NSCLC could receive pemetrexed maintenance). Patients were treated with
pembrolizumab until unacceptable toxicity or disease progression. Treatment
could continue beyond disease progression if the patient was clinically stable and
was considered to be deriving clinical benefit by the investigator. Patients without
disease progression could be treated for up to 24 months. The study excluded
patients with EGFR or ALK genomic tumor aberrations; autoimmune disease that
required systemic therapy within 2 years of treatment; a medical condition that
required immunosuppression; or who had received more than
30 Gy of thoracic radiation within the prior 26 weeks. Assessment of tumor
status was performed every 9 weeks. Patients on chemotherapy who
experienced independently-verified progression of disease were able to
crossover and receive pembrolizumab.
Among the 305 patients in KEYNOTE-024, baseline characteristics were:
median age 65 years (54% age 65 or older); 61% male; 82% White, 15% Asian;
and ECOG performance status 0 and 1 in 35% and 65%, respectively. Disease
characteristics were squamous (18%) and non-squamous (82%); M1 (99%); and
brain metastases (9%).
The primary efficacy outcome measure was PFS as assessed by blinded
independent central review (BICR) using RECIST 1.1. Secondary efficacy outcome
measures were OS and ORR (as assessed by BICR using RECIST 1.1). Table 6
summarizes key efficacy measures for the entire intent to treat (ITT) population.
PFS and ORR results are reported from an interim analysis at a median follow up
of 11 months. OS results are reported from the final analysis at a median follow
up of 25 months.
73
Page 74

PD-L1 IHC 22C3 pharmDx Interpretation Manual – NSCLC
Table 6: Efficacy Results in KEYNOTE-024
Endpoint
Pembrolizumab
200 mg every 3 weeks
n=154
Chemotherapy
n=151
PFS
Number (%) of patients with event 73 (47%) 116 (77%)
Hazard ratio* (95% CI) 0.50 (0.37, 0.68)
p-Value
†
< 0.001
Median in months (95% CI) 10.3 (6.7, NA) 6.0 (4.2, 6.2)
OS
Number (%) of patients with event 73 (47%) 96 (64%)
Hazard ratio* (95% CI) 0.63 (0.47, 0.86)
†
p-Value
Median in months (95% CI) 30.0
(18.3, NA)
0.002
14.2
(9.8, 19.0)
Objective Response Rate
ORR (95% CI) 45% (37, 53) 28% (21, 36)
Complete response % 4% 1%
Partial response % 41% 27%
Response Duration
Median in months (range) Not reached
% with duration ≥ 6 months 88%
‡
6.3
(1.9+, 14.5+)
§
(2.1+, 12.6+)
¶
59%
* Hazard ratio (pembrolizumab compared to chemotherapy) based on the stratified Cox proportional hazard model
†
Based on stratified log-rank test
‡
Based on patients with a best objective response as confirmed complete or partial response
§
Based on Kaplan-Meier estimates; includes 43 patients with responses of 6 months or longer
¶
Based on Kaplan-Meier estimates; includes 16 patients with responses of 6 months or longer
NA = not available
74
Page 75

PD-L1 IHC 22C3 pharmDx Interpretation Manual – NSCLC
Number at Risk
Pembrolizumab:
Chemotherapy:
100
90
80
70
60
50
40
30
Progression-Free Survival
20
10
0
154 89104 44 22 3 1
151 7099 18 9 1 0
Treatment arm
Pembrolizumab
Chemotherapy
PFS rate at
6 months
62% 48% 0.50 (0.37, 0.68) <0.001
50% 15%
Time in Months
PFS rate at
12 months
HR (95% Cl)
p-value
180 3 6 9 12 15
Figure 60: Kaplan-Meier curve for progression -free survival by treatment arm in KEYNOTE-024
(intent to treat population).
Number at Risk
Pembrolizumab:
Chemotherapy:
Treatment arm
100
90
80
70
60
50
40
Overall Survival (%)
30
20
10
0
0 126 183 159 21 24 27 30 33
154 106121 89136 96112 83 52 22 5 0
151 80107 61123 7088 55 31 16 5 0
Pembrolizumab
Chemotherapy
OS rate at
12 months
70% 52% 0.63 (0.47, 0.86) 0.002
55% 35%
Time in Months
OS rate at
24 months
HR (95% Cl)
Figure 61: Kaplan-Meier curve for overall survival by treatment arm in KEYNOTE-024
(intent to treat population).
p-value
In a subgroup analysis, a reduced survival benefit of pembrolizumab compared
to chemotherapy was observed in the small number of patients who were
never-smokers; however, due to the small number of patients, no definitive
conclusions can be drawn from these data.
75
Page 76

PD-L1 IHC 22C3 pharmDx Interpretation Manual – NSCLC
KEYNOTE-010:
Controlled Trial of NSCLC
Patients Previously Treated
with Chemotherapy
The clinical benefit of PD-L1 IHC 22C3 pharmDx was investigated in
KEYNOTE-010, a multicenter, open-label, randomized clinical study conducted
to assess the safety and efficacy of KEYTRUDA in patients with advanced
NSCLC previously treated with platinum-containing chemotherapy. Patients
had PD-L1 expression with a TPS ≥ 1% based on a clinical trial assay (CTA)
version of PD-L1 IHC 22C3 pharmDx. Patients with EGFR activation mutation
or ALK translocation also had disease progression on approved therapy for
these mutations prior to receiving pembrolizumab. Patients were randomized
(1:1:1) to receive pembrolizumab at a dose of 2 (n=344) or 10 mg/kg (n=346)
2
every 3 weeks or docetaxel at a dose of 75 mg/m
every 3 weeks (n=343) until
disease progression or unacceptable toxicity. The trial excluded patients with
autoimmune disease; a medical condition that required immunosuppression;
or who had received more than 30 Gy of thoracic radiation within the prior 26
weeks. Assessment of tumor status was performed every 9 weeks. The primary
efficacy outcome measures were OS and PFS as assessed by BICR
using RECIST 1.1.
Based on the CTA, a total of 1,033 NSCLC patients were randomized in the study.
To evaluate the clinical utility of PD-L1 IHC 22C3 pharmDx, archived clinical study
samples were retrospectively tested at a US based reference laboratory with
PD-L1 IHC 22C3 pharmDx. Out of the 1,033 patients, tumor tissue from
529 patients was retrospectively tested with the PD-L1 IHC 22C3 pharmDx test.
Specimens from 413 patients had PD-L1 expression (≥ 1% of viable tumor cells
exhibiting membrane staining at any intensity) and samples from 94 patients
did not have PD-L1 expression (< 1% of viable tumor cells exhibiting membrane
staining at any intensity). Within these 413 patients with PD-L1 expression,
specimens from 163 patients had high PD-L1 expression (≥ 50% of viable tumor
cells exhibiting membrane staining at any intensity).
The level of agreement achieved between the CTA and PD-L1 IHC 22C3 pharmDx
is shown in Table 7.
Table 7: CTA vs. PD-L1 IHC 22C3 pharmDx Agreement
Agreement Rates
CTA vs. PD-L1 IHC
22C3 pharmDx
PD-L1
Cut-off
TPS ≥ 1% 94.5% [91.4%–96.6%] 80.0% [76.9%–82.8%]
TPS ≥ 50% 98.3% [97.1%–99.0%] 73.2% [67.9%–77.9%]
Negative Percent Agreement
(95% Confidence Interval (CI))
Positive Percent Agreement
(95% Confidence Interval (CI))
Among randomized patients having PD-L1 expression by PD-L1 IHC 22C3 pharmDx,
the demographic and other baseline characteristics were well balanced between
the treatment arms. The median age was 63 years (44% age 65 or older).
The majority of patients were White (77%) and male (58%); baseline ECOG
performance status was 0 (29%) or 1 (71%). Seventy-eight percent (78%) of
patients were former/current smokers. Twenty-two percent (22%) of patients
had squamous histology and 69% had non-squamous histology. The baseline
and demographic characteristics were similarly well balanced across
pembrolizumab and docetaxel arms in the overall clinical study.
76
Page 77

PD-L1 IHC 22C3 pharmDx Interpretation Manual – NSCLC
Efficacy results are summarized in Tables 8 and 9. KEYTRUDA demonstrated
durable clinical benefit in NSCLC patients with PD-L1 expression (TPS ≥ 1%),
which was enhanced in patients with high PD-L1 expression (TPS ≥ 50%),
as determined by PD-L1 IHC 22C3 pharmDx. The magnitude of benefit was
comparable to that in the overall clinical trial. The tables below summarize key
efficacy measures in the overall population with PD-L1 expression (TPS ≥ 1%)
and in the high PD-L1 expression (TPS ≥ 50%) subset for the overall clinical study
(TPS ≥ 1% by CTA) and in the population with PD-L1 expression by PD-L1 IHC
22C3 pharmDx. The Kaplan-Meier curve for OS (TPS ≥ 1%), as determined by
PD-L1 IHC 22C3 pharmDx, is shown in Figure 61. Efficacy results were similar for
the 2 mg/kg and 10 mg/kg KEYTRUDA arms.
Table 8: Response to KEYTRUDA in Previously Treated NSCLC Patients: Overall Clinical Trial and
Patients with PD-L1 Expression, TPS ≥ 1%, as Determined by PD-L1 IHC 22C3 pharmDx
Endpoint
Number of patients 344 140 346 142 343 131
OS
Deaths (%) 172 (50%) 59 (42%) 156 (45%) 59 (42%) 193 (56%) 67 (51%)
Hazard ratio*
(95% CI)
†
p-Value
Median in months
(95% CI)
‡
PFS
Events (%) 266 (77%) 97 (63%) 255 (74%) 103 (73%) 257 (75%) 94 (72%)
Hazard ratio*
(95% CI)
†
p-Value
Median in months
(95% CI)
Overall response rate
ORR %§
(95% CI)
KEYTRUDA
2 mg/kg every 3 weeks
Clinical Trial
0.71
(0.58, 0.88)
<0.001 <0.001 <0.001 0.00115 - -
10.4
(9.4, 11.9)
0.88
(0.73, 1.04)
0.068 0.00578 0.005 0.05767 - -
3.9
(3.1, 4.1)
‡
18%
(14, 23)
PD-L1
IHC 22C3
pharmDx
0.54
(0.37, 0.78)
11.8
(9.6, NA)
0.68
(0.50, 0.92)
4.9
(4.1, 6.2)
24%
(17, 32)
KEYTRUDA
10 mg/kg every 3 weeks
Clinical Trial
0.61
(0.49, 0.75)
12.7
(10.0, 17.3)
0.79
(0.66, 0.94)
4.0
(2.6, 4.3)
18%
(15, 23)
PD-L1
IHC 22C3
pharmDx
0.57
(0.39, 0.82)
12.0
(8.7, NA)
0.79
(0.59, 1.06)
4.0
(2.2, 4.6)
20%
(14, 28)
Docetaxel
2
75 mg/m
every 3 weeks
Clinical Trial
- -
8.5
(7.5, 9.8)
- -
4.0
(3.1, 4.2)
9%
(7, 13)
PD-L1
IHC 22C3
pharmDx
7.5
(6.3, 9.9)
3.8
(2.2, 4.2)
5%
(2, 11)
* Hazard ratio (KEYTRUDA compared to docetaxel) based on the stratified Cox proportional hazard model
†
Based on stratified Log rank test
‡
Assessed by BICR using RECIST 1.1
§
All responses were partial responses
77
Page 78

PD-L1 IHC 22C3 pharmDx Interpretation Manual – NSCLC
Table 9: Response to KEYTRUDA in Previously Treated NSCLC Patients: Overall Clinical Trial and
Patients with PD-L1 High Expression, TPS ≥ 50%, as Determined by PD-L1 IHC 22C3 pharmDx
Endpoint
KEYTRUDA
2 mg/kg every 3 weeks
PD-L1
Clinical Trial
IHC 22C3
pharmDx
KEYTRUDA
10 mg/kg every 3 weeks
PD-L1
Clinical Trial
IHC 22C3
pharmDx
Docetaxel
2
75 mg/m
Clinical Trial
every 3 weeks
PD-L1
IHC 22C3
pharmDx
Number of patients 139 56 151 60 152 47
OS
Deaths (%) 58 (42%) 18 (32%) 60 (40%) 19 (32%) 86 (57%) 25 (53%)
Hazard ratio*
(95% CI)
†
p-Value
Median in months
(95% CI)
‡
PFS
0.54
(0.38, 0.77)
0.45
(0.24, 0.84)
0.50
(0.36, 0.70)
0.29
(0.15, 0.56)
- -
<0.001 0.00541 <0.001 <0.001 - -
14.9
(10.4, NA)
Not reached
(9.3, NA)
17.3
(11.8, NA)
Not reached
(8.3, NA)
8.2
(6.4, 10.7)
7.2
(4.4, 8.3)
Events (%) 89 (64%) 33 (59%) 97 (64%) 34 (57%) 118 (78%) 33 (70%)
Hazard ratio*
(95% CI)
†
p-Value
Median in months
(95% CI)
Overall response rate
ORR %§
(95% CI)
0.58
(0.43, 0.77)
0.47
(0.28, 0.80)
0.59
(0.45, 0.78)
0.41
(0.24, 0.70)
- -
<0.001 0.00221 <0.001 <0.001 - -
5.2
(4.0, 6.5)
‡
30%
(23, 39)
5.9
(4.2, 9.0)
37%
(25, 52)
5.2
(4.1, 8.1)
29%
(22, 37)
4.8
(2.8, NA)
28%
(18, 41)
4.1
(3.6, 4.3)
8%
(4, 13)
3.9
(2.0, 4.3)
4%
(1, 15)
* Hazard ratio (KEYTRUDA compared to docetaxel) based on the stratified Cox proportional hazard model
†
Based on stratified Log rank test
‡
Assessed by BICR using RECIST 1.1
§
All responses were partial responses
78
Page 79

110
100
90
80
70
60
50
40
Overall Survival (%)
30
20
10
0
0 20105 2515
n at risk
2
Docetaxel 75 mg/m
MK—3475 2 mg/kg Q3W
MK—3475 10 mg/kg Q3W
Q3W
131 01478 03
140 136109 010
142 03699 010
PD-L1 IHC 22C3 pharmDx Interpretation Manual – NSCLC
Docetaxel 75 mg/m2 Q3W
MK—3475 2 mg/kg Q3W
MK—3475 10 mg/kg Q3W
Time in Months
Figure 62: Kaplan-Meier Curve for Overall Survival by Treatment Arm ( TPS ≥ 1% by PD -L1
IHC 22C3 pharmDx, Intent to Treat Population).
Additional robustness analyses were conducted to consider the potential impact
of missing data arising from patients with PD-L1 expression (TPS ≥ 1%) by PD-L1
IHC 22C3 pharmDx, but who may have had no PD-L1 expression (TPS < 1%)
by the CTA. Patients with such test results are part of the intended use/intent
to diagnose (ITD)/population of PD-L1 IHC 22C3 pharmDx; however, they were
excluded from the clinical trial due to no PD-L1 expression upon CTA screening.
To account for these missing data, a sensitivity analysis was conducted to
understand the plausible range for the hazard ratio (HR) estimated based on
PD-L1 IHC 22C3 pharmDx in the TPS ≥ 1% and TPS ≥ 50% subpopulations under
an ITD framework to verify the consistency with the observed HR based on
enrollment with the CTA. The HR sensitivity analysis results showed that the HR
estimates are robust to any assumed attenuation of the treatment effect under
the ITD framework.
79
Page 80

PD-L1 IHC 22C3 pharmDx Interpretation Manual – NSCLC
References
– Keytruda [Summary of Product Characteristics]. European Medicines
Agency; 2020.
– PD-L1 IHC 22C3 pharmDx [package insert]. Carpinteria, CA: Dako, Agilent
Pathology Solutions; 2020.
– Reck M, Rodríguez-Abreu D, Robinson AG, et al. Pembrolizumab versus
chemotherapy for PD-L1–positive non–small-cell lung cancer. N Engl J Med.
2016; 375(19):1823-1833.
– Herbst RS, Baas P, Kim DW, et al. Pembrolizumab versus docetaxel for
previously treated, PD-L1-positive, advanced non-small-cell lung cancer
(KEYNOTE-010): a randomised controlled trial. Lancet.
2016;387(10027):1540-1550.
– Roach C, Zhang N, Corigliano E, et al. Development of a companion diagnostic
PD-L1 immunohistochemistry assay for pembrolizumab therapy in non-small-
cell lung cancer. Appl Immunohistochem Mol Morphol. 2016;24:392-397.
– Dolled-Filhart M, Roach C, Toland G, et al. Development of a companion
diagnostic for pembrolizumab in non-small cell lung cancer using
immunohistochemistry for programmed death ligand-1. Arch Pathol Lab Med.
2016. doi:10.5858/arpa.2015-0542-OA.
– Herbst RS, Soria JC, Kowanetz M, et al. Predictive correlates of response
to the anti-PD-L1 antibody MPDL3280A in cancer patients. Nature.
2014;515(7528):563-567.
– Tumeh PC, Harview CL, Yearley JH, et al. PD-1 blockade induces responses
by inhibiting adaptive immune resistance. Nature. 2014;515(7 528):568-571.
– Hanahan D, Weinberg RA. Hallmarks of cancer: the next generation. Cell.
2011;144(5):646-674.
– Sharpe AH, Freeman GJ. The B7-CD28 superfamily. Nat Rev Immunol.
2002;2(2):116-126.
– Keir ME, Butte MJ, Freeman GJ, Sharpe AH. PD-1 and its ligands in tolerance
and immunity. Annu Rev Immunol. 2008;26:677-704.
– Freeman GJ, Long AJ, Iwai Y, et al. Engagement of the PD-1 immunoinhibitory
receptor by a novel B7 family member leads to negative regulation of
lymphocyte activation. J Exp Med. 2000;192(7):1027-1034.
– Dong H, Strome SE, Salomao DR, et al. Tumor-associated B7-H1 promotes
T-cell apoptosis: a potential mechanism of immune evasion. Nat Med.
2002;8(8):793-800.
– Mu CY, Huang JA, Chen Y, Chen C, Zhang XG. High expression of PD-L1 in lung
cancer may contribute to poor prognosis and tumor cells immune escape
through suppressing tumor infiltrating dendritic cells maturation. Med Oncol.
2011;28(3):682-688.
80
Page 81

PD-L1 IHC 22C3 pharmDx Interpretation Manual – NSCLC
– Gettinger S, Herbst RS. B7-H1/PD-1 blockade therapy in non-small cell lung cancer:
current status and future direction. Cancer J. 2014;20(4):281-289.
– Brahmer JR, Tykodi SS, Chow LQ, et al. Safety and activity of anti-PD-L1 antibody in
patients with advanced cancer. N Engl J Med. 2012;366(26):2455-2465.
– Topalian SL, Hodi FS, Brahmer JR, et al. Safety, activity, and immune correlates of
anti-PD-1 antibody in cancer. N Engl J Med. 2012;366(26):2443-2454.
– Boland JM, Kwon ED, Harrington SM, et al. Tumor B7-H1 and B7-H3 expression in
squamous cell carcinoma of the lung. Clin Lung Cancer. 2013;14(2):157-163.
– Chen YB, Mu CY, Huang JA. Clinical significance of programmed death-1 ligand-1
expression in patients with non-small cell lung cancer: a 5-year-follow-up study.
Tumori. 2012;98(6):751-755.
– Velcheti V, Schalper KA, Carvajal DE, et al. Programmed death ligand-1 expression in
non-small cell lung cancer. Lab Invest. 2014;94(1):107-116.
– Garon EB, Rizvi NA, Hui R, et al. Pembrolizumab for the treatment of non-small-cell
lung cancer. N Engl J Med. 2015;372(21):2018-2028.
81
Page 82

PD-L1 IHC 22C3 pharmDx Interpretation Manual – NSCLC
Notes
82
Page 83

PD-L1 IHC 22C3 pharmDx Interpretation Manual – NSCLC
83
Page 84

For PD-L1 testing,
Choose PD-L1 IHC 22C3 pharmDx–
the ONE Leading Assay
with KEYTRUDA® (pembrolizumab)
KEYNOTE
The ONE PD-L1 assay used in KEYTRUDA
clinical trials
1,2
The ONE PD-L1 assay first launched
with KEYTRUDA in every indication
that requires PD-L1 testing
1,2
The ONE PD-L1 assay trusted worldwide
to test hundreds of thousands of patients
for KEYTRUDA
1. PD-L1 IHC 22C3 pharmDx [package insert]. Carpinteria, CA: Dako, Agilent Pathology
Solutions; 2020. 2. Keytruda [Summary of Product Characteristics]. European Medicines
Agency; 2020. 3. Data on le. Agilent Technologies, Inc.
Learn more:
https://www.agilent.com/chem/PDL122C3
3
Europe
info_agilent@agilent.com
For countries outside of the European Union, see the local KEYTRUDA product
label for approved indications and expression cutoff values to guide therapy.
This information is subject to change without notice.
© Agilent Technologies, Inc. 2020
Published in the USA, July 3, 2020
29171 2020JUL03
 Loading...