

Page 1
Agilent
FieldFox
RF Analyzer
N9912A
Data Sheet
Page 2

2
Documentation Warranty
THE MATERIAL CONTAINED IN THIS DOCUMENT IS PROVIDED "AS IS," AND IS SUBJECT TO
BEING CHANGED, WITHOUT NOTICE, IN FUTURE EDITIONS. FURTHER, TO THE MAXIMUM
EXTENT PERMITTED BY APPLICABLE LAW, AGILENT DISCLAIMS ALL WARRANTIES,
EITHER EXPRESS OR IMPLIED WITH REGARD TO THIS MANUAL AND ANY INFORMATION
CONTAINED HEREIN, INCLUDING BUT NOT LIMITED TO THE IMPLIED WARRANTIES OF
MERCHANTABILITY AND FITNESS FOR A PARTICULAR PURPOSE. AGILENT SHALL NOT BE
LIABLE FOR ERRORS OR FOR INCIDENTAL OR CONSEQUENTIAL DAMAGES IN
CONNECTION WITH THE FURNISHING, USE, OR PERFORMANCE OF THIS DOCUMENT OR
ANY INFORMATION CONTAINED HEREIN. SHOULD AGILENT AND THE USER HAVE A
SEPARATE WRITTEN AGREEMENT WITH WARRANTY TERMS COVERING THE MATERIAL IN
THIS DOCUMENT THAT CONFLICT WITH THESE TERMS, THE WARRANTY TERMS IN THE
SEPARATE AGREEMENT WILL CONTROL.
DFARS/Restricted Rights Notice
If software is for use in the performance of a U.S. Government prime contract or subcontract, Software is
delivered and licensed as “Commercial computer software” as defined in DFAR 252.227-7014 (June 1995),
or as a “commercial item” as defined in FAR 2.101(a) or as “Restricted computer software” as defined in
FAR 52.227-19 (June 1987) or any equivalent agency regulation or contract clause. Use, duplication or
disclosure of Software is subject to Agilent Technologies’ standard commercial license terms, and nonDOD Departments and Agencies of the U.S. Government will receive no greater than Restricted Rights as
defined in FAR 52.227-19(c)(1-2) (June 1987). U.S. Government users will receive no greater than Limited
Rights as defined in FAR 52.227-14 (June 1987) or DFAR 252.227-7015 (b)(2) (November 1995), as
applicable in any technical data.
Page 3

3
Table of Contents
Cable and Antenna Analyzer ........................................................... 4
Network Analyzer (Option 303) ...................................................... 8
Spectrum Analyzer (Option 230 and 231) ................................... 13
Preamplifier (Option 235) ............................................................... 21
Interference Analyzer (Option 236) .............................................. 21
Power Meter (Option 302) ............................................................. 21
General Information ........................................................................ 21
Definitions
Specification (spec.)
Warranted performance. Specifications include guardbands to account for the expected statistical performance
distribution, measurement uncertainties, and changes in performance due to environmental conditions. The following
conditions must be met:
FieldFox has been turned on at least 90 minutes
FieldFox is within its calibration cycle
Storage or operation at 25°C ±5 °C range (unless otherwise stated)
Typical (typ.)
Expected performance of an average unit over a 20 °C to 30 °C temperature range after being at ambient temperature
for two hours, unless otherwise indicated; does not include guardbands. It is not covered by the product warranty. The
FieldFox must be within its calibration cycle.
Nominal (nom.)
A general, descriptive term or design parameter. It is not tested, and not covered by the product warranty.
Calibration
The process of measuring known standards to characterize an instrument's systematic (repeatable) errors.
Corrected (residual)
Indicates performance after error correction (calibration). It is determined by the quality of calibration standards and
how well "known" they are, plus system repeatability, stability, and noise.
Uncorrected (raw)
Indicates instrument performance without error correction. The uncorrected performance affects the stability of a
calibration.
Page 4

4
Cable and Antenna Analyzer
Description
Specification
Typical
Supplemental Information
10 minute
warm up
90 minute
warm up
Frequency Range
Option 104
2 MHz to 4 GHz
Option 106
2 MHz to 6 GHz
Frequency Reference
Accuracy
±2 ppm
±2 ppm
Aging Rate
±1 ppm/yr
±1 ppm/yr
Temperature Stability
±1 ppm over 0 to 55 ºC
±1 ppm
Frequency Resolution
2 MHz to 1.6 GHz
2.5 kHz
> 1.6 GHz to 3.2 GHz
5 kHz
> 3.2 GHz to 6 GHz
10 kHz
Resolution (Number of data points)
101, 201, 401, 601, 801,
1001
Measurement Speed
Return Loss
1.75 GHz – 3.85 GHz,
1001 points, Cal ON
1.5 ms/point (nominal)
DTF
0 to 500 ft, 601
points, Cal ON
2.4 ms/point (nominal)
Output Power (RF Out Port)
High
2 MHz to 4 GHz
< +8 dBm, +6 dBm (nominal)
> 4 GHz to 6 GHz
< +7 dBm, +2 dBm (nominal)
Low (Typically 31 dB below high power)
2 MHz to 4 GHz
< –23 dBm, –25 dBm (nominal)
> 4 GHz to 6 GHz
< –24 dBm, –25 dBm (nominal)
Immunity to Interfering Signals
+16 dBm (nominal)
Page 5

5
Cable and Antenna Analyzer (continued)
Description
Specification
Typical
10 minute warm up
90 minute warm up
Directivity
Corrected with OSL calibration 1
>42 dB
>42 dB
Corrected with QuickCal (Option 111) 3
≥42 dB
Raw
2 MHz to 3.5 GHz
> 20 dB
> 3.5 GHz to 6 GHz
> 14 dB
Source Match
Corrected with OSL calibration 1
> 36 dB
> 36 dB
Corrected with QuickCal (Option 111) 3
≥35 dB
Raw 2 MHz to 3 GHz
> 25 dB
> 3 GHz to 6 GHz
> 16 dB
Reflection Tracking
Corrected with OSL calibration 1
±0.06 dB
±0.06 dB
Corrected with QuickCal (Option 111)
3
±0.15 dB
Reflection Dynamic Range
Reflection (RF Out port) (High power out)
2 MHz to 4 GHz
60 dB
> 4 GHz to 6 GHz
55 dB
Maximum Measurable Cable Loss Using 1–Port CAT Measurement Model 2
Refl Dyn Range /2
Transmission Dynamic Range(Option 110)
300 Hz IF Bandwidth
2 MHz to 2 GHz
72 dB
> 2 GHz to 3 GHz
67 dB
> 3 GHz to 5 GHz
58 dB
> 5 GHz to 6 GHz
49 dB
Return Loss
Display Range
0 to 100 dB
Resolution
0.01 dB
VSWR
Display Range
1 to 500
Resolution
0.01
Cable Loss
Display Range
0 to 100 dB
Resolution
0.01 dB
Page 6
6
Cable and Antenna Analyzer (continued)
Description
Specification
Supplemental Information
Distance–to–Fault
Horizontal Range
Range = [(number of points – 1) /
frequency span * 2] * velocity factor *
speed of light
Number of points auto coupled according to start
and stop distance entered
Horizontal
Resolution
Resolution = Range / (number of
points – 1)
Number of points settable by user
Bandpass Mode
Window Types
Maximum, medium, and minimum windows
1
Using recommended calibration kits.
2
Higher cable losses can be measured using transmission or S21 measurements. Cable losses measured in
transmission mode limited by transmission dynamic range.
3
QuickCal is performed with the connect LOAD step.
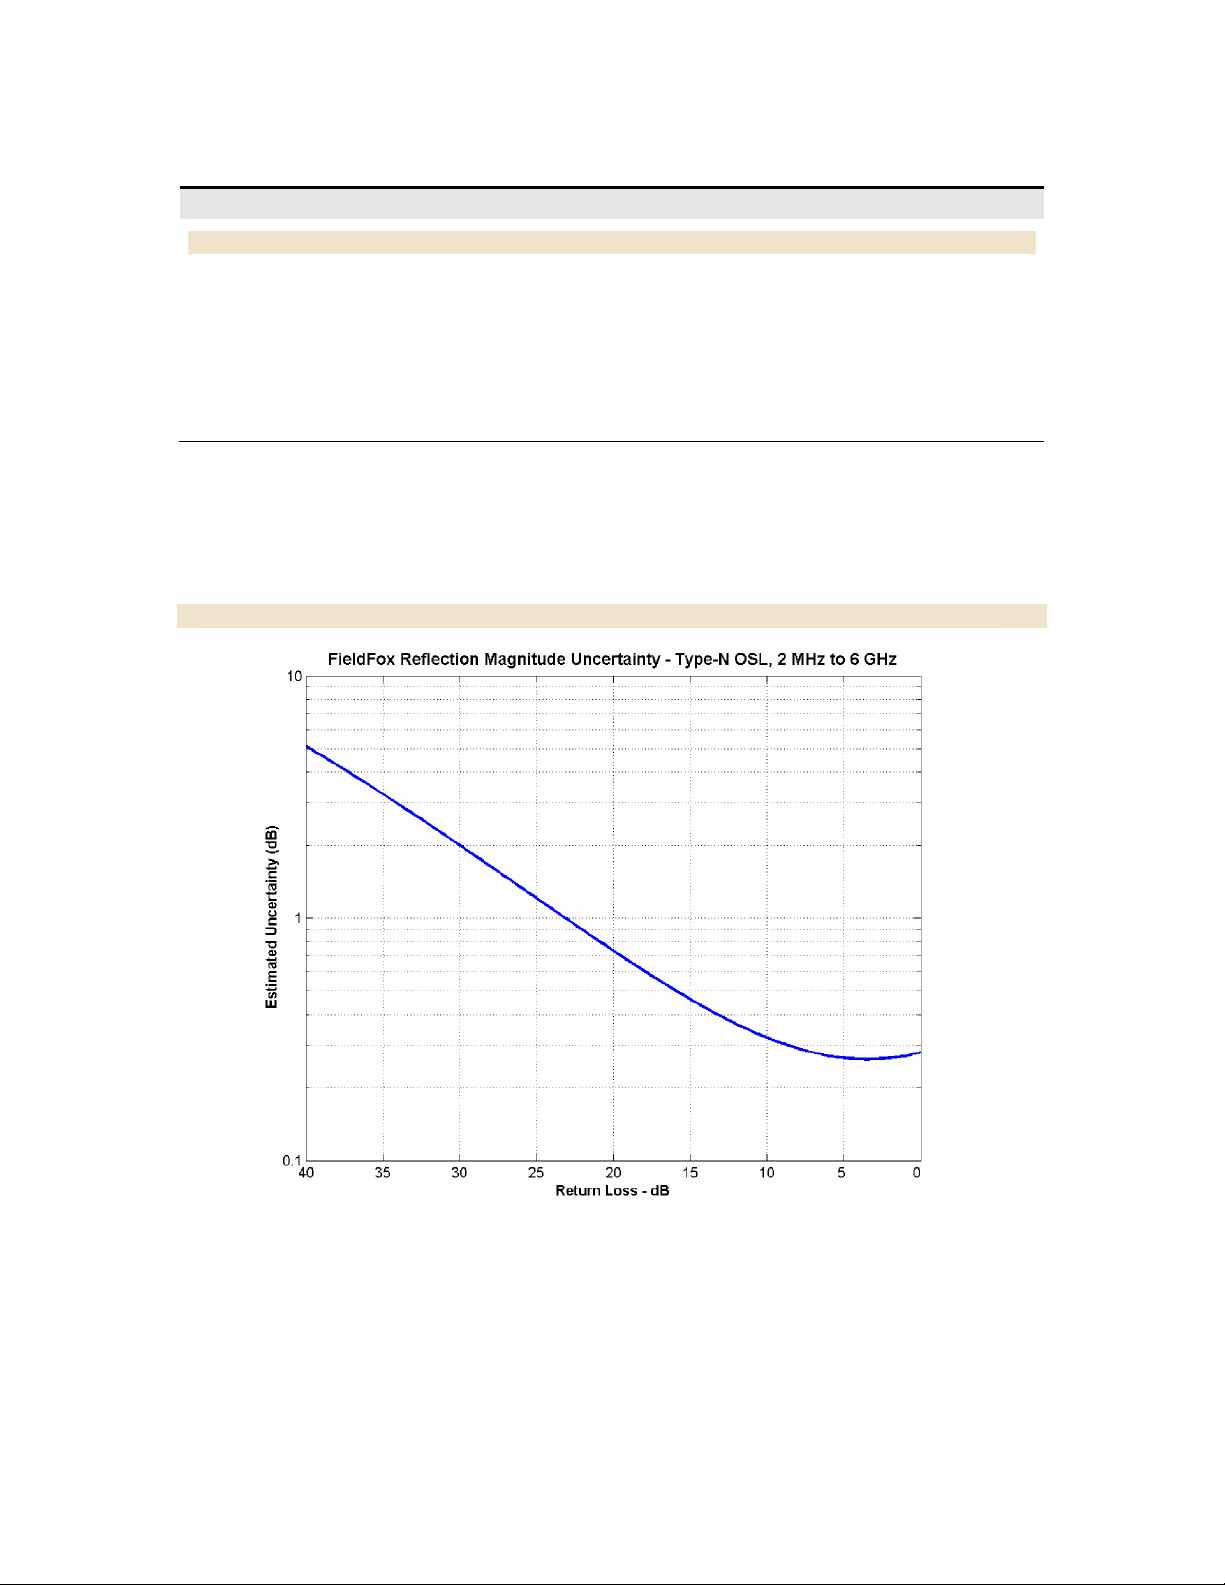
Figure 1: CAT Mode, Type–N Calibration Kit – Magnitude (Specification)
Page 7
7
Cable and Antenna Analyzer (continued)
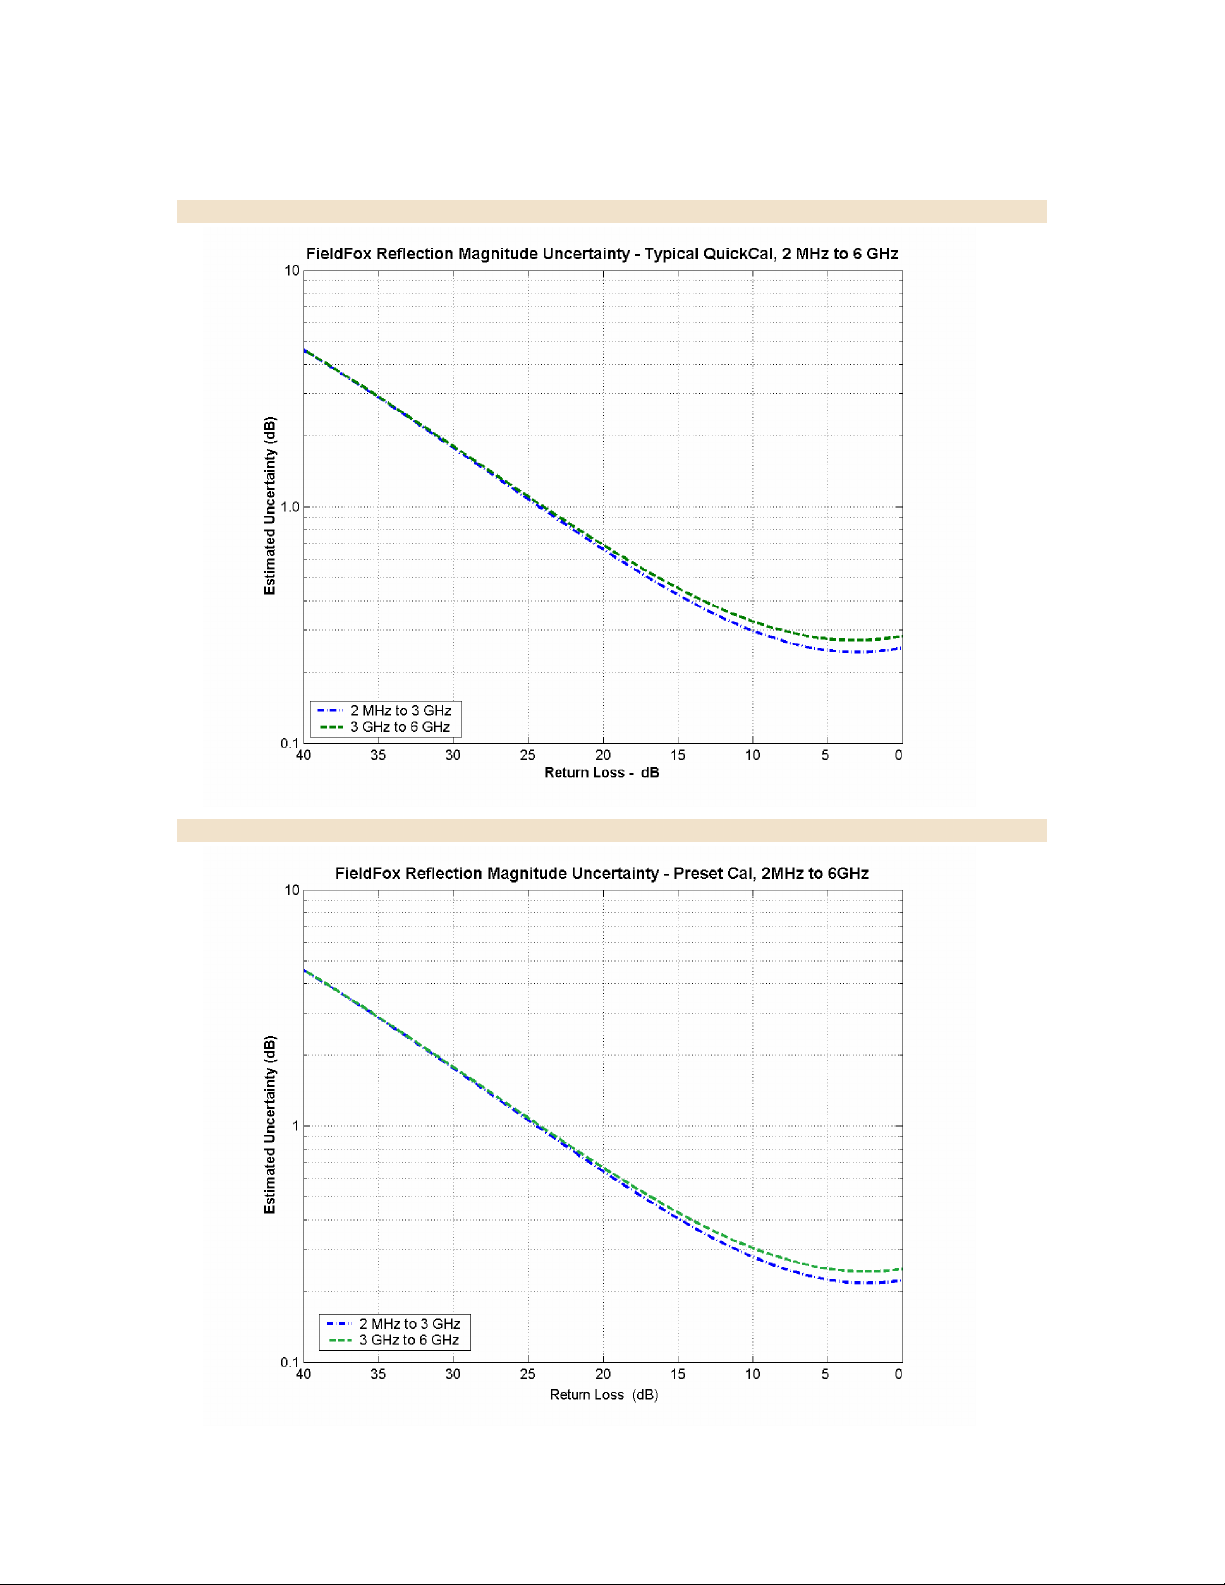
Figure 2: CAT Mode, QuickCal – Magnitude (Typical)
Figure 3: CAT Mode, Preset Cal – Magnitude (Typical)
Page 8

8
Network Analyzer (Option 303)
Description
Specification
Supplemental Information
Frequency Range
2 MHz to 4 GHz
Option 104
2 MHz to 6 GHz
Option 106
Measurement Speed
S11: 1.75 GHz – 3.85 GHz,
1001 Points, Cal ON
1.5 ms/point (nominal)
S21: 1.78 GHz – 2.06 GHz,
201 Points, Cal ON
1.9 ms/point (nominal)
S11 Phase Uncertainty1
See Figure 5 on
following page
Display Range
–180º to +180º
System Impedance
50Ω (nominal)
75Ω with appropriate adapter and Cal Kit
Description
Information
Measurements
S11 magnitude and phase
S21 magnitude (option 110)
A receiver magnitude
R receiver magnitude
Formats
Log magnitude, Linear magnitude
Available ONLY for S11:
VSWR, Phase, Smith Chart, Polar, Group delay, Unwrapped phase
Resolution
(Number of data points)
101, 201, 401, 601, 801, 1601, 4001, 10001
Custom number of points can be set using SCPI
Averaging
2 to 999
Averages vector data on each successive sweep
Number of traces
Four traces available. Tr1, Tr2, Tr3, Tr4
Data markers
Each trace has six independent markers that can be displayed simultaneously. Delta
markers are available for each marker.
Marker formats
Default marker format is the trace format. In Smith chart or polar format,
[Real +Imag] or [Mag and Phase] formats are also available.
Marker functions
Peak, Next Peak, Peak Left, Peak Right, Mkr→ Center, Min Search, Peak Excursion,
Peak Threshold, Target, Bandwidth, Tracking
Display formats
Single-trace
Dual-trace overlay (both traces on one graticule)
Dual-trace split (each trace on separate graticules)
The following CAT mode performance parameters apply to NA mode: frequency accuracy, frequency resolution, output
power, directivity, source match, reflection tracking, and reflection and transmission dynamic range. NA mode
performance that is in addition to CAT mode is listed in the table below.
1
Using recommended calibration kits.
Page 9

9
Three-trace split (each trace on separate graticules)
Quad-trace split (each trace on separate graticules)
Display data
Display data, memory, data and memory, or data math
Trace math
Vector division or subtraction of current linear measurement values and memory data.
Scale
Autoscale, scale, reference level, reference position
Autoscale: Automatically selects scale resolution and reference value to center the
trace. Autoscale all scales all visible traces.
Title
Add custom titles to the display.
Limit lines
Define test limit lines that appear on the display for go/no go testing. Lines may be any
combination of horizontal, sloping lines, or discrete data points. Each trace can have its
own limit line.
Page 10

10
Network Analyzer (continued)
Figure 4: NA Mode, Type–N Calibration Kit – Magnitude (Specification)
Figure 5: NA Mode, Type–N Calibration Kit – Phase (Specification)
Page 11

11
Network Analyzer (continued)
Figure 6: NA Mode, QuickCal – Magnitude (Typical)
Page 12

12
Network Analyzer (continued)
Figure 7: NA Mode, Preset Cal – Magnitude (Typical)
Figure 8: NA Mode, Preset Cal – Phase (Typical)
Page 13

13
Spectrum Analyzer (Option 230 and 231)
Description
Specification
Supplemental Information
FREQUENCY
Frequency Range
Option 230
100 kHz to 4 GHz
Usable to 5 kHz 1
Option 231
100 kHz to 6 GHz
Usable to 5 kHz 1
Tunable to 6.1 GHz
Frequency Reference
Accuracy
±2 ppm
Aging Rate
± 1 ppm/yr
Temperature Stability
± 1 ppm over –10 to 55 °C
Frequency Readout Accuracy (start, stop, center, marker)
± (readout frequency x frequency
reference accuracy + RBW centering +
0.5 x horizontal resolution)
Horizontal resolution = span/(trace
points – 1)
RBW centering :
5% x RBW, FFT mode (nominal)
16% x RBW, Step mode (nominal)
Frequency Span
Range
0 Hz (zero span), 10 Hz to max freq
Accuracy
±(2 x RBW centering + horizontal
resolution)
±(2 x RBW centering +2 x horizontal
resolution) for detector = Normal
Resolution
1 Hz
Sweep Time, Span = 0 Hz
Range
Minimum
1.0 us
Maximum
RBW = 2 MHz
2.18 ms
RBW = 1 MHz
3.28 ms
RBW = 300 kHz
5.46 ms
RBW = 100 kHz
16.38 ms
RBW = 30 kHz
54.60 ms
RBW = 10 kHz
163.84 ms
RBW = 3 kHz
546.00 ms
RBW = 1 kHz
1.64 s
RBW = 300 Hz
2.54 s
Resolution
100.0 ns
Readout
Entered value representing trace
horizontal scale range.
1
With signal at center frequency.
Page 14

14
Spectrum Analyzer (continued)
Description
Specification
Supplemental Information
Sweep Acquisition, Span > 0 Hz
Range
1 to 5000. Number of data acquisitions per
trace point. Value is normalized to the
minimum required to achieve amplitude
accuracy with CW signals.
Auto coupled. For pulsed RF signals,
manually increase the sweep
acquisition value to maximize the
pulse spectrum envelope.
Resolution 1
Readout
Measured value representing time required
to tune receiver, acquire data, and process
trace.
Trigger
Trigger Type
Free Run, Video, External
Trigger Slope
Positive, Negative edge
Trigger Delay
Range
0 to 10 sec
Resolution
100 nsec
Auto Trigger
Forces a periodic acquisition in the absence
of a trigger event
Auto Trigger Range
0 sec (OFF) to 10 sec
Time Gating
Gate Method
Triggered FFT
Gate Delay Range
Same as Trigger Delay
Trace Update
Span = 20 MHz, RBW = 3
kHz
1.5 updates/s (nominal)
Span = 100 MHz, RBW auto
coupled
7 updates/s (nominal)
Span = 6 GHz, RBW auto
coupled
1 update/s (nominal)
Trace Points
101, 201, 401, 601, 801, 1001
(Defaults to 401)
Page 15

15
Spectrum Analyzer (continued)
Description
Specification
Supplemental Information
Resolution Bandwidth (RBW)
Range (–3 dB bandwidth)
Zero Span
300 Hz to 1 MHz in 1–3–10 sequence; 2 MHz
Non–Zero Span
10 Hz to 300 kHz in 1/1.5/2/3/5/7.5/10
sequence; 1 MHz, 2 MHz
Step keys change RBW in
1–3–10 sequence
Accuracy
1 kHz to 1 MHz
± 5% (nominal)
10 Hz to 100 kHz non–
zero span
± 1% (nominal)
2 MHz ± 10% (nominal)
300 Hz zero span
± 10% (nominal)
Selectivity (–60 dB/ –3 dB)
4:1 (nominal)
Video Bandwidth (VBW)
Range
1 Hz to 2 MHz in 1/1.5/2/3/5/7/10
sequence
VBW ≥ RBW in zero span
Description
Specification
Typical
10 minute warm
up
90 minute warm
up
Stability
Noise Sidebands, CF = 1 GHz
10 kHz offset
< –85 dBc/Hz
–88 dBc/Hz
–88 dBc/Hz
30 kHz offset
–89 dBc/Hz
–89 dBc/Hz
100 kHz offset
–95 dBc/Hz
–95 dBc/Hz
1 MHz offset
–115 dBc/Hz
–115 dBc/Hz
Measurement Range
Displayed average noise level (DANL) to
+20 dBm
Input Attenuator Range
0 to 31 dB
Resolution
1 dB steps
Maximum Safe Input Level
Average Continuous Power
+27 dBm (0.5 W)
DC
±50 VDC
Page 16

16
Spectrum Analyzer (continued)
Description
Specification
Typical
10 minute warm
up
90 minute warm
up
Displayed Average Noise Level (DANL)
10 Hz RBW, 10 Hz VBW, 50 ohm termination on input, 0 dB attenuation, average detector
Preamplifier OFF
20 to 30 °C:
10 MHz to 2.4 GHz
–130 dBm
> 2.4 GHz to 5.0 GHz
–125 dBm
> 5.0 GHz to 6.0 GHz
–119 dBm
Preamplifier ON (Option 235)
20 to 30 °C:
10 MHz to 2.4 GHz
< –143 dBm
–148 dBm
> 2.4 GHz to 5.0 GHz
< –140 dBm
–145 dBm
> 5.0 GHz to 6.0 GHz
< –132 dBm
–138 dBm
–10 to 55 °C:
10 MHz to 2.4 GHz
< –141 dBm
> 2.4 GHz to 5.0 GHz
< –138 dBm
> 5.0 GHz to 6.0 GHz
< –130 dBm
Display Range
Log Scale
Ten divisions displayed; 0.1 to 1.0
dB/division in 0.1 dB steps, and 1 to 20
dB/division in 1 dB steps
Trace Detectors
Normal, Positive Peak, Negative Peak,
Sample, Average
Trace States
Clear/Write, Max Hold, Min Hold,
Average, View, Blank
Number of Traces
4
Number of Averages
1 to 10,000
Reference Level
Range
–170 dBm to +30 dBm
Resolution
0.1 dB
Accuracy
0 dB
Page 17

17
Spectrum Analyzer (continued)
Description
Specification
Typical
10 minute warm
up
90 minute warm
up
Absolute Amplitude Accuracy at 50 MHz
Peak detector, 10 dB attenuation, preamplifier off, RBW < 2 MHz, input signal –5 dBm to –50 dBm, all settings auto–
coupled
20 to 30 ºC
±0.8 dB
±0.8 dB
±0.4 dB
–10 to 55 ºC
±1.1 dB
±0.8 dB
Frequency Response
Relative to 50 MHz, Peak detector, 10 dB attenuation, preamplifier off, RBW = 30 kHz, input signal 0 dBm to –50 dBm,
all settings auto–coupled
20 to 30 ºC:
2 MHz to 10 MHz
±1.1 dB
±1.0 dB
±0.5 dB
> 10 MHz to 3.0 GHz
±0.9 dB
±0.6 dB
±0.3 dB
> 3.0 GHz to 5.0 GHz
±1.3 dB
±1.1 dB
±0.5 dB
> 5.0 GHz to 6.0 GHz
±1.5 dB
±1.5 dB
±0.5 dB
–10 to 55 ºC:
2 MHz to 10 MHz
±2.0 dB
±1.0 dB
> 10 MHz to 3.0 GHz
±1.5 dB
±0.6 dB
> 3.0 GHz to 5.0 GHz
±2.0 dB
±1.1 dB
> 5.0 GHz to 6.0 GHz
±2.6 dB
±1.5 dB
Preamplifier ON (Option 235)
20 to 30 ºC:
2 MHz to 10 MHz
±0.7 dB
> 10 MHz to 3.0 GHz
±0.5 dB
> 3.0 GHz to 5.0 GHz
±0.7 dB
> 5.0 GHz to 6.0 GHz
±0.7 dB
–10 to 55 ºC:
2 MHz to 10 MHz
±1.2 dB
> 10 MHz to 3.0 GHz
±0.8 dB
> 3.0 GHz to 5.0 GHz
±1.3 dB
> 5.0 GHz to 6.0 GHz
±1.7 dB
Page 18

18
Spectrum Analyzer (continued)
Description
Specification
Typical
Supplemental Information
10 minute
warm up
90 minute
warm up
Resolution Bandwidth Switching Uncertainty
RBW < 2 MHz
0.0 dB
0.7 dB peak–to–peak 3
Total Absolute Amplitude Accuracy 1
Peak detector, 10 dB
attenuation, preamplifier off,
RBW < 2 MHz, input signal 0
dBm to –50 dBm, all settings
auto coupled
Absolute
Amplitude at 50
MHz + Frequency
Response 4
20 to 30 ºC:
2 MHz to 10 MHz
±1.8 dB
±1.28 dB
±0.60 dB > 10 MHz to 3.0 GHz
±1.5 dB
±1.0 dB
±0.50 dB
> 3.0 GHz to 5.0 GHz
±1.9 dB
±1.36 dB
±0.60 dB
> 5.0 GHz to 6.0 GHz
±2.1 dB
±1.7 dB
±0.60 dB
RF Input VSWR
At all attenuation settings
1.5:1 (nominal)
Second harmonic distortion (SHI)
–30 dBm signal at input
mixer 2
2 MHz to 1.35 GHz
< –70 dBc
+40 dBm SHI (nominal)
1.35 GHz to 3.0 GHz
< –80 dBc
+50 dBm SHI (nominal)
Third Order Intermodulation Distortion (TOI)
Two –30 dBm tones at input
mixer
< –96 dBc
+18 dBm TOI (nominal)
1
With signal at center frequency.
2
Mixer level = RF input level – input attenuation
3
For signals not at center frequency.
4
The specification for Total Absolute Amplitude Accuracy is less than the sum of the Absolute Amplitude Accuracy
and Frequency Response specifications because redundant uncertainty is removed.
Page 19

19
Spectrum Analyzer (continued)
Description
Supplemental Information
Residual Responses
Input terminated, 0 dB attenuation, preamplifier off, RBW ≤ 1 kHz, VBW auto coupled
20 MHz to 3 GHz
–90 dBm (nominal)
> 3 GHz to 6 GHz
–85 dBm (nominal)
Spurious Responses
Input Mixer level –30 dBm
RFsig = RFtune + 417 MHz
–70 dBc (nominal)
RFsig = RFtune + 1.716 GHz
–80 dBc (nominal)
Input Mixer level –10 dBm; First IF Image Response
Rfsig = Rftune – 2 x 0.8346 GHz
for Rftune 5.7 to 6.0 GHz
–50 dBc (nominal)
Sidebands
–80 dBc (nominal)
–60 dBc (nominal) when battery
charging, 260 kHz offset
Figure 10
Page 20

20
Figure 11
Description
Specification
Independent Signal Source or Tracking Generator
The independent source or tracking generator is included with either spectrum
analyzer option. The source can be used in continuous wave (CW) or
stimulus/response (S/R) mode. In CW mode, the source frequency is independent of
the receiver frequency. The source can be tuned to a frequency that is different from
the receiver. In stimulus/response mode, the source operates the same as a
traditional tracking generator - the receiver tracks the source.
Frequency range
2 MHz to 4 GHz (Option 230) or 2 MHz to 6 GHz (Option 231)
Amplitude
High power
2 MHz to 4 GHz < +8 dBm, +6 dBm (nominal)
>4 GHz to 6 GHz <+7 dBm, +2 dBm (nominal)
Low power
2 MHz to 4 GHz <-23 dBm, -25 dBm (nominal)
>4 GHz to 6 GHz < -24 dBm, -29 dBm (nominal)
Attenuation
0 to 31 dB
Functions
Continuous wave, stimulus / response
Description
Specification
Supplemental Information
AM/FM Tune and Listen
Audio demodulation types
AM, FM Narrow, FM Wide
Audio Bandwidth
16 kHz
Spectrum Analyzer (continued)
Page 21

21
Receiver IF Bandwidth
AM
35 kHz
FM Narrow
12 kHz
FM Wide
150 kHz
Listen Time Range
0 to 100 sec.
Audio Signal Strength Indicator
Audio Signal Strength Indicator helps locate signals. The tone and
frequency of the beep varies with signal strength.
Radio Standards
With a Radio Standard applied, pre-defined frequency bands, channel numbers or Uplink / Downlink selections can be
used instead of manual frequency entry. The pre-defined FieldFox Radio Standards include bands such as W-CDMA,
LTE, and GSM. Custom Radio Standards can also be defined, imported, and applied to the FieldFox.
FieldFox Power Suite Measurement types
Channel Power
Occupied Bandwidth
Adjacent Channel Power Ratio
Preamplifier (Option 235)
Description
Specification
Typical
10 minute warm up
Frequency Range
Option 230
100 kHz to 4 GHz
Option 231
100 kHz to 6 GHz
Gain 22 dB
Description
Specification
Supplemental Information
Display Types
Spectrogram
Overlay, full screen, top, or
bottom with active trace
Waterfall
Markers
Time, delta time
Description
Specification
Typical
Supplemental Information
Interference Analyzer (Option 236)
Power Meter (Option 302)
Power Meter (Option 302) supports the Agilent Technologies U2000 Series USB Average Power Sensors. For
specifications, refer to the U2000 Series USB Sensor’s Data Sheet at http://www.agilent.com/find/usbsensor.
General Information
Page 22

22
Calibration Cycle
1 Year
Environmental
▪ Agilent Technologies Environmental
Test manual (ETM) for Outdoor
Equipment1
▪ MIL–PRF–28800F class 2
Altitude – Operating
9,144 m (30,000 ft)
Under battery operation
AC to DC adapter rated at 3000m
Altitude – Non–
Operating
15,240 m (50,000 ft)
IP Class
30
Temperature Range
Operating
AC Power
–10 to 55 °C
Battery
–10 to 50 °C
–10 to 55 °C
Storage
–51 to 71 °C
With the battery pack removed.
The battery packs should be
stored in an environment with
low humidity. Extended
exposure to temperature above
45 ºC could degrade battery
performance and life.
EMC
Complies with
European EMC
Directive 2004/108/EC
▪ IEC/EN 61326–2–1
▪ CISPR Pub 11 Group 1, class A
▪ AS/NZS CISPR 11
▪ ICES/NMB–001
When subjected to continuously
present radiated electromagnetic
phenomena, some degradation of
performance may occur
ESD
▪ IEC/EN 61000–4–2
Functional up to 20 kV test 1
Safety
Complies with
European Low Voltage
Directive 2006/95/EC
▪ IEC/EN 61010–1 2nd Edition
▪ Canada: CSA C22.2 No. 61010–1–04
▪ USA: UL 61010–1 2nd Edition
Page 23

23
General Information (continued)
Description
Specification
Typical
Supplemental Information
Power
Power Supply
External DC Input
15 to 19 VDC
40 W maximum when battery
charging
External AC Power
Adapter
Efficiency Level IV, 115 VAC
Input
100 to 250 VAC, 50 to 60 Hz
1.25 – 0.56 A
Output
15 VDC, 4 A
Power Consumption
On
12 W
Battery 10.8 V, 4.6 A–h
Lithium ion
Operating Time
4 hours
Charge Time
A fully discharged battery takes
about 1.5 hours to recharge to 80%,
4 hours to 100%
Discharge
Temperature Limits
–10 to 60 ºC2, ≤ 85% RH
Charge Temperature
Limits
0 to 45 ºC2, ≤ 85% RH
Storage Temperature
Limits
–20 to 50 ºC2, ≤ 85% RH
The battery packs should be stored
in an environment with low
humidity. Extended exposure to
temperature above 45 ºC could
degrade battery performance and
life
Data Storage
Internal
Minimum 16 MB
Up to 1000 instrument states and
trace
External
Supports USB 2.0 compatible
memory devices; Supports miniSD
and miniSDHC memory cards
Display
6.5” transflective color VGA LED–
backlit
640 x 480 with anti–glare coating
Weight
2.8 kg (6.2 lbs) including battery
Dimensions (H x W x D)
292 x 188 x 72 mm (11.5” x 7.4”
x 2.8”)
Page 24

24
General Information (continued)
Description
Specification
Typical
Supplemental Information
Inputs & Outputs
RF Out Port
Connector
Type–N, female
Impedance
50 Ω (nominal)
Damage Level
> +23 dBm, > ±50 VDC
RF In Port
Connector
Type–N, female
Impedance
50 Ω (nominal)
Damage Level
> +27 dBm, > ±50 VDC
LO Emissions
0 dB attenuation,
preamplifier off
–65 dBm (nominal)
Headphone Jack
Connector
3.5 mm (1/8 inch) miniature audio
jack
USB
USB–A (2 ports)
Hi–speed USB 2.0
Mini USB (1 port)
Hi–speed USB 2.0
Provided for future use.
LAN
100Base-T ONLY
RJ–45 connector
10Base-T is NOT supported
External Reference /Trigger Input
Connector
BNC female
External Reference
Input Frequency
10 MHz
Input Amplitude
Range
–5 dBm to +10 dBm (nominal)
Impedance
50 Ω (nominal)
Lock Range
±10 ppm of external reference
frequency (nominal)
Trigger Input
Impedance
10 KΩ (nominal)
Level Range
Rising Edge
1.7 V (nominal)
Falling Edge
1 V (nominal)
1 Samples of this product have been type tested in accordance with the Agilent Environmental Test Manual (ETM) for
outdoor equipment (OE) and verified to be robust against the environmental stresses of storage, transportation and end
use ; those stresses include but are not limited to temperature, humidity, shock, vibration, altitude and power line
conditions.
2 Charge and discharge temperatures are internal temperatures of the battery as measured by a sensor embedded in the
battery. The Battery screen displays temperature information. To access the screen, select System , Service Diagnostics,
and Battery.
Page 25

Americas
Canada
Brazil
Mexico
United States
(877) 894-4414
(11) 4197 3500
01800 5064 800
(800) 829-4444
Asia Pacific
Australia
China
Hong Kong
India
Japan
Korea
Malaysia
Singapore
Taiwan
Other AP Countries
1 800 629 485
800 810 0189
800 938 693
1 800 112 929
0120 (421) 345
080 769 0800
1 800 888 848
1 800 375 8100
0800 047 866
(65) 375 8100
Europe & Middle East
Belgium
Denmark
Finland
France
Germany
Ireland
Israel
Italy
Netherlands
Spain
Sweden
United Kingdom
32 (0) 2 404 93 40
45 70 13 15 15
358 (0) 10 855 2100
0825 010 700*
*0.125 €/minute
49 (0) 7031 464 6333
1890 924 204
972-3-9288-504/544
39 02 92 60 8 484
31 (0) 20 547 2111
34 (91) 631 3300
0200-88 22 55
44 (0) 118 9276201
www.agilent.com
www.agilent.com/find/pnax
For more information on Agilent Technologies’
products, applications or services, please contact
your local Agilent office. The complete list is
available at:
www.agilent.com/find/contactus
For other unlisted countries:
www.agilent.com/find/contactus
Product specifications and descriptions in this
document subject to change without notice.
© Agilent Technologies, Inc. 2011
Published in USA, Jan 5, 2012
Supersedes: Sept 1, 2011
N9912-90006
 Loading...