


Agilent N9340B
Handheld
Spectrum Analyzer
Technical Overview
Put the speed
and performance of
Agilent spectrum analysis
in the hands of your engineers
in the field

02
Handheld
Spectrum Analyzer
N9340B
Know your spectrum
Regardless of whether you are handling
military communications, a Wireless
Service Provider (WSP), or involved
with spectrum management you need
to avoid impaired communication.
The N9340B provides you with a reliable,
accurate and detailed picture of your
communication spectrum.
When you test, you need fast data
capture to help locate and identify
elusive, transient interference signals.
That’s why every N9340B spectrum
analyzer has a truly fast sweep time.
It requires less time to measure across
the spectrum, to obtain more reliable
test results and to help you achieve
more for the same investment of time
and money.
Gain confidence in your test
results
Frequency range: 100 kHz to 3 GHz
–124 dBm
–144 dBm with preamp
Amplitude accuracy: ±1.5 dB
RBW: 30 Hz to 1 MHz in 1-3-10 sequence
VBW: 3 Hz to 1 MHz
Optimize your test time versus
accuracy
SSB Phase noise: < – 87 dBc/Hz at 30 kHz offset
DANL: (RBW=30Hz, 10 MHz < fc 1.5 GHz)
Sweep time
10 ms to 1000 s, span
1 kHz
< 120 ms at full span
Spurious signals and noise are of great
concern to all network users. A superior
combination of low displayed average
noise level (DANL) and single sideband
(SSB) phase noise coupled with a
narrow resolution bandwidth (RBW)
means your signal measurements are
more reliable and you will have more
confidence in your test results. The
N9340B’s low DANL and SSB phase
noise helps you detect very low-level
signals (spurs or noise) which are close
to the carrier. You will avoid missing
these difficult-to-identify signals, which
would otherwise lead to an insufficient
or even incorrect understanding of the
spectrum.
The N9340B’s RBW is the narrowest in its
class. The narrow 30 Hz bandwidth of the
analyzer ensures that it is even easier
to identify, resolve, and measure two
signals that are close together.
Additionally, with a resolution filter
shape-factor of less than 5, the N9340B
has the ability to resolve closely spaced
signals with unequal amplitudes.
Moreover, the narrow RBW means that
the spectrum analyzer introduces minimal
noise itself, helping to further reduce
DANL and improve sensitivity.
N9340B Superior Performance Ensures the Field Test Confidence
Superior sensitivity: lowest DANL in-the-class
Fastest sweep time
Narrowest resolution available
Superior sensitivity
With more wireless devices on the market
requiring greater bandwidth usage, the
ability to discriminate between different
signals becomes more challenging. It’s
under such demanding conditions that the
superior performance of an N9340B
analyzer proves its worth. The N9340B
has one of the best sensitivity and
selectivity specifications. The DANL is
–124 dBm, or –144 dBm with the
optional preamplifier (30 Hz RBW, 10
MHz < fc < 1.5 GHz).
–
The optional
preamplifier adds 20 dB gain for
improved analyzer sensitivity.
Speed at your fingertips
The RF spectrum is a finite resource,
therefore its usage requires management.
Most regulatory authorities responsible
for administering frequency allocation
require service suppliers and network
operators to perform routine
monitoring of signal power and
transmission frequency stability..
03
Handheld
Spectrum Analyzer
N9340B
Spectrum emission mask
The new N9340B adds Spectrum Emission
Mask (SEM) as a standard feature. SEM is
a mask for out-of-channel emissions
measurement. The SEM is defined relative
to in-channel power.
The user can set the parameters of the main
channel, out-of-channel frequency bands,
and the limit lines. Included is Pass/Fail
testing for the overall spectrum emission
mask and each individual out-of-channel
frequency range. The N9340B will trigger
the failure indicator once any measurement
result violates the mask.
Also displayed are the main channel power
and the power level metrics relative to
in-channel power for each out-of-channel
frequency range. The user can save the
spectrum scan, the mask, the data or
screenshot for later analysis and reporting.
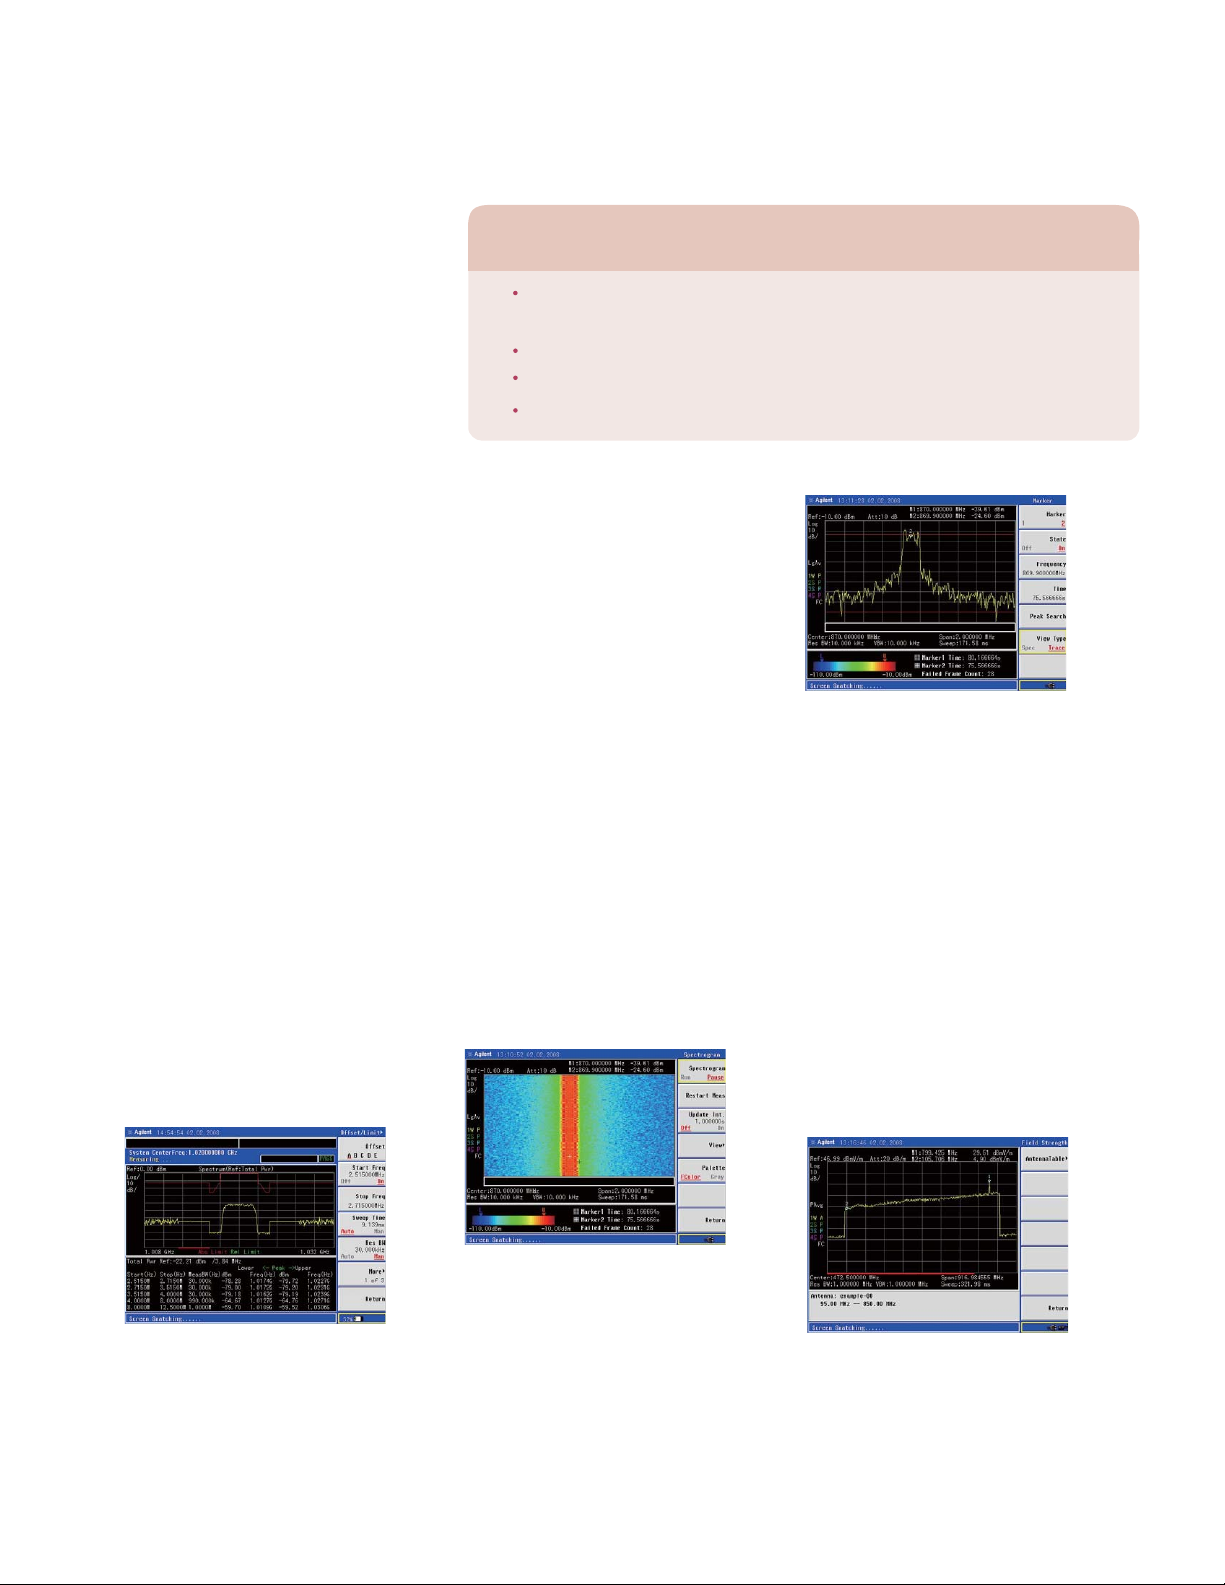
Spectrogram
Now you can take advantage of the
spectrogram display to view the behavior of
varying signal parameters over time. The
N9340B includes spectrogram as a standard
feature. The scrolling three-dimensional display
is noted for its ability to track the frequency and
power behavior over the time, particularly
intermittent signals. The user can use
spectrogram to analyze the stability of a signal
over the time, or to identify intermittent
interference signals in communications systems.
There are two markers for the user to identify
power versus frequency and time. Also the time
interval between two consecutive colored rows
can be adjusted. When a marker is put on the
spectrogram, the N9340B can display the trace
for the time of the selected marker.
The spectrogram data and screenshots can be
saved and recalled for later analysis or reporting.
N9340B is now equipped with powerful
features to address field applications
using a handheld spectrum analyzer.
An important application of spectrum
analysis is identifying interfering signals.
These often arise from illegal transmissions,
and may cause impairment of services
for authorized users, often resulting in
financial loss. These interfering signals
could possibly restrict critical
communications of civil aviation and
emergency services, which could
jeopardize public safety.
New
N9340B Applications for Field Test
Aerospace & Defence: radio and radar test, interference analysis,
on-site repair
Wireless Service Providers: interference analysis, on-site repair
TV & Broadcasting: interference analysis, channel power check
Spectrum Management Authority: spectrum monitoring
New
The trace display gives the view of the spectrogram
for the time of the selected marker.
Field strength measurement
New
Electric field strength measurements are frequently
required for field testing of transmitter and antenna
coverage. Field strength measurements are now a
standard function in the N9340B. Calibrated field
strength measurements are easy to make once the
antenna factors are loaded into the analyzer via the
provided PC software based antenna template.
Either field strength (in dBµV/ m, dBmV/ m, or V/
m) or power flux density (in dBm/ m or W/ m )
2
2
can be displayed. With the amplitude offset function,
the user can correct gain or loss. And finally together
with the user-definable multi-limit line function, the
N9340B offers the user quick and convenient field
strength measurements and analysis.
The spectrum emission mask shows the main
channel power and the power level vectors
relative to in-channel power for each out-of-channel
frequency range.
The spectrogram gives the three-dimensional
display of power, frequency and time.
The field strength measurement automatically
takes into the account of the antenna factor.
The antenna table is definable by the standard
N9340B PC software.
Handheld
Spectrum Analyzer
N9340B
AM/FM modulation analysis
(Option AMA)
Optional AM/FM modulation analysis
shows the metrics you need, including
carrier power, modulation rate, AM
depth/FM deviation, SINAD and carrier
frequency offset. User definable limits
provide Pass/Fail indicators in 4 cases:
higher than carrier power, larger than
AM modulation index or FM deviation,
lower than AM modulation index or FM
deviation, or larger than carrier frequency
offset. The user can save the waveforms
with metrics for reporting as well as the
set-up parameters for future
measurements or analysis.
ASK/FSK modulation analysis
(Option DMA)
04
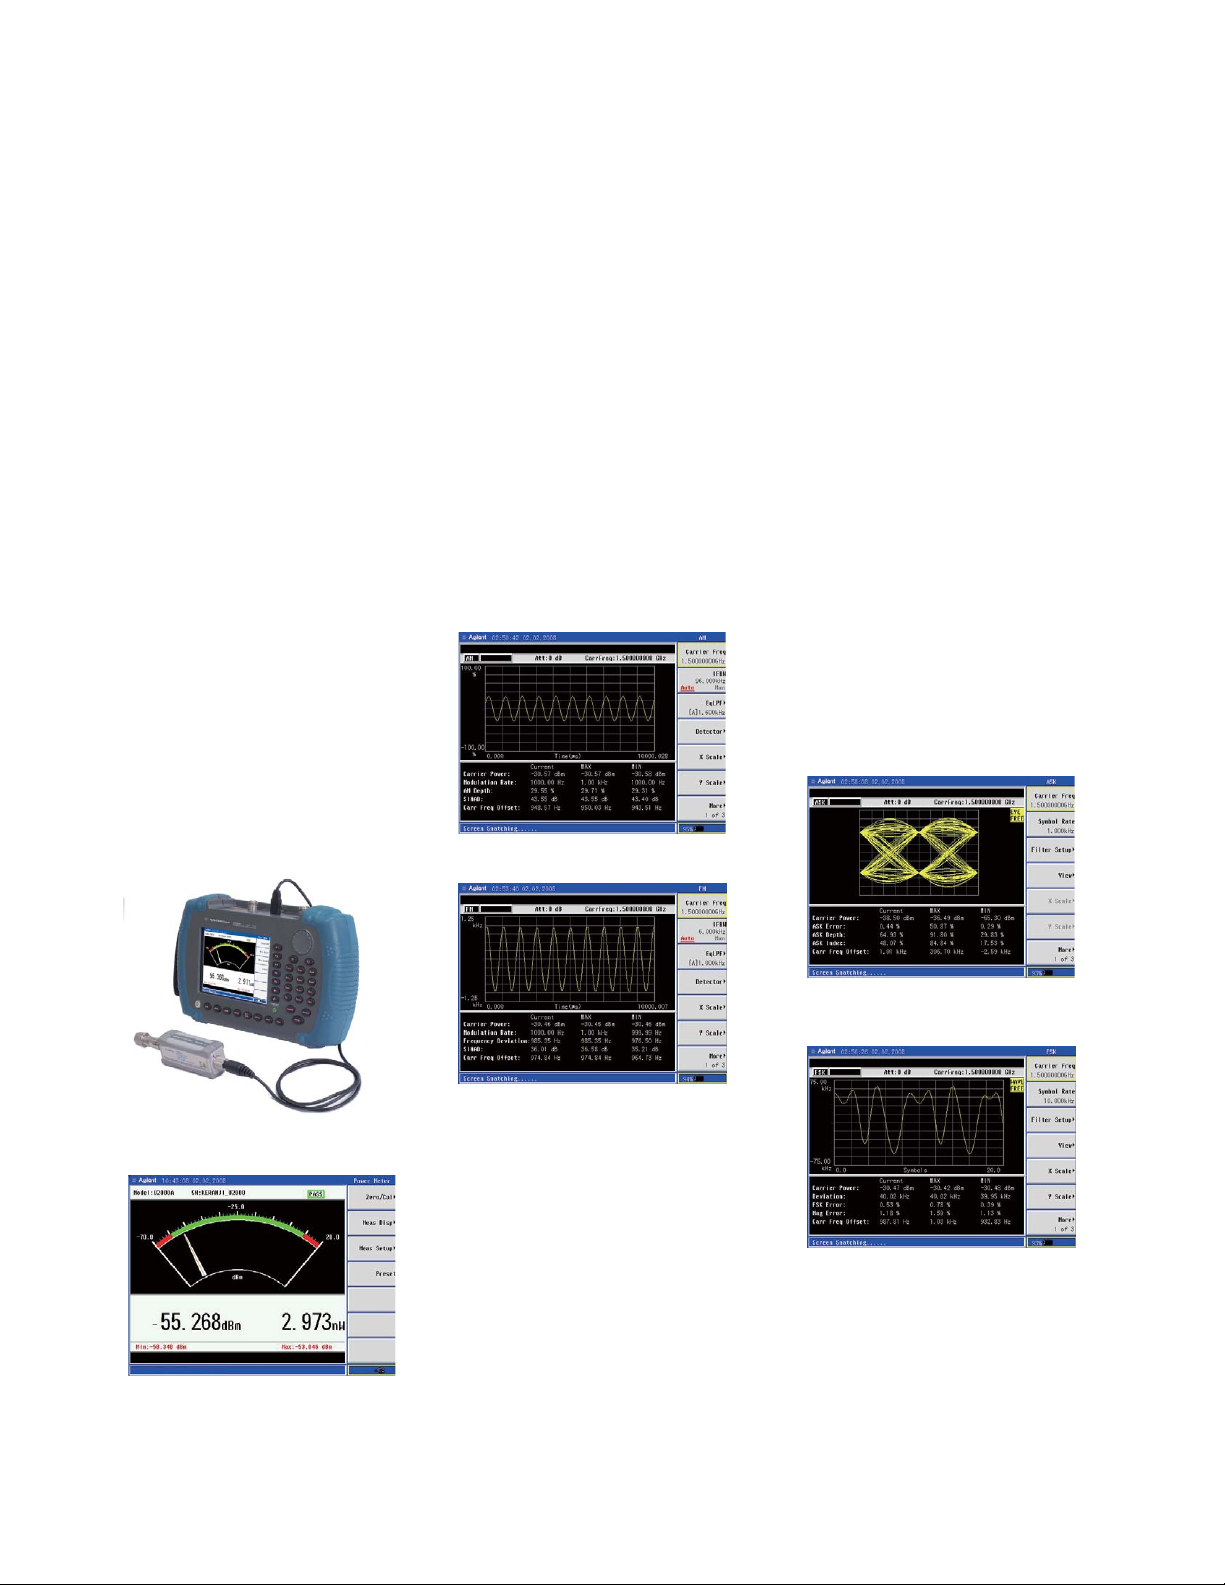
High accuracy power
measurement
The N9340B now supports high-accuracy,
USB plug-and-play power measurements
as standard when connected to an Agilent
U2000 series USB power sensor. Make
true average power measurements for all
signal types with wide dynamic range up
to 18 GHz with just the push of a button.
The Agilent U2000 USB sensors require
no external power supplies and with
internal zeroing eliminate the need for
external calibration. Without the need for
additional boxes, the user can easily set up,
calibrate and control the power meter/sensor
via the analyzer’s USB port. The N9340B
can collect, display and save the power
meter results.
The analyzer also provides Pass/Fail
testing with user set upper and lower
limits and a Pass/Fail indicator. Test
results are shown in dBm and W when
making absolute measurements and in
dB and percentage when measurements
are relative. Two display modes are
available: Meter or the Chart mode to log
power measurements over time.
New
The detailed metrics offer you the complete
understanding of the AM.
New
Optional ASK/FSK modulation analysis is now
available. Amplitude Shift Keying (ASK) is used
in RFID and optical systems. Frequency Shift
Keying (FSK) is used in many applications
including cordless phone, paging systems and
RFID.
N9340B w/option DMA supports 4 display
modes: Symbol, Waveform, ASK/FSK Error,
and Eye Diagram. Included is Pass/Fail testing
of higher than carrier power, higher than ASK
modulation depth/FSK frequency deviation,
lower than ASK modulation depth/FSK
frequency deviation and higher than FSK
frequency deviation. The metrics you need
are shown, including carrier power, ASK/FSK
error, ASK depth/FSK frequency deviation, and
ASK index etc. For reports and future
measurements the waveform with metrics and
setup parameters can be saved.
New
N9340B supports U2000 series USB power sensors
for high accuracy power measurement.
N9340B supports Meter and Chart mode to
display the results of power measurements.
The detailed metrics offer you the complete
understanding of the FM.
The Eye Diagram of ASK also shows the metrics
with detailed parameters.
The Waveform of FSK also shows the metrics
with detailed parameters.
05
Handheld
Spectrum Analyzer
N9340B
Channel table
New
For the users who prefer to tune the spectrum
analyzer according to channel numbers rather
than center frequency, you will find the new
Channel Table feature easy-to-use. The
Channel Table includes the major wireless
communication standards, such as AMPS,
GSM/EDGE/GPRS, CDMA, CDMA2000 etc.
The Channel Table can also be edited by the
user with the included N9340 PC Software.
The revised Channel Table can be
downloaded to the analyzer via a PC USB
cable or a USB memory stick.
The channel table offers the ability to tune N9340B
according to channel numbers.
One-button measurement
The Agilent N9340B supports one-button
measurements of occupied bandwidth, channel
power and adjacent channel power ratio.
This virtually eliminates set-up time in the field.
Occupied bandwidth (OBW)
An occupied bandwidth measurement
integrates the power of the displayed
spectrum and puts one pair of vertical lines
at the frequencies between which the
interested signal is contained.
An N9340B spectrum analyzer supports two
ways to measure the occupied bandwidth, in
percentage or in dBc.
The occupied bandwidth measured in
percentage.
Channel power
Use channel power to measure both
power and power spectral density in
a user-specified channel bandwidth.
One pair of vertical lines on the display
indicates the edges of the channel
bandwidth.
It is quick and easy to set center frequency,
integration bandwidth, and channel bandwidth.
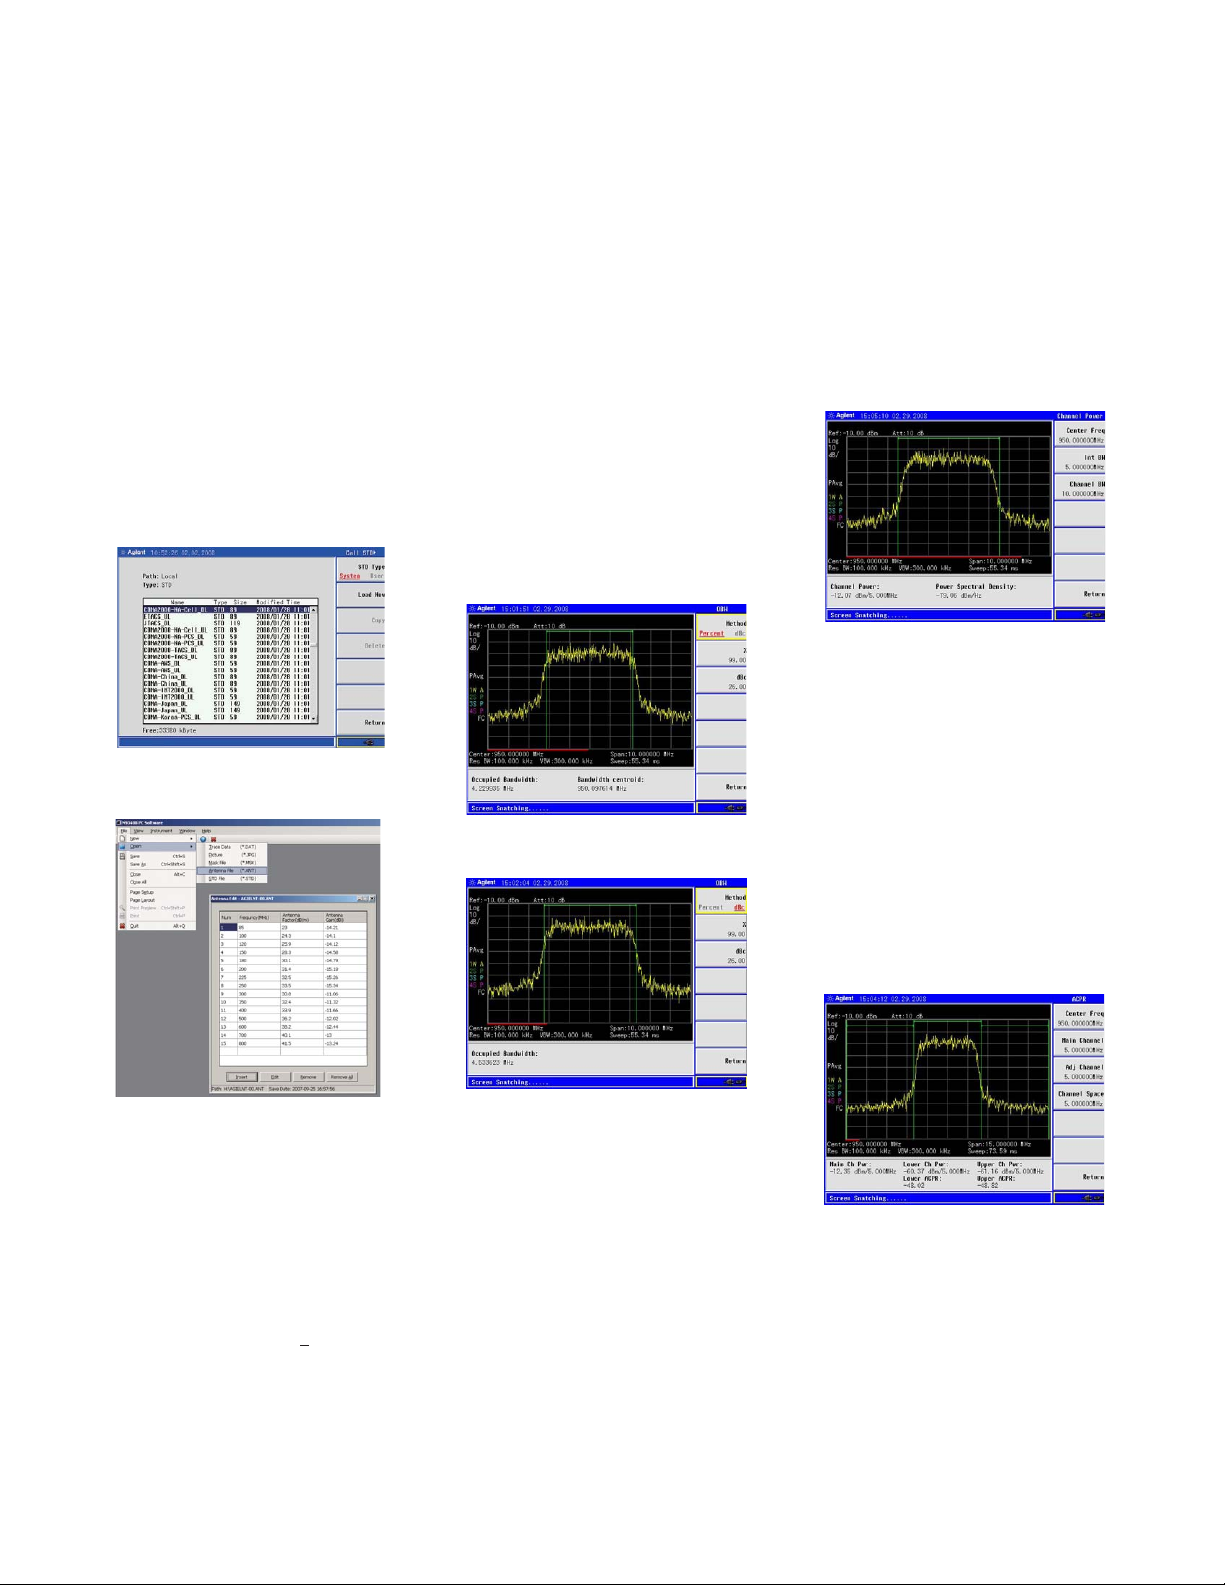
Adjacent channel power ratio
(ACPR)
Wireless service providers need to
minimize the interference caused
by power leaking into adjacent
transmit channels. Adjacent channel
power ratio measurements help to
check for signal leakage and the
identification and control of
sources of interference.
The channel table is editable by N9340B PC software.
Safety at high input levels
The N9340B can be used for many high
power applications. However, should the
power level exceed33 dBm, the input
protection switch activates to protect the
instrument from damage.
The maximum safe input level is > +33
dBm for 3 minutes at most < 50 VDC.
The occupied bandwidth measured
in dBc.
Center frequency, main channel bandwidth,
adjacent channel bandwidth, and channel
space can easily be set.

N9340B Optimized Usability
to Enhance Field Test Productivity
6.5’’ TFT screen with bright display for use
indoors and outdoors
Back-lit keys for night use
Four-hour battery life
Modern USB and LAN* connectivity for data
transfer and remote control
Multi-language User Interface
Rugged design for field use
A standard soft carrying case provides
further protection for your analyzer.
See traces clearly indoors and
outdoors
New
As with all the newest Agilent portable field
equipment, operating under challenging
bright sunlight or other difficult natural
lighting conditions is no problem. The
unusual 6.5’’ TFT display with resolution
of 640 x 480 pixels provides a superior,
bright and clear trace for indoor and
outdoor use. There is no need to operate
in the shade.
Back-lit keys for night use
New
The N9340B is installed with back-lit keys
for night use. The user can see the keys
clearly even in darkness. The user can adjust
the brightness of keys and the duration of
the key light. It offers the user the ability to
easily operate N9340B at night.
Built-in light sensor
New
The N9340B is installed with a light sensor
in the front panel. The light-sensor can be
activated to adjust the display brightness
to adapt to changing lighting conditions.
Long battery life
Testing in the field often means operating
away from main power supplies. Batteries
need to have the longest possible operating
time before recharging. You’ll find an
Agilent N9340B analyzer has superior
power management, providing an
impressive 4-hour battery operating time.
It’s easy to operate for an entire day in the
field. There is an advanced, in-built battery
management system. This helps extend
the useful battery operating time typically
up to four hours. With just one battery
and a spare, or a quick recharging from
any vehicle using the supplied auto-lighter
charger, you are able to operate for an
entire day away from a mains power
source.
Modern USB and LAN* connectivity
Remote control N9340B via SCPI over
USB/LAN* is now available!
Detailed analysis of results in the field is not
always convenient or possible. You will
need to store the results for later investigation. N9340B supports USB memory stick
for data storage and retrival. It makes it
easy to transfer and safeguard your
measurement data. Connecting to a PC is
simple and data transfer is fast via the
USB cable. In test lab and bench-top
use, the USB/LAN* interface and PC
software also support PC remote control
of Agilent’s N9340B spectrum analyzer
This allows appropriate use of a large
format PC screen. Windows **-compatible
®
software provides automatic storage
of selected data and graphics.
Tough enough for the military
You will find that this Agilent analyzer is
tough enough for military applications.
Apart from its generally compact and
rugged construction, the large rubberized
grips wrap around both ends, providing
additional robust protection from rough
handling. The sealed keypad and screen are
moisture resistant and dust proof. Of course,
there is a protective carrying case that
provides further protection for your analyzer.
Multi-language user interface
Users around the world will find operating
Agilent N9340B is easy. In addition to
English, there are ten more user-selectable,
on-screen languages, including Chinese,
Japanese, Korean and a number of
European languages (see Specifications –
General).
N9340B supports remote control via
SCPI over USB and LAN*.
LAN will be available since June, 2008.
***Windows is a U.S. registered trademark of the Microsoft Corporation.
06

N9340B
Handheld
Spectrum Analyzer
Specifications
Specifications apply under the following conditions:
After a warm-up time of 30 minutes, and at least two hours of operation or storage at operating temperature
Within a valid calibration period
Data with no given tolerances are typical values only. Data designated as 'typical' is not covered by the product warranty.
Supplemental information
Frequency
Frequency
Frequency range :
100 kHz to 3 GHz (tunable to 9 kHz)
Internal 10 MHz frequency reference accuracy
Aging rate :
Temperature stability :
± 1 ppm / year
± 2 ppm
in addition +2 ppm / 10 °C 30 °C to 50 °C
Frequency readout accuracy with marker (Start, stop, center, marker)
Marker resolution :
Uncertainty :
Frequency reference uncertainty = (aging rate x period of time since adjustment + temperature stability )
( frequency span ) / ( number of sweep points – 1)
± ( frequency indication × frequency reference uncertainty
+1% × span + 20% × resolution bandwidth + marker
resolution+1 Hz)
AC coupled
0 °C to 30 °C
Marker frequency counter
Frequency reference error = (aging rate
Frequency span
SSB phase noise
Resolution bandwidth (RBW)
– 3 dB bandwidth :
Resolution filter shape factor :
Video bandwidth (VBW)
– 3 dB bandwidth :
Resolution:
Accuracy:
1 Hz
± (marker frequency × frequency reference
uncertainty + Counter resolution)
x period of time since adjustment + temperature stability )
Range :
Resolution :
Accuracy :
Carrier offset :
30 kHz
100 kHz
1 MHz
Accuracy :
Accuracy :
0 Hz (zero span), 1 kHz to 3 GHz
1 Hz
± span / ( sweep points – 1)
< – 87 dBc (1 Hz)
< – 100 dBc (1 Hz)
< – 120 dBc (1 Hz)
30 Hz to 1 MHz
± 5%
< 5 : 1
3 Hz to 1 MHz
± 5%
RBW/ span
Noise level
20 °C to 30 °C; Typical
fc = 1 GHz; RBW 100 Hz; VBW 10 Hz; RMS detector
1- 3 - 10 sequence
Nominal
60 dB / 3 dB bandwidth ratio;Nominal;
Digital, approximately Gaussian shape
1- 3 - 10 sequence
Nominal
0.02; marker level to displayed
>
25 dB; frequency offset 0 Hz
>
07

Amplitude
Measurement range
Input attenuator range :
Maximum safe input level
Average continuous power :
Displayed average noise level
DC voltage :
Displayed average noise level (DANL) to +20 dBm
0 to 51 dB, in 1 dB steps
+ 33 dBm; 3 minutes maximum. Norminal
50 VDC maximum
Input attenuator setting
20 dB (input protection
switch active when input level > 33 dBm)
Preamp off :
100 kHz
1 MHz
10 MHz
1.5 GHz
1 MHz
f
c
<
10 MHz
f
c
<
=
c
50 MHz
f
f
c
<
1.5 GHz
f
<
c
3 GHz
1.9 GHz
c
f
=
– 90 dBm
<
<
– 110 dBm
– 126 dBm ( Typical )
<
– 124 dBm
<
– 117 dBm
<
– 122 dBm
( Typical )
Preamp on :
1 MHz
f
1 MHz
c
<
f
c
<
f
c
=
f
c
<
<
f
c
f
c
=
10 MHz
50 MHz
1.5 GHz
3 GHz
1.9 GHz
<
– 115 dBm
<
– 128 dBm
– 146 dBm ( Typical )
< – 144 dBm
<
– 136 dBm
<
– 142 dBm
( Typical )
100 kHz
10 MHz
1.5 GHz
RBW = 30 Hz; VBW = 3 Hz; input terminated 50 Ohm; 0 dB attenuation; RMS detector; Trace average 40
Level display range
Log scale and units :
Linear scale and units :
Sweep (Trace) points :
Marker level readout resolution :
Log scale
Linear scale
Detectors :
Number of traces :
Trace functions :
Level measurement error :
10 to 100 dB; ten divisions displayed; 1, 2, 5, 10 dB/ division.
dBm, dBmV, dB
µV
0 to 100% ; ten divisions displayed.
µA, mW, W
V,
461
0.01 dB
0.01% of reference level
Normal, Positive Peak, Sample, Negative Peak,
Log Power Average, RMS Average, Voltage Average.
4
Clear / write; maximum hold; average;
±1.5 dB (excluding input VSWR mismatch)
±0.5 dB,
Typical
Reference level – 50 dBm
Reference level
– 70 dBm
20 to 30 °C, peak detector, preamplifier off, input
signal 0 dBm to
–50 dBm, 20 dB input attenuation,
frequency > 1 MHz, auto sweep time, RBW = 1 kHz,
VBW = 1 kHz, trace average on to reduce noise
Reference level
08
Setting range :
Setting resolution :
Log scale
Linear scale
Accuracy :
– 100 to + 20 dBm
0.1 dB
1% of reference level
0
Steps of 1 dB
Because reference level affects only the display
not the measurement, it causes no additional
error in measurement results from trace data
markers

RF Input VSWR ( at tuned frequency )
Spurious response
Second harmonic distortion :
( second harmonic intercept )
Third - order intermodulation :
Inherent residual response :
Sweep
Sweep time
Attenuator setting 0 dB < 1.8 : 1
Attenuator setting 10 dB < 1.8 : 1
< 1.5 : 1
< 1.8 : 1
Attenuator setting 20 dB < 1.6 : 1
< 1.4 : 1
< –70 dBc
( third order intercept )
Input related spurious :
Range :
Sweep mode :
Trigger source :
Trigger slope :
Trigger delay :
Range
Resolution
+ 10 dBm, Typical
< –70 dBc
< –88 dBm
10 ms to 1000 s
µs to 200 s
6
Continuous; single
Free run; video; external
Selectable positive or negative edge
6 µs to 200 s
6 µs
10 MHz to 3.0 GHz, Nominal
100 kHz to 10 MHz, Nominal
10 MHz to 2.5 GHz, Typical
2.5 GHz to 3.0 GHz, Typical
100 kHz to 10 MHz, Nominal
10 MHz to 3.0 GHz, Typical
Mixer level = – 40 dBm
Third-order intermodulation products; 2 x –20 dBm;
reference level –10 dBm; center frequency 300 MHz;
frequency separation 200 kHz
–40 dBm signal at input mixer,
carry offest > 1 MHz.
Input terminated and 0 dB RF attenuation,
preamplifier off, reference level –30 dBm,
f > 30 MHz, RBW < 10 kHz
Span
1 kHz
Span = 0 Hz ( zero span )
Front panel input / output
RF input
Connector and impedance :
10 MHz reference / External trigger input
Reference input frequency :
Reference input amplitude :
Trigger voltage :
Connector and output impedance :
USB interface
Host connector and protocol :
Device connector and protocol :
VSWR :
Type -N female; 50
< 1.5 : 1
10 MHz
0 to + 10 dBm
5 V TTL level ( 12.6 V, 150 mA maximum )
BNC female; 50
A plug; Version 1.1
B plug; Version 1.1
Nominal
10 MHz to 3.0 GHz, input attenuator
Nominal
Nominal
10 dB
09

General
Display
Resolution :
Size and type :
Languages
On-Screen GUI :
Power requirements and calibration
Power consumption :
Operating time ( fully charged battery )
Charging time
Warm-up time :
Calibration cycle :
Environmental and size
Temperature range :
Relative humidity :
Dimensions :
Voltage :
Battery :
Life time
Weight :
640 x 480 pixels
6.5 inch ( 170 mm ) transflective; color display
English, Simplified Chinese, Traditional Chinese, French, German, Italian, Japanese, Korean, Russian,
Spanish, Portuguese.
90 to 120 or 195 to 263 VAC; 47 to 63 Hz
12 to 18 VDC; < 25 W
12 W
4 hours
3 hours
3 hours
300 to 500 charge cycles
30 minutes
One year
– 10 to + 50 °C
– 40 to + 70 °C
< 95%
3 kg ( 6.6 Ib )
318 × 207 × 69 mm
Auto-ranging
Typical
Tracking generator off
Tracking generator on
Operating ( Battery: 0 to 50
Storage ( Battery: –20 to 50 °C )
Net (shipping) approximately;
( 3.5 kg with battery)
Approximately ( W x H x D)
°C )
Options
RF preamplifier ( Option PA3 )
Frequency range : 1 MHz to 3 GHz
Tracking generator (Option TG3 )
Frequency range : 5 MHz to 3 GHz
Output flatness : ± 3 dB
Connector and impedance : Type-N female; 50
Demodulation
Frequency range:
Carrier power accuracy :
Carrier power displayed resolution : 0.01 dBm
AM measurement
Modulation rate : 20 Hz to 100 kHz
Gain : 20 dB
Output level : 0 to
VSWR : < 2.0 : 1
10 MHz to 3 GHz
±2 dBm
±1 dBm Typical
Accuracy :
Depth : 5 to 95%
Accuracy :
1 Hz, nominal (Modulation rate < 1 kHz)
< 0.1% modulation rate, nominal (Modulation rate > 1 kHz)
±4% Nominal
–25 dBm
Nominal
1 dB steps
Referenced to 50 MHz, 0 dBm
Nominal
10

N9340B
Handheld
Spectrum Analyzer
FM measurement
ASK measurement
Modulation depth/index
Displayed resolution :
FSK measurement
Modulation rate : 20 Hz to 200 kHz
Accuracy :
Deviation : 20 Hz to 400 kHz
Accuracy :
Symbol rate range :
Range :
Accuracy :
1 Hz, nominal (Modulation rate < 1 kHz)
< 0.1% modulation rate, nominal (Modulation rate > 1 kHz)
±4% Nominal
200 Hz to 100 kHz
10% to 95%
±4% of reading nominal
0.1%
Symbol rate range :
FSK deviation
Range :
Accuracy :
Displayed resolution :
* ß is the ratio of frequency deviation to symbol rate (deviation/rate)
1 kHz to 100 kHz
1 kHz to 400 kHz
±4% of reading nominal ß > 1 and ß < 4
0.01 Hz
Ordering Information
Model number Desc ripti on
N9340B handheld spectrum analyzer 100 kHz to 3.0 GHz
Accessories supplied as standard with each
Multi-language Quick Start Tutorial
CD-ROM of the manual
Soft carrying case
Options
N9340B-PA3 3 GHz preamplifier
N9340B-TG3 3 GHz tracking generator
N9340B-AMA AM/FM modulation analysis
N9340B-DMA ASK/FSK modulation analysis
N9340B-1TC Hard transit case
N9340B-1DC Automotive 12 VDC adaptor
N9340B-BAT Spare battery pack
N9340B-ADP Spare AC/DC adaptor
N9340B-BCG External battery charger
N9340B-TAD Adaptor Type-N(m) 50 Ohm to Type-N (f) 75 Ohm DC to 1 GHz
N9340B-ABA Manual – English
N9340B-AB2 Manual – Chinese
N9340B-ABJ Manual – Japanese
*
Warranty and service
Standard warranty is one year.
R-51B-001-3C 1 year Return-to-Agilent warranty extended to 3 years
Calibration
R-50C-001-3 Agilent Calibration Upfront Support Plan
3 year coverage
11

www.agilent.com
Remove all doubt
Our repair and calibration services will get
your equipment back to you, performing
like new, when promised. You will get
full value out of your Agilent equipment
throughout its lifetime. Your equipment
will be serviced by Agilent-trained technicians using the latest factory calibration
procedures, automated repair diagnostics
and genuine parts. You will always have the
utmost confidence in your measurements.
Agilent offers a wide range of additional
expert test and measurement services for
your equipment, including initial start-up
assistance onsite education and training,
as well as design, system integration, and
project management.
For more information on repair and
calibration services, go to
www.agilent.com/find/removealldoubt
For more information on Agilent
Technologies’ products, applications
or services, please contact your local
Agilent office. The complete list is
available at:
www.agilent.com/find/contactus
Phone or Fax
United States:
(tel) 800 829 4444
(fax) 800 829 4433
Canada:
(tel) 877 894 4414
(fax) 800 746 4866
China:
(tel) 800 810 0189
(fax) 800 820 2816
Europe:
(tel) 31 20 547 2111
Japan:
(tel) (81) 426 56 7832
(fax) (81) 426 56 7840
Agilent Email Updates
www.agilent.com/find/emailupdates
Get the latest information on the products
and applications you select.
Korea:
(tel) (080) 769 0800
(fax) (080) 769 0900
Latin America:
(tel) (305) 269 7500
Taiwan:
(tel) 0800 047 866
(fax) 0800 286 331
Other Asia Pacific Countries:
(tel) (65) 6375 8100
(fax) (65) 6755 0042
Email: tm_ap@agilent.com
Revised: 11/08/06
Product specifications and descriptions
in this document subject to change
without notice.
Microsoft and Windows are U.S. registered
trademarks of Microsoft Corporation.
© Agilent Technologies, Inc. 2008
Printed in USA, April 1, 2008
5989-7847EN
 Loading...