

Page 1

Agilent
Feature Extraction 12.2
Reference Guide
For Research Use Only. Not for use in diagnostic
procedures.
Agilent Technologies
Page 2

Notices
CAUTION
WARNING
© Agilent Technologies, Inc. 2021
No p art o f this manu al may be re produce d in
any form or by any means (including electronic storage and retrieval or translation
into a foreign language) without prior agreement and written consent from Agilent
Technologies, Inc. as governed by United
States and international copyright laws.
Edition
G4460-90064
Revision A0, January 2021
Printed in USA
Agilent Technologies, Inc.
5301 Stevens Creek Blvd.
Santa Clara, CA 95051
Patents
Portions of this product may be covered
under US patent 6571005 licensed from the
Regents of the University of California.
Technical Support
For US and Canada
Call (800) 227-9770 (option 3,4,2)
Or send an e-mail to:
informatics_support@agilent.com
For all other regions
Agilent’s world-wide Sales and Support
Center contact details for your location can
be obtained at
www.agilent.com/en/contact-us/page.
Warranty
The material contained in this document is provided “as is,” and is subject to being changed, without notice,
in future editions. Further, to the maximum extent permitted by applicable
law, Agilent disclaims all warranties,
either express or implied, with regard
to this manual and any information
contained herein, including but not
limited to the implied warranties of
merchantability and fitness for a particular purpose. Agilent shall not be
liable for errors or for incidental or
consequential damages in connection with the furnishing, use, or performance of this document or of any
information contained herein. Should
Agilent and the user have a separate
written agreement with warranty
terms covering the material in this
document that conflict with these
terms, the warranty terms in the separate agreement shall control.
Technology Licenses
The hardware and/or software described in
this document are furnished under a license
and may be used or copied only in accordance with the terms of such license.
Restricted Rights Legend
U.S. Government Restricted Rights. Software and technical data rights granted to
the federal government include only those
rights customarily provided to end user customers. Agilent provides this customary
commercial license in Software and technical data pursuant to FAR 12.211 (Technical
Data) and 12.212 (Computer Software) and,
for the Department of Defense, DFARS
252.227-7015 (Technical Data - Commercial
Items) and DFARS 227.7202-3 (Rights in
Commercial Computer Software or Computer Software Documentation).
Safety Notices
A CAUTION notice denotes a hazard. It calls attention to an operating procedure, practice, or the like
that, if not correctly performed or
adhered to, could result in damage
to the product or loss of important
data. Do not proceed beyond a
CAUTION notice until the indicated
conditions are fully understood and
met.
A WARNING notice denotes a
hazard. It calls attention to an
operating procedure, practice, or
the like that, if not correctly performed or adhered to, could result
in personal injury or death. Do not
proceed beyond a WARNING
notice until the indicated conditions are fully understood and
met.
2 Feature Extraction Reference Guide
Page 3

In This Guide…
This Reference Guide contains tables that list default
parameter values and results for Feature Extraction
analyses, and explanations of how Feature Extraction uses
its algorithms to calculate results.
1 Protocol Default Settings
This chapter includes tables that list the default parameter
values found in the protocols shipped with the software
(Agilent 2- color gene expression (GE), 1-color GE, CGH,
ChIP, miRNA and non- Agilent protocols).
2 QC Report Results
Learn how to read and interpret the QC Reports.
3 Text File Parameters and Results
This chapter contains a listing of parameters and results
within the text file produced after Feature Extraction.
4 XML (MAGE-ML) Results
Refer to this chapter to find the results contained in the
MAGE- ML files generated after Feature Extraction.
5 How Algorithms Calculate Results
Learn how Feature Extraction algorithms calculate the
results that help you interpret your gene expression (2- color
and 1- color), CGH, ChIP and miRNA experiments.
6 Command Line Feature Extraction
This chapter contains the commands and arguments to
integrate Feature Extraction into a completely automated
workflow.
Feature Extraction Reference Guide 3
Page 4

Acknowledgments
Apache acknowledgment
Part of this software is based on the Xerces XML parser,
Copyright (c) 1999- 2000 The Apache Software Foundation.
All Rights Reserved (www.apache.org).
JPEG acknowledgment
This software is based in part on the work of the
Independent JPEG Group. Copyright (c) 1991- 1998, Thomas
G. Lane. All Rights Reserved.
Loess/Netlib acknowledgment
Part of this software is based on a Loess/Lowess algorithm
and implementation. The authors of Loess/Lowess are
Cleveland, Grosse and Shyu. Copyright (c) 1989, 1992 by
AT&T. Permission to use, copy, modify and distribute this
software for any purpose without fee is hereby granted,
provided that this entire notice in included in all copies of
any software which is or includes a copy or modification of
this software and in all copies of the supporting
documentation for such software.
THIS SOFTWARE IS BEING PROVIDED “AS IS”, WITHOUT
ANY EXPRESS OR IMPLIED WARRANTY. NEITHER THE
AUTHORS NOR AT&T MAKE ANY REPRESENTATION OR
WARRANTY OF ANY KIND CONCERNING THE
MERCHANTABILITY OF THIS SOFTWARE OR ITS FITNESS
FOR ANY PARTICULAR PURPOSE.
Stanford University School of Medicine acknowledgment
Non- Agilent microarray image courtesy of Dr. Roger Wagner,
Division of Cardiovascular Medicine, Stanford University
School of Medicine
Ultimate Grid acknowledgment
This software contains material that is Copyright (c)
1994- 1999 DUNDAS SOFTWARE LTD., All Rights Reserved.
4 Feature Extraction Reference Guide
Page 5

LibTiff acknowledgement
Part of this software is based upon LibTIFF version 3.8.0.
Copyright (c) 1988- 1997 Sam Leffler
Copyright (c) 1991- 1997 Silicon Graphics, Inc.
Permission to use, copy, modify, distribute, and sell this
software and its documentation for any purpose is hereby
granted without fee, provided that (i) the above copyright
notices and this permission notice appear in all copies of
the software and related documentation, and (ii) the names
of Sam Leffler and Silicon Graphics may not be used in any
advertising or publicity relating to the software without the
specific, prior written permission of Sam Leffler and Silicon
Graphics.
THE SOFTWARE IS PROVIDED “AS- IS” AND WITHOUT
WARRANTY OF ANY KIND, EXPRESS, IMPLIED OR
OTHERWISE, INCLUDING WITHOUT LIMITATION, ANY
WARRANTY OF MERCHANTABILITY OR FITNESS FOR A
PARTICULAR PURPOSE.
IN NO EVENT SHALL SAM LEFFLER OR SILICON
GRAPHICS BE LIABLE FOR ANY SPECIAL, INCIDENTAL,
INDIRECT OR CONSEQUENTIAL DAMAGES OF ANY KIND,
OR ANY DAMAGES WHATSOEVER RESULTING FROM LOSS
OF USE, DATA OR PROFITS, WHETHER OR NOT ADVISED
OF THE POSSIBILITY OF DAMAGE, AND ON ANY THEORY
OF LIABILITY, ARISING OUT OF OR IN CONNECTION WITH
THE USE OR PERFORMANCE OF THIS SOFTWARE.
Feature Extraction Reference Guide 5
Page 6

6 Feature Extraction Reference Guide
Page 7

Content
1 Default Protocol Settings 13
Default Protocol Settings—an Introduction 14
Differences between CGH and gene expression microarrays 15
Hidden Settings 15
Tables of Default Protocol Settings 16
CGH_1201_Sep17 16
ChIP_1200_Jun14 24
GE1_1200_Jun14 31
GE2_1200_Dec17 37
GE2-NonAT_1100_Jul11 44
miRNA_1200_Jun14 49
Differences in Protocol Settings Based on Each Step 56
Place Grid 57
Optimize Grid fit 58
Find spots 59
Flag outliers 60
Compute Bkgd, Bias and Error 62
Correct Dye Biases 65
Compute ratios, calculate metrics, and generate results 66
2 QC Report Results 67
QC Reports 68
2-color Gene Expression QC Report 69
1-color Gene Expression QC Report 72
Streamlined CGH QC Report 75
CGH_ChIP QC Report 77
MicroRNA (miRNA) QC Report 79
Non-Agilent GE2 QC Report 81
QC reports with metric sets added 83
Feature Extraction Reference Guide 7
Page 8

Contents
QC Report Headers 87
2-color Gene Expression QC Report 87
1-color Gene Expression QC Report 88
Streamlined CGH QC Report 88
CGH_ChIP QC Report 88
MicroRNA (miRNA) QC Report 89
Non-Agilent 2-color gene expression QC Report 89
Feature Statistics 90
Spot finding of Four Corners 90
Outlier Stats 91
Spatial Distribution of All Outliers 91
Net Signal Statistics 93
Negative Control Stats 94
Plot of Background-Corrected Signals 95
Histogram of Signals Plot (1-color GE or CGH) 96
Local Background Inliers 97
Foreground Surface Fit 97
Multiplicative Surface Fit 99
Spatial Distribution of Significantly Up-Regulated and Down-Regulated
Features (Positive and Negative Log Ratios) 100
Plot of LogRatio vs. Log ProcessedSignal 101
Spatial Distribution of Median Signals for each Row and Column 102
Histogram of LogRatio plot 103
Inter-Feature Statistics 104
Reproducibility Statistics (%CV Replicated Probes) 104
Microarray Uniformity (2-color only) 106
Sensitivity 107
Reproducibility Plots 108
Spike-in Signal Statistics 111
Spike-in Linearity Check for 2-color Gene Expression 113
Spike-in Linearity Check for 1-color Gene Expression 114
QC Report Results in the FEPARAMS and Stats Tables 121
8 Feature Extraction Reference Guide
Page 9

QC Metric Set Results 122
CGH_QCMT_Sep17 122
ChIP_QCMT_Jun14 123
GE1_QCMT_Jun14 123
GE2_QCMT_Dec17 124
miRNA_QCMT_Jun14 124
Metric Evaluation Logic 125
3 Text File Parameters and Results 127
Parameters/options (FEPARAMS) 129
FULL FEPARAMS Table 129
COMPACT FEPARAMS Table 151
QC FEPARAMS Table 154
MINIMAL FEPARAMS Table 157
Statistical results (STATS) 160
STATS Table (ALL text output types) 160
Contents
Feature results (FEATURES) 179
FULL Features Table 179
COMPACT Features Table 190
QC Features Table 195
MINIMAL Features Table 201
Other text result file annotations 205
4 MAGE-ML (XML) File Results 207
How Agilent output file formats are used by databases 208
MAGE-ML results 209
Differences between MAGE-ML and text result files 209
Full and Compact Output Packages 209
Tables for Full Output Package 210
Table for Compact Output Package 218
Helpful hints for transferring Agilent output files 222
Feature Extraction Reference Guide 9
Page 10

Contents
XML output 222
TIFF Results 224
5 How Algorithms Calculate Results 225
Overview of Feature Extraction algorithms 226
Algorithms and functions they perform 226
Algorithms and results they produce 232
XDR Extraction Process 236
What is XDR scanning? 236
XDR Feature Extraction process 236
How the XDR algorithm works 238
Troubleshooting the XDR extraction 239
How each algorithm calculates a result 240
Place Grid 240
Optimize Grid Fit 243
Find Spots 243
Flag Outliers 250
Compute Bkgd, Bias and Error 256
Correct Dye Biases 276
Compute Ratios 280
Calculate Metrics 282
MicroRNA Analysis 285
Example calculations for feature 12519 of Agilent Human 22K image 292
Data from the FEPARAMS table 293
Data from the STATS Table 293
Data from the FEATURES Table 293
6 Command Line Feature Extraction 299
Commands 301
Command line syntax 301
Commands and arguments 302
10 Feature Extraction Reference Guide
Page 11

Return Codes 307
Extraction Input 309
Extraction Results 314
Status information 314
Examples of status information 315
Error codes from XML file 317
Warning codes from XML file 321
Index 327
Contents
Feature Extraction Reference Guide 11
Page 12

Contents
12 Feature Extraction Reference Guide
Page 13

Agilent Feature Extraction 12.2
Reference Guide
1
Default Protocol Settings
Default Protocol Settings—an Introduction 14
Tables of Default Protocol Settings 16
Differences in Protocol Settings Based on Each Step 56
See the Feature Extraction 12.2
User Guide to learn the purpose of
all the parameters and settings and
how to modify them.
Agilent protocols are meant for use
with Agilent microarrays scanned
with an Agilent scanner. They are
intended for use with arrays that
use Agilent default lab procedures
(label, hybridization, wash, and
scanning methods). The
non-Agilent protocol is meant for
use with non-Agilent microarrays
that are scanned with an Agilent
scanner.
When a protocol is assigned to an extraction set, the
software loads a set of protocol parameter values and
settings that affect the process and results for Feature
Extraction.
Parameter values in the protocol depend on the microarray
type and your experiment. The following pages list the
default settings for each of the protocol templates shipped or
downloaded with the software. Each protocol template
represents a different microarray type. You can display these
settings and values when you open the Protocol Editor for
each of the protocol templates.
Agilent Technologies
13
Page 14

1 Default Protocol Settings
Default Protocol Settings—an Introduction
Default Protocol Settings—an Introduction
To learn more about changing the
default values for the protocols,
see the Feature Extraction 12.2
User Guide.
To learn about the naming of the
protocol templates, see the Feature
Extraction 12.2 User Guide.
Agilent provides new and updated
protocols on the eArray website. If
you set up an eArray login in
Feature Extraction, the software
can automatically download and
install protocol updates from
eArray. See the Feature Extraction
12.2 User Guide for more details.
This chapter presents tables for display of the default
settings for each protocol. Parameter values depend on:
• microarray type
• lab protocol
• formats
• scanner used
Listed in the following table are the names of the
nonremovable protocols and where you can find the tables
that list their default values.
Table 1 Location of protocol template default settings
Protocol Template name Location in chapter
CGH_1201_Sep17
ChIP_1200_Jun14
GE1_1200_Jun14
GE2_1200_Dec17
GE2-NonAT_1100_Jul11
miRNA_1200_Jun14
page 16
page 24
page 31
page 37
page 44
page 49
14 Feature Extraction Reference Guide
Page 15

Default Protocol Settings 1
CAUTION
Differences between CGH and gene expression microarrays
Differences between CGH and gene expression microarrays
To see the differences in some
default settings between protocols,
go to “GE2_1200_Dec17” on
page 37.
Hidden Settings
CGH microarrays possess a different negative control
sequence scheme than the gene expression microarrays. The
gene expression microarrays have many replicate negative
control features using only one sequence. The CGH
microarrays have many sequences of negative controls that
span the range of sequence variability seen in the biological
probes used on the microarrays. This difference in the
control grid (especially the multiple sequences used for
negative controls) leads to a difference in protocol settings.
To create a protocol for a specific type of microarray, you
are required to use an Agilent- created protocol or
user- created protocol for the same type of microarray.
Protocol templates provide both visible and hidden settings whose
values are specific to the type or format of microarrays. Although you
can change the visible settings so that any two protocols of different
type appear identical, you cannot change the hidden settings that
distinguish these protocols from one another.
Feature Extraction Reference Guide 15
The “Tables of Default Protocol Settings” show only the
default visible parameter values for the steps of the protocol.
You can see the hidden parameters in the FE PARAMS table.
See “Parameters/options (FEPARAMS)” on page 129. Many of
these hidden parameters are image- processing ones that are
chosen using the “Automatically Determine” function.
Page 16

1 Default Protocol Settings
CAUTION
Tables of Default Protocol Settings
Tables of Default Protocol Settings
These protocol settings may not be optimum for non-Agilent
microarrays or Agilent microarrays processed with non-Agilent
procedures. You determine the settings and values that are optimum
for your system.
CGH_1201_Sep17
This protocol is a CGH protocol for use with the
Oligonucleotide Array- Based CGH for Genomic DNA
Analysis (Enzymatic User Manual version 6.1 or higher, ULS
User Manual version 3.1 or higher).
Table 2 Default settings for CGH_1201_Sep17 protocol
Protocol step Parameter Default Setting/Value (v12.2)
Place Grid Array Format For any format automatically
determined or selected by you, the
software uses the default
Placement Method.
Parameters that apply to specific
formats appear only if that format is
selected.
Placement Method Hidden if Array Format is set to
Enable Background Peak Shifting Hidden if Array Format is set to
Automatically Determine
[Recognized formats: Single
Density (11k, 22k), 25k, Double
Density (44k), 95k, 185k, 185k 10
uM, 65-micron feature size (also
with 10-micron scans), 30-micron
feature size single pack and multi
pack, and Third Party]
Automatically Determine.
Allow Some Distortion (All formats)
Automatically Determine.
Set to False for all arrays except 30
microns single pack and multi pack,
for which it is set to True.
16 Feature Extraction Reference Guide
Page 17

Default Protocol Settings 1
CGH_1201_Sep17
Table 2 Default settings for CGH_1201_Sep17 protocol (continued)
Protocol step Parameter Default Setting/Value (v12.2)
Use central part of pack for slope
and skew calculation?
Use the correlation method to
obtain origin X of subgrids
Use Enhanced
Gridding
Optimize Grid Fit Grid Format The parameters and values for
Apply the enhanced gridding
feature released in Feature
Extraction 12.1. The enhancements
include a new iterative method for
determining grid position, rotation,
and skew, and several “fine” grid
tuning methods that improve the
calculation of rotation and skew.
Enhanced gridding also uses both
the foreground and background of
the corner stencil patterns to
improve identification of grid
corners.
optimizing the grid differ depending
on the format.
Hidden if Array Format is set to
Automatically Determine.
Set to False for all arrays except 30
microns single pack and multi pack,
for which it is set to True.
Hidden if Array Format is set to
Automatically Determine.
Set to False for all arrays except 30
microns single pack and multi pack,
for which it is set to True.
True
Note: Results obtained with
protocols that use enhanced
gridding may vary slightly from
results obtained with previous
gridding algorithms (e.g., fewer
gridding errors). Use appropriate
validation processes when
switching from previous CGH
protocols to ones that use
enhanced gridding.
Automatically Determine
[Recognized formats: 65-micron
feature size, 30-micron feature size,
and Third Party]
Iteratively Adjust Corners? Hidden if Array Format is set to
Automatically Determine.
True (All Formats, except Third
Party)
False (Third Party)
Adjustment Threshold Hidden if Array Format is set to
Automatically Determine.
0.300 (All Formats, except Third
Party)
Feature Extraction Reference Guide 17
Page 18

1 Default Protocol Settings
CGH_1201_Sep17
Table 2 Default settings for CGH_1201_Sep17 protocol (continued)
Protocol step Parameter Default Setting/Value (v12.2)
Maximum Number of Iterations Hidden if Array Format is set to
Automatically Determine.
5 (All Formats, except Third Party)
Found Spot Threshold Hidden if Array Format is set to
Automatically Determine.
0.200 (All Formats, except Third
Party)
Number of Corner Feature Side
Dimension?
Find Spots Spot Format Depending on the format selected
by the software or by you, the
default settings for this step
change. See the following rows for
the default values for finding spots.
Use the Nominal Diameter from the
Grid Template
Spot Deviation Limit Hidden if Array Format is set to
Calculation of Spot Statistics
Method
Cookie Percentage Hidden if Array Format is set to
Hidden if Array Format is set to
Automatically Determine.
20 (All Formats, except Third Party)
Automatically Determine
[Recognized formats: Single
Density (11k, 22k), 25k, Double
Density (44k), 95k, 185k, 185k 10
uM, 244k 10uM, 65-micron feature
size, 30-micron feature size, and
Third Party]
Hidden if Array Format is set to
Automatically Determine.
True (All Formats)
Automatically Determine.
8.0 for all formats except for third
party, for which it is set to 1.5
Hidden if Array Format is set to
Automatically Determine.
Use Cookie (All Formats)
Automatically Determine.
0.650 (Single Density, 25k)
0.561 (Double Density, 95k)
0.700 (185k, 185k 10 uM, 244k 10
uM, 65-micron feature size)
18 Feature Extraction Reference Guide
Page 19

Default Protocol Settings 1
CGH_1201_Sep17
Table 2 Default settings for CGH_1201_Sep17 protocol (continued)
Protocol step Parameter Default Setting/Value (v12.2)
0.750 (30-micron feature size)
Exclusion Zone Percentage Hidden if Array Format is set to
Automatically Determine.
1.200 (All Formats except 30-micron
feature size)
1.300 (30-micron feature size)
Auto Estimate the Local Radius Hidden if Array Format is set to
Automatically Determine.
True (Single Density, Double
Density, 25k, 95k)
False (185k, 185k 10uM, 65-micron
feature size, 30-micron feature size,
244k 10uM)
LocalBGRadius Hidden if Array Format is set to
Automatically Determine.
100 (when False for 185k, 185k
10uM, 65-micron feature size, 244k
10 uM)
150 (when False for 30-micron
feature size)
Pixel Outlier Rejection Method Inter Quartile Region
(Automatically Determine and All
Formats)
RejectIQRFeat 1.42 (All Formats)
RejectIQRBG 1.42 (All Formats)
Statistical Method for Spot Values from Pixels Use Mean/Standard Deviation
(Automatically Determine and All
Formats)
Feature Extraction Reference Guide 19
Page 20

1 Default Protocol Settings
CGH_1201_Sep17
Table 2 Default settings for CGH_1201_Sep17 protocol (continued)
Protocol step Parameter Default Setting/Value (v12.2)
Use Enhanced
SpotFinding
Flag Outliers Compute Population Outliers True
Compute Non Uniform Outliers True
Scanner The values for the parameters
This enhancement allows for more
accurate placement of the center of
each spot by increasing the area
around the expected spot center in
which the algorithm looks for pixels
in the image that are attributable to
that spot. If the increased search
area captures pixels from
neighboring spots, then the
algorithm does not attribute those
pixels to the spot.
Minimum Population 10
IQRatio 1.42
Background IQRatio 1.42
Use Qtest for Small Populations? True
Report Population Outliers as Failed
in MAGEML file
change depending on the scanner
used for the image. See the
following for differences.
False
Note: Results obtained with
protocols that use enhanced spot
finding may vary slightly from
results obtained without spot
finding (e.g., fewer non-uniform
features). Use appropriate
validation processes when
switching to CGH protocols that
use enhanced spot finding.
False
Automatically Determine
Agilent scanner
Automatically Compute OL Polynomial Terms Hidden if Array Format is set to
Automatically Determine.
True
Feature – (%CV)^2 0.04000
Red Poissonian Noise Term
Multiplier
5
20 Feature Extraction Reference Guide
Page 21

Default Protocol Settings 1
CGH_1201_Sep17
Table 2 Default settings for CGH_1201_Sep17 protocol (continued)
Protocol step Parameter Default Setting/Value (v12.2)
Compute Bkgd, Bias and
Error
Red Signal Constant Term
Multiplier
Green Poissonian Noise Term
Multiplier
Green Signal Constant Term
Multiplier
Background – (%CV)^2 0.09000
Red Poissonian Noise Term
Multiplier
Red Background Constant Term
Multiplier
Green Poissonian Noise Term
Multiplier
Green Background Constant Term
Multiplier
Background Subtraction Method No Background Subtraction
Significance (for IsPosAndSignif and IsWellAboveBG) Use Error Model for Significance
2-sided t-test of feature vs.
background max p-value
1
5
1
3
1
3
1
0.01
WellAboveMulti 13
Signal Correction—Calculate Surface Fit (required for
Spatial Detrend)
Feature Set for Surface Fit OnlyNegativeControlFeatures
Perform Filtering for Surface Fit False
Perform Spatial Detrending True
Signal Correction—Adjust Background Globally False
Signal Correction—Perform Multiplicative Detrending True
Detrend on Replicates Only False
True
Feature Extraction Reference Guide 21
Page 22

1 Default Protocol Settings
CGH_1201_Sep17
Table 2 Default settings for CGH_1201_Sep17 protocol (continued)
Protocol step Parameter Default Setting/Value (v12.2)
Filter Low signal probes from Fit? True
Neg. Ctrl. Threshold Mult. Detrend
Factor
Perform Filtering for Fit Use Window Average
Use polynomial data fit instead of
LOESS?
Polynomial Multiplicative
DetrendDegree
Robust Neg Ctrl Stats? True
Choose universal error, or most conservative Most Conservative
MultErrorGreen 0.1000
MultErrorRed 0.1000
Auto Estimate Add Error Red True
Auto Estimate Add Error Green True
Use Surrogates True
Correct Dye Biases Use Dye Norm List Automatically Determine
Dye Normalization Probe Selection Method Use Rank Consistent Probes
Rank Tolerance 0.050
Variable Rank Tolerance False
3
True
4
Omit Background Population Outliers False
Allow Positive and Negative Controls False
Signal Characteristics OnlyPositiveAndSignificantSignals
Normalization Correction Method Linear
Max Number Ranked Probes -1
Compute Ratios Peg Log Ratio Value 4.00
22 Feature Extraction Reference Guide
Page 23

Default Protocol Settings 1
CGH_1201_Sep17
Table 2 Default settings for CGH_1201_Sep17 protocol (continued)
Protocol step Parameter Default Setting/Value (v12.2)
Calculate Metrics Spikein Target Used False
Min Population for Replicate Stats? 3
Grid Test Format Automatically Determine
Recognized formats: 60 micron and
30 micron feature size, third party
PValue for Differential Expression 0.010000
Percentile Value 75.00
Generate Results Type of QC Report Streamlined CGH
Generate Single Text File True
JPEG Down Sample Factor 4
Feature Extraction Reference Guide 23
Page 24

1 Default Protocol Settings
ChIP_1200_Jun14
ChIP_1200_Jun14
This protocol is a ChIP protocol for use with Agilent
Mammalian ChIP- on- Chip and DNA methylation applications.
Table 3 Default settings for ChIP_1200_Jun14 protocol
Protocol step Parameter Default Setting/Value (v12.2)
Place Grid Array Format For any format automatically
determined or selected by you, the
software uses the default
Placement Method.
Parameters that apply to specific
formats appear only if that format is
selected.
Placement Method Hidden if Array Format is set to
Enable Background Peak Shifting Hidden if Array Format is set to
Use central part of pack for slope
and skew calculation?
Use the correlation method to
obtain origin X of subgrids
Automatically Determine
[Recognized formats: Single
Density (11k, 22k), 25k, Double
Density (44k), 95k, 185k, 185k 10
uM, 65-micron feature size (also
with 10-micron scans), 30-micron
feature size (single pack and multi
pack) and Third Party]
Automatically Determine.
Allow Some Distortion (All formats)
Automatically Determine.
Set to false for all arrays except 30
microns (single pack and multi
pack), for which it is set to true.
Hidden if Array Format is set to
Automatically Determine.
Set to False for all arrays except 30
microns single pack and multi pack,
for which it is set to True.
Hidden if Array Format is set to
Automatically Determine.
Set to False for all arrays except 30
microns single pack and multi pack,
for which it is set to True.
24 Feature Extraction Reference Guide
Page 25

Default Protocol Settings 1
ChIP_1200_Jun14
Table 3 Default settings for ChIP_1200_Jun14 protocol (continued)
Protocol step Parameter Default Setting/Value (v12.2)
Use Enhanced
Gridding
Optimize Grid Fit Grid Format The parameters and values for
An enhanced automatic gridding
algorithm was released in Feature
Extraction 12.1 for use in CGH
protocols only. Agilent has not
validated the new algorithm in ChIP
protocols.
optimizing the grid differ depending
on the format.
Iteratively Adjust Corners? Hidden if Array Format is set to
Adjustment Threshold Hidden if Array Format is set to
Maximum Number of Iterations Hidden if Array Format is set to
False
Automatically Determine
[Recognized formats: 65-micron
feature size, 30-micron feature size,
and Third Party]
Automatically Determine.
True (All Formats, except Third
Party)
False (Third Party)
Automatically Determine.
0.300(All Formats, except Third
Party)
Automatically Determine.
5 (All Formats, except Third Party)
Found Spot Threshold Hidden if Array Format is set to
Automatically Determine.
0.200 (All Formats, except Third
Party)
Number of Corner Feature Side
Dimension?
Find Spots Spot Format Depending on the format selected
by the software or by you, the
default settings for this step
change. See the following rows for
the default values for finding spots.
Hidden if Array Format is set to
Automatically Determine.
20 (All Formats, except Third Party)
Automatically Determine
[Recognized formats: same as
those listed above except 244k
10uM replaces 65-micron feature
size 10-micron scans]
Feature Extraction Reference Guide 25
Page 26

1 Default Protocol Settings
ChIP_1200_Jun14
Table 3 Default settings for ChIP_1200_Jun14 protocol (continued)
Protocol step Parameter Default Setting/Value (v12.2)
Use the Nominal Diameter from the
Grid Template
Spot Deviation Limit Hidden if Array Format is set to
Calculation of Spot Statistics
Method
Cookie Percentage Hidden if Array Format is set to
Exclusion Zone Percentage Hidden if Array Format is set to
Hidden if Array Format is set to
Automatically Determine.
True (All Formats)
Automatically Determine.
8.0 for all formats except for third
party, for which it is set to 1.5
Hidden if Array Format is set to
Automatically Determine.
Use Cookie (All Formats)
Automatically Determine.
0.650 (Single Density, 25k)
0.561 (Double Density, 95k)
0.700 (185k, 185k 10 uM, 244k 10
uM, 65-micron feature size)
0.750 (30-micron feature size)
Automatically Determine.
1.200 (All Formats except 30-micron
feature size)
1.300 (30-micron feature size)
Auto Estimate the Local Radius Hidden if Array Format is set to
Automatically Determine.
True (Single Density, Double
Density, 25k, 95k)
False (185k, 185k 10uM, 65-micron
feature size, 30-micron feature size,
244k 10uM)
26 Feature Extraction Reference Guide
Page 27

Default Protocol Settings 1
ChIP_1200_Jun14
Table 3 Default settings for ChIP_1200_Jun14 protocol (continued)
Protocol step Parameter Default Setting/Value (v12.2)
LocalBGRadius Hidden if Array Format is set to
Automatically Determine.
100 (when False for 185k, 185k
10uM, 65-micron feature size, 244k
10 uM)
150 (when False for 30-micron
feature size)
Pixel Outlier Rejection Method Inter Quartile Region
(Automatically Determine and All
Formats)
RejectIQRFeat 1.42 (All Formats)
RejectIQRBG 1.42 (All Formats)
Statistical Method for Spot Values from Pixels Use Mean/Standard Deviation
(Automatically Determine and All
Formats)
Flag Outliers Compute Population Outliers True
Minimum Population 8
IQRatio 1.42
Background IQRatio 1.42
Use Qtest for Small Populations? True
Report Population Outliers as Failed
in MAGEML file
Compute Non Uniform Outliers True
Scanner The values for the parameters
change depending on the scanner
used for the image. See the
following for differences.
Agilent scanner
Automatically Compute OL Polynomial Terms Hidden if Array Format is set to
False
Automatically Determine
Automatically Determine.
True
Feature Extraction Reference Guide 27
Page 28

1 Default Protocol Settings
ChIP_1200_Jun14
Table 3 Default settings for ChIP_1200_Jun14 protocol (continued)
Protocol step Parameter Default Setting/Value (v12.2)
Feature – (%CV)^2 0.04000
Compute Bkgd, Bias and
Error
Red Poissonian Noise Term
Multiplier
Red Signal Constant Term
Multiplier
Green Poissonian Noise Term
Multiplier
Green Signal Constant Term
Multiplier
Background – (%CV)^2 0.09000
Red Poissonian Noise Term
Multiplier
Red Background Constant Term
Multiplier
Green Poissonian Noise Term
Multiplier
Green Background Constant Term
Multiplier
Background Subtraction Method No Background Subtraction
Significance (for IsPosAndSignif and IsWellAboveBG) Use Error Model for Significance
5
1
5
1
3
1
3
1
2-sided t-test of feature vs.
background max p-value
WellAboveMulti 13
Signal Correction—Calculate Surface Fit (required for
Spatial Detrend)
Feature Set for Surface Fit OnlyNegativeControlFeatures
Perform Filtering for Surface Fit False
Perform Spatial Detrending True
0.01
True
28 Feature Extraction Reference Guide
Page 29

Default Protocol Settings 1
ChIP_1200_Jun14
Table 3 Default settings for ChIP_1200_Jun14 protocol (continued)
Protocol step Parameter Default Setting/Value (v12.2)
Signal Correction—Adjust Background Globally False
Signal Correction—Perform Multiplicative Detrending True
Detrend on Replicates Only False
Filter Low signal probes from Fit? True
Neg. Ctrl. Threshold Mult. Detrend
Factor
Perform Filtering for Fit Use Window Average
Use polynomial data fit instead of
LOESS?
Polynomial Multiplicative
DetrendDegree
Robust Neg Ctrl Stats? True
Choose universal error, or most conservative Most Conservative
MultErrorGreen 0.1000
MultErrorRed 0.1000
Auto Estimate Add Error Red True
Auto Estimate Add Error Green True
Use Surrogates True
Correct Dye Biases Use Dye Norm List Automatically Determine
Dye Normalization Probe Selection Method Use Rank Consistent Probes
Rank Tolerance 0.050
Variable Rank Tolerance False
3
True
4
Omit Background Population Outliers False
Allow Positive and Negative Controls False
Signal Characteristics OnlyPositiveAndSignificantSignals
Feature Extraction Reference Guide 29
Page 30

1 Default Protocol Settings
ChIP_1200_Jun14
Table 3 Default settings for ChIP_1200_Jun14 protocol (continued)
Protocol step Parameter Default Setting/Value (v12.2)
Normalization Correction Method Linear
Max Number Ranked Probes -1
Compute Ratios Peg Log Ratio Value 4.00
Calculate Metrics Spikein Target Used False
Min Population for Replicate Stats? 3
Grid Test Format Automatically Determine
Recognized formats: 60 micron and
30 micron feature size, third party
PValue for Differential Expression 0.010000
Percentile Value 75.00
Generate Results Type of QC Report CGH_ChIP
Generate Single Text File True
JPEG Down Sample Factor 4
30 Feature Extraction Reference Guide
Page 31

Default Protocol Settings 1
GE1_1200_Jun14
GE1_1200_Jun14
This protocol is a 1- color gene expression protocol for use
with the One- Color Microarray- Based Gene Expression
Analysis (Quick Amp Labeling) (lab protocol v5.7 or higher,
publication number G4140- 90040 or G4140-90041 for Tecan
HS Pro Hybridization).
Table 4 Default settings for GE1_1200_Jun14 protocol
Protocol step Parameter Default Setting/Value (v12.2)
Place Grid Array Format For any format automatically
determined or selected by you, the
software uses the default
Placement Method.
Parameters that apply to specific
formats appear only if that format is
selected.
Placement Method Hidden if Array Format is set to
Enable Background Peak Shifting Hidden if Array Format is set to
Use central part of pack for slope
and skew calculation?
Use the correlation method to
obtain origin X of subgrids
Automatically Determine
[Recognized formats: Single
Density (11k, 22k), 25k, Double
Density (44k), 95k, 185k, 185k 10
uM, 65-micron feature size (also
with 10-micron scans), 30-micron
feature size (single pack and multi
pack) and Third Party]
Automatically Determine.
Allow Some Distortion (All formats)
Automatically Determine.
Set to false for all arrays except 30
microns (single pack and multi
pack), for which it is set to true.
Hidden if Array Format is set to
Automatically Determine.
Set to False for all arrays except 30
microns single pack and multi pack,
for which it is set to True.
Hidden if Array Format is set to
Automatically Determine.
Set to False for all arrays except 30
microns single pack and multi pack,
for which it is set to True.
Feature Extraction Reference Guide 31
Page 32

1 Default Protocol Settings
GE1_1200_Jun14
Table 4 Default settings for GE1_1200_Jun14 protocol (continued)
Protocol step Parameter Default Setting/Value (v12.2)
Use Enhanced
Gridding
Optimize Grid Fit Grid Format The parameters and values for
An enhanced automatic gridding
algorithm was released in Feature
Extraction 12.1 for use in CGH
protocols only. Agilent has not
validated the new algorithm in GE1
protocols.
optimizing the grid differ depending
on the format,
Iteratively Adjust Corners? Hidden if Array Format is set to
Adjustment Threshold Hidden if Array Format is set to
Maximum Number of Iterations Hidden if Array Format is set to
False
Automatically Determine
[Recognized formats: 65-micron
feature size, 30-micron feature size,
and Third Party]
Automatically Determine.
True (All Formats, except Third
Party)
False (Third Party)
Automatically Determine.
0.300(All Formats, except Third
Party)
Automatically Determine.
5 (All Formats, except Third Party)
Found Spot Threshold Hidden if Array Format is set to
Automatically Determine.
0.200 (All Formats, except Third
Party)
Number of Corner Feature Side
Dimension?
Find Spots Spot Format Depending on the format selected
by the software or by you, the
default settings for this step
change. See the following rows for
the default values for finding spots.
Hidden if Array Format is set to
Automatically Determine.
20 (All Formats, except Third Party)
Automatically Determine
[Recognized formats: same as
those listed above except 244k
10uM replaces 65-micron feature
size 10-micron scans]
32 Feature Extraction Reference Guide
Page 33

Default Protocol Settings 1
GE1_1200_Jun14
Table 4 Default settings for GE1_1200_Jun14 protocol (continued)
Protocol step Parameter Default Setting/Value (v12.2)
Use the Nominal Diameter from the
Grid Template
Spot Deviation Limit Hidden if Array Format is set to
Calculation of Spot Statistics
Method
Cookie Percentage Hidden if Array Format is set to
Exclusion Zone Percentage Hidden if Array Format is set to
Hidden if Array Format is set to
Automatically Determine.
True (All Formats)
Automatically Determine.
8.0 for all formats except for third
party, for which it is set to 1.5
Hidden if Array Format is set to
Automatically Determine.
Use Cookie (All Formats)
Automatically Determine.
0.650 (Single Density, 25k)
0.561 (Double Density, 95k)
0.700 (185k, 185k 10 uM, 244k 10
uM, 65-micron feature size)
0.750 (30-micron feature size)
Automatically Determine.
1.200 (All Formats except 30-micron
feature size)
1.300 (30-micron feature size)
Auto Estimate the Local Radius Hidden if Array Format is set to
Automatically Determine.
True (Single Density, Double
Density, 25k, 95k)
False (185k, 185k 10uM, 65-micron
feature size, 30-micron feature size,
244k 10uM)
Feature Extraction Reference Guide 33
Page 34

1 Default Protocol Settings
GE1_1200_Jun14
Table 4 Default settings for GE1_1200_Jun14 protocol (continued)
Protocol step Parameter Default Setting/Value (v12.2)
LocalBGRadius Hidden if Array Format is set to
Automatically Determine.
100 (when False for 185k, 185k
10uM, 65-micron feature size, 244k
10 uM)
150 (when False for 30-micron
feature size)
Pixel Outlier Rejection Method Inter Quartile Region
(Automatically Determine and All
Formats)
RejectIQRFeat 1.42 (All Formats)
RejectIQRBG 1.42 (All Formats)
Statistical Method for Spot Values from Pixels Use Mean/Standard Deviation
(Automatically Determine and All
Formats)
Flag Outliers Compute Population Outliers True
Minimum Population 10
IQRatio 1.42
Background IQRatio 1.42
Use Qtest for Small Populations? True
Report Population Outliers as Failed
in MAGEML file
Compute Non Uniform Outliers True
Scanner The values for the parameters
change depending on the scanner
used for the image. See the
following for differences.
Agilent scanner
Automatically Compute OL Polynomial Terms Hidden if Array Format is set to
False
Automatically Determine
Automatically Determine.
True
34 Feature Extraction Reference Guide
Page 35

Default Protocol Settings 1
GE1_1200_Jun14
Table 4 Default settings for GE1_1200_Jun14 protocol (continued)
Protocol step Parameter Default Setting/Value (v12.2)
Feature – (%CV)^2 0.04000
Compute Bkgd, Bias and
Error
Green Poissonian Noise Term
Multiplier
Green Signal Constant Term
Multiplier
Background – (%CV)^2 0.09000
Green Poissonian Noise Term
Multiplier
Green Background Constant Term
Multiplier
Background Subtraction Method No Background Subtraction
Significance (for IsPosAndSignif and IsWellAboveBG) Use Error Model for Significance
2-sided t-test of feature vs.
background max p-value
WellAboveMulti 13
Signal Correction—Calculate Surface Fit (required for
Spatial Detrend)
Feature Set for Surface Fit FeaturesInNegativeControlRange
Perform Filtering for Surface Fit True
20
1
3
1
0.01
True
Perform Spatial Detrending True
Signal Correction—Adjust Background Globally False
Signal Correction—Perform Multiplicative Detrending True
Detrend on Replicates Only True
Filter Low signal probes from Fit? True
Neg. Ctrl. Threshold Mult. Detrend
Factor
Perform Filtering for Fit Use Window Average
5
Feature Extraction Reference Guide 35
Page 36

1 Default Protocol Settings
GE1_1200_Jun14
Table 4 Default settings for GE1_1200_Jun14 protocol (continued)
Protocol step Parameter Default Setting/Value (v12.2)
Use polynomial data fit instead of
LOESS?
Polynomial Multiplicative
DetrendDegree
Robust Neg Ctrl Stats? False
Choose universal error, or most conservative Most Conservative
MultErrorGreen 0.1000
Auto Estimate Add Error Green True
Use Surrogates True
Calculate Metrics Spikein Target Used True
Min Population for Replicate Stats? 5
Grid Test Format Automatically Determine
PValue for Differential Expression 0.010000
Percentile Value 75.00
Generate Results Type of QC Report Gene Expression
Generate Single Text File True
True
4
Recognized formats: 60 micron and
30 micron feature size, third party
JPEG Down Sample Factor 4
36 Feature Extraction Reference Guide
Page 37

Default Protocol Settings 1
GE2_1200_Dec17
GE2_1200_Dec17
This is a 2- color gene expression protocol for use with the
Two- color Microarray- Based Gene Expression Analysis
(Quick Amp Labeling) (lab protocol v5.7 or higher,
publication number G4140- 90050 or G4140-90051 for Tecan
HS Pro Hybridization).
Table 5 Default settings for GE2_1200_Dec17 protocol
Protocol step Parameter Default Setting/Value (v12.2)
Place Grid Array Format For any format automatically
determined or selected by you, the
software uses the default
Placement Method.
Parameters that apply to specific
formats appear only if that format is
selected.
Placement Method Hidden if Array Format is set to
Enable Background Peak Shifting Hidden if Array Format is set to
Use central part of pack for slope
and skew calculation?
Use the correlation method to
obtain origin X of subgrids
Automatically Determine
[Recognized formats: Single
Density (11k, 22k), 25k, Double
Density (44k), 95k, 185k, 185k 10
uM, 65-micron feature size (also
with 10-micron scans), 30-micron
feature size (single pack and multi
pack) and Third Party]
Automatically Determine.
Allow Some Distortion (All formats)
Automatically Determine.
Set to false for all arrays except 30
microns (single pack and multi
pack), for which it is set to true.
Hidden if Array Format is set to
Automatically Determine.
Set to False for all arrays except 30
microns single pack and multi pack,
for which it is set to True.
Hidden if Array Format is set to
Automatically Determine.
Set to False for all arrays except 30
microns single pack and multi pack,
for which it is set to True.
Feature Extraction Reference Guide 37
Page 38

1 Default Protocol Settings
GE2_1200_Dec17
Table 5 Default settings for GE2_1200_Dec17 protocol (continued)
Protocol step Parameter Default Setting/Value (v12.2)
Use Enhanced
Gridding
Optimize Grid Fit Grid Format The parameters and values for
An enhanced automatic gridding
algorithm was released in Feature
Extraction 12.1 for use in CGH
protocols only. Agilent has not
validated the new algorithm in GE2
protocols.
optimizing the grid differ depending
on the format.
Iteratively Adjust Corners? Hidden if Array Format is set to
Adjustment Threshold Hidden if Array Format is set to
Maximum Number of Iterations Hidden if Array Format is set to
False
Automatically Determine
[Recognized formats: 65-micron
feature size, 30-micron feature size,
and Third Party]
Automatically Determine.
True (All Formats, except Third
Party)
False (Third Party)
Automatically Determine.
0.300 (All Formats, except Third
Party)
Automatically Determine.
5 (All Formats, except Third Party)
Found Spot Threshold Hidden if Array Format is set to
Automatically Determine.
0.200 (All Formats, except Third
Party)
Number of Corner Feature Side
Dimension?
Find Spots Spot Format Depending on the format selected
by the software or by you, the
default settings for this step
change. See the following rows for
the default values for finding spots.
Hidden if Array Format is set to
Automatically Determine.
20 (All Formats, except Third Party)
Automatically Determine
[Recognized formats: same as
those listed above except 244k
10uM replaces 65-micron feature
size 10-micron scans]
38 Feature Extraction Reference Guide
Page 39

Default Protocol Settings 1
GE2_1200_Dec17
Table 5 Default settings for GE2_1200_Dec17 protocol (continued)
Protocol step Parameter Default Setting/Value (v12.2)
Use the Nominal Diameter from the
Grid Template
Spot Deviation Limit Hidden if Array Format is set to
Calculation of Spot Statistics
Method
Cookie Percentage Hidden if Array Format is set to
Exclusion Zone Percentage Hidden if Array Format is set to
Hidden if Array Format is set to
Automatically Determine.
True (All Formats)
Automatically Determine.
8.0 for all formats except for third
party, for which it is set to 1.5
Hidden if Array Format is set to
Automatically Determine.
Use Cookie (All Formats)
Automatically Determine.
0.650 (Single Density, 25k)
0.561 (Double Density, 95k)
0.700 (185k, 185k 10 uM, 244k 10
uM, 65-micron feature size)
0.750 (30-micron feature size)
Automatically Determine.
1.200 (All Formats except 30-micron
feature size)
1.300 (30-micron feature size)
Auto Estimate the Local Radius Hidden if Array Format is set to
Automatically Determine.
True (Single Density, Double
Density, 25k, 95k)
False (185k, 185k 10uM, 65-micron
feature size, 30-micron feature size,
244k 10uM)
Feature Extraction Reference Guide 39
Page 40

1 Default Protocol Settings
GE2_1200_Dec17
Table 5 Default settings for GE2_1200_Dec17 protocol (continued)
Protocol step Parameter Default Setting/Value (v12.2)
LocalBGRadius Hidden if Array Format is set to
Automatically Determine.
100 (when False for 185k, 185k
10uM, 65-micron feature size, 244k
10 uM)
150 (when False for 30-micron
feature size)
Pixel Outlier Rejection Method Inter Quartile Region
(Automatically Determine and All
Formats)
RejectIQRFeat 1.42 (All Formats)
RejectIQRBG 1.42 (All Formats)
Statistical Method for Spot Values from Pixels Use Mean/Standard Deviation
(Automatically Determine and All
Formats)
Flag Outliers Compute Population Outliers True
Minimum Population 10
IQRatio 1.42
Background IQRatio 1.42
Use Qtest for Small Populations? True
Report Population Outliers as Failed
in MAGEML file
Compute Non Uniform Outliers True
Scanner The values for the parameters
change depending on the scanner
used for the image. See the
following for differences.
Agilent scanner
Automatically Compute OL Polynomial Terms Hidden if Array Format is set to
False
Automatically Determine
Automatically Determine.
True
40 Feature Extraction Reference Guide
Page 41

Default Protocol Settings 1
GE2_1200_Dec17
Table 5 Default settings for GE2_1200_Dec17 protocol (continued)
Protocol step Parameter Default Setting/Value (v12.2)
Feature – (%CV)^2 0.04
Compute Bkgd, Bias and
Error
Red Poissonian Noise Term
Multiplier
Red Signal Constant Term
Multiplier
Green Poissonian Noise Term
Multiplier
Green Signal Constant Term
Multiplier
Background – (%CV)^2 0.09000
Red Poissonian Noise Term
Multiplier
Red Background Constant Term
Multiplier
Green Poissonian Noise Term
Multiplier
Green Background Constant Term
Multiplier
Background Subtraction Method No Background Subtraction
Significance (for IsPosAndSignif and IsWellAboveBG) Use Error Model for Significance
20
1
20
1
3
1
3
1
2-sided t-test of feature vs.
background max p-value
WellAboveMulti 13
Signal Correction—Calculate Surface Fit (required for
Spatial Detrend)
Feature Set for Surface Fit FeaturesInNegativeControlRange
Perform Filtering for Surface Fit True
Perform Spatial Detrending True
0.01
True
Feature Extraction Reference Guide 41
Page 42

1 Default Protocol Settings
GE2_1200_Dec17
Table 5 Default settings for GE2_1200_Dec17 protocol (continued)
Protocol step Parameter Default Setting/Value (v12.2)
Signal Correction—Adjust Background Globally False
Signal Correction—Perform Multiplicative Detrending True
Detrend on Replicates Only True
Filter Low signal probes from Fit? True
Neg. Ctrl. Threshold Mult. Detrend
Factor
Perform Filtering for Fit Use Window Average
Robust Neg Ctrl Stats? False
Choose universal error, or most conservative Most Conservative
MultErrorGreen 0.1000
MultErrorRed 0.1000
Auto Estimate Add Error Red True
Auto Estimate Add Error Green True
Use Surrogates True
Correct Dye Biases Use Dye Norm List Automatically Determine
Dye Normalization Probe Selection Method Use Rank Consistent Probes
Rank Tolerance 0.050
Variable Rank Tolerance False
Omit Background Population Outliers False
Allow Positive and Negative Controls False
5
Signal Characteristics OnlyPositiveAndSignificantSignals
Normalization Correction Method Linear and Lowess
Max Number Ranked Probes 8000
Compute Ratios Peg Log Ratio Value 4.00
Calculate Metrics Spikein Target Used True
42 Feature Extraction Reference Guide
Page 43

Default Protocol Settings 1
GE2_1200_Dec17
Table 5 Default settings for GE2_1200_Dec17 protocol (continued)
Protocol step Parameter Default Setting/Value (v12.2)
Min Population for Replicate Stats? 5
Grid Test Format Automatically Determine
Recognized formats: 60 micron and
30 micron feature size, third party
PValue for Differential Expression 0.010000
Percentile Value 75.00
Generate Results Type of QC Report Gene Expression
Generate Single Text File True
JPEG Down Sample Factor 4
Feature Extraction Reference Guide 43
Page 44

1 Default Protocol Settings
GE2-NonAT_1100_Jul11
GE2-NonAT_1100_Jul11
Use this protocol for running Feature Extraction on
non- Agilent microarrays scanned with the Agilent scanner.
Table 6 Default settings for GE2-NonAT_1100_Jul11 protocol
Protocol step Parameter Default Setting/Value (v12.2)
Place Grid Array Format For any format automatically
determined or selected by you, the
software uses the default
Placement Method.
Parameters that apply to specific
formats appear only if that format is
selected.
Placement Method Hidden if Array Format is set to
Enable Background Peak Shifting Hidden if Array Format is set to
Use central part of pack for slope
and skew calculation?
Use the correlation method to
obtain origin X of subgrids
Automatically Determine
[Recognized formats: Single
Density (11k, 22k), 25k, Double
Density (44k), 95k, 185k, 185k 10
uM, 65-micron feature size (also
with 10-micron scans), 30-micron
feature size (single pack and multi
pack) and Third Party]
Automatically Determine.
Allow Some Distortion
Automatically Determine.
Set to false for all arrays except 30
microns (single pack and multi
pack), for which it is set to true.
Hidden if Array Format is set to
Automatically Determine.
Set to False for all arrays except 30
microns single pack and multi pack,
for which it is set to True.
Hidden if Array Format is set to
Automatically Determine.
Set to False for all arrays except 30
microns single pack and multi pack,
for which it is set to True.
44 Feature Extraction Reference Guide
Page 45

Default Protocol Settings 1
GE2-NonAT_1100_Jul11
Table 6 Default settings for GE2-NonAT_1100_Jul11 protocol (continued)
Protocol step Parameter Default Setting/Value (v12.2)
Use Enhanced
Gridding
Optimize Grid Fit Grid Format The parameters and values for
An enhanced automatic gridding
algorithm was released in Feature
Extraction 12.1 for use in CGH
protocols only. Agilent has not
validated the new algorithm in GE2
protocols.
optimizing the grid differ depending
on the format.
Iteratively Adjust Corners? Hidden if Array Format is set to
Adjustment Threshold Hidden if Array Format is set to
Maximum Number of Iterations Hidden if Array Format is set to
False
Automatically Determine
[Recognized formats: 65-micron
feature size, 30-micron feature size,
and Third Party]
Automatically Determine.
True (All Formats, except Third
Party)
False (Third Party)
Automatically Determine.
0.300 (All Formats, except Third
Party)
Automatically Determine.
5 (All Formats, except Third Party)
Found Spot Threshold Hidden if Array Format is set to
Automatically Determine.
0.200 (All Formats, except Third
Party)
Number of Corner Feature Side
Dimension?
Find Spots Spot Format Third Party
Use the Nominal Diameter from the
Grid Template
Spot Deviation Limit 1.50
Hidden if Array Format is set to
Automatically Determine.
20 (All Formats, except Third Party)
True
Feature Extraction Reference Guide 45
Page 46

1 Default Protocol Settings
GE2-NonAT_1100_Jul11
Table 6 Default settings for GE2-NonAT_1100_Jul11 protocol (continued)
Protocol step Parameter Default Setting/Value (v12.2)
Calculation of Spot Statistics
Method
Cookie Percentage 1.000
Exclusion Zone Percentage 1.200
Auto Estimate the Local Radius True
LocalBGRadius 127, if False
Pixel Outlier Rejection Method Inter Quartile Region
RejectIQRFeat 1.42
RejectIQRBG 1.42
Statistical Method for Spot Values from Pixels Use Mean/Standard Deviation
Flag Outliers Compute Population Outliers True
Minimum Population 15
IQRatio 1.42
Background IQRatio 1.42
Use Qtest for Small Populations? True
Report Population Outliers as Failed
in MAGEML file
Use Cookie
False
Compute Non Uniform Outliers True
Automatically Compute OL Polynomial Terms False
Feature – (%CV)^2 0.11000
Poissonian Noise Term 320
Background Term 600
Background – (%CV)^2 0.09000
Poissonian Noise Term 320
Background Term 600
46 Feature Extraction Reference Guide
Page 47

Default Protocol Settings 1
GE2-NonAT_1100_Jul11
Table 6 Default settings for GE2-NonAT_1100_Jul11 protocol (continued)
Protocol step Parameter Default Setting/Value (v12.2)
Compute Bkgd, Bias and
Error
Background Subtraction Method Local Background
Significance (for IsPosAndSignif and IsWellAboveBG) Use Pixel Statistics for Significance
2-sided t-test of feature vs.
background max p-value
WellAboveMulti 2.6
Signal Correction—Calculate Surface Fit (required for
Spatial Detrend)
Feature Set for Surface Fit AllFeatureTypes
Perform Filtering for Surface Fit True
Perform Spatial Detrending False
Signal Correction—Adjust Background Globally True
Adjust Background Globally to: 0
Robust Neg Ctrl Stats? False
Choose universal error, or most conservative Most Conservative
MultErrorGreen 0.0900
MultErrorRed 0.0900
Auto Estimate Add Error Red False
0.01
True
Additive Error Value Red 30
Auto Estimate Add Error Green False
Additive Error Value Green 30
Use Surrogates True
Correct Dye Biases Use Dye Norm List Automatically Determine
Dye Normalization Probe Selection Method Use Rank Consistent Probes
Rank Tolerance 0.050
Variable Rank Tolerance False
Feature Extraction Reference Guide 47
Page 48

1 Default Protocol Settings
GE2-NonAT_1100_Jul11
Table 6 Default settings for GE2-NonAT_1100_Jul11 protocol (continued)
Protocol step Parameter Default Setting/Value (v12.2)
Omit Background Population Outliers False
Allow Positive and Negative Controls False
Signal Characteristics OnlyPositiveAndSignificantSignals
Normalization Correction Method Lowess Only
Max Number Ranked Probes 8000
Compute Ratios Peg Log Ratio Value 4.00
Calculate Metrics Spikein Target Used False
Min Population for Replicate Stats? 5
PValue for Differential Expression 0.010000
Percentile Value 75.00
Generate Results Generate Single Text File True
JPEG Down Sample Factor 4
48 Feature Extraction Reference Guide
Page 49

Default Protocol Settings 1
miRNA_1200_Jun14
miRNA_1200_Jun14
This protocol is a miRNA protocol for use with miRNA
Microarray System with miRNA Complete Labeling and
Hyb Kit (lab protocol v2.0 or higher, publication number
G4170- 90011).
Table 7 Default settings for miRNA_1200_Jun14 protocol
Protocol step Parameter Default Setting/Value (v12.2)
Place Grid Array Format For any format automatically
determined or selected by you, the
software uses the default
Placement Method.
Parameters that apply only to
specific formats appear only if that
format is selected.
Placement Method Hidden if Array Format is set to
Enable Background Peak Shifting Hidden if Array Format is set to
Use central part of pack for slope
and skew calculation?
Use the correlation method to
obtain origin X of subgrids
Automatically Determine
[Recognized formats: Single
Density (11k, 22k), 25k, Double
Density (44k), 95k, 185k, 185k 10
uM, 65-micron feature size (also
with 10-micron scans), 30-micron
feature size (single pack and multi
pack) and Third Party]
Automatically Determine.
Allow Some Distortion (All formats)
Automatically Determine.
Set to false for all arrays except 30
microns (single pack and multi
pack), for which it is set to true.
Hidden if Array Format is set to
Automatically Determine.
Set to False for all arrays except 30
microns single pack and multi pack,
for which it is set to True.
Hidden if Array Format is set to
Automatically Determine.
Set to False for all arrays except 30
microns single pack and multi pack,
for which it is set to True.
Feature Extraction Reference Guide 49
Page 50

1 Default Protocol Settings
miRNA_1200_Jun14
Table 7 Default settings for miRNA_1200_Jun14 protocol (continued)
Protocol step Parameter Default Setting/Value (v12.2)
Use Enhanced
Gridding
Optimize Grid Fit Grid Format The parameters and values for
An enhanced automatic gridding
algorithm was released in Feature
Extraction 12.1 for use in CGH
protocols only. Agilent has not
validated the new algorithm in
miRNA protocols.
optimizing the grid differ depending
on the format.
Iteratively Adjust Corners? Hidden if Array Format is set to
Adjustment Threshold Hidden if Array Format is set to
Maximum Number of Iterations Hidden if Array Format is set to
False
Automatically Determine
[Recognized formats: 65-micron
feature size, 30-micron feature size,
and Third Party]
Automatically Determine.
True (All Formats, except Third
Party)
False (Third Party)
Automatically Determine.
0.300 (All Formats, except Third
Party)
Automatically Determine.
5 (All Formats, except Third Party)
Found Spot Threshold Hidden if Array Format is set to
Automatically Determine.
0.200 (All Formats, except Third
Party)
Number of Corner Feature Side
Dimension?
Find Spots Spot Format Depending on the format selected
by the software or by you, the
default settings for this step
change. See the following rows for
the default values for finding spots.
Hidden if Array Format is set to
Automatically Determine.
20 (All Formats, except Third Party)
Automatically Determine
[Recognized formats: same as
those listed above except 244k
10uM replaces 65-micron feature
size 10-micron scans]
50 Feature Extraction Reference Guide
Page 51

Default Protocol Settings 1
miRNA_1200_Jun14
Table 7 Default settings for miRNA_1200_Jun14 protocol (continued)
Protocol step Parameter Default Setting/Value (v12.2)
Use the Nominal Diameter from the
Grid Template
Spot Deviation Limit Hidden if Array Format is set to
Calculation of Spot Statistics
Method
Cookie Percentage Hidden if Array Format is set to
Exclusion Zone Percentage Hidden if Array Format is set to
Hidden if Array Format is set to
Automatically Determine.
True (All Formats)
Automatically Determine.
8.0 for all formats except for third
party, for which it is set to 1.5
Hidden if Array Format is set to
Automatically Determine.
Use Cookie (All Formats)
Automatically Determine.
0.650 (Single Density, 25k)
0.561 (Double Density, 95k)
0.700 (185k, 185k 10 uM, 244k 10
uM, 65-micron feature size)
0.750 (30-micron feature size)
Automatically Determine.
1.200 (All Formats except 30-micron
feature size)
1.300 (30-micron feature size)
Auto Estimate the Local Radius Hidden if Array Format is set to
Automatically Determine.
True (Single Density, Double
Density, 25k, 95k)
False (185k, 185k 10uM, 65-micron
feature size, 30-micron feature size,
244k 10uM)
Feature Extraction Reference Guide 51
Page 52

1 Default Protocol Settings
miRNA_1200_Jun14
Table 7 Default settings for miRNA_1200_Jun14 protocol (continued)
Protocol step Parameter Default Setting/Value (v12.2)
LocalBGRadius Hidden if Array Format is set to
Automatically Determine.
100 (when False for 185k, 185k
10uM, 65-micron feature size, 244k
10 uM)
150 (when False for 30-micron
feature size)
Pixel Outlier Rejection Method Inter Quartile Region
(Automatically Determine and All
Formats)
RejectIQRFeat 1.42 (All Formats)
RejectIQRBG 1.42 (All Formats)
Statistical Method for Spot Values from Pixels Use Mean/Standard Deviation
(Automatically Determine and All
Formats)
Flag Outliers Compute Population Outliers True
Minimum Population 8
IQRatio 1.42
Background IQRatio 5.00
Use Qtest for Small Populations? True
Report Population Outliers as Failed
in MAGEML file
Compute Non Uniform Outliers True
Scanner The values for the parameters
change depending on the scanner
used for the image. See the
following for differences.
Agilent scanner
Automatically Compute OL Polynomial Terms Hidden if Array Format is set to
False
Automatically Determine
Automatically Determine.
True
52 Feature Extraction Reference Guide
Page 53

Default Protocol Settings 1
miRNA_1200_Jun14
Table 7 Default settings for miRNA_1200_Jun14 protocol (continued)
Protocol step Parameter Default Setting/Value (v12.2)
Feature – (%CV)^2 0.04000
Compute Bkgd, Bias and
Error
Red Poissonian Noise Term
Multiplier
Red Signal Constant Term
Multiplier
Green Poissonian Noise Term
Multiplier
Green Signal Constant Term
Multiplier
Background – (%CV)^2 0.09000
Red Poissonian Noise Term
Multiplier
Red Background Constant Term
Multiplier
Green Poissonian Noise Term
Multiplier
Green Background Constant Term
Multiplier
Background Subtraction Method No Background Subtraction
Significance (for IsPosAndSignif and IsWellAboveBG) Use Error Model for Significance
20
1
20
1
3
1
3
1
2-sided t-test of feature vs.
background max p-value
WellAboveMulti 13
Background Method by Format 244
Min Feature Threshold for Metrics 2000
Calculate Surface Fit (required for
Spatial Detrend)
Feature Set for Surface Fit FeaturesInNegativeControlRange
0.01
True
Feature Extraction Reference Guide 53
Page 54

1 Default Protocol Settings
miRNA_1200_Jun14
Table 7 Default settings for miRNA_1200_Jun14 protocol (continued)
Protocol step Parameter Default Setting/Value (v12.2)
Perform Filtering for Surface Fit True
Perform Spatial Detrending True
Adjust Background Globally False
Perform Multiplicative Detrending False
Robust Neg Ctrl Stats? True
Choose universal error, or most conservative Use Universal Error Model
MultErrorGreen 0.1000
MultErrorRed 0.1000
Auto Estimate Add Error Red True
Auto Estimate Add Error Green True
Use Surrogates False
microRNA Analysis Output GeneView File True
Analyze By Effective Feat size True
Maximum Number of Features 10000
Minimum Number of Ratios 200
Low Signal Percentile 50.00
Is Gene Detected Multiplier 3.0
High Signal Percentile 90.00
Minimum Noise Multiplier 10.00
Throw away ratios greater than 1.50
Is Probe Detected
Multiplier
Exclude non
detected probes
Default Total Gene Signal if all
probes are not detected
3.0
True
0.10
54 Feature Extraction Reference Guide
Page 55

Default Protocol Settings 1
miRNA_1200_Jun14
Table 7 Default settings for miRNA_1200_Jun14 protocol (continued)
Protocol step Parameter Default Setting/Value (v12.2)
Set the Total Gene Signal to the
Total Gene Error
Feature Size Fraction by Array Type Automatically Determine
Calculate Metrics Spikein Target Used True
Min Population for Replicate Stats? 5
Grid Test Format Automatically Determine
Minimum
percentage of
features needed to
be found
PValue for Differential Expression 0.010000
Percentile Value 75.00
Generate Results Type of QC Report miRNA
Generate Single Text File True
JPEG Down Sample Factor 4
False
Low Density 8-pack OR
High-Density 8-pack
Recognized formats: 60 micron and
30 micron feature size, third party
1.99 for 30 micron and 65 micron
feature size
Feature Extraction Reference Guide 55
Page 56

1 Default Protocol Settings
Differences in Protocol Settings Based on Each Step
Differences in Protocol Settings Based on Each Step
Some of the default settings are the same for all the
protocols; yet, many are different, depending on the protocol
step.
Table 8 shows each protocol step and where you can find
information on the default settings for that step.
Table 8 Location of protocol template default settings for each step
Protocol step Location of default settings
Place Grid
Optimize Grid Fit
Find Spots
Flag Outliers
Compute Bkgd, Bias and
Error
Correct Dye Biases
Compute Ratios
Calculate Metrics
Generate Results
page 57
page 58
page 59
page 60
page 62
page 65
page 66
page 66
page 66
56 Feature Extraction Reference Guide
Page 57

Default Protocol Settings 1
Place Grid
Place Grid
The parameters and values differ depending on the selected
microarray format.
Table 9 Place Grid – Default values in common and differences for grid formats
Parameter Default values Formats using Default Value
Array Format Automatically Determine Single Density (11k, 22k),
Double Density (44k), 95k,
185k, 65-micron feature size,
30-micron feature size single
pack, 30-micron feature size
multi pack, 185k, 10uM,
65-micron feature size
10-micron scans, 25k, Third
Party
Placement Method Allow some distortion All
Enable background peak
shifting?
Use central part of pack for
slope and skew calculation?
Use the correlation method
to obtain origin X of
subgrids
False All except 30-micron feature
size single pack and
30-micron feature size multi
pack
False All except 30-micron feature
size single pack and
30-micron feature size multi
pack
False All except 30-micron feature
size single pack and
30-micron feature size multi
pack
Feature Extraction Reference Guide 57
Page 58

1 Default Protocol Settings
Optimize Grid fit
Optimize Grid fit
The parameters and values differ depending on the
microarray format.
Table 10 Optimize Grid fit – Default values in common and differences for grid formats
Parameter Default values Formats using Default
Value
Iteratively Adjust Corners? True
False
Adjustment Threshold 0.300 (Not applicable for Third Party) 65-micron feature size
Maximum Number of Iterations 5 (Not applicable for Third Party) 65-micron feature size
Found Spots Threshold 0.200 (Not applicable for Third Party) 65-micron feature size
Number of Corner Features Side
Dimension?
20 (Not applicable for Third Party) 65-micron feature size
65-micron feature size
30-micron feature size
Third Party
30-micron feature size
30-micron feature size
30-micron feature size
30-micron feature size
58 Feature Extraction Reference Guide
Page 59

Default Protocol Settings 1
Find spots
Find spots
The parameters and values differ depending on the
microarray format.
Table 11 Find spots – Default values in common and differences for spot formats
Parameter Default values Formats using Default
Value
Use the Nominal Diameter from the Grid Template True All
Spot Deviation Limit 8.0 All except third party,
where it is set to 1.5
Calculation of Spot Statistics Method Use Cookie All
Cookie Percentage 0.650 SD, 25k, TP
0.561 DD, 95k
0.700 185k, 185k 10uM,
65-micron feature size
0.750 30-micron feature size
Exclusion Zone Percentage 1.200 All
1.300 30-micron feature size
Auto Estimate the Local Radius True All
LocalBGRadius When False is the default, 100 185k, 185k 10uM,
65-micron feature size
When False is the default, 150 30-micron feature size
Pixel Outlier Rejection Method Inter Quartile Region All
RejectIQRFeat 1.42 All
RejectIQRBG 1.42 All
Statistical Method for Spot Values from Pixels Use Mean/Standard Deviation All
Feature Extraction Reference Guide 59
Page 60

1 Default Protocol Settings
Flag outliers
Flag outliers
These parameters and values differ depending on the
scanner used for the image, the microarray type, and the lab
protocol.
Table 12 Flag Outliers – Default values in common and differences for protocols
Parameter Default values Protocols using Default Value
Compute Population Outliers True All
Minimum Population 10 All except GE2-NonAT, ChIP, and
miRNA
15 GE2-NonAT
8ChIP and miRNA
IQRatio 1.42 All
Background IQRatio 1.42 All except miRNA
5.00 miRNA
Use Qtest for Small Populations? True All
Report Population Outliers as
Failed in MAGEML file
Compute Non Uniform Outliers True All
Agilent scanner
Automatically Compute OL Polynomial Terms True All except GE2-NonAT
Feature – (%CV)^2 0.04000 All except GE2-NonAT
Red Poissonian Noise Term
Multiplier
Red Signal Constant Term
Multiplier
Green Poissonian Noise Term
Multiplier
False All
30 GE2
20 miRNA
5CGH, ChIP
1All except GE2-NonAT
20 GE1, GE2, miRNA
60 Feature Extraction Reference Guide
Page 61

Default Protocol Settings 1
Flag outliers
Table 12 Flag Outliers – Default values in common and differences for protocols (continued)
Parameter Default values Protocols using Default Value
5CGH, ChIP
Green Signal Constant Term
Multiplier
Background – (%CV)^2 0.09000 All except GE2-NonAT
Red Poissonian Noise Term
Multiplier
Red Signal Constant Term
Multiplier
Green Poissonian Noise Term
Multiplier
Green Background Constant
Term Multiplier
Automatically Compute OL Polynomial Terms False GE2-NonAT
Feature – (%CV)^2 0.11000
Poissonian Noise Term 320 (R, G combined)
Background Term 600 (R, G combined)
Background – (%CV)^2 0.09000
Poissonian Noise Term 320 (R, G combined)
Background Term 600 (R, G combined)
1All except GE2-NonAT
3 All except GE1, GE2-NonAT
1 All except GE1, GE2-NonAT
3All except GE2-NonAT
1All except GE2-NonAT
Feature Extraction Reference Guide 61
Page 62

1 Default Protocol Settings
Compute Bkgd, Bias and Error
Compute Bkgd, Bias and Error
These parameters and values differ depending on the
microarray type and the lab protocol.
Table 13 Compute Bkgd, Bias and Error – Default values in common and differences for protocols
Parameter Default values Protocols using Default
Value
Background Subtraction Method No Background Subtraction All except for GE2-NonAT
Local Background GE2-NonAT
Significance Use Error Model for Significance All except GE2-NonAT
Use Pixel Statistics for Significance GE2-NonAT
2-sided t-test of feature vs.
background max p-value
WellAboveMulti 13 All except for GE2-NonAT
Background Method by Format 244 miRNA only
Minimum Feature Threshold for
Metrics
Signal Correction—Calculate Surface Fit (required for
Spatial Detrend)
Feature Set for Surface Fit FeaturesInNegativeControlRange GE1, GE2, miRNA
Perform Filtering for Surface Fit False CGH, ChIP
Perform Spatial Detrending True All except GE2-NonAT
0.01 All
2.6 GE2-NonAT
2000 miRNA only
True All
AllFeatureTypes GE2-NonAT
Only NegativeControl
Features
True GE1, GE2, GE2-NonAT,
False GE2-NonAT
CGH, ChIP
miRNA
62 Feature Extraction Reference Guide
Page 63

Default Protocol Settings 1
Compute Bkgd, Bias and Error
Table 13 Compute Bkgd, Bias and Error – Default values in common and differences for protocols (continued)
Parameter Default values Protocols using Default
Value
Signal Correction—Adjust Background Globally False All except for GE2-NonAT
which is set to True.
Signal Correction—Perform Multiplicative Detrending
(not applicable for GE2-NonAT)
Detrend on Replicates Only False CGH, ChIP
Filter Low signal probes from Fit? True GE1, GE2, CGH, ChIP
Neg. Ctrl. Threshold Mult.
Detrend Factor
Perform Filtering for Fit Use Window Average GE1, GE2, CGH, ChIP
Use polynomial data fit instead
of LOESS?
Polynomial Multiplicative
DetrendDegree
Robust Neg Ctrl Stats? False GE1, GE2, GE2-NonAT
Choose universal error, or most conservative Most Conservative All except for miRNA
True GE1, GE2, CGH, ChIP
False miRNA
True GE1, GE2
3CGH, ChIP
5GE1, GE2
True GE1, CGH, ChIP
4 GE1, CGH, ChIP
True CGH, ChIP, miRNA
Use Universal Error Model miRNA
MultErrorGreen 0.1000 All except for GE2-NonAT
.0900 GE2-NonAT
MultErrorRed 0.1000 All except GE1 protocol and
GE2-NonAT
.0900 GE2-NonAT
Auto Estimate Add Error Red True All except GE1 protocol and
GE2-NonAT
Feature Extraction Reference Guide 63
Page 64

1 Default Protocol Settings
Compute Bkgd, Bias and Error
Table 13 Compute Bkgd, Bias and Error – Default values in common and differences for protocols (continued)
Parameter Default values Protocols using Default
Value
False (Additive Error Value Red-30) GE2-NonAT
Auto Estimate Add Error Green True All except for GE2-NonAT
False (Additive Error Value
Green-30)
Use Surrogates True All except for miRNA
False miRNA
GE2-NonAT
64 Feature Extraction Reference Guide
Page 65

Default Protocol Settings 1
Correct Dye Biases
Correct Dye Biases
These parameters and values differ depending on the
microarray type. The GE1 protocol and the miRNA
protocol do not correct for dye biases.
Table 14 Correct Dye Biases – Default values in common and differences for protocols
Parameter Default values Protocols using default
values (NA for GE1 and
miRNA protocols)
Use Dye Norm List Automatically Determine All
Dye Normalization Probe Selection Method Use Rank Consistent Probes All
Rank Tolerance 0.050 All
Variable Rank Tolerance False All
Omit Background Population Outliers False All
Allow Positive and Negative Controls False All
Signal Characteristics OnlyPositiveAndSignificantSignals All
Normalization Correction Method Linear and Lowess GE2
Linear CGH, ChIP
Lowess Only GE2-NonAT
Max Number Ranked Probes -1 All except for GE2
8000 GE2
Feature Extraction Reference Guide 65
Page 66

1 Default Protocol Settings
Compute ratios, calculate metrics, and generate results
Compute ratios, calculate metrics, and generate results
Some of these parameters and values are the same for all
the protocols, others vary, and still others do not even use a
protocol step.
Table 15 Values in common and differences in protocols
Protocol step Parameter Default Value (v12.2)
Compute Ratios Peg Log Ratio Value 4.00 (Not applicable for GE1 and
miRNA)
Calculate Metrics Spikein Target Used? True (GE1, GE2, miRNA)
False (CGH, ChIP, GE2-NonAT)
Min Population for Replicate Statistics 5 (3 for CGH and ChIP)
Grid Test Format Automatically Determine (Not
applicable for GE2-NonAT)
PValue for Differential Expression 0.010000 (All)
Percentile Value 75.00 (All)
Generate Results Type of QC Report Gene Expression for GE1 or GE2,
Streamlined CGH for CGH,
CGH_ChIP for ChIP, miRNA for
miRNA
Generate Results Generate Single Text File True (All)
JPEG Down Sample Factor 4 (All)
66 Feature Extraction Reference Guide
Page 67

Agilent Feature Extraction 12.2
Reference Guide
2
QC Report Results
QC Reports 68
QC Report Headers 87
Feature Statistics 90
Histogram of LogRatio plot 103
QC Report Results in the FEPARAMS and Stats Tables 121
QC Metric Set Results 122
QC reports include statistical results to help you evaluate
the reproducibility and reliability of your single microarray
data. This chapter describes each of five types of QC report
– 2- color Gene Expression, 1- color Gene Expression,
Streamlined CGH, CGH_ChIP, and microRNA (miRNA) – and
how each can help you interpret the performance of your
microarray system. Use plots and statistics from the report
to:
• Set up your own run charts of statistical values versus
time or experiment number to track performance of one
microarray compared to other microarrays
• Monitor upstream lab protocols, such as performance of
your hybridization/washing steps
• Monitor the effect of changing Feature Extraction protocol
parameters on the performance of your data analysis
If you incorporate a set of QC metrics in your extraction,
those results appear on the final page of the QC report as
an Evaluation Table.
Agilent Technologies
67
Page 68

2 QC Report Results
NOTE
QC Reports
QC Reports
This section contains example QC Reports, and points out
the different sections that appear on the reports.
The reports in this section are examples. The actual contents of the
reports vary, depending on the protocol settings and QC metric set used.
68 Feature Extraction Reference Guide
Page 69

2-color Gene Expression QC Report
1“QC Report Headers” on
page 87
2 “Spot finding of Four
Corners” on page 90
3 “Outlier Stats” on
page 91
6 “Plot of
Background-Corrected
Signals” on page 95
4 “Spatial Distribution of
All Outliers” on page 91
5 “Net Signal
Statistics” on page 93
1
2
3
4
5
6
This module shows you the organization of the 2-color gene
expression QC report. See the following figure and the
figures on the next pages for links to information on the QC
Report regions.
QC Report Results 2
2-color Gene Expression QC Report
Figure 1 2-color Gene Expression QC Report with Spike-ins (p1)
Feature Extraction Reference Guide 69
Page 70

2 QC Report Results
10 “Foreground Surface
Fit” on page 97
12 “Reproducibility Statistics
(%CV Replicated Probes)” on
page 104
13 “Microarray Uniformity
(2-color only)” on page 106
14 “Sensitivity” on page 107
8 “Spatial Distribution of
Significantly Up-Regulated
and Down-Regulated
Features (Positive and
Negative Log Ratios)” on
page 100
11 “Plot of LogRatio vs. Log
ProcessedSignal” on
page 101
7 “Negative Control Stats” on
page 94
15 “Reproducibility plot for
2-color gene expression
(spike-in probes)” on
9 “Local Background
Inliers” on page 97
7
10
9
11
8
13
14
12
15
2-color Gene Expression QC Report
70 Feature Extraction Reference Guide
Figure 2 2-color Gene Expression QC Report with Spike-ins (p2)
Page 71

17
16
18
16 “2-color gene expression
spike-in signal statistics” on
page 111
17 “Spike-in Linearity Check
for 2-color Gene
Expression” on page 113
18 “QC Metric Set
Results” on page 122
QC Report Results 2
2-color Gene Expression QC Report
Figure 3 2-color Gene Expression QC Report with Spike-ins (p3)
Feature Extraction Reference Guide 71
Page 72

2 QC Report Results
1“QC Report Headers” on
page 87
2 “Spot finding of Four
Corners” on page 90
3 “Outlier Stats” on page 91
1
2
4
3
4 “Spatial Distribution of All
Outliers” on page 91
5 “Net Signal Statistics” on
page 93
5
6 “Histogram of Signals Plot
(1-color GE or CGH)” on
page 96
6
1-color Gene Expression QC Report
1-color Gene Expression QC Report
This module shows you the organization of the 1-color gene
expression QC report. See the following figure and the
figures on the next pages for links to information on each of
the QC Report regions.
Figure 4 1-color Gene Expression QC Report with Spike-ins (p1)
72 Feature Extraction Reference Guide
Page 73

QC Report Results 2
8 “Local Background
Inliers” on page 97
11 “Reproducibility Statistics
(%CV Replicated Probes)” on
page 104
10“Multiplicative Surface
Fit” on page 99
12 “1-color gene expression
spike-in signal statistics” on
page 112
9 “Foreground Surface Fit” on
page 97
13 “Spatial Distribution of
Median Signals for each Row
and Column” on page 102
7 “Negative Control Stats” on
page 94
7
8
9
10
11
12
13
1-color Gene Expression QC Report
Figure 5 1-color Gene Expression QC Report with Spike-ins (p2)
Feature Extraction Reference Guide 73
Page 74

2 QC Report Results
14 “Reproducibility plot for
1-color gene expression
(spike-in probes)” on
page 109
15 “Spike-in Linearity Check
for 1-color Gene
Expression” on page 114
15
14
16 “QC Metric Set
Results” on page 122
17 “Table of Values for
Concentration-Response Plot
(1-color only)” on page 115
16
17
1-color Gene Expression QC Report
Figure 6 1-color Gene Expression QC Report with Spike-ins (p3)
74 Feature Extraction Reference Guide
Page 75

Streamlined CGH QC Report
1 “QC Report Headers” on
page 87
2 “Spot finding of Four
Corners” on page 90
3 “Spatial Distribution of All
Outliers” on page 91
4“QC reports with metric sets
added” on page 83
5 “Histogram of Signals Plot
(1-color GE or CGH)” on
page 96
1
2
3
4
5
6
6 “Outlier Stats” on page 91
The streamlined CGH QC report provides QC metrics that
are relevant to CGH application. All log plots use log base 2
(not 10).
QC Report Results 2
Streamlined CGH QC Report
Feature Extraction Reference Guide 75
Figure 7 Streamlined CGH QC Report (p1)
Page 76

2 QC Report Results
8 “Plot of
Background-Corrected
Signals” on page 95
8
7“Spatial Distribution of
Significantly Up-Regulated
and Down-Regulated
Features (Positive and
Negative Log Ratios)” on
page 100
7
Streamlined CGH QC Report
76 Feature Extraction Reference Guide
Figure 8 Streamlined CGH QC Report (p2)
Page 77
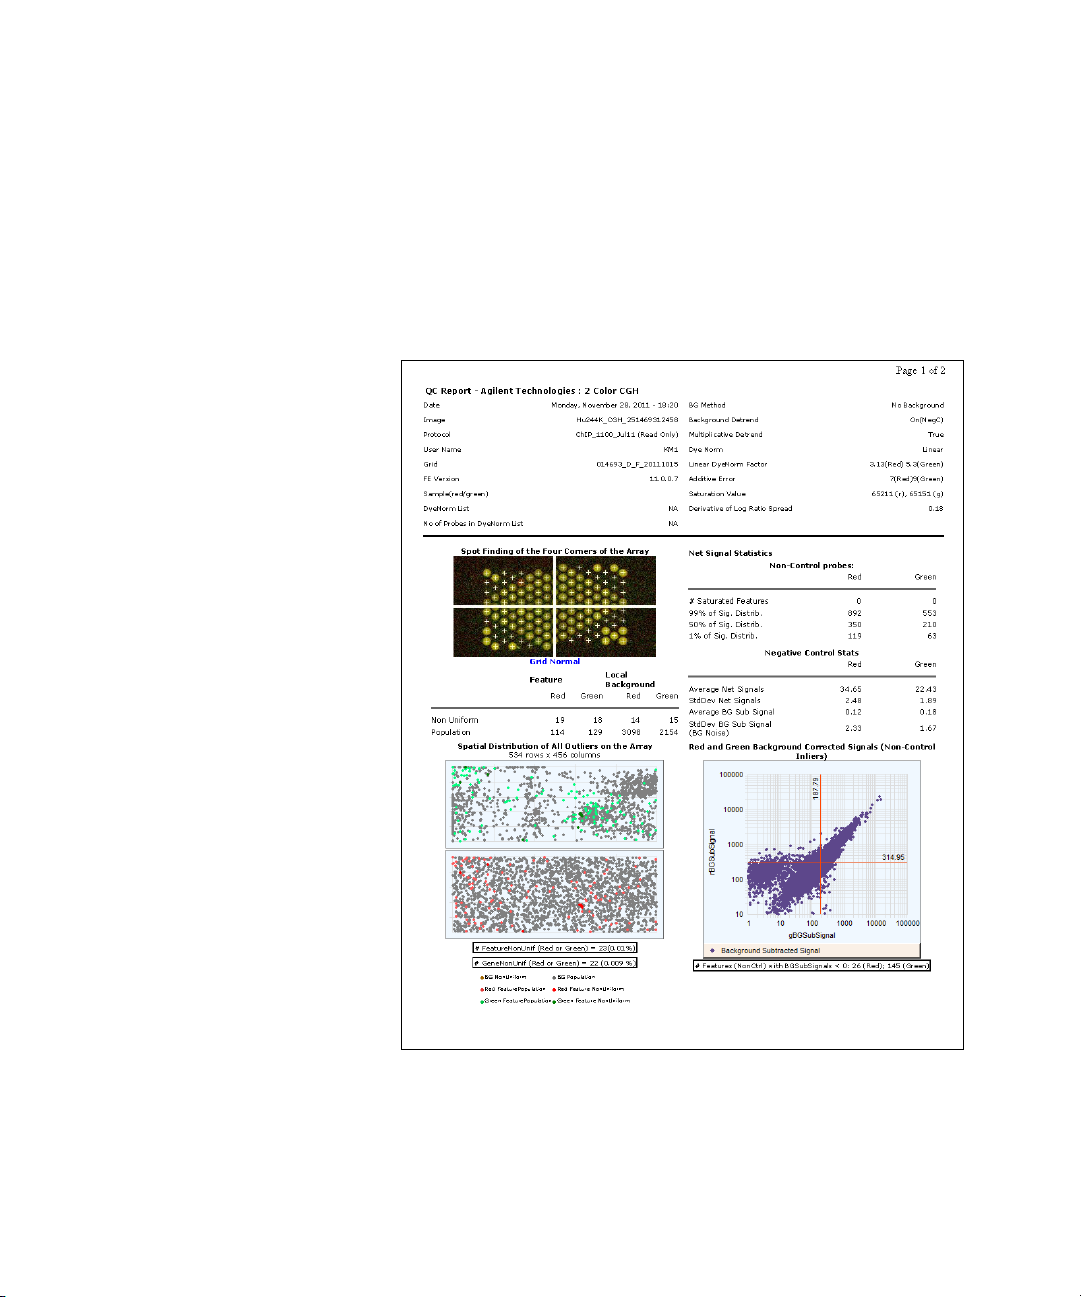
CGH_ChIP QC Report
1“QC Report Headers” on
page 87
2 “Spot finding of Four
Corners” on page 90
3 “Outlier Stats” on page 91
4 “Spatial Distribution of All
Outliers” on page 91
7 “Plot of
Background-Corrected
Signals” on page 95
5 “Net Signal Statistics” on
page 93
6 “Negative Control Stats” on
page 94
1
2
3
5
6
47
This report lists all of the same information as the 2- color
Gene Expression report but removes the Array Uniformity
table and spike- ins and has a Histogram of LogRatio plot.
All log plots use log base 2 (not 10).
QC Report Results 2
CGH_ChIP QC Report
Feature Extraction Reference Guide 77
Figure 9 CGH_ChIP QC Report (p1)
Page 78

2 QC Report Results
11 “Spatial Distribution of
Significantly Up-Regulated
and Down-Regulated
Features (Positive and
Negative Log Ratios)” on
page 100
12 “QC reports with metric
sets added” on page 83
9 “Foreground Surface
Fit” on page 97
8 “Local Background
Inliers” on page 97
10 “Reproducibility Statistics
(%CV Replicated Probes)” on
page 104
13 “Plot of LogRatio vs. Log
ProcessedSignal” on
page 101
14 “Histogram of LogR atio
plot” on page 103
9
10
12
13
11
8
14
CGH_ChIP QC Report
78 Feature Extraction Reference Guide
Figure 10 CGH_ChIP QC Report (p2)
Page 79

MicroRNA (miRNA) QC Report
1 “QC Report Headers” on
page 87
2 “Spot finding of Four
Corners” on page 90
3 “Outlier Stats” on page 91
4 “Spatial Distribution of All
Outliers” on page 91
5 “Net Signal Statistics” on
page 93
7 “Histogram of Signals Plot
(1-color GE or CGH)” on
page 96
6 “Negative Control Stats” on
page 94
5
2
3
4
7
1
6
QC Report Results 2
MicroRNA (miRNA) QC Report
Agilent miRNA microarrays are
currently in development. Check
the Agilent website for the latest
information.
This module shows you the organization of the 1- color
miRNA QC report. See the following figure and the figures
on the next pages for links to information on each of the QC
Report regions.
Feature Extraction Reference Guide 79
Figure 11 MicroRNA (miRNA) QC Report (p1)
Page 80

2 QC Report Results
9 “Reproducibility Statistics
(%CV Replicated Probes)” on
page 104
8
10
12
8 “Foreground Surface Fit” on
page 97
11 “QC reports with metric
sets added” on page 83
10 “Reproducibility plot for
miRNA (non-control
probes)” on page 110
12 “Spatial Distribution of
Median Signals for each Row
and Column” on page 102
9
11
MicroRNA (miRNA) QC Report
Figure 12 MicroRNA (miRNA) QC Report (p2)
80 Feature Extraction Reference Guide
Page 81

1 “QC Report Headers” on
page 87
2 “Spot finding of Four
Corners” on page 90
3 “Outlier Stats” on
page 91
4 “Spatial Distribution of
All Outliers” on page 91
7 “Plot of
Background-Corrected
Signals” on page 95
5 “Net Signal
Statistics” on page 93
6 “Negative Control
Stats” on page 94
2
3
6
4
5
7
1
QC Report Results 2
Non-Agilent GE2 QC Report
Non-Agilent GE2 QC Report
This report lists all of the same information as the 2- color
gene expression QC report but with no spike- ins.
Feature Extraction Reference Guide 81
Figure 13 Non-Agilent GE2 QC Report (p1)
Page 82

2 QC Report Results
12 “Spatial Distribution of
Significantly Up-Regulated
and Down-Regulated
Features (Positive and
Negative Log Ratios)” on
page 100
13 “Plot of LogRatio vs. Log
ProcessedSignal” on
page 101
9 “Foreground Surface
Fit” on page 97
8 “Local Background
Inliers” on page 97
10 “Reproducibility Statistics
(%CV Replicated
Probes)” on page 104
11 “Microarray Uniformity
(2-color only)” on page 106
8
12
13
9
10
11
Non-Agilent GE2 QC Report
82 Feature Extraction Reference Guide
Figure 14 Non-Agilent GE2 QC Report (p2)
Page 83

QC reports with metric sets added
When metric sets are associated to the protocols, QC reports
are generated with an additional set of evaluation metrics.
Depending on the microarray types, some QC metric sets
come with thresholds (denoted by QCMT) and some without
thresholds (denoted by QCM).
If thresholds are included in the metric set, the evaluation
tables in the QC report show metrics that are within
threshold ranges or that have exceeded those ranges.
Agilent has determined which of the FE Stats are good
metrics to follow the processing of Agilent arrays. Most of
the metrics chosen are useful to determine if there are
problems in the various laboratory steps (label,
hybridization, wash, scan steps). The new “IsGoodGrid”
metric tracks the automatic grid- finding of Feature
Extraction. By looking at numerous data run on our arrays,
using our wet- lab protocols, Agilent has found thresholds
that indicate if the data is in the expected range (“Good”) or
out of the expected range (“Evaluate”).
QC Report Results 2
QC reports with metric sets added
For some applications (CGH, miRNA), an extra threshold
level, “Excellent” is provided. More data has been screened
to allow setting the metric thresholds to tighter limits that
indicate excellent processing. For those applications that do
not have a full set of thresholds (for example, ChIP), or no
“Excellent” thresholds (for example, GE1 and GE2), the user
is assured that the data coming from the “Good” grade is
good to use. Excellent thresholds for those applications may
be provided in the future.
Feature Extraction Reference Guide 83
Page 84

2 QC Report Results
QC reports with metric sets added
QC metric set results--default protocol settings
Figure 15 is an example of part of a QC report — the header
and the Evaluation Metrics table — generated from a 2- color
gene expression extraction whose GE2 metric set with
thresholds had been added. In this extraction, the default
protocol settings were used. Note that all values for the
metrics are within the default threshold ranges.
Figure 15 Partial QC Report—Header and Evaluation Metrics with GE2
metric set with thresholds added—Default protocol settings
84 Feature Extraction Reference Guide
Page 85

QC Report Results 2
QC reports with metric sets added
QC metric set results—Spatial and Multiplicative Detrending Off
Figure 16 is an example of a QC report header and
Evaluation Metrics table generated from a 2- color gene
expression extraction whose GE2 metric set with thresholds
were added. In this extraction spatial and multiplicative
detrending were turned off. Note that not all values of the
metrics are within the default thresholds.
Figure 16 QC Report Header and Evaluation Metrics with GE2 metric
set with thresholds added—Detrending turned off
Feature Extraction Reference Guide 85
Page 86

2 QC Report Results
QC reports with metric sets added
QC metric set results—miRNA spike-in analysis
Figure 17 is an example of a QC report header and
Evaluation Metrics table generated from a 1- color extraction
whose miRNA metric set with thresholds had been added. In
this extraction, the default protocol settings were used. Note
that not all values of the metrics are within the default
thresholds. For details on how the miRNA spike- in statistics
and metrics are calculated, see “MicroRNA Analysis” on
page 285.
Figure 17 QC Report Header and Evaluation Metrics with miRNA metric
set with thresholds added - Default protocol settings
86 Feature Extraction Reference Guide
Page 87

QC Report Headers
2-color Gene Expression QC Report
Date Date and time that the QC Report was generated
Image Name of the TIFF file that was extracted
Protocol Name of the protocol used for the extraction
User Name Name of the user who set up the extraction
Grid Name of the grid template or grid file used
FE Version Version of the Feature Extraction software used
Sample (red/green) Names of Cy5- and Cy3-labeled samples
DyeNorm List Name of the dye normalization list
QC Report Results 2
QC Report Headers
The following Feature Extraction information is found in the
2- color gene expression QC Report header:
No of Probes in
DyeNorm List
BG Method Type of background subtraction method used
Background
Detrend
Multiplicative
Detrend
Dye Norm Type of dye normalization method used
Linear DyeNorm Factor Global dye normalization factor determined for the linear
Additive Error Additive portion of the error estimated in the Universal or
Feature Extraction Reference Guide 87
Number of probes in the designated dye normalization probe
list
If Spatial Detrend was turned on or off during the
extraction
If Multiplicative Detrend was turned on or off during the
extraction
portion of the correction method.
Most Conservative error model (if AutoEstimateAddError
was selected). Or, the values entered into the protocol, (if
AutoestimateAddError was not selected). Note that the
Page 88

2 QC Report Results
1-color Gene Expression QC Report
additive error that appears in the QC report header is the
Additive Error value selected in the protocol multiplied by
the linear dye norm factor.
Saturation
Value
The signal intensity value above which the signal is
considered saturated. This value only appears if it exceeds
about 65,500. If it appears, this means that this QC report is
from an XDR image file.
1-color Gene Expression QC Report
This report lists all of the same header information as the
2- color gene expression report, except for Dye Norm and
Linear DyeNorm Factor which are removed.
Streamlined CGH QC Report
The streamlined CGH QC report contains the same header
information as the 2- color gene expression QC report, except
for Linear DyeNorm Factor and Additive Error which are
removed. Also, the information from the two fields, “BG
Method” and “Background Detrend”, have been collapsed
into the one field, “BG Method”.
CGH_ChIP QC Report
All header information that appears in the 2- color gene
expression QC report are included in the CGH_ChIP report.
This report lists one additional metric, Derivative of Log
Ratio Spread in the header information.
Derivative of Log
Ratio Spread
88 Feature Extraction Reference Guide
Measures the standard deviation of the probe- to- probe
difference of the log ratios. This metric is used in CGH
experiments where differences in the log ratios are small on
average. A smaller standard deviation here indicates less
noise in the biological signals.
Page 89

QC Report Results 2
MicroRNA (miRNA) QC Report
MicroRNA (miRNA) QC Report
This header lists the same information as the 1- color gene
expression QC Report header. If the XDR function is turned
on, it also lists Saturation Values exceeding 65,500. Because
the dynamic range of the intensity for all miRNA microarray
spots on a microarray may exceed that of a normal scan
range, the miRNA analysis on some microarrays can benefit
with the XDR function turned on.
Non-Agilent 2-color gene expression QC Report
This header lists the same information as the 2- color gene
expression QC report header.
Feature Extraction Reference Guide 89
Page 90

2 QC Report Results
Feature Statistics
Feature Statistics
Spot finding of Four Corners
This section provides an explanation for each of the feature
statistics segments of the QC report and how these feature
statistics can help you assess the performance of your
microarray system.
By looking at the features in the four corners of the
microarray, you can decide if the spot centroids have been
located properly. If their locations are off- center in one or
more corners, you may have to run the extraction again with
a new grid.
Figure 18 QC Report—Spot Finding for Four Corners
90 Feature Extraction Reference Guide
Page 91
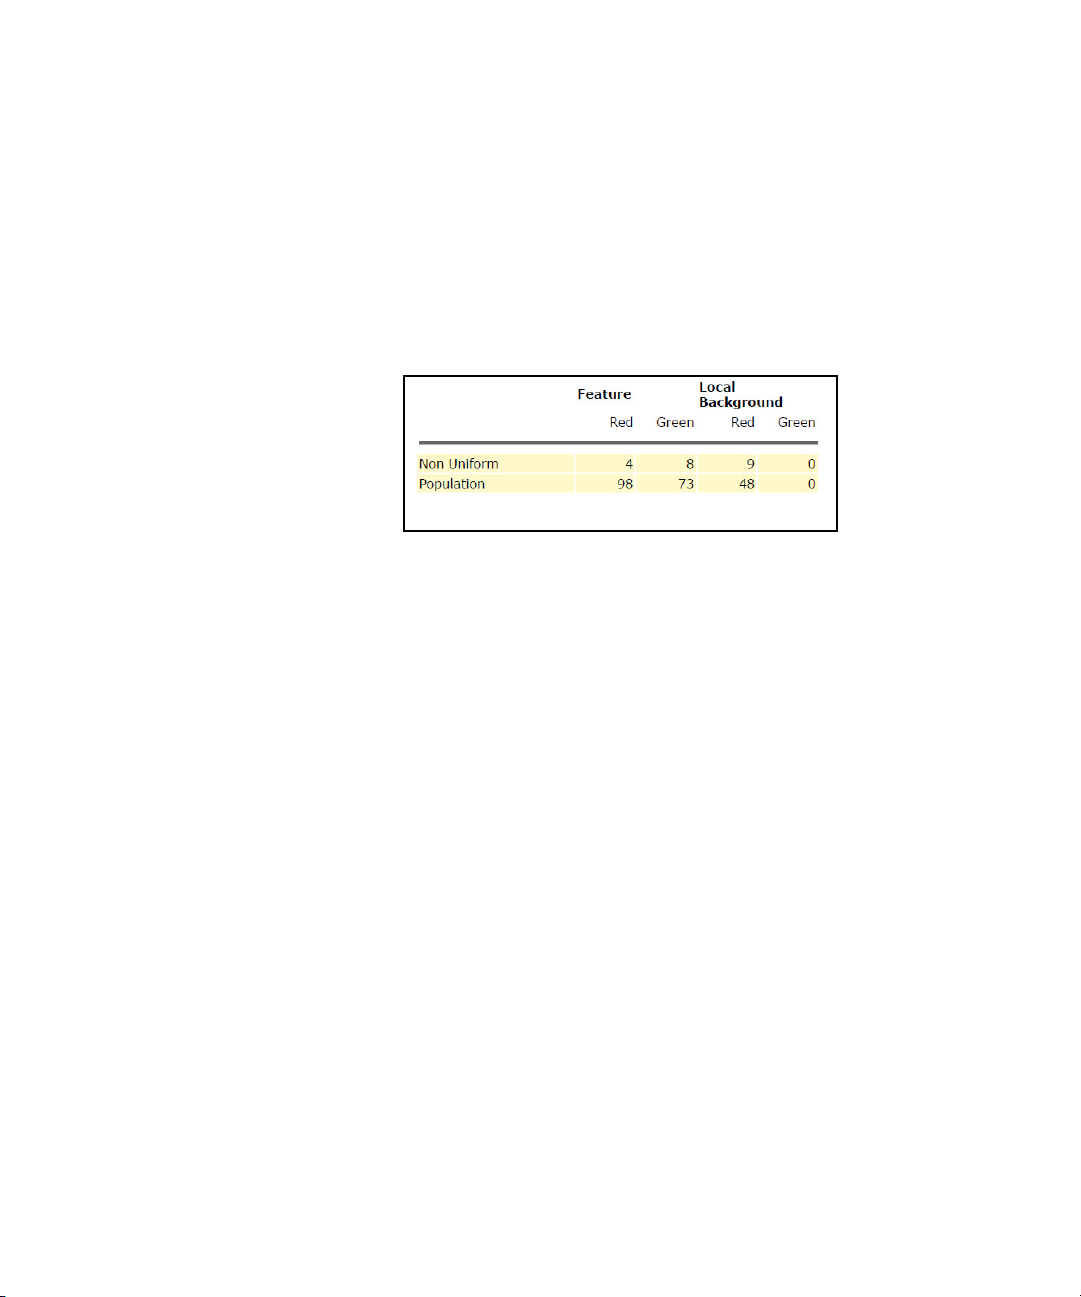
Outlier Stats
QC Report Results 2
Outlier Stats
If the QC Report shows a greater than expected number of
nonuniform or population outliers, check your
hybridization/wash step. Also, check the visual results (.shp
file) to see if the spot centroids are off- center. If the grid
was not placed correctly, a new grid is required.
Figure 19 QC Report—Outlier Stats
For 1- color reports, the number of outliers is reported for
the green channel only.
Spatial Distribution of All Outliers
The QC report shows two plots of all the outliers, both
population and nonuniformity outliers, whose positions are
distributed across the microarray. One plot is for the green
channel, and the other, for the red channel. SNP probes are
included.
To distinguish the background population and nonuniform
outliers from one another, look at the color coding at the
bottom of the two plots.
For the 1- color report, only the green plot is shown.
Feature Extraction Reference Guide 91
Page 92

2 QC Report Results
Spatial Distribution of All Outliers
Figure 20 QC Report—Number and Spatial Distribution of Outliers
The number (and percentage) of features that are feature
nonuniformity outliers in either the green or red channel is
shown under the plot. The 1- color report shows only the
percentage of green feature non- uniformity outliers.
Also, the number (and percentage) of genes that are
nonuniformity outliers in either channel is shown under the
plot. If there were replicate features representing one gene
and at least one feature was not an outlier, no gene outliers
would appear.
92 Feature Extraction Reference Guide
Page 93

Net Signal Statistics
QC Report Results 2
Net Signal Statistics
Net signal is the mean signal
minus the scanner offset. Net
signal is used so that these
statistics are independent of the
scanner version.
Net signal statistics are an indication of the dynamic range
of the signal on a microarray for both non- control probes
and spike- in probes (not applicable for CGH QC report). The
QC Report uses the range from the first percentile to the
99th percentile as an indicator of dynamic range for that
microarray. NetSignal is also a column in the FeatureData
output.
For example, in Figure 21 for non- control probes, the
dynamic range of the net signal intensity for the red channel
is from 42 to 6803. Half the probes have a net signal
intensity of greater than the median of 97 and half below
the median of 97. The median (or 50th percentile) represents
the middle of the ranked- values of the distribution of
signals.
Another indicator of signal range for the microarray is the
number of features that are saturated in the scanned image
(for example, NumSat).
Figure 21 QC Report—Net Signal Statistics
Feature Extraction Reference Guide 93
Page 94

2 QC Report Results
Negative Control Stats
Negative Control Stats
The Negative Control Stats table includes the average and
standard deviation of the net signals (mean signal minus
scanner offset) and the background- subtracted signals for
both the red and green channels in the negative controls.
These statistics filter out saturated and feature nonuniform
and population outliers and give a rough estimate of the
background noise on the microarray. SNP probes are not
included in these statistics.
Figure 22 QC Report—Negative Control Stats
94 Feature Extraction Reference Guide
Page 95

Plot of Background-Corrected Signals
Plot of Background-Corrected Signals
Figure 23 is a plot of the log of the red
background- corrected signal versus the log of the green
background- corrected signal for non- control inlier features.
The linearity or curvature of this plot can indicate the
appropriateness of background method choices. The plot
should be linear.
The intersection of the red vertical and horizontal lines
shows the location of the median signal. The numbers along
the edge of the lines represent the location of the median
signal on the plot.
The values under the plot indicate the number of
non- control features that have a background-corrected signal
less than zero. SNP probes are not included.
QC Report Results 2
Figure 23 QC Report—Plot of Background-Corrected Signals
Feature Extraction Reference Guide 95
Page 96
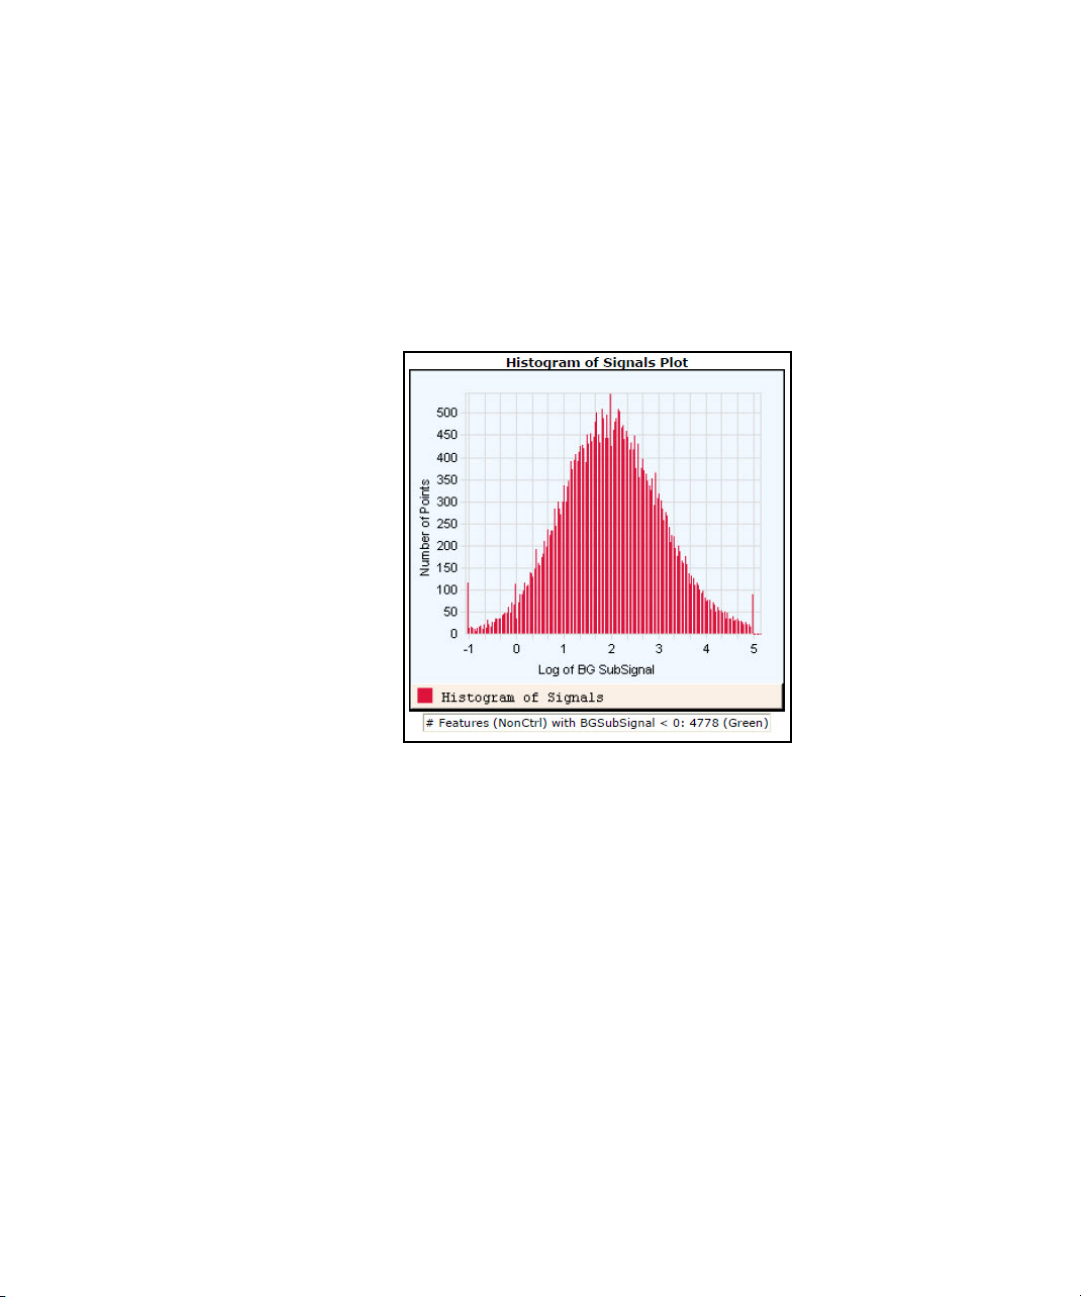
2 QC Report Results
Histogram of Signals Plot (1-color GE or CGH)
Histogram of Signals Plot (1-color GE or CGH)
The purpose of this histogram is to show the level of signal
and the shape of the signal distribution. The histogram is a
line plot of the number of points in the intensity bins vs.
the log of the processed signal. SNP probes are not included.
Figure 24 1-color QC Report—Histogram of Signals Plot
96 Feature Extraction Reference Guide
Page 97

Local Background Inliers
With these numbers, you can see the mean signal
distribution for the local background regions (BGMeanSignal)
after outliers have been removed. This information can help
you detect hybridization/wash artifacts and can be a
component of noise in the low signal range. SNP probes are
included.
Figure 25 QC Report—Local Background Inliers
Foreground Surface Fit
QC Report Results 2
Local Background Inliers
See “Step 13. Perform background
spatial detrending to fit a
surface” on page 258 of this guide
for more information about these
calculations.
Feature Extraction Reference Guide 97
Spatial Detrend attempts to account for low signal
background that is present on the feature “foreground” and
varies across the microarray. SNP probes are not included.
• A high RMS_Fit number can indicate gradients in the low
signal range before detrending.
• RMS_Resid indicates residual noise after detrending.
• AvgFit indicates how much signal is in the “foreground”.
A higher AvgFit number indicates that a larger amount of
signal was detected by the detrend algorithm and
removed.
This value may include the scanner offset, unless a
background method has been used before detrending. The
value may not include higher frequency background
signals. These higher frequency background signals are
best removed by using the Local Background Method
before the detrending algorithm.
Page 98

2 QC Report Results
Foreground Surface Fit
Figure 26 QC Report—Foreground Surface Fit
98 Feature Extraction Reference Guide
Page 99

Multiplicative Surface Fit
QC Report Results 2
Multiplicative Surface Fit
See “Step 16. Determine the error
in the signal calculation” on
page 268 of this guide for more
information about these
calculations.
This value is the root mean square (RMS) of the surface fit
for the data. The RMS X 100 is roughly the average %
deviation from “flat” on the microarray. A multiplicative
trend means that there are regions of the microarray that
are brighter or dimmer than other regions. This trend is an
effect that multiplies signals; that is, a brighter signal is
more affected in absolute signal counts than a dimmer
signal. SNP probes are not included in calculation of
multiplicative detrending.
This option is turned on in GE1, GE2, and CGH protocols,
turned off in the miRNA protocol and is not available for
non- Agilent protocols.
If the signal is improved through a multiplicative surface fit,
the RMS_Fit value appears as a fraction, as in the figure
shown.
Figure 27 QC Report—Multiplicative Surface Fit
What if multiplicative detrending does not work?
If the median %CV for the Processed Signal of the
non- control probes is greater than the BGSub Signal median
%CV after multiplicative detrending, Feature Extraction turns
off multiplicative detrending.
If multiplicative detrending did not result in better data, the
QC report shows an RMS_Fit = 0.0.
If there are no stats for non- control probes, Feature
Extraction looks at the spike- in control probes. If the %CVs
for these become worse, Feature Extraction removes
detrending.
Feature Extraction Reference Guide 99
Page 100

2 QC Report Results
Spatial Distribution of Significantly Up-Regulated and Down-Regulated Features (Positive and Negative
Log Ratios)
If the option “Detrend on Replicates only” is chosen and if
there are not enough replicates for non- control or spike-in
control probes, Feature Extraction turns off multiplicative
detrending.
Spatial Distribution of Significantly Up-Regulated and Down-Regulated Features (Positive and Negative Log Ratios)
You can display the distribution of the significantly up- and
down- regulated features on this plot (up–red; down–green).
Figure 28 QC Report—Spatial Distribution of Up- and Down-Regulated
Features
For the CGH QC Report, this plot is referred to as “Spatial
Distribution of the Positive and Negative Log Ratios”.
If the microarray contains greater than 5000 features, the
software randomly selects 5000 data points. These points
include the number of up-regulated features in the same
proportion to the number of down- regulated features as they
are found on the actual microarray.
The threshold that is used to determine significance is set in
the protocol—QCMetrics_differentialExpressionPValue.
These are the same features shown as up- or
down- regulated in Figure 29.
100 Feature Extraction Reference Guide
 Loading...