

Page 1

Technical Overview
Performance Equivalence of the
D1000 ScreenTape Assays on the
Agilent TapeStation Systems
Introduction
Agilent TapeStation systems are well-established automated electrophoresis
systems for fast and reliable analysis of nucleic acids for multiple applications.
The platform integrates a benchtop electrophoresis-based instrument,
data-processing TapeStation software, and reagents, used in concert with
application-specific ScreenTape sample-processing consumable devices.
DNA and RNA samples can be analyzed with minimal handling effort and fully
scalable throughput from 1 to 96 samples. The entire Agilent ScreenTape
portfolio for TapeStation systems is a vital tool for sample quality control (QC) at
different checkpoints in next-generation sequencing (NGS) workflows.
To provide users with continued improvements and benefits to the TapeStation
platform, Agilent has recently introduced a technology update to the Agilent
4200 TapeStation instrument. For example, all instruments manufactured from
spring 2021 are equipped with a modified ScreenTape nest, enabling users to
easily exchange the electrode cartridge during the yearly, mandatory, preventive
maintenance service. Thus, the modified ScreenTape nest secures an optimized
cost of ownership. In addition, a modified instrument optical system allows
for a better match with the application-specific fluorescent dyes. All existing
ScreenTape applications as well as plastic consumables are fully compatible
with the new 4200 TapeStation system.
This technical overview highlights the performance of the Agilent D1000
ScreenTape assay and the Agilent High Sensitivity D1000 ScreenTape assay
on the new 4200 TapeStation system. Analytical assay specifications like
sensitivity, sizing, quantification, and molarity delivered by the new instrument
were evaluated and compared with the results obtained on the legacy 4200 and
4150 TapeStation systems to demonstrate data equivalency between all three
models.
Page 2
Analytical specifications
Sizing, quantification, and molarity
were compared between three
TapeStation models using the provided
corresponding ScreenTape ladders as
samples, a 300 bp DNA fragment, and
sheared human genomic DNA (gDNA).
Table 1 summarizes the analytical
specifications of the D1000 and High
Sensitivity D1000 ScreenTape assays.
Experimental
Materials
The 4150 TapeStation (p/n G2992AA),
legacy 4200 TapeStation (p/n G2991AA),
and new 4200 TapeStation (p/n
G2991BA) systems with the Agilent
D1000 ScreenTape (p/n 5067-5582),
D1000 Reagents (p/n 5067-5583), Agilent
High Sensitivity D1000 ScreenTape (p/n
5067-5584), and High Sensitivity D1000
Reagents (p/n 5067-5585) were obtained
from Agilent Technologies Inc. NoLimits
300 bp DNA fragments (p/n SM1621),
the Qubit 2.0 Fluorometer, and Qubit
1X dsDNA HS (High Sensitivity) Assay
Kit (p/n Q33231) were purchased from
Thermo Fisher Scientific Inc. Human
genomic DNA (p/n G304A) was acquired
from Promega. The M220 Focusedultrasonicator and the microTUBEs were
obtained from Covaris Inc.
Sample preparation
DNA fragments were prepared by
diluting the commercially available
DNA from Promega in 10 mM TrisHCl (pH = 8.0) to achieve a desired
number of concentrations within the
quantitative ranges of both D1000
ScreenTape assays (Table 1). Human
gDNA provided by the vendor was
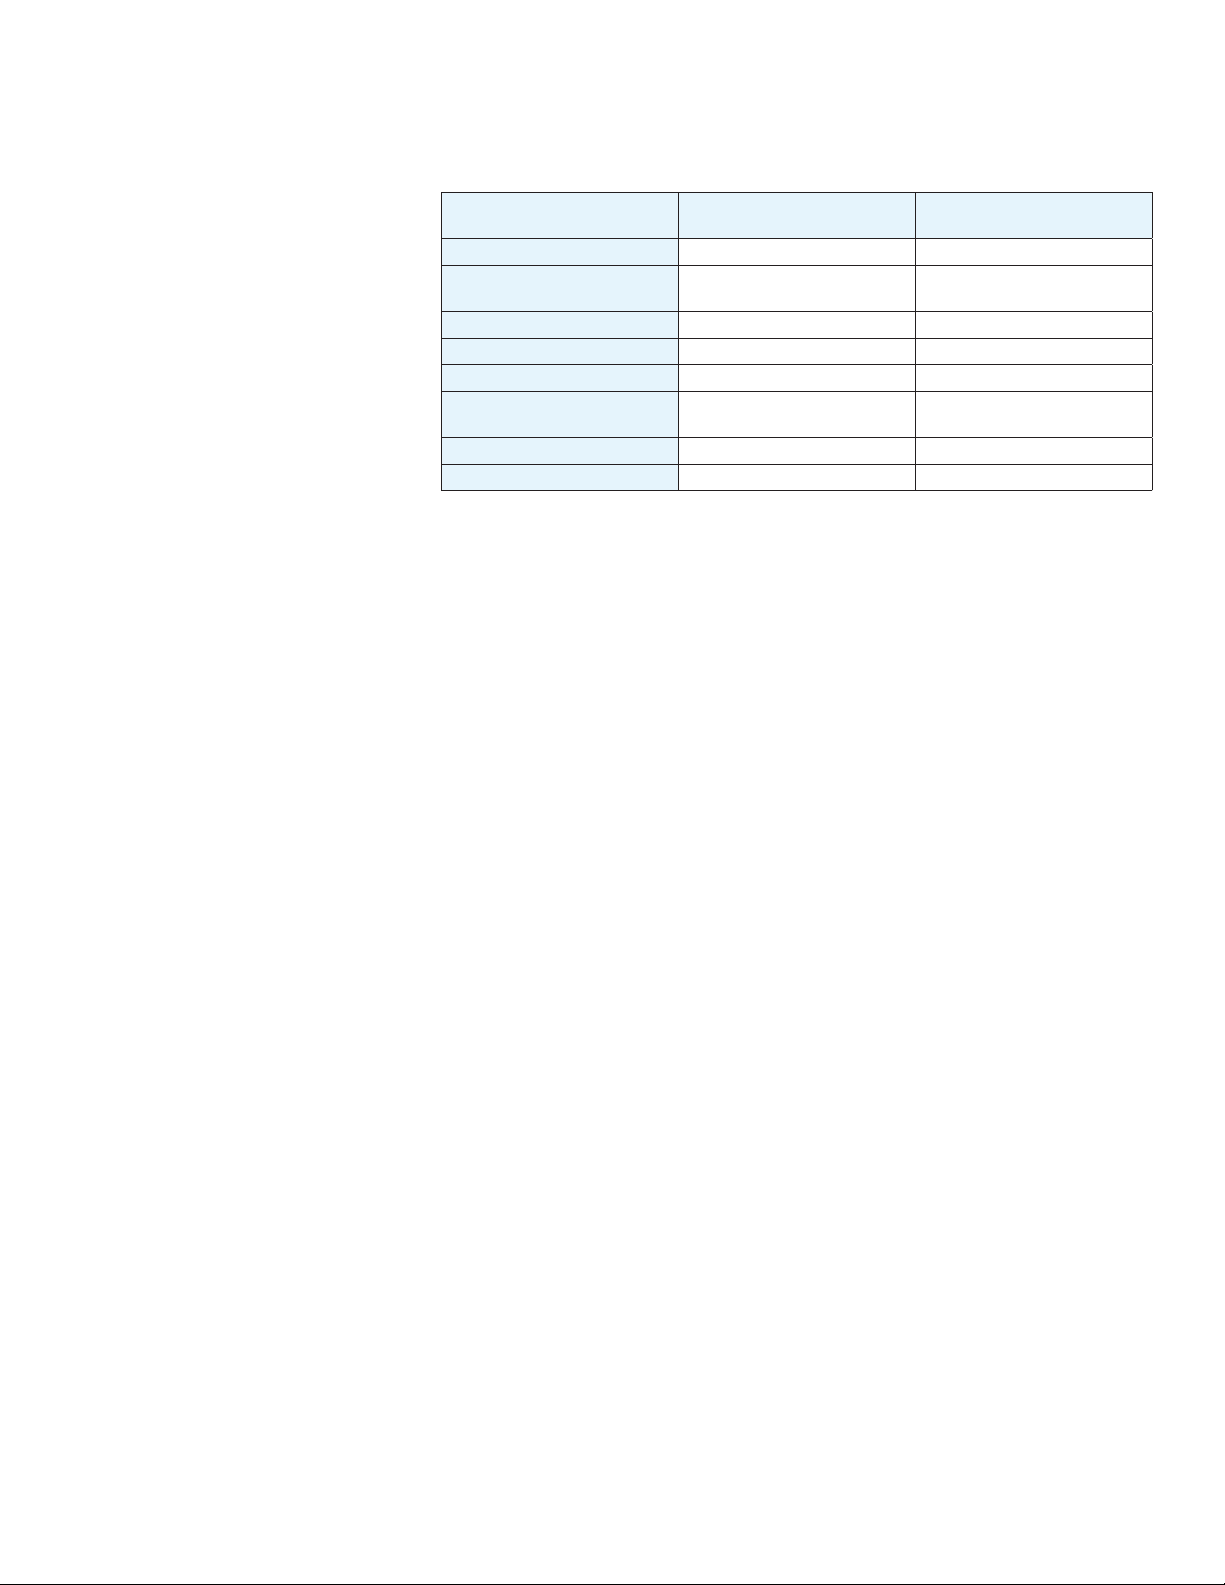
Table 1. Comparison of analytical specifications of the Agilent D1000 ScreenTape assay and the Agilent
High Sensitivity D1000 ScreenTape assay.
Analytical Specifications Agilent D1000
Sizing Range 35 to 1,000 bp 35 to 1,000 bp
Typical Resolution
Sensitivity
Sizing Precision
Sizing Accuracy
Quantitative Precision
Quantitative Accuracy
Quantitative Range 0.1 to 50 ng/µL 10 to 1,000 pg/µL
¹Signal-to-noise >3 (single peak)
²Measured using one ladder per ScreenTape device
3
1
2
2,3
2
Sizing accuracy for analysis with electronic ladder: ±20%
utilized to generate DNA smears. The
gDNA was sheared in the microTUBEs
on the Covaris instrument according to
the manufacturer’s recommendations.
A shearing time of 110 seconds was
selected to achieve a target peak size
of approximately 300 bp. The final
smear sample was diluted in 10 mM
Tris-HCl (pH = 8.0) to prepare different
concentrations satisfying the respective
specifications1. Nominal concentrations
of all analyzed samples were determined
on the Qubit Fluorometer with Qubit 1X
ScreenTape Assay
35 to 300 bp: 15%
300 to 1,000 bp: 10%
0.1 ng/µL 5 pg/µL
5% CV 5% CV
±10% ±10%
0.1 to 1 ng/µL: 15% CV
1 to 50 ng/µL: 10% CV
±20% ±20%
DNA analysis
The D1000 and High Sensitivity D1000
ScreenTape assays were utilized for
sample analysis on three new 4200
TapeStation instruments, and on single
legacy 4200 and 4150 TapeStation
systems, respectively. Sample
preparation for both assays were
performed according to the Agilent quick
guide instructions
were analyzed in replicates of nine on
all TapeStation systems using Agilent
TapeStation software 4.1.
Agilent High Sensitivity D1000
ScreenTape Assay
35 to 300 bp: 15%
300 to 1,000 bp: 10%
15% CV
2,3
. The DNA samples
dsDNA HS Assay Kit. The respective
DNA ScreenTape ladders were used
as samples without any additional
treatment.
2
Page 3

Sample Intensity [Normalized FU]
e
[bp]
1,000 pg/µL
Results and discussion
Sensitivity
A dilution series of a 300 bp DNA
fragment with six concentrations from 5
to 1,000 pg/µL was analyzed on a new
4200 TapeStation system using the High
Sensitivity D1000 ScreenTape assay.
The electropherogram overlay of all used
concentrations demonstrated single and
distinct peaks (Figure 1).
An enlarged section shows the overlay
of the technical replicates (n = 9) at a
concentration of 5 pg/µL, corresponding
to the specified limit of detection
(Table 1). The respective fragment peak
of 300 bp was clearly detected for all
9 replicates with signal-to-noise ratio
greater than 3. Thereby, the sensitivity of
the High Sensitivity D1000 ScreenTape
assay using a commercially available
fragment was confirmed on the new
4200 TapeStation system. Likewise, the
sensitivity of 0.1 ng/µL was verified for
the D1000 ScreenTape assay (data not
shown).
1200
1000
800
600
400
200
0
Figure 1. A 300 bp DNA fragment dilution series (5 to 1,000 pg/µL) was analyzed using the Agilent High
Sensitivity D1000 ScreenTape assay on the new Agilent 4200 TapeStation system. The enlarged image
shows the overlay of individual electropherograms at the specified limit of detection of 5 pg/µL (n = 9).
5 pg/µL
Lower marker
750 pg/µL
500 pg/µL
250 pg/µL
10 pg/µL
Upper marker
Siz
3
Page 4

Sizing
Agilent D1000 ScreenTape assay
Determined size (bp)
The analytical specifications of the
D1000 and High Sensitivity D1000
ScreenTape assays are summarized in
Table 1. Differing in quantitative range,
both D1000 assays allow for accurate
separation of DNA fragments and
smears ranging from 35 to 1,000 bp in
length. Previously, sizing specifications
of the D1000 DNA assays were evaluated
on the legacy 4200 TapeStation
system using two commercially
available ladders4. In this study,
sizing performance on the new 4200
TapeStation instrument was evaluated
using the D1000 and High Sensitivity
D1000 ScreenTape assay ladders as
samples, as described for the 4150
TapeStation system5, and the results of
all TapeStation models were compared.
Absolute sizes were determined on three
new 4200 TapeStation instruments and
compared with the results obtained
on both the legacy 4200 and 4150
TapeStation systems for all fragments
constituting the corresponding
ladders. The sizing performance of all
instruments is presented as an individual
bar chart for each assay with nominal
ladder fragment sizes supplied by Agilent
on the X-axes (Figure 2).
A
1,000
800
600
400
Determined size (bp)
200
0
B
Agilent High Sensitivity D1000 ScreenTape assay
1,000
800
600
400
50 100 200 300 400 500 700 1,000
Nominal size (bp)
4150 TapeStation
New 4200 TapeStation (1)
Legacy 4200 TapeStation
New 4200 TapeStation (2) New 4200 TapeStation (3)
4
200
0
50 100 200 300 400 500 700 1,000
Nominal size (bp)
4150 TapeStation
New 4200 TapeStation (1)
Figure 2. Sizing results for eight DNA fragments of the corresponding Agilent ScreenTape assay ladder
analyzed on three new Agilent 4200 TapeStation instruments and on both the legacy Agilent 4200
TapeStation instrument and the Agilent 4150 TapeStation instrument (n = 9) compared to nominal sizes.
(A) Agilent D1000 ScreenTape assay and (B) Agilent High Sensitivity D1000 ScreenTape assay.
Legacy 4200 TapeStation
New 4200 TapeStation (2) New 4200 TapeStation (3)
Page 5

Sample Intensity [Normalized FU]
r
r
e
[bp]
Sizing accuracy and precision for the
D1000 and the High Sensitivity D1000
ScreenTape assays were evaluated on
the new 4200 TapeStation instruments
in direct comparison with values
obtained on the legacy 4200 and
the 4150 TapeStation instruments.
Sizing accuracy was ±2.6% or less
for both ScreenTape assays on all
TapeStation instruments, well within
assay specifications (±10%). Sizing
precision did not exceed a coefficient of
variation (%CV) of 1.1% for the D1000,
and 2.1% for the High Sensitivity D1000
ScreenTape assays on all three different
TapeStation models, which is within the
specified sizing precision of 5% for both
assays.
The average size of a sample is a critical
parameter of an NGS library to be
prepared for multiplex sequencing, as it
is required for molarity calculation. The
average size of a library can be easily
determined with the region analysis
function of the TapeStation analysis
software. In comparison to peak size
determination, which is well suited for a
symmetrical size distribution, the region
analysis is more accurate for sheared
DNA with a tailing on either side. A
set region, flanking the entire smear,
provides an average smear size that
excludes a potential bias associated
with uneven size distribution. Figure 3
illustrates how the region functionality of
the TapeStation system can be applied to
a sheared DNA sample. The average size
of a smear is automatically reported by
the TapeStation analysis software in the
region table.
1000
900
800
700
600
500
400
300
200
100
0
Figure 3. An example electropherogram of a sheared DNA sample analyzed on the new Agilent 4200
TapeStation system with the Agilent High Sensitivity D1000 ScreenTape assay using Agilent TapeStation
analysis software region function. The region from 45 to 1,000 bp was established to flank the entire
smear.
Lowe
25
45
50
100
200
300
400
500
700
1000
1000
Uppe
1500
Siz
5
Page 6

Sheared gDNA samples of different
Agilent D1000 ScreenTape assay
Average size (bp)
Average size (bp)
concentrations were prepared to
be within the previously specified
quantitative range for smears1. The
samples were separated with both
the D1000 and the High Sensitivity
D1000 ScreenTape assays on all three
TapeStation models and demonstrated
excellent sizing performance with
respect to smear analysis. An identical
smear analysis region ranging from 45 to
1,000 bp was set for both assays within
the TapeStation analysis software.
Figure 4 shows the comparison of sizing
results of the D1000 and High Sensitivity
D1000 ScreenTape assays delivered by
the 4150, legacy 4200, and three new
4200 TapeStation systems, respectively.
The results of all TapeStation models
were comparable throughout the
nominal concentrations and highly
consistent between the three new 4200
TapeStation instruments. The D1000
and High Sensitivity D1000 ScreenTape
assays demonstrated reproducible sizing
with a maximum %CV of 2.6% and 3.7%,
respectively. Both DNA ScreenTape
assays met the specified analytical
specifications of ±5%.
Accurate and precise sizing performance
of the D1000 and the High Sensitivity
D1000 ScreenTape assays was fully
validated with multiple sample types
on the new 4200 TapeStation system.
The sizing results obtained on the new
instrument were equivalent to the results
delivered by the other two TapeStation
models.
A
400
350
300
250
200
150
100
50
0
550 100
Nominal concentration (ng/µL)
4150 TapeStation
New 4200 TapeStation (1)
B
Figure 4. Comparative analysis of average size for sheared DNA throughout the respective dilution series.
(A) Agilent D1000 ScreenTape assay. (B) Agilent High Sensitivity D1000 ScreenTape assay.
Agilent High Sensitivity D1000 ScreenTape assay
400
350
300
250
200
150
100
50
0
500 7,500 15,000
4150 TapeStation
New 4200 TapeStation (1)
Legacy 4200 TapeStation
New 4200 TapeStation (2) New 4200 TapeStation (3)
Nominal concentration (pg/µL)
Legacy 4200 TapeStation
New 4200 TapeStation (2) New 4200 TapeStation (3)
6
Page 7

100,000
Concentration (pg/µL)
Concentration (pg/µL)
Quantification
The D1000 ScreenTape assays enable
precise determination of sample
A
High Sensitivity D1000 ScreenTape assay
D1000 ScreenTape assay
concentration within quantitative
ranges from 10 to 1,000 pg/µL for high
10,000
sensitivity and from 0.1 to 50 ng/µL for
standard sensitivity assays, respectively.
Quantitative accuracy and precision for
both ScreenTape assays are outlined in
Table 1.
1,000
y = 0.9729x
2
= 0.9998
R
Quantitative performance of the D1000
ScreenTape assays on the legacy 4200
TapeStation system was previously
evaluated using the respective dilutions
100
New 4200 TapeStation system
of a commercially available 600 bp DNA
fragment³. Similarly, serial dilutions of
a 300 bp DNA fragment covering the
entire specified quantitative range were
10
y = 1.0006x
R2 = 1
used to assess quantitative capabilities
of the D1000 assays on the new 4200
TapeStation system. Direct comparison
of the quantitative results between the
new and the legacy 4200 TapeStation
systems as well as between the
new 4200 and the 4150 TapeStation
systems is shown in Figure 5. As the
quantitative ranges of the D1000 and
1
110 100 1,000 10,000 100,000
Concentration (pg/µL)
Legacy 4200 TapeStation system
100,000
B
High Sensitivity D1000 ScreenTape assay
D1000 ScreenTape assay
High Sensitivity D1000 ScreenTape
assays overlap, the data generated by
both assays were presented together,
10,000
on a logarithmic scale. The scatterplots
demonstrated excellent linearity,
confirming accurate measurements
within the specified quantitative ranges
(Table 1). Concentrations measured
1,000
y = 0.9631x
2
R
= 0.9994
on the new 4200 TapeStation system
were consistent with those reported
by the other two TapeStation systems
and the measurements showed strong
100
New 4200 TapeStation system
correlation between all three models,
with R2 values of 99.9 to 100%.
10
y = 0.9651x
2
= 0.9999
R
Figure 5. Quantification of a 300 bp fragment in a dilution series from 10 to 50,000 pg/μL. The fragments
were analyzed with the Agilent High Sensitivity D1000 ScreenTape assay and the Agilent D1000
ScreenTape assay. (A) Comparison of the quantification on the legacy (X-axis) and new Agilent 4200
TapeStation systems (Y-axis). (B) Comparison of the quantification on the Agilent 4150 TapeStation
system (X-axis) and the new 4200 TapeStation system (Y-axis).
1
110 100 1,000 10,000 100,000
Concentration (pg/µL)
4150 TapeStation system
7
Page 8

The quantitative specifications
Agilent D1000 ScreenTape assay
%CV
presented in Table 1 were evaluated
on the new 4200 TapeStation system
in comparison with the legacy 4200
and 4150 TapeStation systems.
Quantitative results on the new 4200
TapeStation instrument were achieved
with accuracy relative to the legacy 4200
TapeStation instrument of ±3.2% or
less for the D1000 and ±2.1% or less for
the High Sensitivity D1000 ScreenTape
assays, respectively. All TapeStation
models demonstrated accurate
quantitative results across the entire
concentration range of both assays
and met the corresponding analytical
specifications (Table 1). Quantitative
precision was below 5% for the D1000
and below 6% for the High Sensitivity
D1000 ScreenTape assays for all
concentrations. As shown in Figure 6, all
systems met the specified quantitative
precision for both assays. Highly
comparable results were also delivered
by analysis of sheared gDNA at different
concentrations within the specified
quantitative range of each assay (data
not shown). Quantitative precision
was 3% or less for the D1000 and 4%
or less for the High Sensitivity D1000
ScreenTape assays. Overall, consistent
and reliable quantitative results were
delivered by all three TapeStation
models.
A
15
10
%CV
5
0
5250.1 40 50
Nominal concentration (ng/µL)
4150 TapeStation
New 4200 TapeStation (1)
B
Agilent High Sensitivity D1000 ScreenTape assay
15
10
5
Legacy 4200 TapeStation
New 4200 TapeStation (2) New 4200 TapeStation (3)
0
250 50010 750 1,000
Nominal concentration (pg/µL)
4150 TapeStation
New 4200 TapeStation (1)
Figure 6. Quantification precision of the 300 bp fragment over five concentrations analyzed with
8
.three new Agilent 4200 TapeStation instruments and on both the legacy Agilent 4200 TapeStation
instrument and the Agilent 4150 TapeStation instrument. The orange lines indicate the corresponding
specified quantitative precision. (A) Quantification precision of the Agilent D1000 ScreenTape assay. (B)
Quantification precision of the Agilent High Sensitivity D1000 ScreenTape assay.
Legacy 4200 TapeStation
New 4200 TapeStation (2) New 4200 TapeStation (3)
Page 9

Molarity
1,000
1,000
Molarity (nmol/L)
Molarity (nmol/L)
4150 TapeStation system
Molarity is determined by both the
average size and the concentration of
a DNA smear. Even minor differences
in both values greatly change the
molar concentration of the sample.
Accurate estimation of molarity is
essential for successful multiplex
sequencing. NGS sequencing protocols
require normalization of the libraries
prior to volumetric pooling. Only
equimolar pooling can ensure an even
read distribution of all samples. The
TapeStation software automatically
delivers molarity values, eliminating a
need for additional calculations.
To assess the equivalence of the
calculated molarity data on the new
4200 TapeStation system, a sheared
gDNA sample with a nominal average
size of 300 bp was analyzed with both
the D1000 and High Sensitivity D1000
ScreenTape assays. The molarity values
of the new 4200 TapeStation instrument
were plotted pairwise against the values
delivered by the legacy 4200 (Figure
7A) and 4150 TapeStation systems
(Figure 7B). As shown in Figure 7, both
plots demonstrated excellent molarity
correlation by the regression analysis,
with R² values of 99.9 to 100%.
A
New 4200 TapeStation system
B
High Sensitivity D1000 ScreenTape assay
D1000 ScreenTape assay
100
10
y = 0.9872x
2
= 0.9999
R
1
110 100
Molarity (nmol/L)
Legacy 4200 TapeStation system
1,000
100
High Sensitivity D1000 ScreenTape assay
D1000 ScreenTape assay
y = 1.0205x
2
R
= 0.9998
y = 0.9828x
2
R
= 1
New 4200 TapeStation system
10
y = 0.9472x
2
R
= 1
1
110 100 1,000
Molarity (nmol/L)
Figure 7. Molarity correlation of sheared gDNA samples in serial dilutions obtained with the Agilent High
Sensitivity D1000 assay and Agilent D1000 ScreenTape assay. Molarity was calculated using the region
functionality. (A) Comparison of the sample molarities obtained with the legacy (X-axis) compared to the
new Agilent 4200 TapeStation systems (Y-axis). (B) Comparison of the sample molarities obtained with the
Agilent 4150 TapeStation system (X-axis) and the new Agilent 4200 TapeStation system (Y-axis).
9
Page 10

Figure 8 shows an example
Sample Intensity [Normalized FU]
25
50
100
200
300
400
500
700
1000
1500
e
[bp]
25
50
100
200
300
400
500
700
1000
1500
electropherogram overlay generated
by a separation of sheared DNA using
the High Sensitivity D1000 ScreenTape
assay on all three TapeStation models.
The new and legacy 4200 and the
4150 TapeStation systems provided
an equivalent smear pattern. Likewise,
the size distribution was observed to
be the same between the three new
4200 TapeStation instruments (Figure
9). All TapeStation systems reported
consistent molarity values and provided
identical smear patterns, verifying high
replicability across the instruments. By
delivering identical results, the new and
the legacy 4200 TapeStation systems
demonstrated equal performance in
relation to analysis of DNA smears.
800
700
600
500
400
300
200
100
4150 TapeStation
Legacy 4200 TapeStation
New 4200 TapeStation
0
Figure 8. Electropherogram overlay of a smear sample analyzed using the Agilent High Sensitivity D1000
ScreenTape assay on the Agilent 4150 TapeStation system, legacy Agilent 4200 TapeStation system, and
new Agilent 4200 TapeStation system.
800
700
600
500
400
300
4150 TapeStation
Legacy 4200 TapeStation
New 4200 TapeStation
Sample Intensity [Normalized FU]
200
Siz
100
0
Size
[bp]
Figure 9. Electropherogram overlay of a smear sample analyzed using the Agilent High Sensitivity D1000
10
ScreenTape assay on three new Agilent 4200 TapeStation systems.
Page 11

Conclusion
This technical overview demonstrates
the equivalent performance of the Agilent
D1000 ScreenTape assay and the Agilent
High Sensitivity D1000 ScreenTape assay
for the separation of DNA fragments
and smears among Agilent TapeStation
instruments. The electrophoretic analysis
of the DNA fragments between 35 and
1,000 bp in length provided accurate
sizing, precise quantification, and high
sensitivity down to 5 pg/µL, fully meeting
the assay analytical specifications.
Furthermore, highly reliable and
reproducible results were delivered for
sheared gDNA samples with respect to
average size, concentration, and molarity.
The performance of the D1000
ScreenTape assays was equivalent
between the new and legacy Agilent
4200 TapeStation systems, ensuring full
compatibility. In addition, the same high
correlation for sizing, quantification, and
molarity was noted between the new
4200 and the Agilent 4150 TapeStation
systems. Overall, this technical overview
confirms the analytical specifications
of both the D1000 and High Sensitivity
D1000 ScreenTape assays on the
new 4200 TapeStation system and
demonstrates data equivalency between
the three different TapeStation models.
References
1. Comparison of DNA Assays Using the 4200 TapeStation Systems and 2100
Bioanalyzer System. Agilent Technologies technical overview, publication number
5991-9093EN, 2018.
2. Agilent D1000 ScreenTape Quick Guide for TapeStation Systems. Agilent
Technologies, publication number G2991-90031, 2018.
3. Agilent High Sensitivity D1000 ScreenTape Quick Guide for TapeStation Systems.
Agilent Technologies, publication number G2991-90131, 2018.
4. Performance of the Agilent D1000 and the Agilent High Sensitivity D1000
ScreenTape Assay for the Agilent 4200 TapeStation System. Agilent Technologies
technical overview, publication number 5991-6903EN, 2016.
5. Performance Characteristics of the D1000 and High Sensitivity D1000
ScreenTape Assays for the 4150 TapeStation System. Agilent Technologies
technical overview, publication number 5994-0277EN, 2018.
11
Page 12

www.agilent.com/genomics/tapestation
For Research Use Only. Not for use in diagnostic procedures.
PR7000-7800
This information is subject to change without notice.
© Agilent Technologies, Inc. 2021
Printed in the USA, March 31, 2021
5994-3114EN
 Loading...