

Page 1

Application Note
Immuno-oncology
Stimulation of Human Peripheral
Blood Mononuclear Cells
Using the Agilent BioTek Cytation 7 Cell Imaging
Multimode Reader to Image and Analyze ELISpot
Assays
Author
Paul Held, PhD
Agilent Technologies, Inc.
Abstract
Human peripheral blood mononuclear cells (PBMCs) are routinely isolated from
blood samples and then used in several fields of research including autoimmune
disorders, infectious diseases, vaccine development and cancers. The ELISpot
Assay monitors ex vivo cellular immune responses to antigenic stimuli. Here we
use the Agilent BioTek Cytation 7 cell imaging multimode reader in conjunction with
Agilent BioTek Gen5 microplate reader and imager software to quantitate changes in
cytokine secretion in PBMCs using the colorimetric ELISpot assayformat.
Page 2

Introduction
Human peripheral blood mononuclear cells (PBMCs) are
differentially stimulated to secrete a number of cytokines as a
result of a receptor mediated cascade based on the cell type
and the stimuli. The response of this diverse group of cells to
different stimuli offers insights into their role in disease and
the development of treatment modalities.
PBMCs are peripheral blood cells that have a round nucleus.1
These cells consist of lymphocytes (T-, B-, and NK-cells) as
well as monocytes. Other peripheral blood cells either have
no nuclei (erythrocytes and platelets) or have multi-lobed
nuclei (neutrophils, basophils, and eosinophils). In humans,
lymphocytes make up the majority of the PBMC population,
followed by monocytes, and only a small percentage of
dendritic cells.
Cytokines are small molecular weight proteins or peptides
secreted by many cell types (particularly immune system
cells) that regulate the duration and intensity of the immune
response. The cytokine interleukin 2 (IL-2) is a pleiotropic
cellular regulatory molecule that is produced by lymphoid
cells in response to several stimuli. It plays a role in preventing
autoimmune diseases by promoting differentiation of
immature T cells into regulatory T cells.3 In addition, IL-2
causes the differentiation of T cells into effector T cells and
memory T cells when the original T cell was stimulated by
an antigen.4 Interferon gamma (IFN-γ), is a cytokine critical
for innate and adaptive immunity against infections. IFN-γ
is produced predominantly by natural killer (NK) and natural
killer T (NKT) cells as part of the innate immune response,
and by cytotoxic T lymphocyte (CTL) effector T cells once
antigen-specific immunity develops.5 The importance of IFN-γ
in the immune system stems in part from its ability to inhibit
viral replication directly, and from its immune-stimulatory
and immunomodulatory effects. Aberrant IFN-γ expression
is associated with a number of auto-inflammatory and
autoimmune diseases.
T-cell activation is normally initiated by the interaction of a
cell surface receptor to its specific ligand molecule along with
a costimulatory molecule.6 This binding event triggers the
rapid hydrolysis of inositol phospholipids to diacylglycerol and
inositol phosphates by phospholipase C (PLC).
Diacylglycerol is an allosteric activator of protein kinase C
(PKC). PKC activation and inositol phosphates, which trigger
Ca2+ release and mobilization, result in a cascade of additional
cellular responses mediating T cell activation (Figure 1). Two
2
of these cellular responses are the production and secretion
of IL-2 and INF-γ. Triptolide is a diterpene triepoxide that is a
potent immunosuppressant and anti-inflammatory (Figure 2).
Triptolide has been shown to inhibit the expression of IL-2 in
activated T cells at the level of purine-box/nuclear factor and
NF-κB mediated transcriptionactivation.
Figure 1. Schematic of signal cascade for stimulation of IL-2 and INF-γ
secretion.
Figure 2. Structure of triptolide.
7
2
Page 3
While some PBMCs are known to produce IL-2 and INF-γ,
under normal growth conditions little is produced. Only after
stimulation will substantial amounts of the cytokines be
expressed.8 Phytohemagglutinin (PHA) is a lectin that binds
to the sugars on glycosylated surface proteins, including
the Tcell receptor (TCR), and nonspecifically binds them.
The result is the low level stimulation of the signal cascade
required for IL-2 or INF-γ secretion.9 Likewise, Phorbol
myristate acetate (PMA) is a small organic compound, which
has a structure analogous to diacylglycerol, that diffuses
through the cell membrane into the cytoplasm where it
directly activates Protein Kinase C (PKC). When used in
combination with ionomycin, a calcium ionophore, which
triggers calcium release, it results in a moderate level of
cytokine release. However, when PMA and a costimulator,
such as PHA, stimulate PBMC cells concurrently, cytokine
production is strongly enhanced.
10
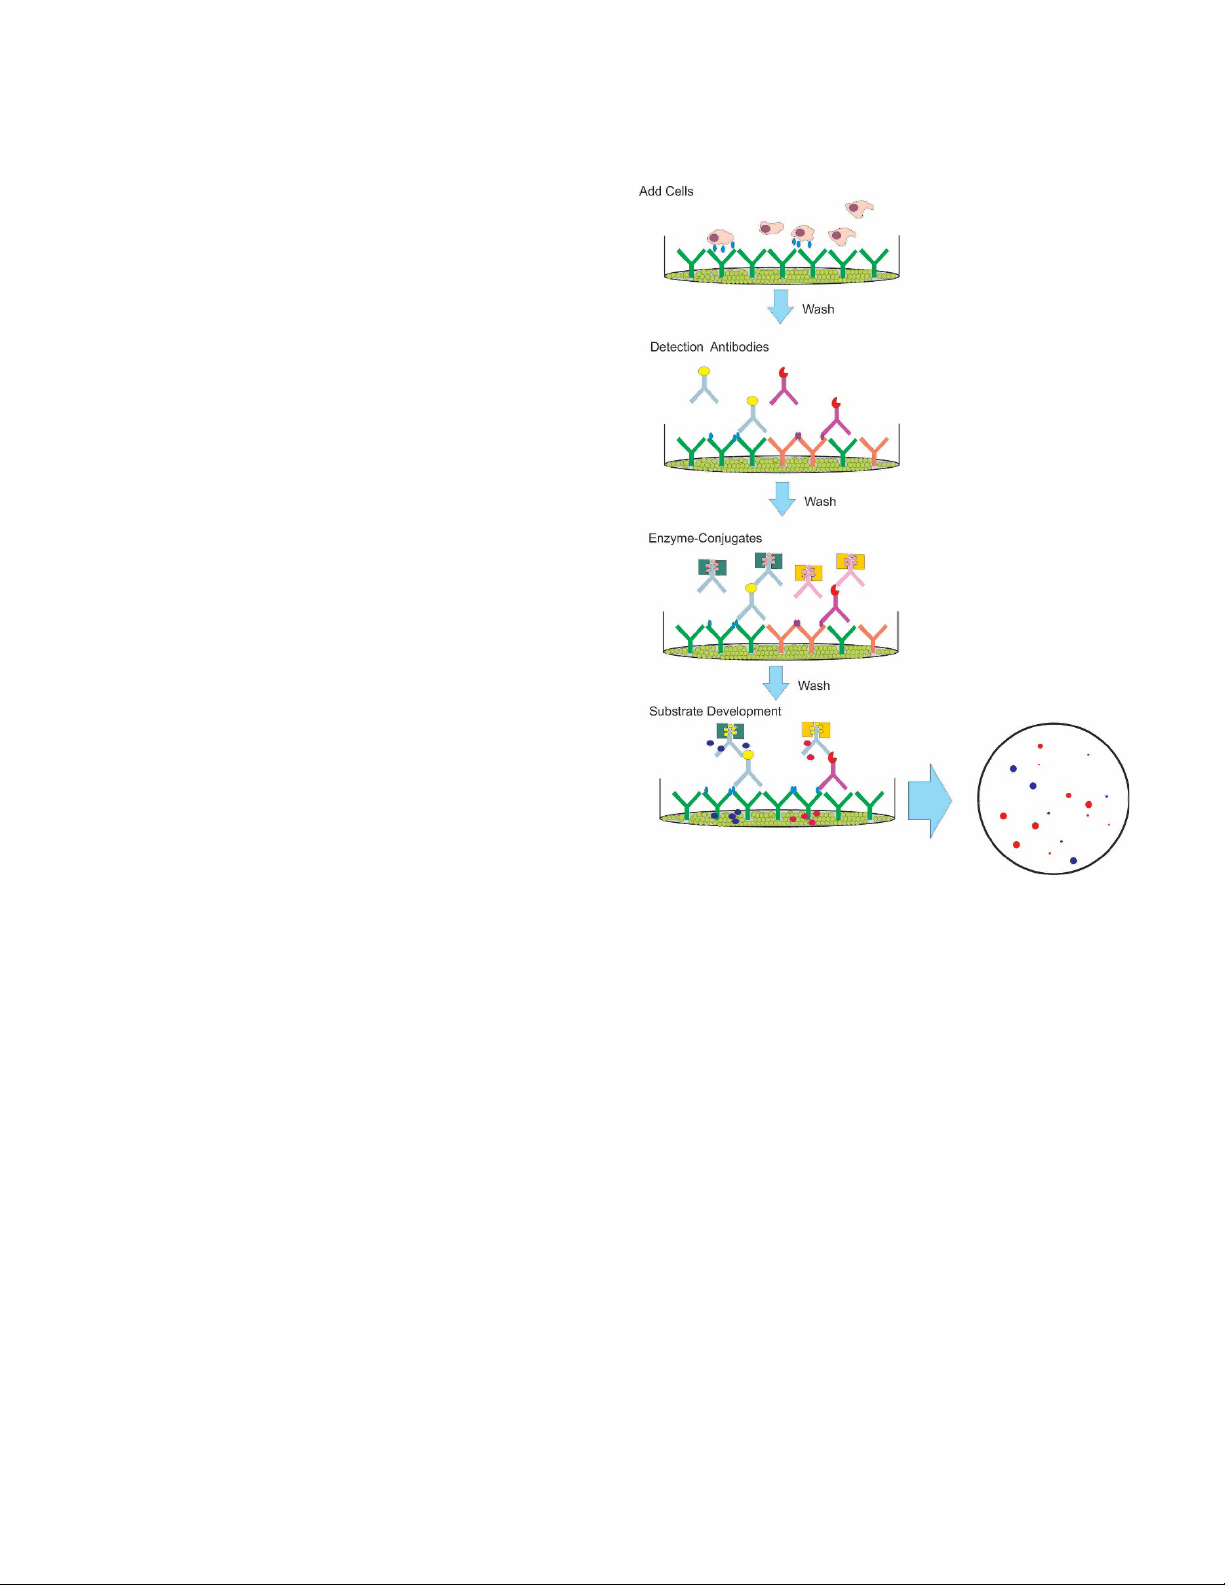
The ELISpot assay procedure is very similar to that of a
conventional ELISA. The plates are first coated with the
appropriate capture antibody. Cultured secreting cells are
added to the wells along with any interested experimental
mitogen or antigen. Cells are maintained for a period of time
after which they are removed. The secreted analyte remains
bound to the capture antibodies in close proximity to the
location on the plate where the cell that produced the analyte
was situated. After removal of the cells and any unbound
materials, a detection antibody (usually biotinylated) is added
followed by an enzyme conjugate with an incubation to allow
binding and a wash to remove unbound materials after each
step. As the substrate is converted by the conjugate enzyme
to colored compounds, spots on the plate membrane bottom
at the locations of the original analyte capture are formed.
The resultant spots are then analyzed/counted using image
analysis. (Figure 3).
Figure 3. ELISpot stain procedure.
3
Page 4

Experimental
Materials and methods
Human IL-2 ELISpot colorimetric kit was obtained from
U-CyTech biosciences (Utrecht, The Netherlands) and a
two color human IFN-γ/IL-2 ELISpot kit was from Cellular
Technology Limited (Cleveland, OH). Phorbol 12-myristate
(PMA), and triptolide (part number T3652) were purchased
from Millipore-Sigma. Ionomycin (part number 407952) was
from EMD-Millipore. Human PBMCs were obtained from
Astarte Biologicals (Bothell, WA). White PVDP membrane
96-well (part number MSIP4W10) were from Millipore-Sigma.
Cell culture: Purified human PBMCs were received and
maintained frozen until needed. After rapid thawing cells
were immediately diluted 1:10 in RPMI-1640 plus 10%
FBS supplemented with 2 mM glutamine, penicillin and
streptomycin. Cells were centrifuged at 300 g for 10 minutes
and the supernatant removed. Cells were resuspended in 10
mL of fresh RPMI media, counted and diluted as needed to
provide a density of 5 × 10⁴ cells/well.
Plate coating: Either a human IL-2 ELISpot kit from U-CyTech
Biosciences or a 2-color human INF-γ/IL-2 kit from CTL were
used for these experiments. PVDF membrane plates are first
coated with the appropriate concentration of capture antibody
(anti-IL-2 or anti-FTN-γ) and allowed to absorb overnight
at 4 °C. The unbound antibody is aspirated and the plate is
manually washed 3x with PBS. The wells are then filled with
a blocking solution (200 µL) and allowed to incubate for at
least 1 hour at room temperature. Blocking buffer is aspirated
without washing immediately before the addition of cells.
Cell seeding: Unless otherwise indicated, cells were plated in
96-well membrane plates previously coated with antibody at
a density of 5 × 10⁴/well. PBMCs were stimulated to secrete
IL-2 with a PMA (50 ng/mL), ionomycin (1 µg/mL) mixture.
Typical experiments used a volume of 100 µL for cells
followed by the addition of 100 µL of stimulant mixture at a
2xconcentration.
Triptolide inhibition: PBMCs were plated at 5 × 10⁴/well
in 50 µL volume of complete RPMI media. After allowing
cells to recover for 1 hour at 37 °C, in a humidified 5% CO2
environment, triptolide treatment was added in complete
RPMI media at 4x of final concentration to each well in 50 µL.
IL-2 stimuli mixture (2x) was then added in 100 µL for a final
volume of 200 µL.
One-color ELISpot assay: The assays were performed
according to the U-Cytech BioSciences kit instructions.
After seeding, cells were incubated for 24 hours, at 37°C in
a humidified 5% CO2 environment plates and then assayed
using an ELISpot kit. Briefly, cells were removed by washing
5x with 250 µL PBS-Tween 0.05% using an Agilent BioTek
MultiFlo FX multimode dispenser. A biotinylated detection
antibody (100 µL) is added to the well and allowed to incubate
for 60 minutes at 37 °C or overnight at 5 °C, after which
unbound detection antibody was removed by washing. A
streptavidin-HRP conjugate was then added (100 µL) and
incubated at 37 °C for 60 minutes. Again, unbound conjugate
is removed by washing. Next a two-part AEC substrate was
added that deposits dye onto the well membrane bottom.
Reactions were halted after 30 minutes at RT by washing with
deionized water (250 µL) 3x using the MultiFlo FX and allowed
to dry in the dark. Entire wells were then imaged.
Two-color ELISpot development: The assays were performed
according to the C.T. L. Immunospot 2-color ELISpot kit
instructions. After seeding, cells were incubated for 24 hours,
at 37 °C in a humidified 5% CO2 environment plates were
then assayed using an ELISpot kit. Briefly, cells removed by
washing 5x with 250 µL PBS-Tween 0.05% using a MultiFlo
FX multimode dispenser. A detection antibody solution
(80µL/well) was added to the well and allowed to incubate
at room temperature (RT) for 120 minutes, after which
unbound detection antibody is removed by washing. Tertiary
solution (80 µL/well) was added and allowed to incubate
for 60minutes at RT. Unreacted reagents were removed by
washing 2x with PBS-Tween, followed by 2 washes with dH2O
and then allowed to air dry in the dark. Blue developer solution
was then added (80 µL/well) and incubated for 15minutes
at RT. Reaction was stopped by washing 3x with dH2O.
Red developer solution was then added (80 µL/well) and
incubated at RT for 7 minutes. Plate was the washed 3x with
dH2O. Plate is air dried in the dark for at least 2 hours prior
toimaging.
Plate washing: Plates were washed according to the assay
kit instructions using a MultiFlo FX. Wash buffer consisted of
PBS (NaCl 137 mM, KCl 2.7 mM, Na2HPO4 10 mM, KH2PO4 7.4
mM) supplemented with 0.05% Tween 20. Unless specifically
indicated, plates were washed five times with 250 µL buffer
per well.
4
Page 5

Plate imaging: Prepared microplates were imaged using
a Cytation cell imaging multimode reader configured with
an upright color camera. The imager uses a white LED light
source in conjunction with a color digital camera. A series
of images were taken with the 2x lens in order to image the
entire well in a single frame. Once the focal plane and camera
exposure were determined manually, images were captured
automatically using a fixed focal height routine using reflected
light in Gen5.
Table 1. Image capture and
preprocessing parameters.
Imaging
Parameter Value
Channel
Light Source
Objectives
Focus
Crop Image
Parameter Value
Image Set
Background
Background
Flattening
Upright camera
Reflected light
2x
Fixed focus
Yes
Preprocessing
Red + green + blue
Light
Rolling ball: 470 μm
136 pixels
Priority: fast speed
Image smoothing: 0
Analysis
Table 2. Image analysis parameters.
Object Selection
Parameter Value
Channel
Threshold
Advanced Options
Object Size Selection
Parameter Value
Cell Count
Parameter Value
Channel
Red-Blue Ratio Custom Metric
Metric Name
M1
M2
Equation
Subpopulation Analysis
Subpopulation Metric Value
Red Spot
Blue Spot
Red and Blue Spot
TSF[Green]
Value: 7000
Background: Light
Split touching obj.: Yes
Fill holes in mask: Yes
Smoothing: 0
Background: 20
Min: 25
Max: 500
Include edge objects: Yes
Entire image: Yes
Object Analysis
Count
Calculated Metrics
Blue: Mean[TSF[Blue]]
Red: Mean[TSF[Red]]
Mean[TSF[Blue]]
Mean[TSF[Red]]
M1/M2
Blue-red ratio <0.85
Blue-red ratio >1.00
0.85> Red-blue ratio <1.00
5
Page 6

Results and discussion
Initial experiments demonstrate the specificity of the
ELISpot reaction. PBMCs that have been stimulated with a
combination of PMA/ionomycin produce numerous spots,
while unstimulated cells produce few if any. Treatment alone
without PBMCs does not produce any spots.
Figure 4. Specificity of IL-2 ELISpot reaction. Images of ELISpot wells
containing PBMCs treated with or without PMA (1 ng/mL), Ionomycin
(1µg/mL). Negative control that lacks cells, but received stimulant.
Correct sizing of the identified objects is necessary for
accurate determinations. The intent of the ELISpot assay
is to identify and quantitate the number of cells responding
to specific stimuli. The antibody-coated plate captures its
specific target rather than the actual secretory cell. While
most of the secreted analyte will be captured in the area
immediately surrounding the position of the cell, some of the
analyte will diffuse into the media and be captured elsewhere.
The high concentration of analyte near the cell will result in a
spot as large, or larger, than the physical size of the cell, while
dispersed analyte will result in very small intense deposits.
Figure 5 demonstrates the number of spots present in a
typical ELISpot well. Only those spots exceeding 25 µm in size
are designated as true spots.
The number of recorded spots produced from stimulated
cells is proportional to the number of secreting cells. When
a titration of PBMCs are exposed to a fixed concentration
of stimulant the number of counted spots is proportional to
the cell number. As demonstrated in Figure 6, increasing cell
number in a well results in an increase in spots counted. Cell
counts above 50,000 per well resulted in the spots coalescing
together. Subsequent experiments used 5,000 cells per well.
Figure 6. Cell titration. PBMC were seeded at various concentration into
an ELISpot plate and stimulated with 50 ng/mL PMA, 1 µg/mL ionomycin
for 24 hours. The ELISpot plate was then assayed for IL-2 secretion. Data
points represent the mean of 8 determinations.
Stimulation of IL-2 secretion by a mixture of PMA and
ionomycin is dose dependent. As observed in Figure 7,
increasing concentration of PMA produces more spots.
Figure 5. Scatterplot of object size vs red density. All spots achieving a
green threshold of 7000 greater than were plotted against their designation
number. The size threshold of 25 µm is indicated with a blue vertical line.
6
Page 7

Figure 7. Titration of PMA stimulate. PBMCs (5000 cells/well) were
stimulated with various dilutions of PMA and 1µg/mL Ionomycin for 24
hours in an ELISpot plate coated with IL-2 antibody. After stimulation IL-2
secretion was assessed and spots counted. Data points represent the
mean of 7 determinations.
Figure 8. Inhibition of IL-2 secretion by triptolide. PBMCs (5000 cells/
well) were pre -incubated for 60 minutes with various concentrations of
triptolide were stimulated with 6 ng/mL PMA, 1 µg/mL Ionomycin, to
secrete IL-2. After 24-hours ELISpot plate was assayed for IL-2 secretion.
Data represents the mean of 7data points.
Pretreating PBMCs with triptolide for 1 hour prior to
stimulation reduces IL-2 secretion in a dose-dependent
manner. Increasing concentrations of triptolide result in
fewer spots indicative of an IL-2 secreting cell (Figure 8).
In these experiments, a stimulatory dose that was 80% of
maximal was employed. The IC50 under these conditions
was determined to be 40 nM, which is similar to reports in
theliterature.
8
Multiplex ELISpot assays are available to quantitate a number
of different analytes simultaneously. While there are several
fluorescence-based assays that provide information for up
to 4 analytes in a single well, colorimetric ELISpot assays
are limited to two analytes per well. Initial experiments
using a two-color ELISpot specific to human IL-2 and IFN-γ
demonstrated the specificity of the assay to specifically
identify IL-2 or IFN-γ secreting cells. In this assay, cells
secreting IL-2 can be visualized by the formation of blue
spots, while those secreting IFN-γ form red spots. As
observed in the control experiment (Figure 9), wells coated
with anti-IL-2 antibodies only form blue spots, while wells
coated with only anti-IFN-γ antibodies only form red spots.
Wells receiving both coating antibodies formed both red and
blue spots, while cells lacking PBMCs or PMA stimulation
failed to form any spots.
Figure 9. Specificity of two-analyte ELISpot detection. Images of ELISpot
wells that have PBMC that have been treated with or without PMA (10
ng/mL). Well membranes were coated with both IL-2 and IFN-γ specific
antibodies and color developed for either IL-2 or IFN-γ or both. Negative
control that lacks cells, but received stimulant.
7
Page 8

Discrimination between red and blue colored spots can be
achieved using the differences in red and blue densities of
the spots. The histogram plots in Figure 10 demonstrate
differences in the calculated red/blue density ratio between
red only and blue only control wells. The mean of the red/blue
ratio plus two times its standard deviation can be used as
the upper limit for red-only spots. Likewise, the mean minus
two standard deviations of the blue spot controls defines the
lower limit of the red/blue ratio for blue spots. Spots with ratio
values between these two thresholds are considered to be
both blue and red.
These threshold values can be used to quantitate single color
reactions where only IL-2 or IFN-γ reactions are developed. As
shown in Figure 11, both IL-2 and IFN-γ cytokines are secreted
when PBMCs are stimulated with PMA. The stimulation
occurs in a concentration dependent fashion with the EC50
values being very similar (EC50=0.05 ng/mL). Interestingly,
twice as many PBMCs, as measured by the spot count, are
likely to secrete IFN-γ as compared to IL-2.
Figure 10. Frequency histogram analysis of red/blue ELISpot intensity ratio
values. The frequency of red/blue ratio values from 8 red only and blue only
control wells. The mean and the mean plus or minus 2times the standard
deviation of the population are indicated.
Figure 11. Comparison of IL-2 and IFN-γ secretion by PBMCs after
stimulation with PMA. PBMCs were stimulated with PMA in a PVDF
membrane ELISpot plate coated with both IL-2 and IFN-γ capture antibodies.
After 24 hours plates were processed and colors were developed in parallel
wells. Spots (red and blue) were quantitated and plotted as a function of
PMA concentration. Data represents the mean and standard deviation of
duplicatewells.
8
Page 9

Multiplex, 2-color analysis in the same well can be performed
when both colors are developed using the same criteria. A
frequency histogram of the data from several separate wells
where both colors were developed in the wells is depicted
in Figure 12. When the images are examined by eye, most
wells have spots that are visibly either red or blue, with a
smaller percentage that appear appear as a mixture. These
observations are corroborated by the frequency histogram
depicted in Figure 12 that demonstrates that the identified
spots have a spectrum of red/blue ratio values. There are two
obvious peaks based on the red/blue ratio that correspond
to the red and blue spots observed when only one color
has been developed. Between their respective cutoff values
is a significant number of spots that have an intermediate
red/blue ratio.
These visibly correspond to spots that appear purple (i.e.
a mixture of red and blue). The relative number of spots
identified as red or blue is similar to the numbers identified
when a single color was developed. When one analyzes the
data with a scatter plot that compared the red/blue ratio
to spot size, two loose clusters of spots that correspond
to red or blue spots are observed along with a number
of intermediate ratio spots (Figure 13). While all three
subpopulations of spots have the same range in size, red
spots tend to be more numerous and smaller in size than
spots identified as blue.
Figure 12. Frequency histogram of ELISpot red/blue ratio values. The red/
blue ratio of ELISpot spots from 8 wells of a two-color ELISpot assay plate
were plotted as a function of frequency. Subpopulations analysis based on
cut off values for red, blue or red and blue spots are indicated by color.
Figure 13. Scatter plot of ELISpot red/blue ratio values. The red/blue ratio
of ELISpot spots from 8 wells of a two- color ELISpot assay plate were
plotted as a function of size. Subpopulations analysis based on cut off
values for red, blue or red and blue spots are indicated.
9
Page 10

This multiplex analysis can be used on individual wells with
different experimental conditions. Figure 14 demonstrates
the response of PBMCs to PMA stimulation where both blue
(IL-2) and red (IFN-γ) colors are developed in the same well.
As with separate color development, PMA stimulated cytokine
secretion on PBMCs in a concentration dependent manner.
Also, more PBMCs secreted IFN-γ than IL-2, with equivalent
EC50 values. If one compares the total number of cells that
secrete IFN-γ (red only spots plus red and blue spots) or the
total number of cells that secrete IL-2 (blue only spots plus
red and blue spots) the numbers are consistent with wells
where only one color was developed.
Figure 14. Comparison of IL-2 and IFN-γ secretion in stimulated PBMCs.
PBMCs were stimulated with various concentrations of PMA using a
PVDF membrane 96-well plate that was pre-coated with both anti-IL-2
and anti-IFN-γ antibodies. After ELISpot processing, the plate wells
were imaged and the images analyzed using Gen5. Subpopulation
analysis defined spots that were either red, blue or a mix of red and
blue. The number of each spot subpopulation was plotted against PMA
concentration. Data represents the mean and standard deviation of
4determinations.
Results and discussion
These data demonstrate the utility of the Agilent BioTek
Cytation 7 cell imaging multimode reader in conjunction
with Agilent BioTek Gen5 microplate reader and imager
software to image and analyze colorimetric PVDF ELISpot
assay plates. The combination of a PMA/ionomycin has
been shown to markedly stimulate IL-2 secretion in PBMCs.
Without stimulation, IL-2 is virtually absent. The ability of
triptolide, a known transcription inhibitor, to prevent IL-2
secretion suggests that new protein synthesis is required
after stimulation.
ELISpot is a sensitive assay to monitor the ex vivo cellular
immune response at the single cell level by detecting secreted
proteins released by cells. This technique has been derived
from the sandwich enzymelinked immunosorbent assay
(ELISA) to accommodate the use of whole cells to identify the
frequency of the secreting cells. As such, there are a number
of critical parameters that need to be optimized in order for
experiments to be successful. Depending on the degree of
cellular secretion, developed spots can be quite large. The
expected number of positive cells is of greater importance
than the total number of cells used initially. The presence
of too many secreting cells results in the individual spots
coalescing making a numerical determination difficult. For
example, an investigation of a relatively rare secreting event
would require a greater number of cells to be seeded as
compared to a more common event. Timing of the response
relative to the stimulation and/or the inhibition is important.
Receptor mediated events often will take longer to elicit
a response than a stimulatory molecule that can interact
within the cell directly. It is important that appropriate interval
between stimulation and measurement be utilized. The
testing of inhibitors still requires a stimulating agent to be
present. In these experiments, it is important that a less than
maximal concentration of the stimulatory agent be used, lest
it mask any inhibitory affects.
11
10
Page 11

The Cytation 7 is an ideal platform to interpret colorimetric
PVDF membrane ELISpot assays. The imager supports
digital top-down color imaging with 2x, 4x and 8x microscope
objectives that are factory installed. The 2x objective can
capture the entire well in a single image, making it ideal for
96-well ELISpot determination. If desired, higher resolution
can be obtained by using a higher magnification objective
and a montage of the well. Using this camera both reflected
or transmitted light can be used for optimal imaging. While
this research only used the upright top-down camera with
PVDF membrane plates, the imager also supports bright field
imaging using an inverted camera for silver stain ELISpot
assays. In addition, the inverted microscope supports
fluorescence-based microscopy with LED and filter cubes.
Gen5 microplate reader and imager softrware, besides
controlling reader function, can be used to automatically
perform stitch of separate montage image tiles, perform
background subtraction and mask off regions outside the well
prior to analysis.
References
1. Delves, P. et al. Roitt's Essential Immunology, 11th Ed.
ISBN 978-1-4051-3603-7
2. Eds. Verhoeckx, K. Cotter, P. López-Expósito, I. Kleiveland,
C. Lea, T. Mackie, A. Requena, T. Swi-atecka, D. and
Wichers, H. (2105) The Impact of Food Bioactives on
Gut Health: In Vitro and Ex Vivo Models., European
Cooperation in the Field of Scientific and Technical
Research (Organization),. Cham. ISBN-13: 978-3-31915791-7ISBN-13: 978-3-319-16104-4.
3. Liao, W.; Lin, J. X.; Leonard, W. J. IL-2 Family Cytokines:
New Insights into the Complex Roles of IL-2 as a Broad
Regulator of T Helper Cell Differentiation. Current
Opinion in Immunology October 2011, 23(5), 598–604.
doi:10.1016/j.coi. 2011.08.003.
4. Carter, L. L.; Swain, S. L. Single Cell Analysis of Cytokine
Production, Curr. Opin. Immunol. 1997, 9(2), 177–182.
5. Schoenborn, J. R.; Wilson, C. B. Regulation
of Interferon‐γ During Innate and Adaptive Immune
Responses. Regulation of Interferon-Gamma During
Innate and Adaptive Immune Responses. Advances
in Immunology 2007, 96, 41–101. doi:10.1016/S00652776(07)96002-2. ISBN 978-0-12-373709-0. PMID
17981204.
6. Williams, M. A.; Bevan, M. J. Effector and Memory CTL
Differentiation. Annual Review of Immunology 2007, 25(1),
171–192. PMID 17129182.
doi:10.1146/annurev.immunol.25.022106.141548
7. Qiu, D. et al. Immunosuppressant PG490
(Triptolide) Inhibits T-cell Interleukin-2 Expression at the
Level of Purine-box/Nuclear Factor of Activated T-cells
and NF-kB Transcriptional Activation, J. Biol. Chem. 1999,
274(19), 13443–13450 PMID:10224109
8. Weiss, A.; Wiskocil, R. L.; Stobo, J. D. The Role of T3
Surface Receptors in the Activation of Human TCells:
a Two Stimulus Requirement for IL-2 Production
Reflects Events Occurring at a Pre-Translational Level,
J.Immunology 1984, 133, 123–128. PMID:6327821
9. Chen, L., Flies, D. B. Molecular Mechanisms of T Cell
Co-Stimulation and Co-Inhibition, Nat. Rev. Immunology
2013, 13(4), 227–242. doi: 10.1038/nri3405.
10. Manger, B., et al. Differential Effect of Cyclosporine A on
Activation Signaling in Human T Cell Lines. 1986
11. McCallum, C. et al. In Vitro Versus In Vivo Effects of
Triptolide: the Role of Transcriptional Inhibition, Therapy
2005, 2(2), 261–273 ISSN 2044-9038.
11
Page 12

www.agilent.com/lifesciences/biotek
For Research Use Only. Not for use in diagnostic procedures.
RA44169.1088888889
This information is subject to change without notice.
© Agilent Technologies, Inc. 2020, 2021
Printed in the USA, February 1, 2021
5994-2398EN
 Loading...